In February 1983, a blizzard buried Washington, Baltimore, and Philadelphia in up to two feet of snow. In January 2016, another historic blizzard shut down the same cities. Both events struck during Super El Niño winters, which most people expect to be mild.
Now an even stronger Super El Niño is building toward its December peak ahead of Winter 2026/2027. The latest October forecast data points to a milder northern U.S. and southern Canada, an active and stormy South, and a mild Europe. It also shows a notable shift toward a colder, snowier south-central and eastern U.S., and an unusual Polar Vortex disruption signal around mid-winter.
I will break down what shifted in the latest winter forecast data, how the season is expected to unfold, and which other major winter storms past Super El Niño winters delivered. You can also check the updated Winter Forecast Explorer for every state, province, and country across the United States, Canada, and Europe, with the latest temperature and precipitation forecasts.
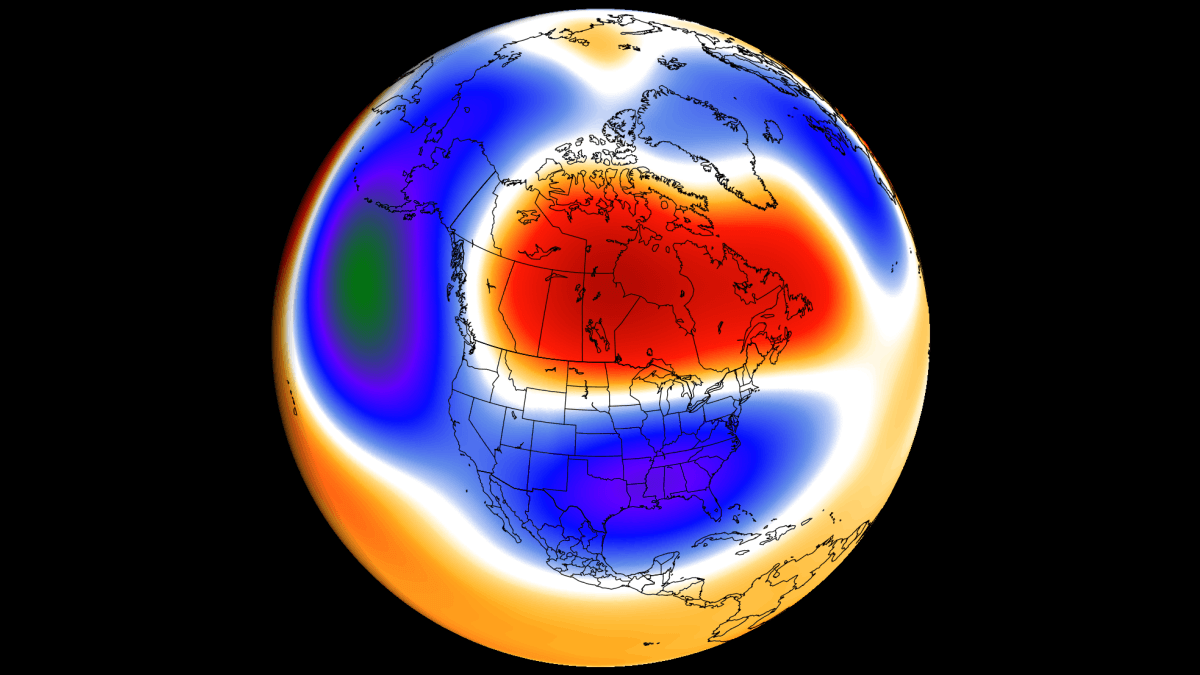
What Changed in the October Forecast: A Colder, Snowier Trend
To get straight to the point, we will first look at what is actually different in the latest seasonal forecast, or rather, where the trend is developing. Below, I have plotted the difference between the latest and previous forecast, showing the trend evolution in the latest data for the December to March period.
Looking at pressure anomalies, we can see that the latest forecast has really intensified the low-pressure zone over the United States and the high-pressure zone over Canada. As said, this is not the actual forecast anomaly, but just the change between the previous and latest forecast. And the trend is further shifting toward an amplified winter pattern over the United States.
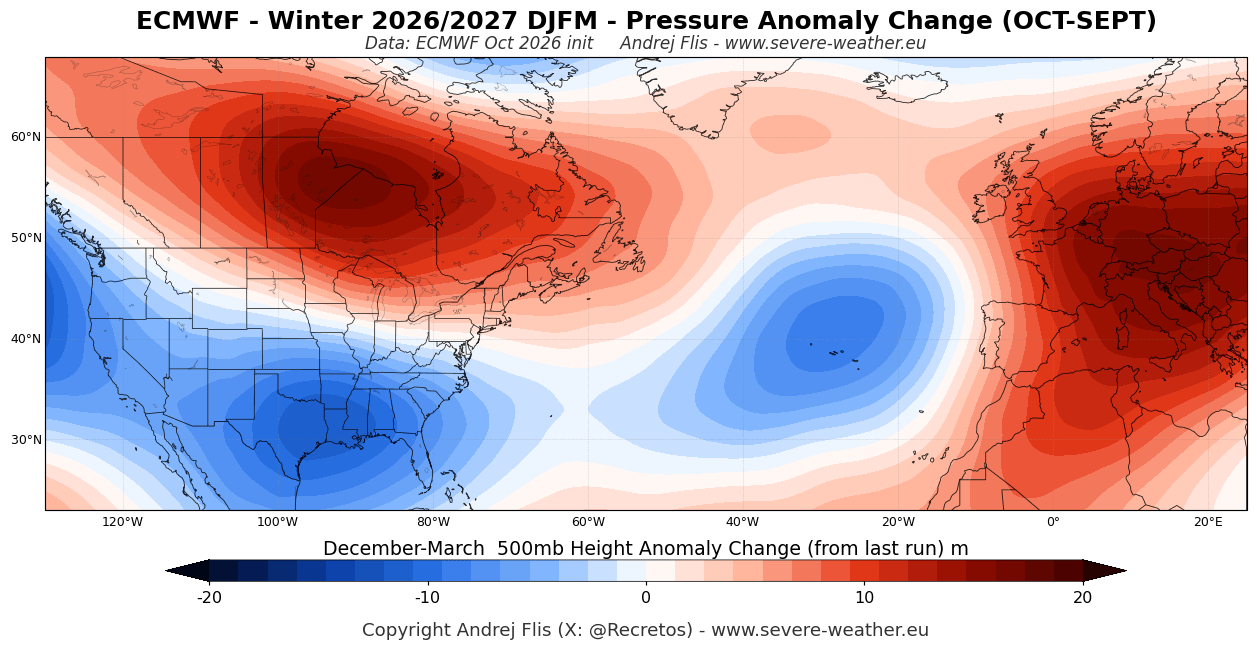
We can also see a further strengthening of the high-pressure anomaly over Europe, and a deeper low over the Atlantic. This is pushing towards a milder trend over the continent.
The temperature trend change directly reveals the major shift in the latest forecast, with a colder trend for the southern half of the United States. It also shows increasing winter dynamics for the U.S. in the latest forecast. A warmer anomaly trend continues for the far northern United States and southern Canada.
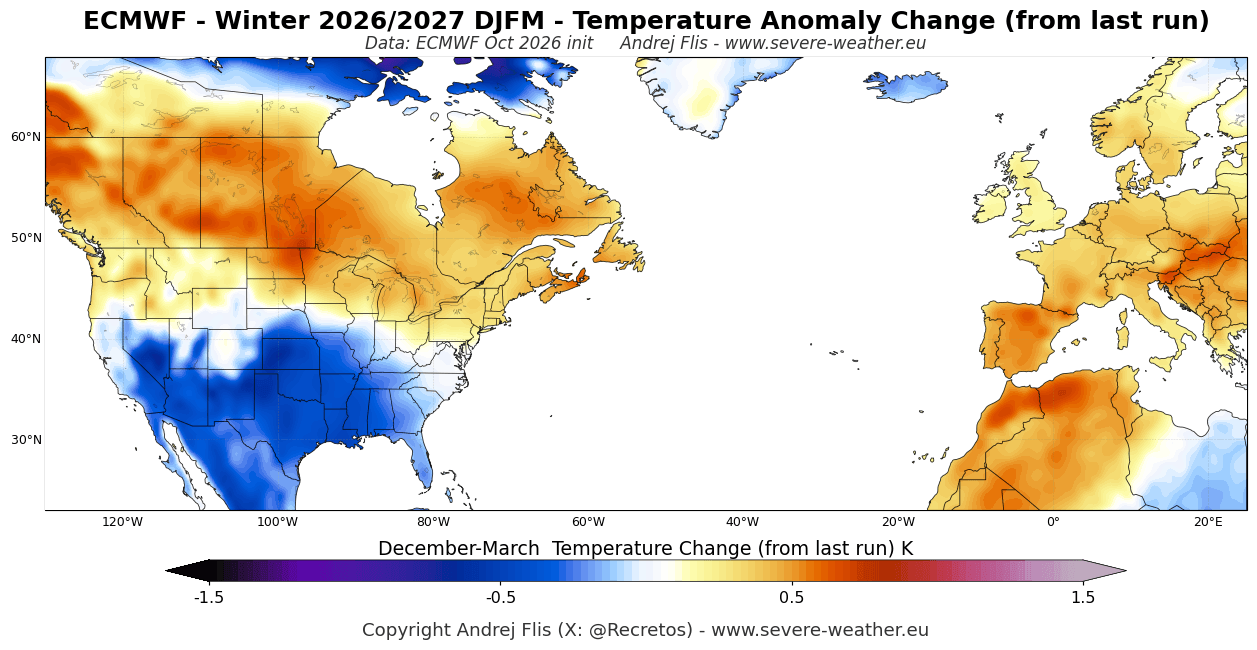
As expected, Europe shows warmer temperatures this run than the one last month, reflecting the high-pressure trend over the region.
A major shift in the latest forecast is also visible in snowfall, with more snow shown in the latest run across most of the United States and southeastern Canada. The latest data shows less snow only across the upper Midwest and southern Canada.
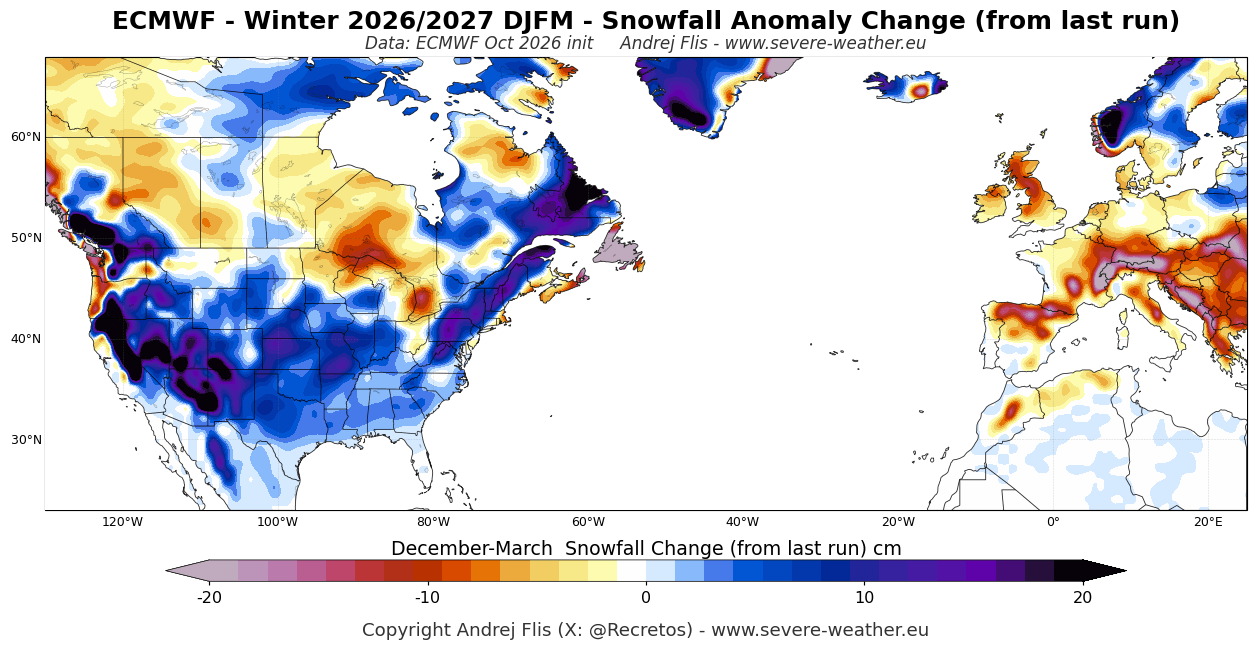
Consistent with a high-pressure trend, the latest forecast data shows reduced snowfall across much of Europe, except in the northern parts.
Overall, this forecast shift shows a strengthening Super El Niño signal, especially over the United States and Canada. We will quickly run over the Super El Niño state and its usual winter impacts before diving into the full temperature, precipitation, and snow forecasts for Winter 2026/2027.
Super El Niño 2026/2027: On Track for a 75-Year Record
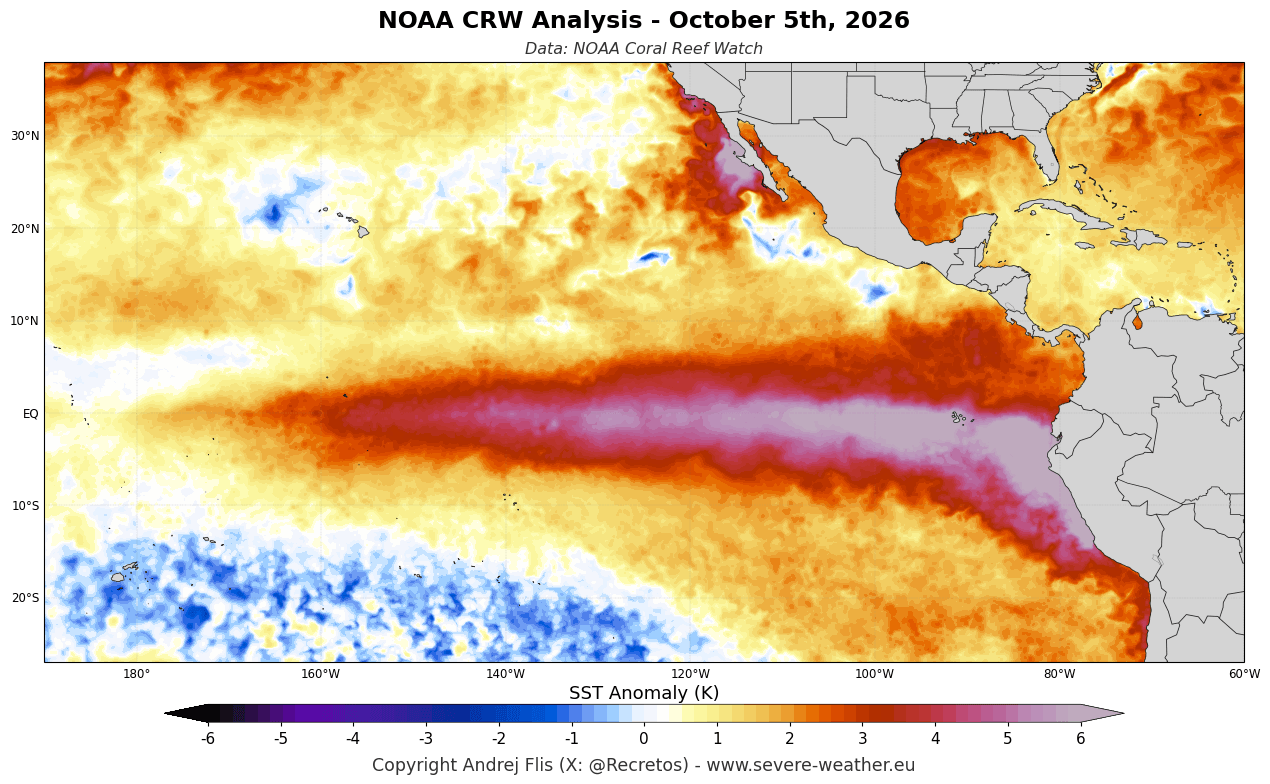
Below is my latest El Niño analysis, based on NOAA-CRW data. The latest data below shows the ENSO area covered in very strong anomalies that peak well over 6°C (11°F) above normal in the eastern parts. This is a significant anomaly, with very rapid El Niño growth. Actual peak strength is usually reached around December.
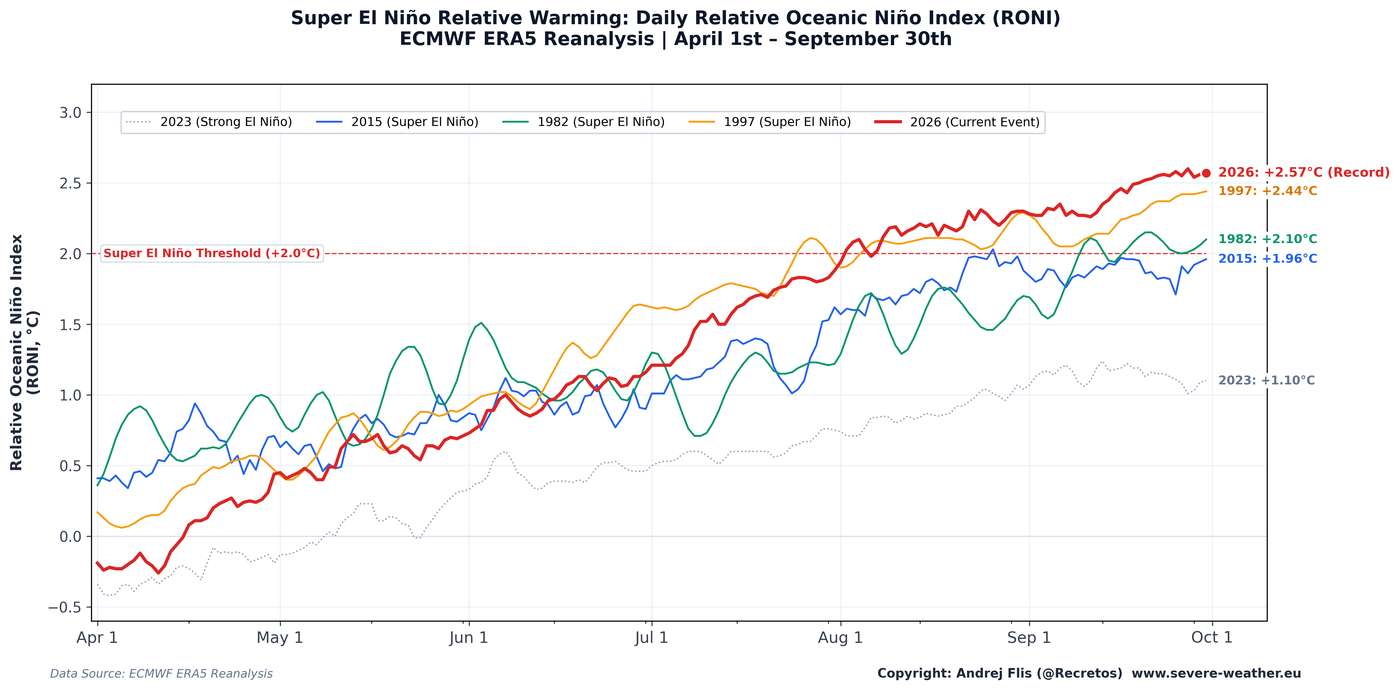
The latest analysis graph below shows a rapid growth trend, evident from early spring. You can also see the comparison versus past Super El Niño events. Right away, we can see how much stronger the 2026 Super El Niño is at this stage, running ahead of all Super El Niño events in recent decades.
Below is another comparison I produced using the latest ECMWF forecast. Here you can see the current progress (black) and the latest forecast (red), compared with the last four Super El Niño events and all El Niño events in the past 70+ years. The 2026/2027 event is forecast to be the strongest in over 75 years, peaking higher than any El Niño event since at least 1950.
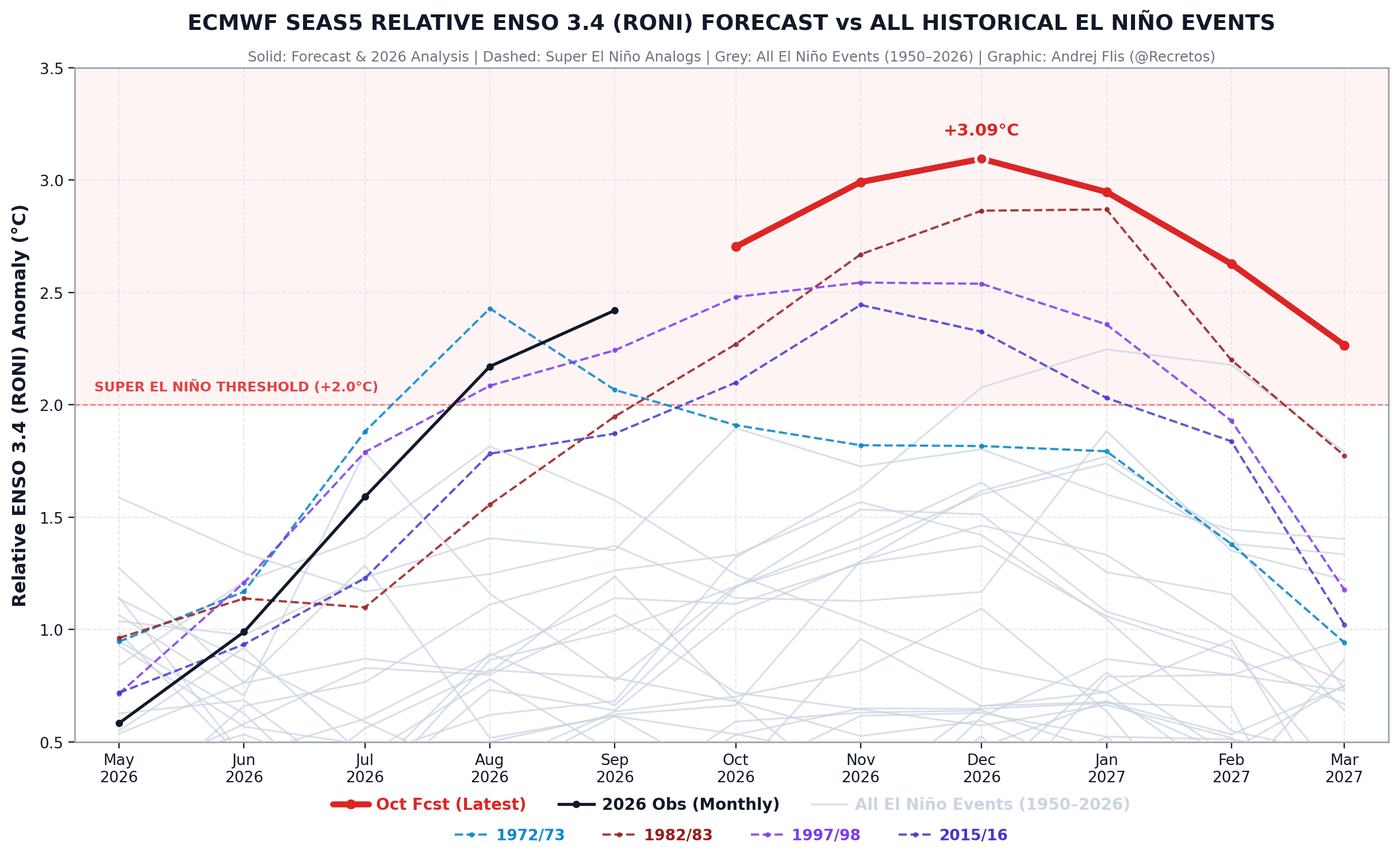
For this plot, I used ERA5 data and calculated the Relative Oceanic Niño Index (RONI). This is a normalized scale used by NOAA and recognized by WMO, which makes El Niño events directly comparable across decades.
The World Meteorological Organization (WMO) also expects El Niño to reach very strong intensity and peak toward the end of the year, with a nearly 100% chance it persists through winter.
I also looked at past Super El Niño winters to get a sense of what winter weather impacts we can expect from such a powerful event. As you will see, this matches the pattern in the changes plot above, indicating a Super El Niño signal push in the latest forecast data.
How Past Strong El Niño Winters Played Out
Below is the winter pressure analysis of the last four Super El Niño winters. We can see a strong atmospheric wave forced by the Super El Niño event. The main signature pattern is the deep, intense low-pressure anomaly over the North Pacific, reflecting an expanded Aleutian Low.
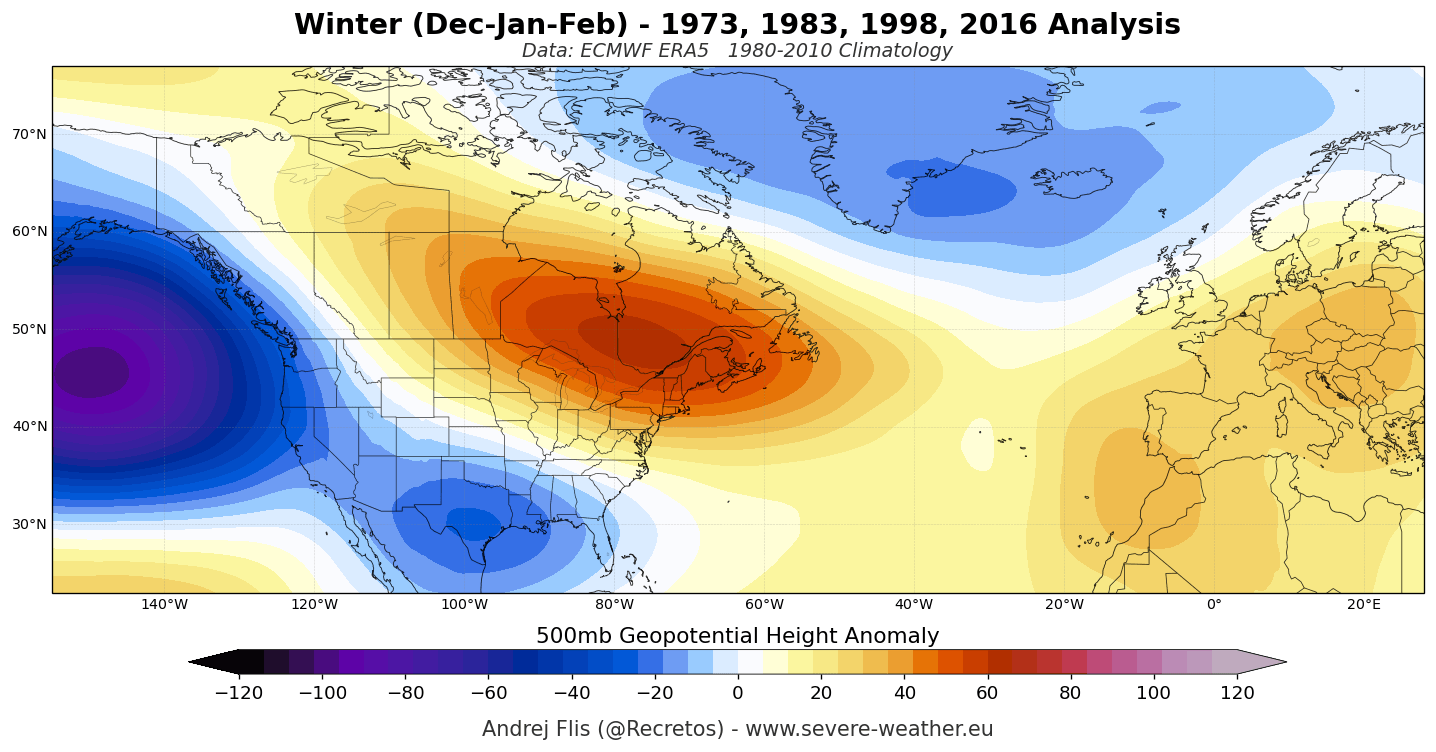
Such a deep low forces a massive high-pressure zone over Canada, the northern U.S., and the Great Lakes. This keeps the coldest air deflected away from the northern parts with an active storm track across the southern United States. Downstream, this favors lower pressure over the North Atlantic and a milder westerly flow across most of mainland Europe.
The next analysis below shows average winter (December–February) temperature anomalies during the same past Super El Niño events. It clearly highlights the sharp contrast between the warmer air mass under the high-pressure zone in Canada and the northern U.S., and the cooler air under the low-pressure highway to the south.
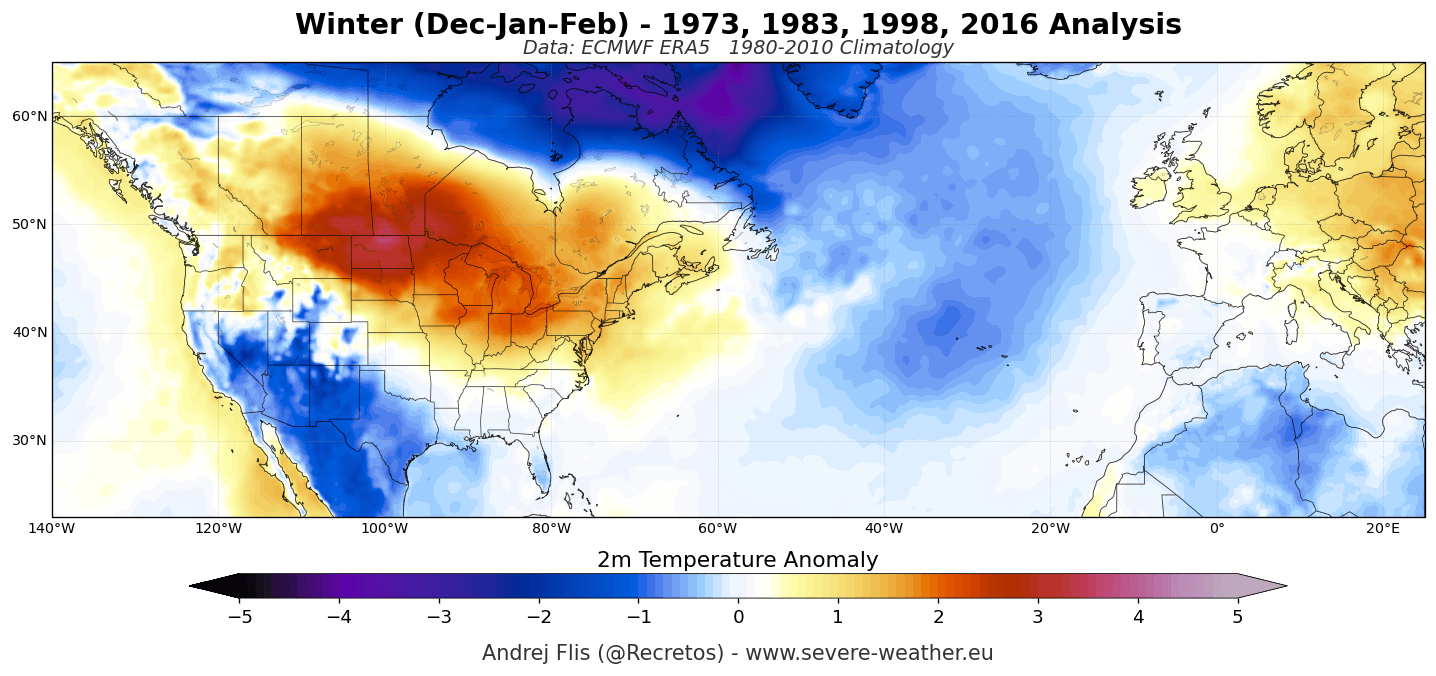
Over the Northern Plains, the Upper Midwest, the Great Lakes, and southern Canada, temperatures are above normal. But the active storm track keeps temperatures cooler across the southern United States because of persistent cloud cover and precipitation.
Over Europe, the dominant westerly flow drives above-average temperatures across most of the continent. But the main (direct) impacts are mostly found in North America. And as past data shows, a Super El Niño can bring really strong winter weather.
Blizzards, Ice Storms and Snow: What Can a Super El Niño Really Deliver?
With a record El Niño forecast for Winter 2026/2027, I looked at severe winter weather events during past such events. I focused on a few United States winter events, where we see a more direct Super El Niño influence, unlike Europe, which also has other nearby dynamical impacts.
The Great Southeastern Snowstorm (Super El Niño 1972/1973)
In February 1973, a strengthening Gulf low brought one of the greatest snowstorms in Southeast U.S. history. Rimini, South Carolina, measured 24 inches of snow, and Macon, Georgia, around 16.5 inches. Accumulating snow reached as far south as Savannah, Valdosta, and even Tallahassee, Florida. Drifts of up to 8 feet closed nearly every road in central South Carolina for two to four days.
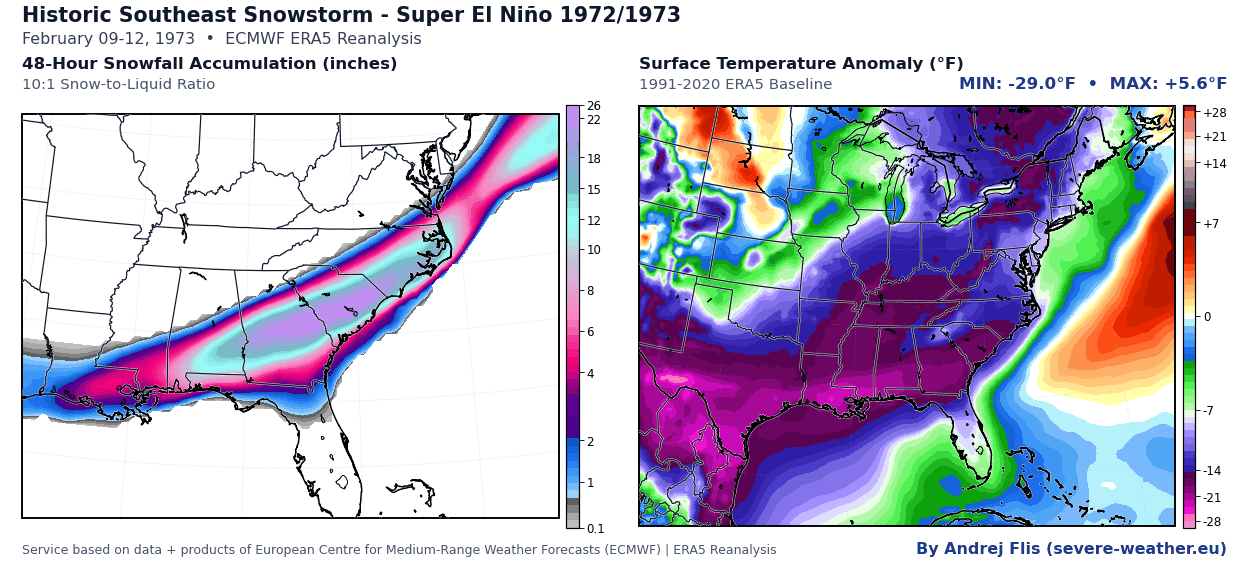
In the image above, you can see the snowfall totals and temperature anomaly during the event. I generated all the analysis images in this section from high-resolution ECMWF ERA-5 Reanalysis data for a better visual representation of the events.
The Megalopolitan Blizzard (Super El Niño 1982/1983)
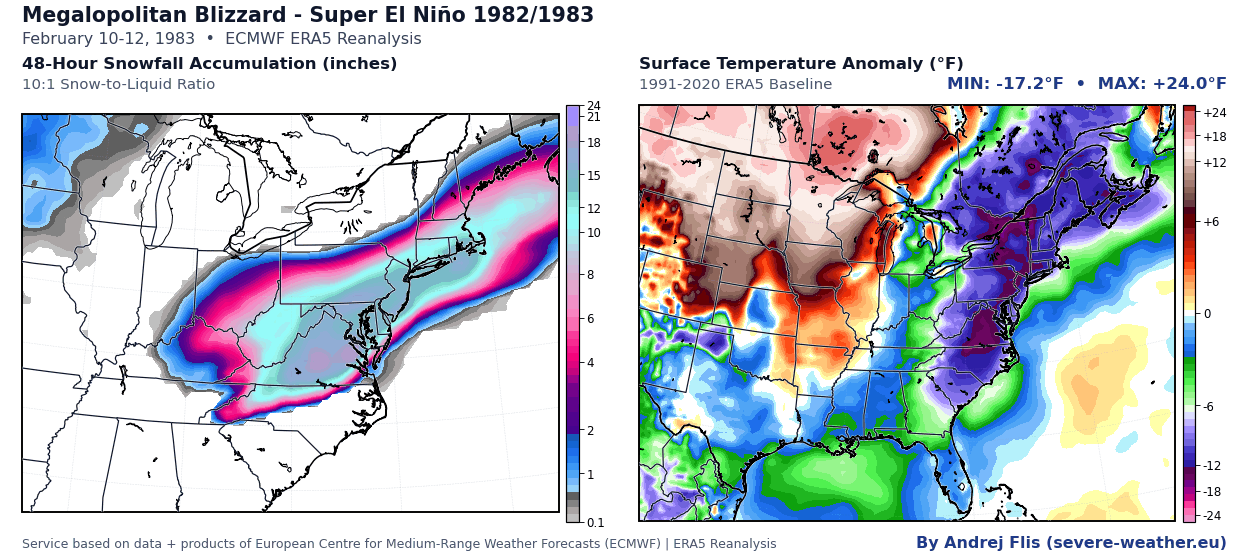
A powerful nor’easter crippled the I-95 corridor from Washington to Boston with heavy snowfall (2-5 inches/hour) in February 1983. Baltimore measured over 22 inches of snow, and Philadelphia measured over 21 inches, both setting record 24h snowfall totals at the time. Widespread totals of 15 to 25 inches covered the major metropolitan areas from D.C. through New York City and into southern New England, shutting down most travel routes for days.
The Great Ice Storm (Super El Niño 1997/1998)
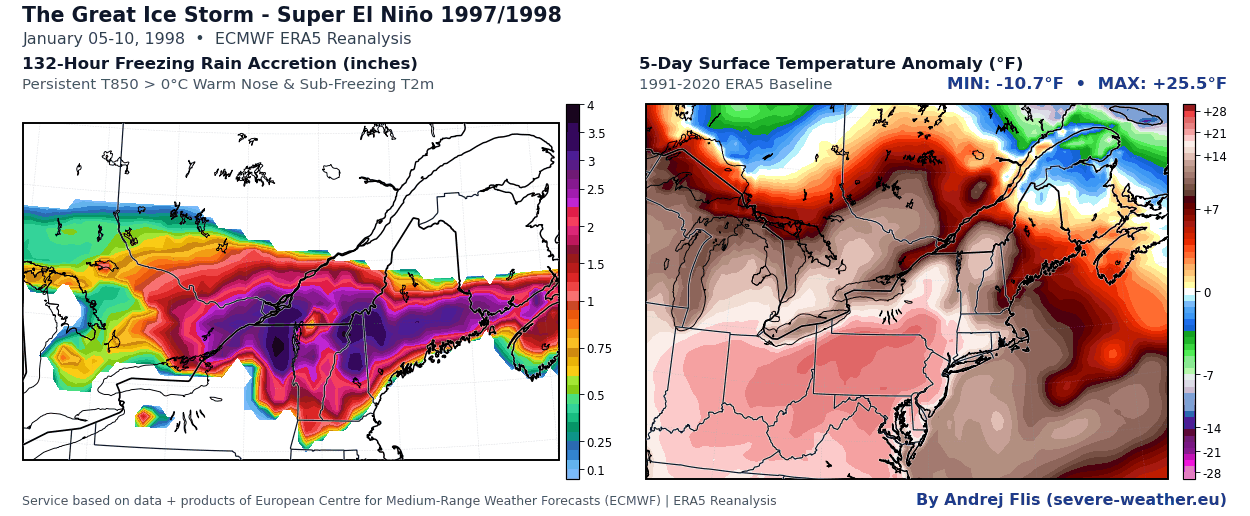
January 1998 brought a strong ice storm, coating upstate New York, Vermont, New Hampshire, and Maine in thick ice. In Maine, around 80% of the population lost power, and some outages lasted over 20 days. Federal disasters were declared across northern New York and Vermont, 9 of 10 New Hampshire counties (sparing coastal Rockingham), and all 16 counties of Maine. Millions also lost power in Ontario and Quebec.
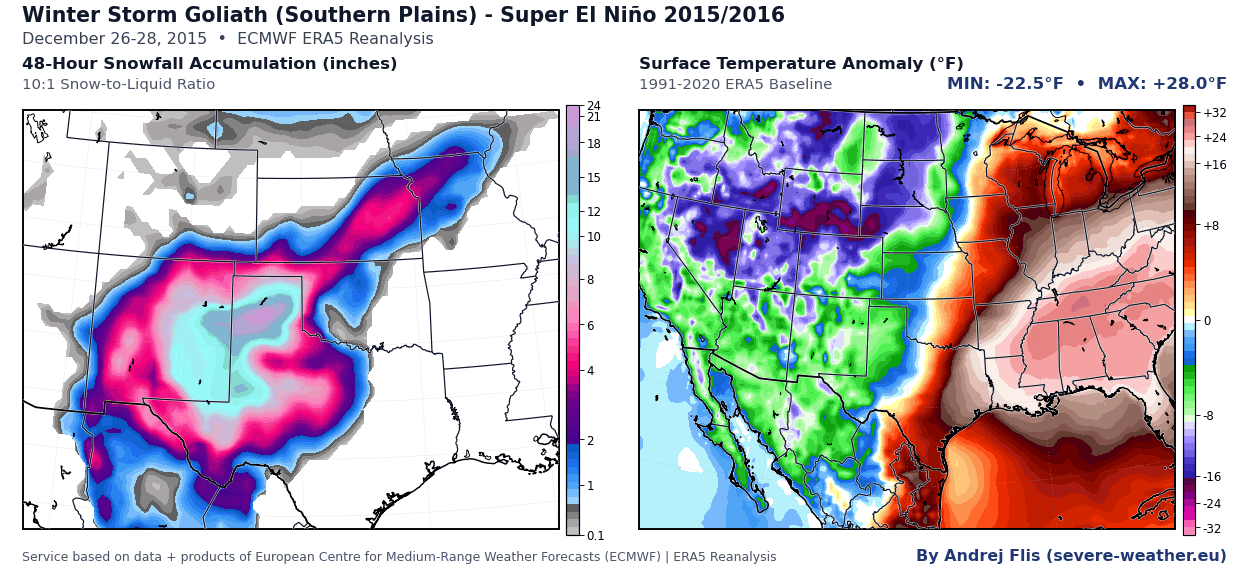
Christmas Weekend Blizzard (Super El Niño 2015/2016)
Just after Christmas 2015, the southern storm track produced a severe blizzard across New Mexico, Texas, and Oklahoma. Eastern New Mexico recorded 2 to 3 feet of snow, with drifts of 8 to 10 feet, closing Interstate 40. Lubbock saw over 10 inches of snow, making it the city’s worst snowstorm since January 1983 (one of the previous Super El Niños).
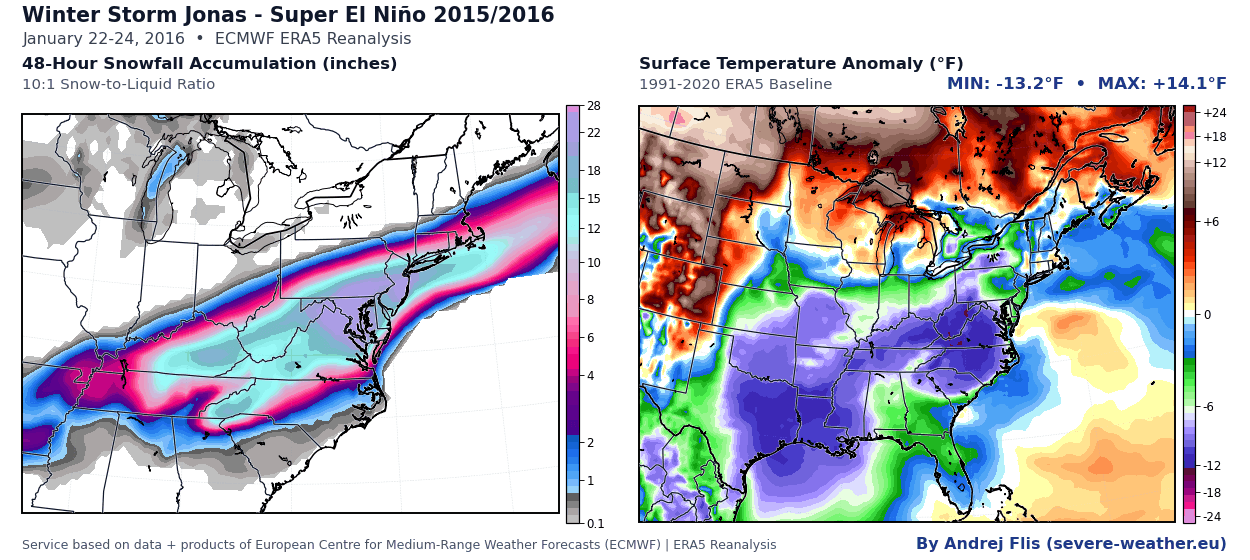
The Historic Nor’easter (Super El Niño 2015/2016)
In January 2016, a historic nor’easter buried the East Coast in heavy snowfall. Central Park measured over 27 inches, setting its all-time storm record, while Baltimore set its own single-storm record at over 29 inches. In total, over 100 million people were affected, and nearly 24 million saw more than 20 inches of snowfall. This was also the last Super El Niño event until now.
While such events are not guaranteed in each Super El Niño, they usually bring strong weather dynamics. And a proper shift in the jet stream or a pressure system interaction can cause a winter outbreak downstream, especially in a record-strong El Niño event like this year.
Winter 2026/2027 Forecast: Pressure, Temperature and Precipitation
For this forecast article, I decided to use the latest ECMWF model run (October data), which was just released. This system is often regarded as the most reliable for handling these global processes, and performs really well also in my own experience.
Most forecast maps below cover the meteorological winter months (December, January, and February). But the change maps above, and the monthly breakdown in the Winter Explorer, also include March to show the full season into early spring.
Below is the latest ECMWF pressure anomaly forecast, released this month, and it looks quite remarkable. This is the forecast for the December-March period, and it shows a strong Super El Niño forcing, just like in the image for past events above. The main features are a low-pressure zone in the North Pacific and a blocking high-pressure area over Canada.
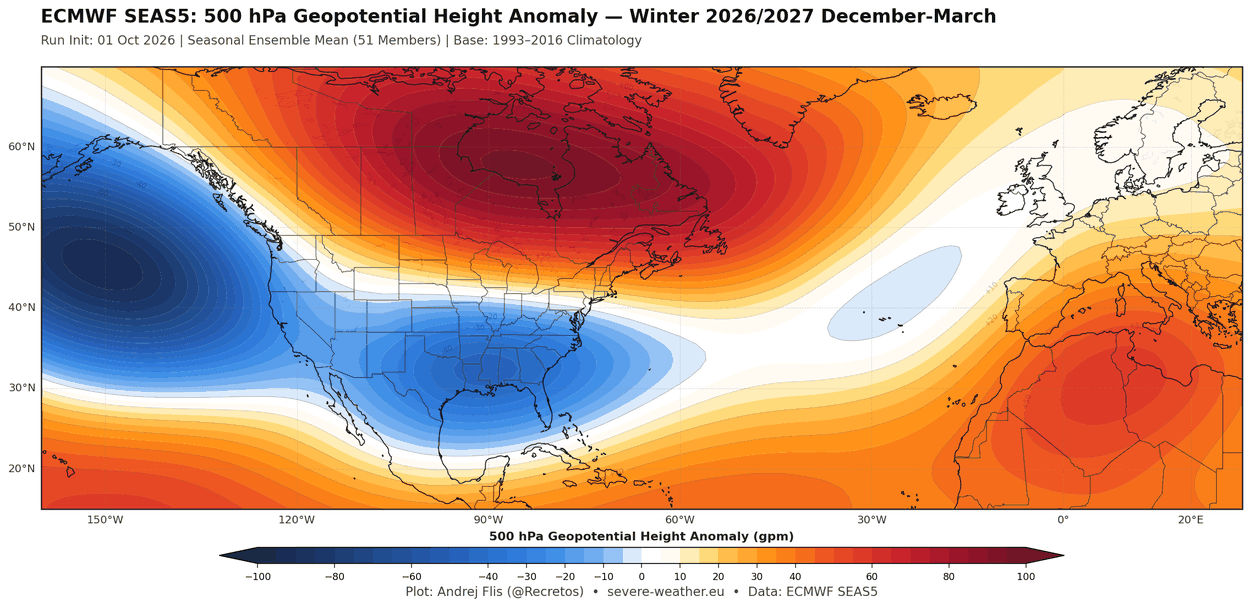
The forecast shows an amplified low-pressure pattern across the southern and eastern United States. This is driven by a strong Pacific jet stream, the signature of a Super El Niño winter. The low-pressure zone continues into the Atlantic and over northern Europe, with a ridge over the central and southern areas.
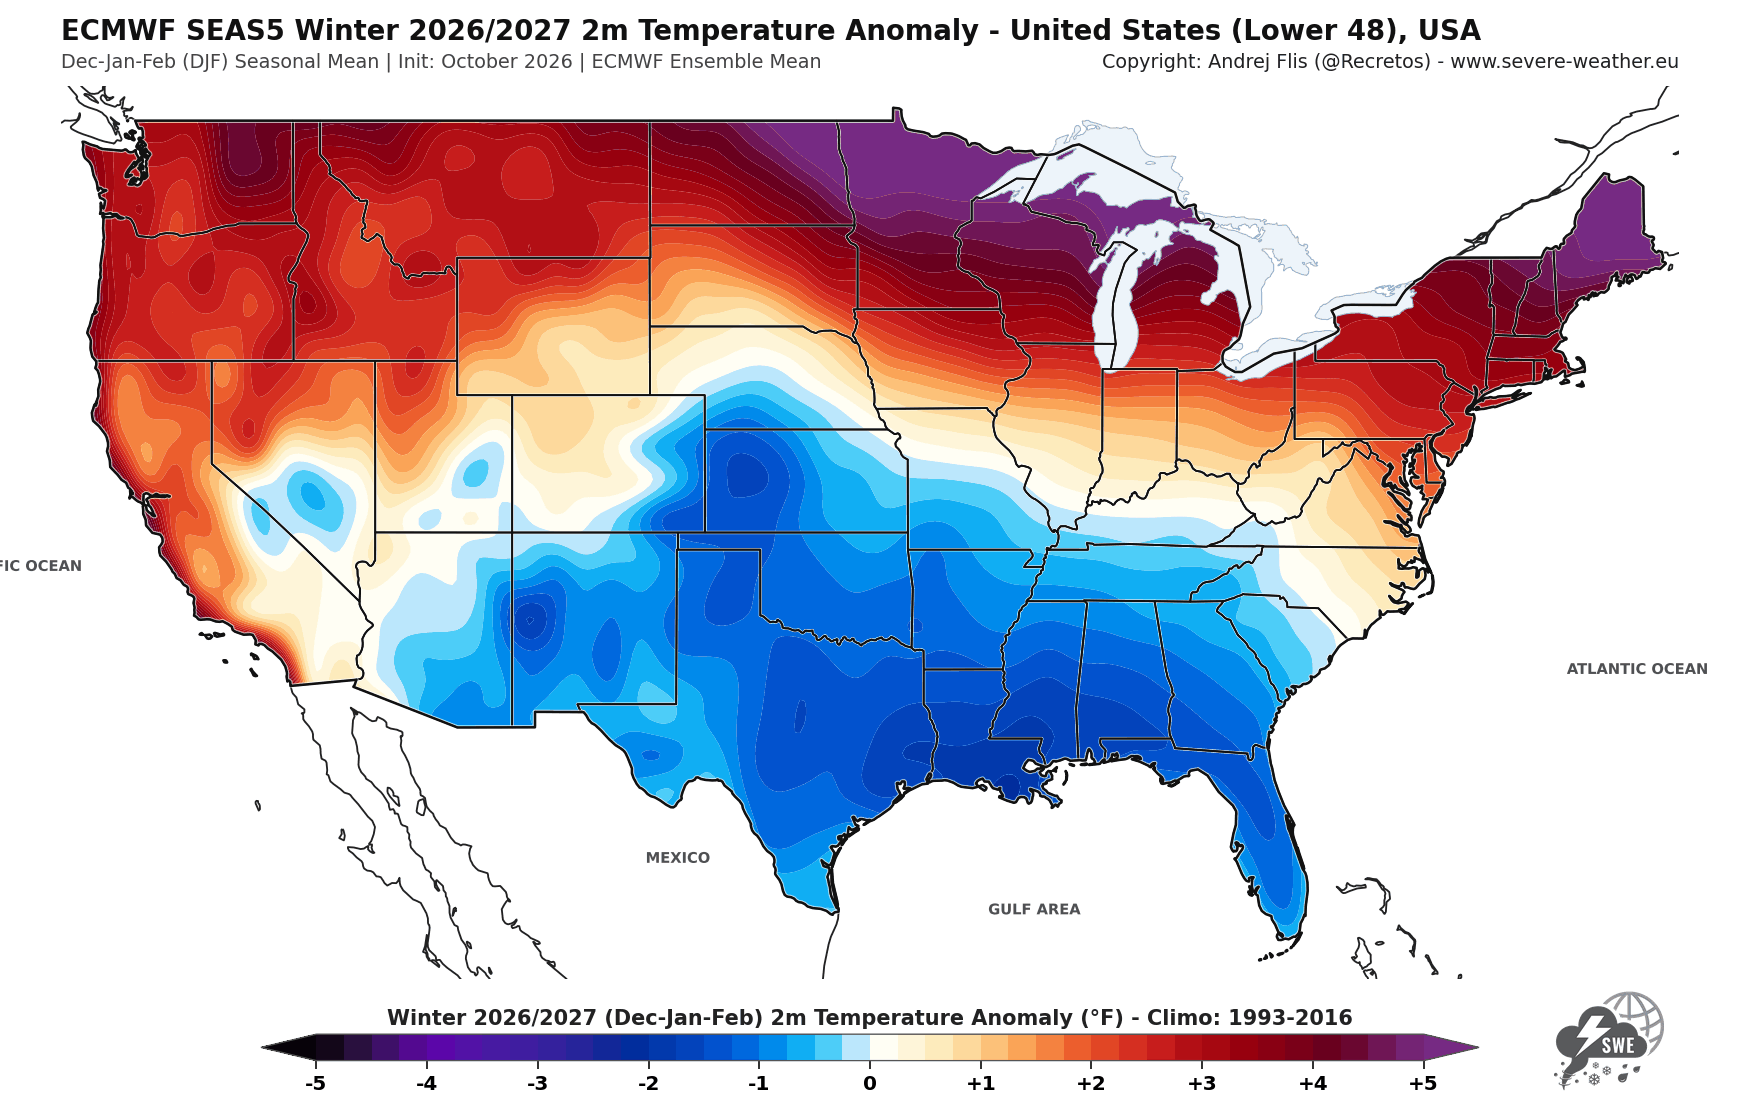
An amplified low-pressure pattern in the October data has resulted in a stronger temperature difference between the United States and Canada. In the forecast below, you can see above-normal temperatures under the high-pressure zone in Canada and the northern United States, including the U.S. West Coast and the Northeast.
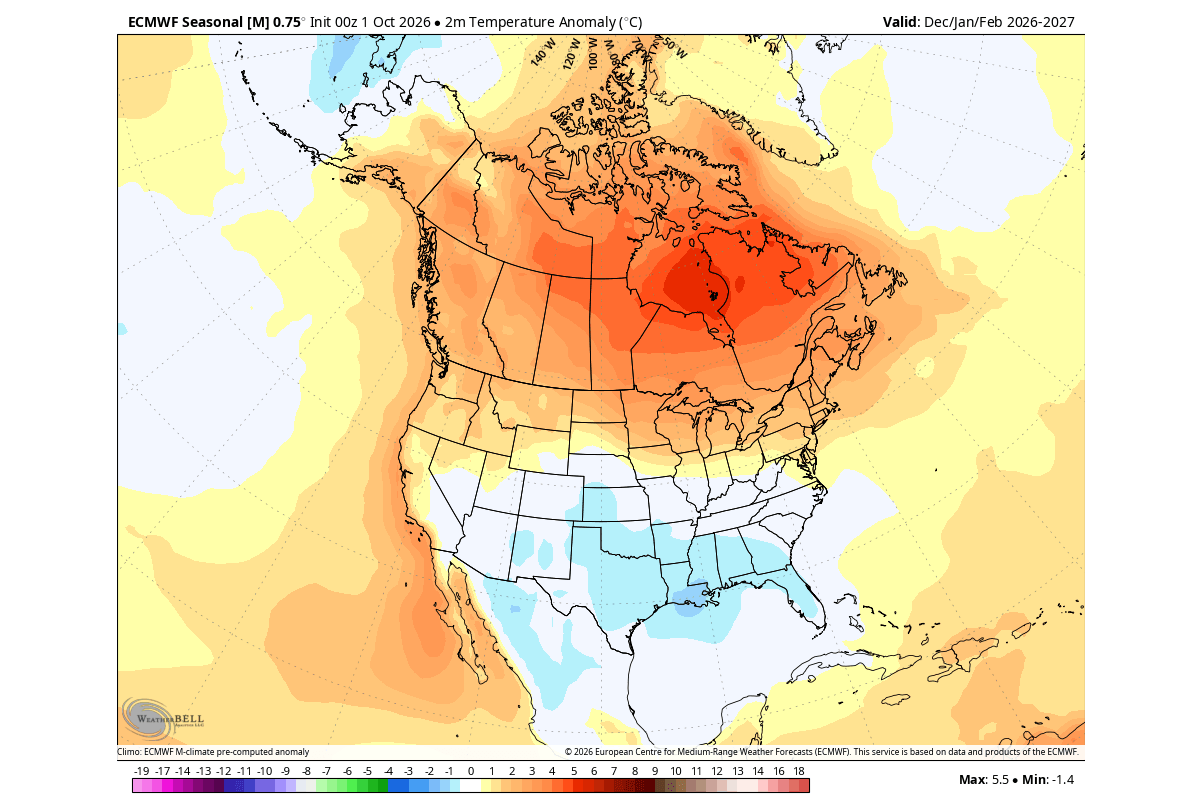
The southern low-pressure zone created more widespread below-normal temperatures in the latest data across the southern, central, and eastern United States. This mainly results from low-pressure systems bringing persistent cloud cover and unsettled weather.
The precipitation forecast also shows a clear Super El Niño signature, with above-normal precipitation over most of the United States. This is especially evident across the Southeast, East, Southwest, and California, due to an amplified Pacific jet stream. A stronger Pacific jet brings lower pressure and more moisture, creating increased precipitation and snowfall if cold air is available.
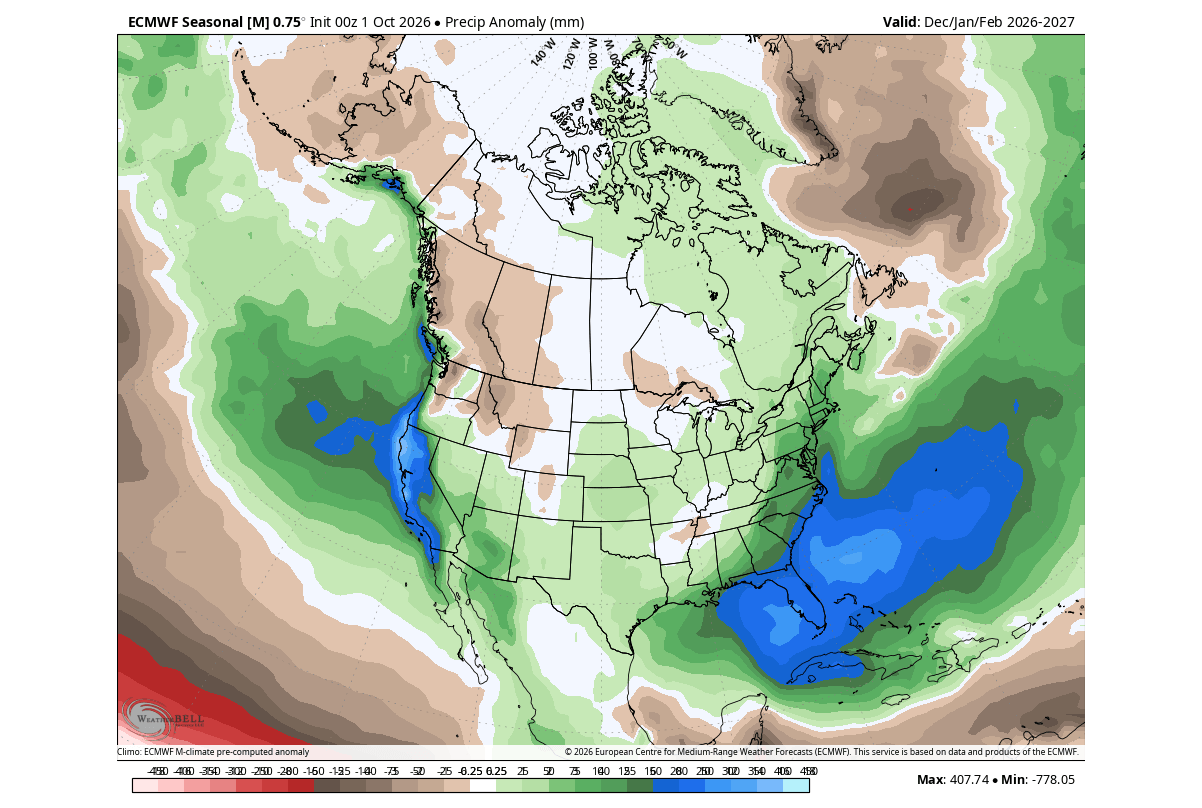
We can see areas with below-normal rainfall in the northwestern United States, the upper Midwest, and over southwestern and western Canada.
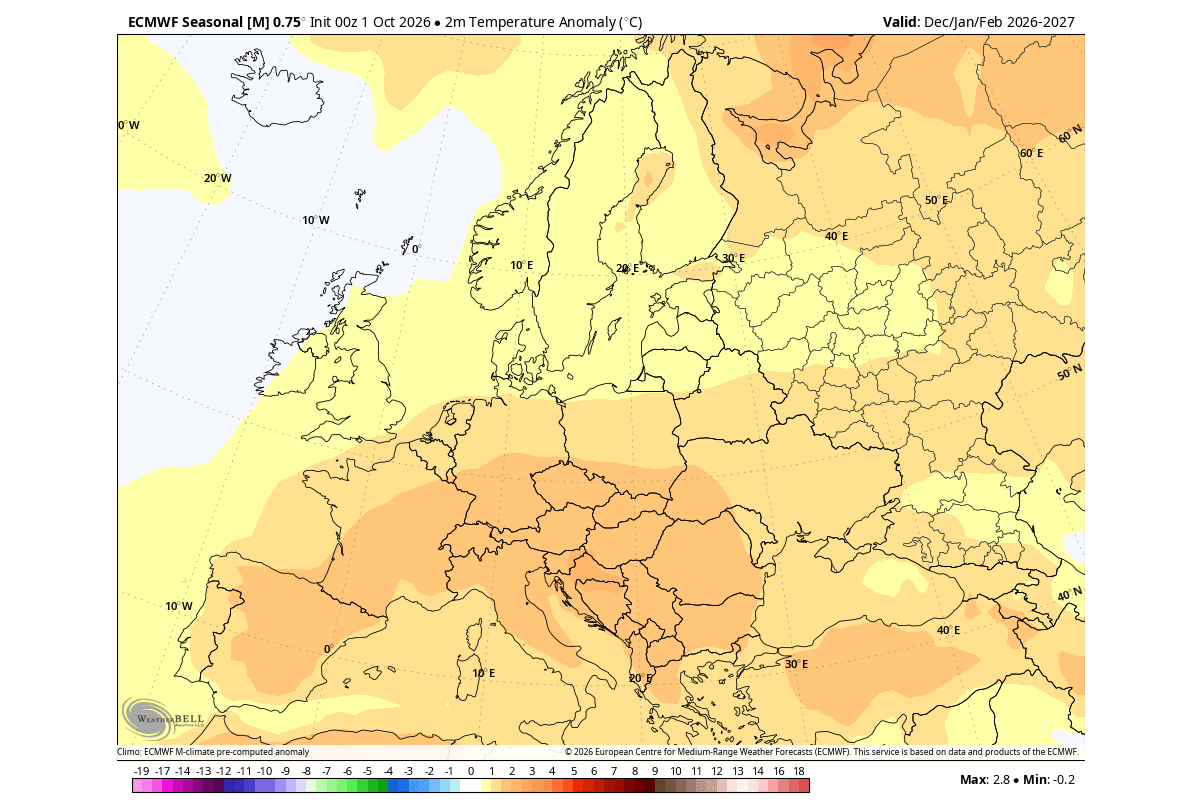
A record Super El Niño can also influence Europe, though less directly. In the latest December-February temperature forecast below, you can again see mostly above-normal winter temperatures. This results from a dominant mild westerly flow. It still allows some northerly air into the northwest, as low-pressure areas move from the Atlantic into northern Europe, pulling down northerly air on their rear side.
The precipitation forecast shows above-normal winter precipitation across much of the continent. Westerly and southwesterly flow from the Atlantic brings abundant moisture, increasing precipitation potential, especially in the western, central, and southeastern areas.
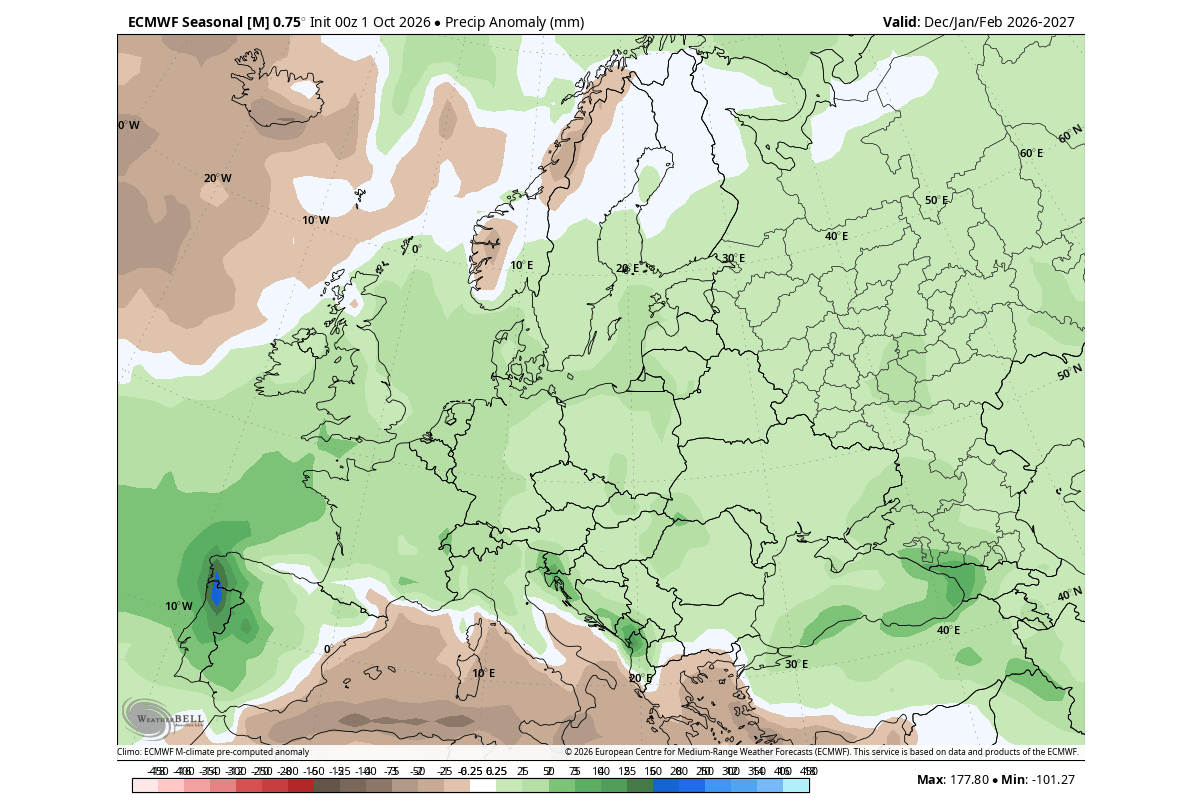
But more winter precipitation does not always equal snow. For snowfall, we also require a source of cold air, which varies by region and elevation in any winter.
Winter 2026/2027 Snowfall Update: United States, Canada and Europe
With pressure and jet stream changes, the Super El Niño also strongly impacts snowfall distribution. When an active southern jet stream and potential periods of colder air occur, we can get surprising snowstorms across the central, southern, and eastern United States.
Below is the latest ECMWF snowfall forecast, and it shows very interesting development. You can see the strongest snowfall deficit across the Pacific Northwest, the coastal Northeastern United States, and Maritime Canada. But we can see strong above-normal snowfall potential across the Central, Western, and Eastern United States, as well as Quebec and Labrador.
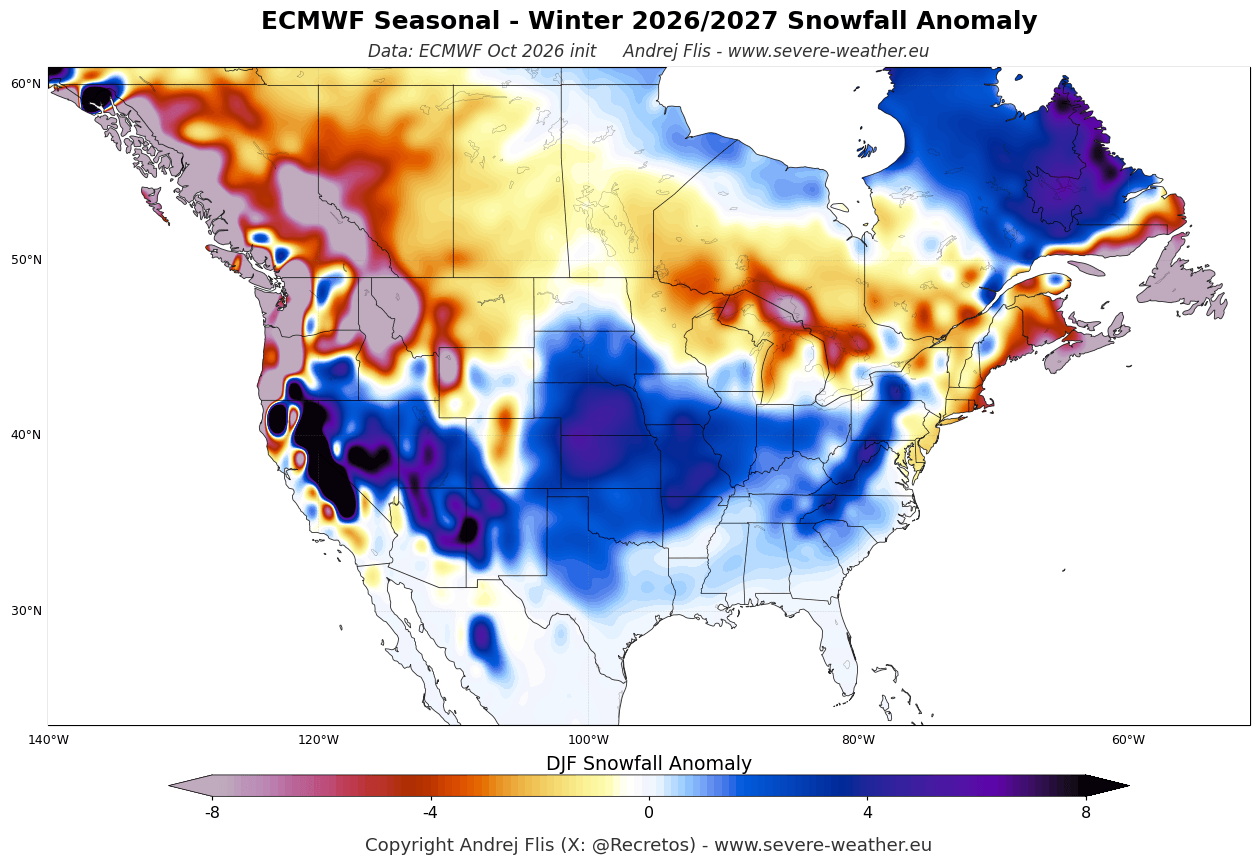
Regionally, above-normal snowfall is indicated across much of the Southwest, the Central Plains, the Midwest and Ohio Valley, and the Southern Appalachians into the interior Mid-Atlantic.
For skiers and winter sports enthusiasts, the strongest snowfall signal is over the Sierra Nevada, California. But above-normal snowfall also extends across the Great Basin, Utah, the Southern Rockies, and the elevations of Arizona and New Mexico.
Over Europe, the main snowfall potential comes from individual low-pressure systems. If they track farther south into central parts, they can pull down colder northerly air behind them. But the overall seasonal pattern is not favorable for broad snowfall across Europe, with exceptions in the northern regions and at elevations like the Alps.
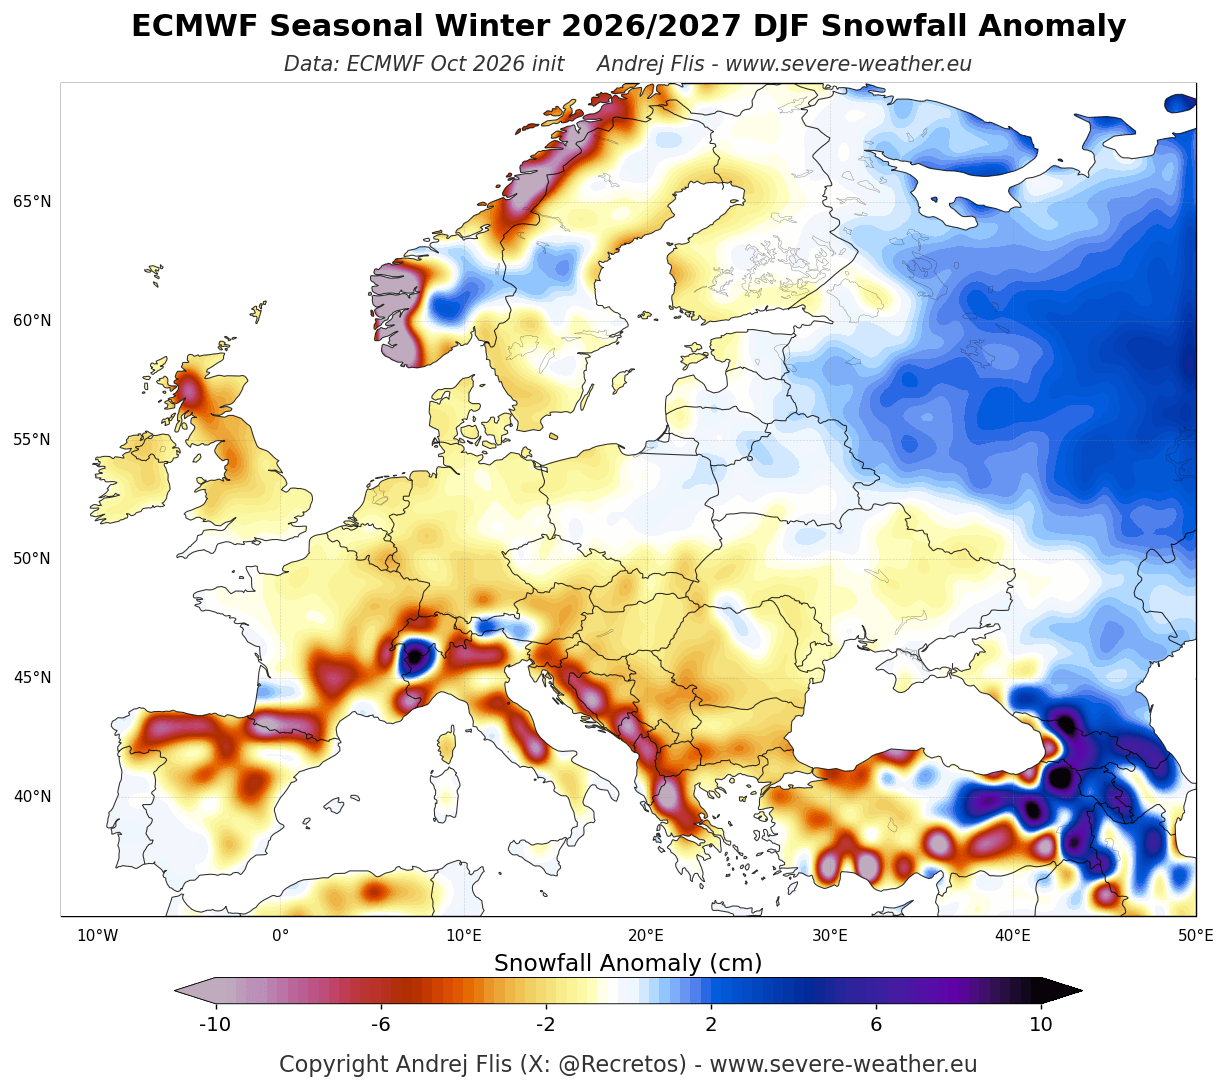
Most ski resorts can face a difficult season with below-average natural snowpack. With abundant moisture from the Atlantic, the highest elevations (above 1800-2000m) are likely to see above-normal snowfall where temperatures remain cold enough.
For a deeper dive into the latest Winter 2026/2027 trends, you can use the Winter Explorer below. After that, we will look at stronger winter potential in the second half of the season, with a major role for the stratospheric Polar Vortex.
The Upcoming Winter Month by Month: Forecast Explorer for Every Region
Before you check your own region/state in the Winter Explorer, here is how the latest ECMWF forecast shows the season evolving month by month.
December 2026: Canada and the northern U.S. start mild under strong high pressure, while a southern low brings a wetter pattern to the Southeast and the East Coast of the United States. Europe starts mild almost everywhere.
January 2027: The pattern amplifies, with the Gulf Coast and the south-central U.S. turning slightly colder and California seeing its wettest month. Europe stays mild, but is starting to shift in the north.
February 2027: The coldest and snowiest-looking month for the central, southern, and eastern U.S., with below-normal temperatures from the Southwest to the Southeast. Northern Europe turns near normal, but the southern half stays mild.
March 2027: The pattern relaxes into early spring, with a mild north and a slightly cooler southern half of the United States. Europe returns to broadly mild conditions.
In this Winter Explorer, you can check the seasonal and monthly winter forecast breakdown for each state, country, and province. All images are high-resolution, so you can freely pinch-zoom on mobile.
As mentioned above, the forecast trends also show bigger factors at play in the stratosphere, with a potential Polar Vortex disruption in mid-winter, and a pattern amplification in the mid-late season. More on this further below.
Polar Vortex Forecast: A Mid-Winter Disruption Signal
The Polar Vortex is a name for broad winter circulation over the Northern (and Southern) Hemispheres. Imagine the Polar Vortex as a spinning wall around the polar regions, rising from the surface into the stratosphere, up to around 50 km (30 miles) high, trapping cold polar air inside when it's strong.
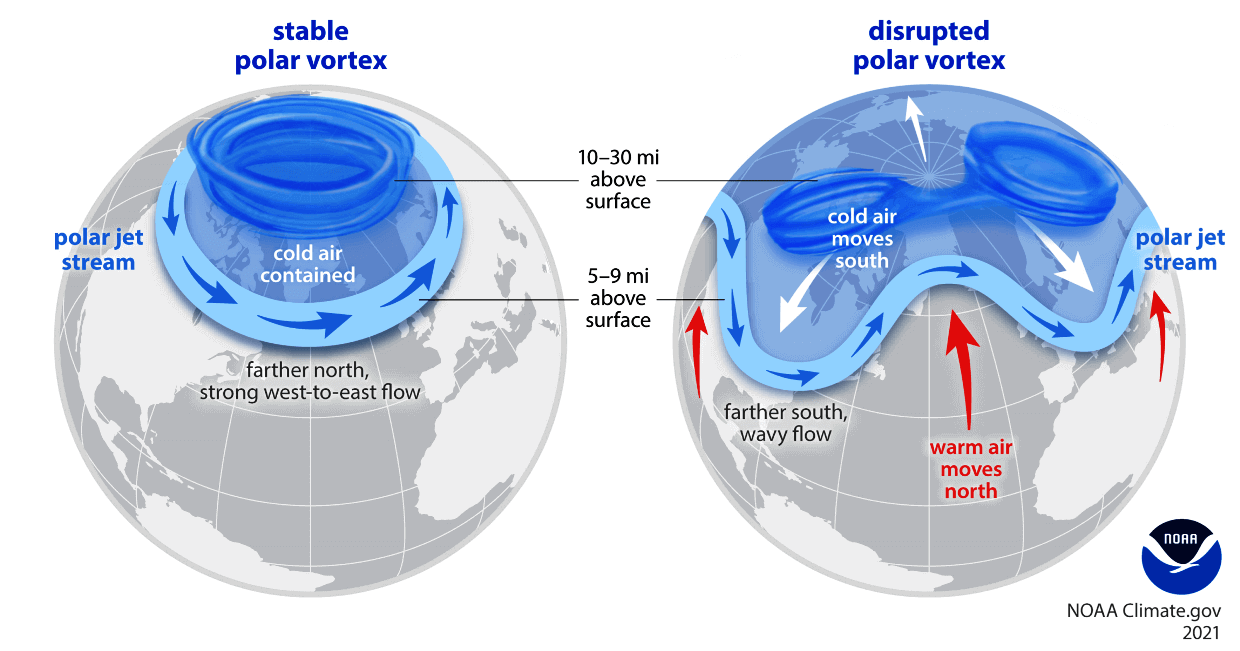
A weak or disrupted Polar Vortex can increase the potential for colder winter patterns across parts of the mid-latitudes, although it does not guarantee cold or snow in any specific region. The most dramatic disruption event is a Sudden Stratospheric Warming (SSW), when powerful atmospheric waves rapidly weaken the Polar Vortex and can even reverse its stratospheric flow.
To show the Polar Vortex dynamics, I produced a high-resolution 3D video below that reveals its evolution under stress. This video shows the Polar Vortex structure disruption in early 2026, which brought a cold-air outbreak to the central and eastern United States and parts of Europe.
The most recent ECMWF seasonal forecast below shows an unusual weakening of the stratospheric westerly winds starting around late December and going lower into mid-winter. You can see that as the black line (forecast) goes well below the long-term average (red). The below-normal wind signal indicates a weaker Polar Vortex during mid and late winter.
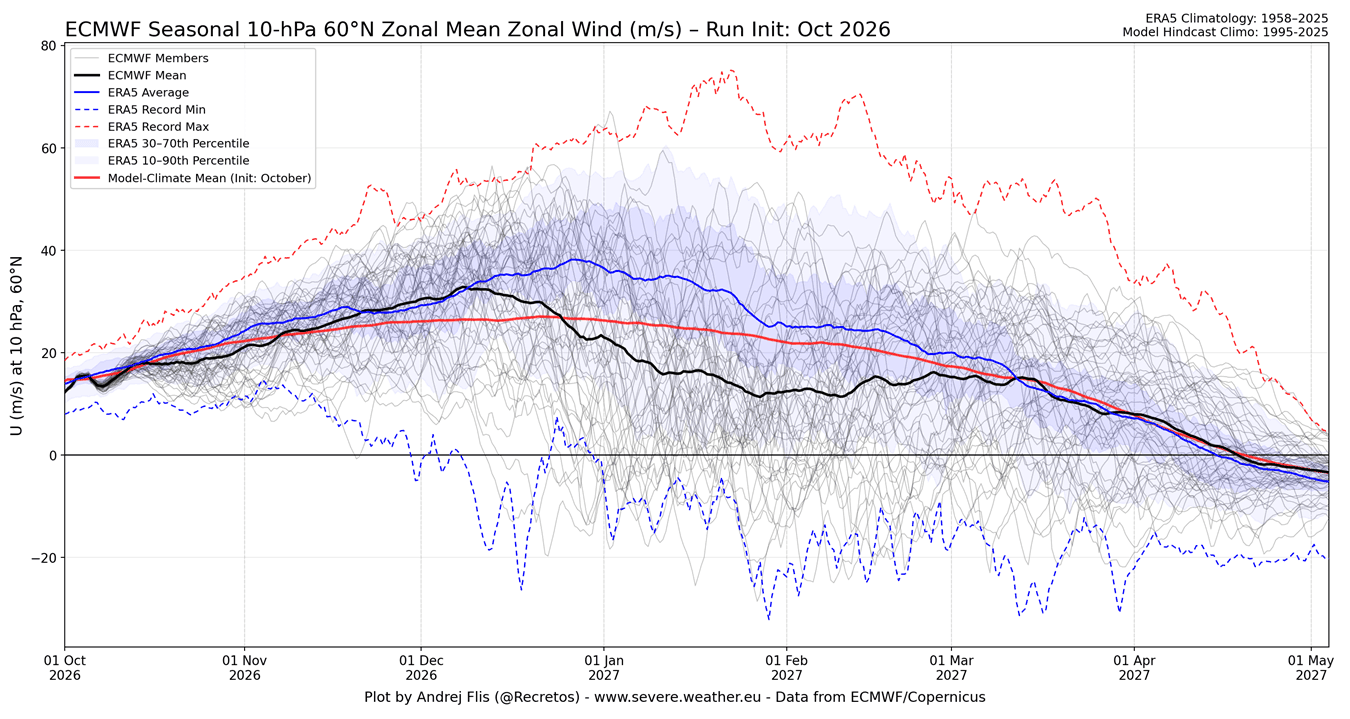
A Polar Vortex slowdown means that its strong westerly winds are weakening. If those winds eventually reverse direction high in the stratosphere, we have a major Stratospheric Warming event. That disruption can reach the lower atmosphere, disturb the jet stream, and increase the chance of cold-air outbreaks farther south.
The image below shows the average temperature anomaly in the first 30 days after major SSW events. On average, colder conditions become more likely across large parts of the United States and northern and central Europe. This is just an average pattern from many SSW events, and a Super El Niño can alter the actual flow of cold air with its own pressure anomalies.
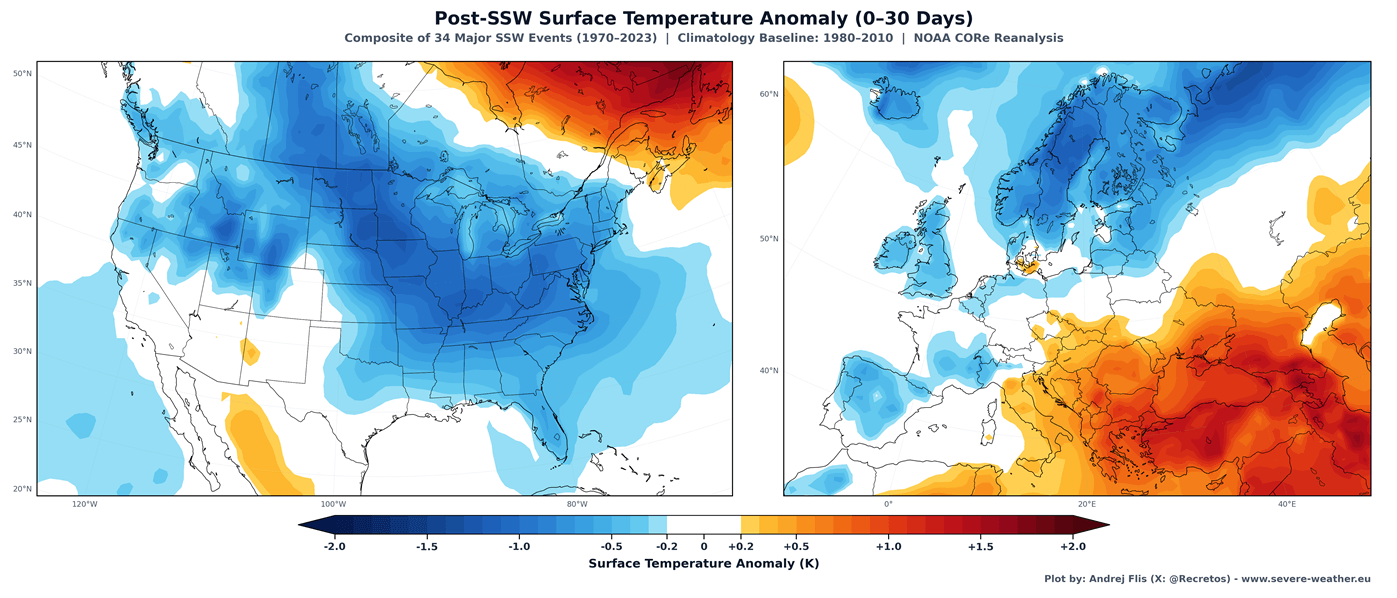
This is a very similar pattern that we also saw last winter over the United States, with a disrupted lower Polar Vortex core moving into North America. It established the “Polar Express” pattern, the same as seen in the image above.
Research (linked below) on the 2015/2016 Super El Niño winter also showed an unusual evolution of the Polar Vortex. Relatively strong circulation early in the season is followed by rapid weakening around the December-January transition.
This means the Polar Vortex can behave very differently from one part of winter to another. It can start the season relatively strong and then weaken rapidly into mid and late winter. And there are two other seasonal models that point in the same direction.
A Backloaded Winter? The Pattern Amplifies Into February
A 2019 research review (also linked below) explains that a strong El Niño can send more atmospheric wave energy upward from the Pacific, putting extra pressure on the stratospheric Polar Vortex as winter evolves. This can weaken the Polar Vortex in mid-to-late winter, which can then disrupt the weather patterns below.
I decided to also look at mid-to-late winter trends from two other long-range systems: the Canadian CanSIPS and the NOAA CFSv2. We don't have a separate Polar Vortex forecast from them, but their lower pattern is consistent with the ECMWF signal.
Looking at the February forecast trend, both models agree on a strong blocking high, centered over Canada at mid-levels. This favors a pronounced low-pressure zone across the United States. We can see a clearly disrupted atmospheric flow, favoring active winter patterns in the U.S. this time of year.
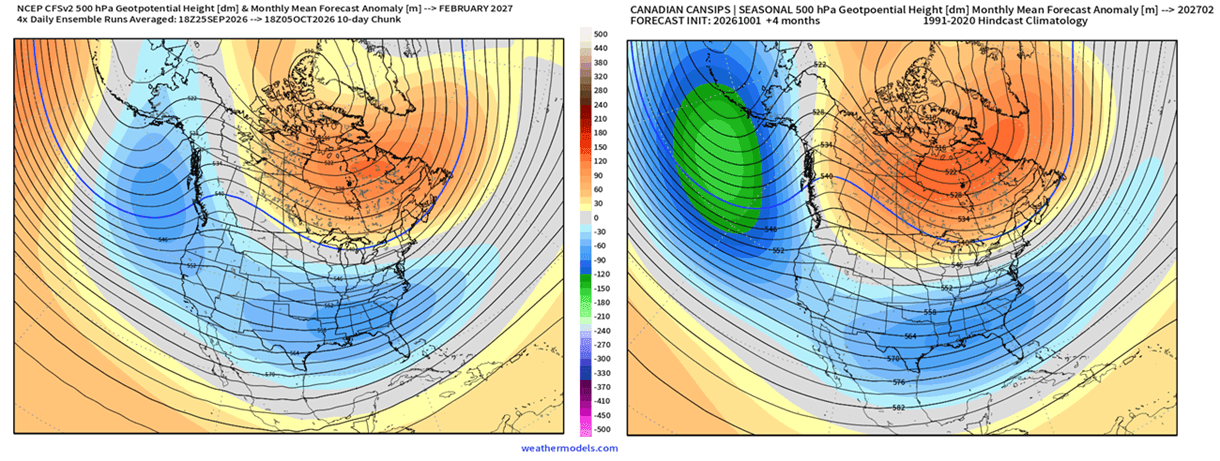
The February temperature forecast below shows this active mid-to-late winter trend. Two different forecast systems show a broad area of below-normal temperatures across parts of the central, southern, and eastern United States in February, aligned with the amplified southern low-pressure pattern.
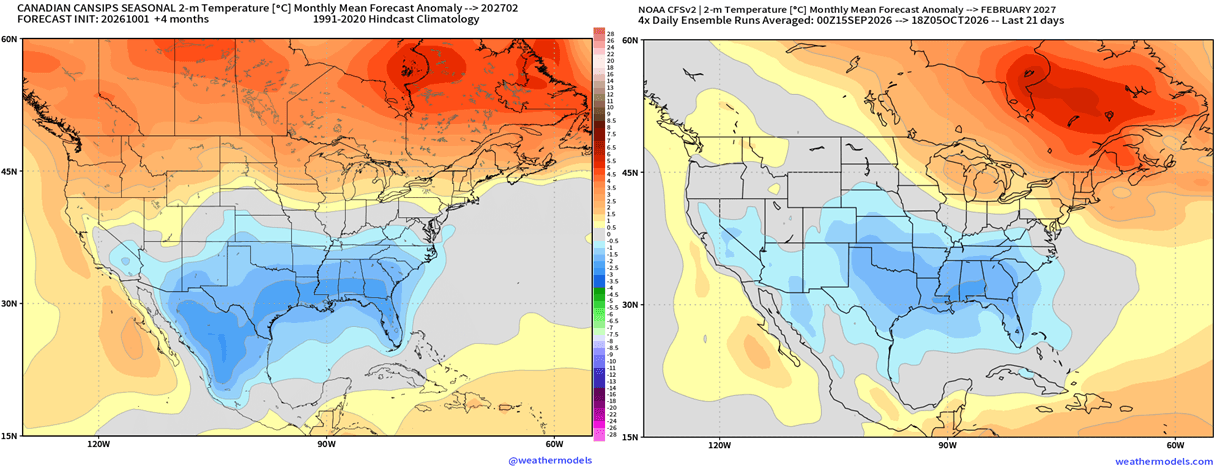
This still doesn't guarantee individual cold outbreaks and snowstorms, but it strengthens the signal for a colder pattern across parts of the United States later in winter.
The evolution is different over Europe, as it is further away from the strong direct mid-to-late winter impacts of the Super El Niño. A persistent westerly pattern remains dominant into February, typically seen during Super El Niño winters. But the Canadian model shows hints of low-pressure systems trying to dive lower into the continent.
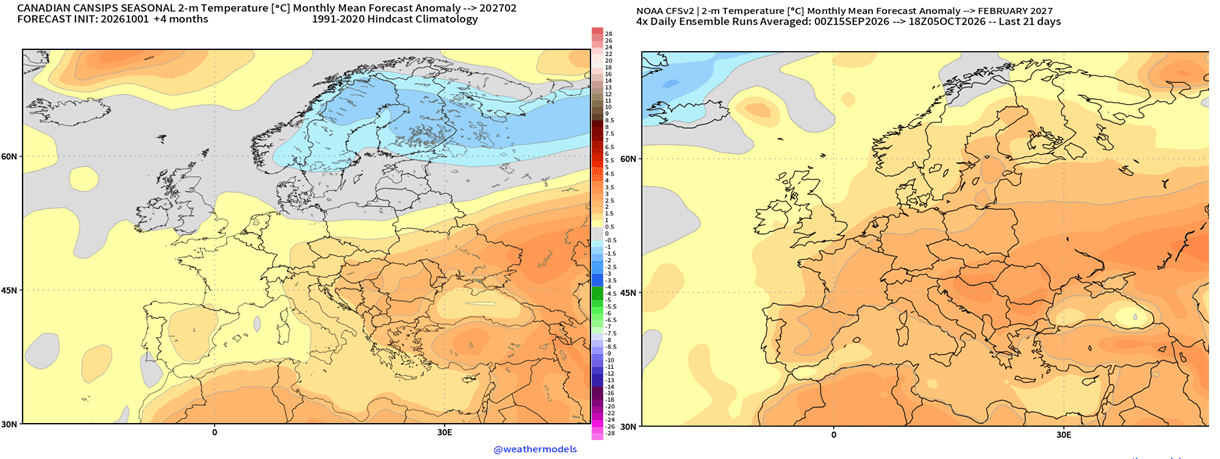
Unlike North America, where a mostly locked Super El Niño signal dominates, winter trends over Europe remain sensitive to changes in North Atlantic circulation, so the final outcome also depends on other factors.
Winter 2026/2027 Forecast: Key Takeaways
Northern U.S. and southern Canada: Forecast milder than normal under a persistent high-pressure zone, with below-normal snowfall across southern Canada, the Pacific Northwest, the Upper Great Lakes, and the Northeast.
Southern and central U.S.: An active southern jet stream brings a stormy season with more precipitation and below-normal temperatures. The October data is trending colder and snowier, especially for the Central Plains, the Ohio Valley, and the Southern Appalachians.
Skiers in the West: The strongest snowfall signal is currently over the Sierra Nevada, California, with above-normal snowfall also across the Great Basin, Utah, the Southern Rockies, and the elevations of Arizona and New Mexico.
The Polar Vortex wildcard: ECMWF shows a notable weakening around late December and into mid-winter. The CFSv2 and CanSIPS also both point to a disrupted pattern and a colder February for the central, southern, and eastern U.S. A backloaded winter is becoming increasingly likely, but is not guaranteed.
Europe: Seasonal predictions point to a mild, wet westerly pattern, with below-normal snowfall for most areas. The best snow chances are in the north and at the highest elevations of the Alps.
Seasonal forecasts show the expected tendency over the whole winter period of several months, not individual storms. Even in a mild season, a single well-timed system can bring major snow or cold, as past Super El Niño winters have shown multiple times.
Peer-Reviewed Research Used in Writing this Article
- Extreme El Niño Winter Teleconnections: A Distinct and Reproducible Teleconnection Pattern over North America during Extreme El Niño Events - Beniche et al. (2024).
- Polar Vortex in the 2015/2016 Super El Niño: A Strong Phase Reversal of the Arctic Oscillation in Midwinter 2015/2016: Role of the Stratospheric Polar Vortex and Tropospheric Blocking - Cheung et al. (2016).
- El Niño and the Polar Vortex: The Teleconnection of El Niño Southern Oscillation to the Stratosphere - Domeisen et al. (2019).
Most charts and analyses in this article are my own, based on ECMWF, Copernicus ERA5, and NOAA Coral Reef Watch data. Some forecast images are from weathermodels.com and WeatherBell (used under a commercial license).
Super El Niño 2026: The Super El Niño is Breaking Records, With Winter 2026/2027 Weather Impacts Ahead
We will keep you updated on the global weather pattern development, so bookmark our page. Also, if you have seen this article in the Google App (Discover) feed, click the like (♥) or the star button there to see more of our forecasts and our latest articles on weather and nature in general.