The latest October data from six seasonal models now broadly agree on the overall Winter 2026/2027 snowfall pattern. A Super El Niño footprint is clear, with more snow across much of the southern and central United States and less snow for the northern U.S., southern Canada, and most of Europe.
The models also agree on the timing: a slow start to the snow season in December, with the strongest snowfall signal arriving in the second half of winter and likely continuing into early spring. That is a clear Super El Niño signature.
In this article, I present the full set of snow maps, including the change from the previous month’s snow forecast, the snow spatial distribution, and the forecast for ski areas. I also added a Snowfall Explorer where you can check the detailed snow forecast for your own state, province, region, or country in the United States, Canada, and Europe.
October Update: What Changed in the Snowfall Forecast
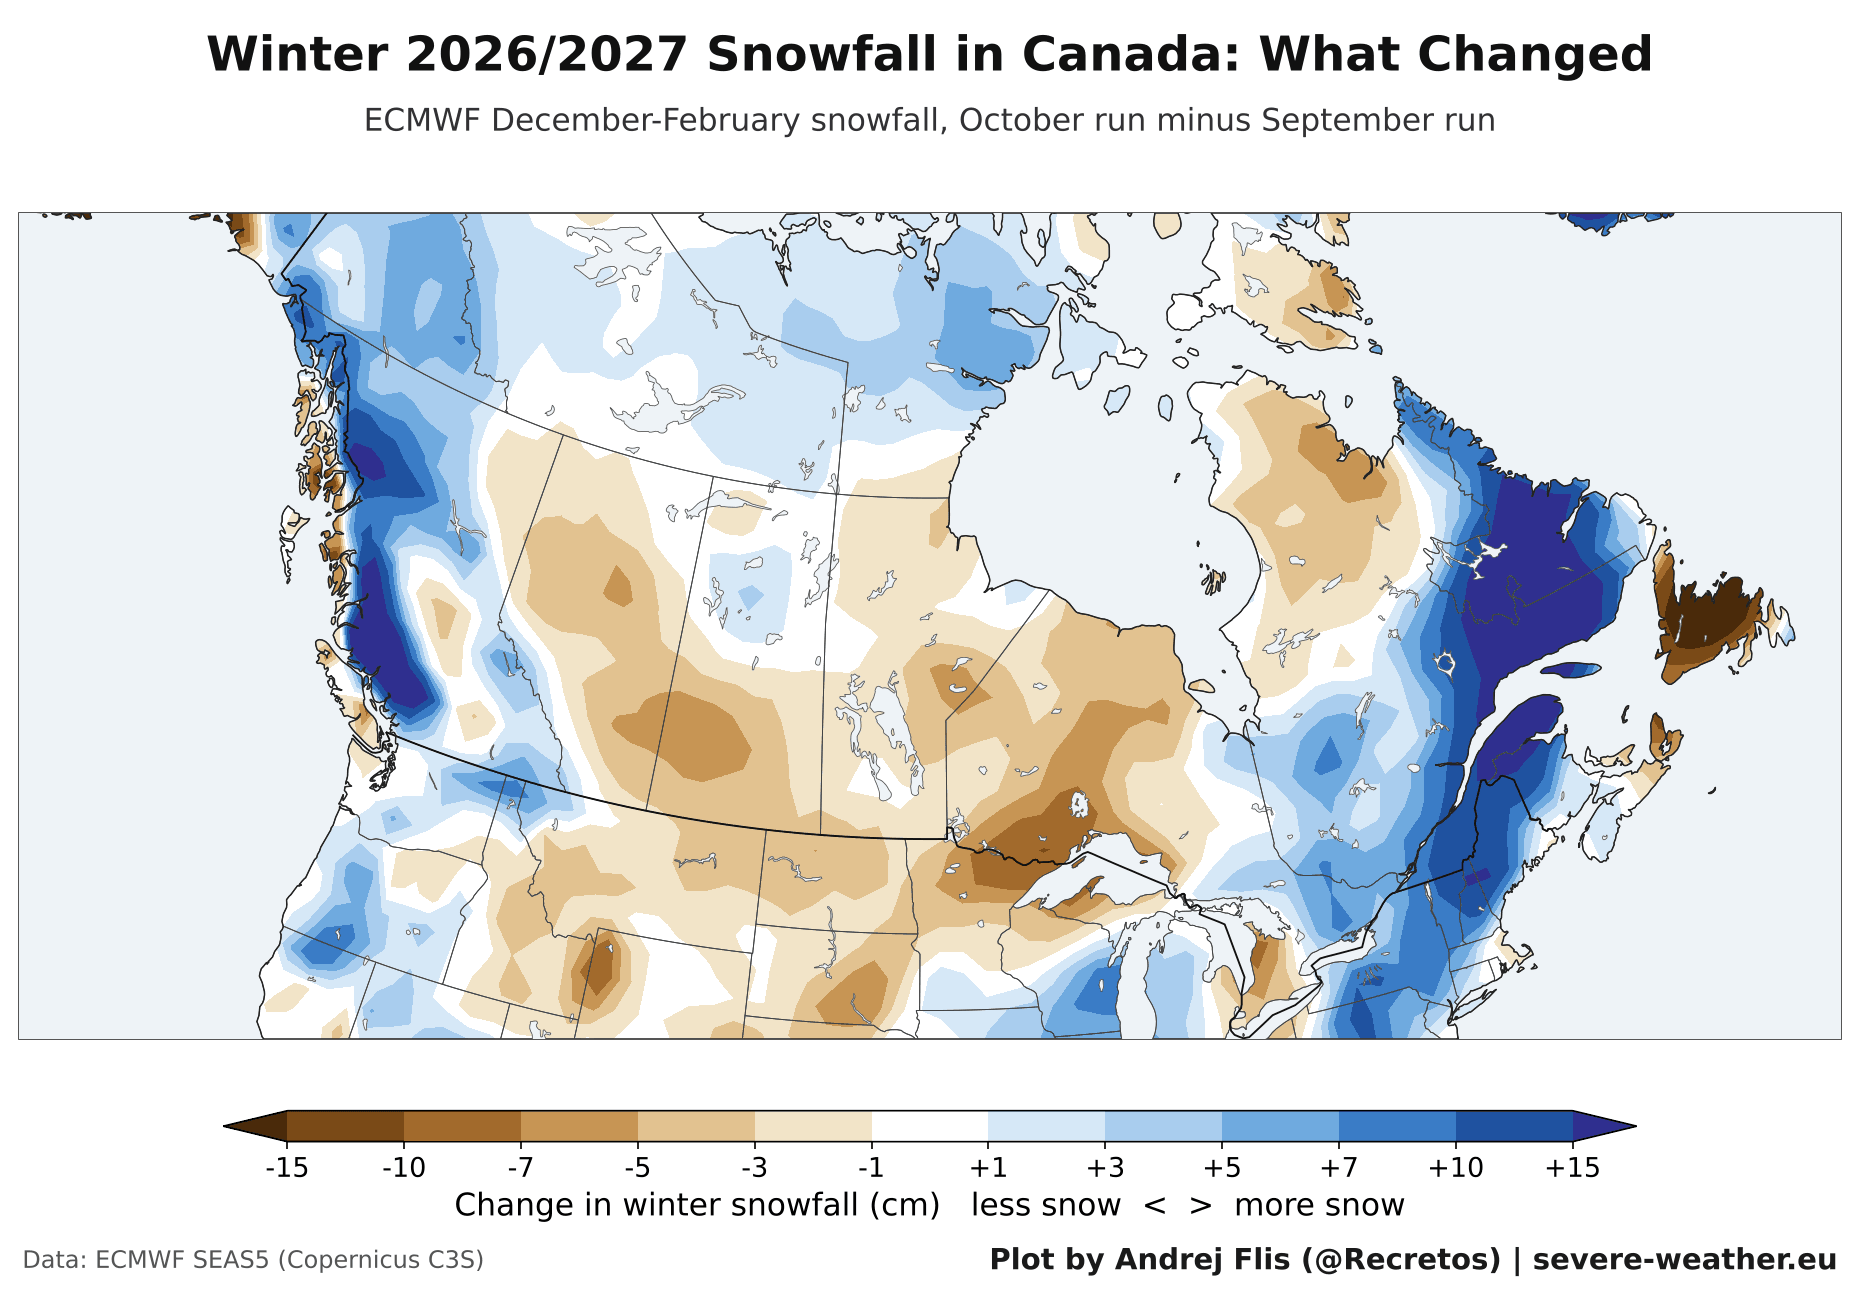
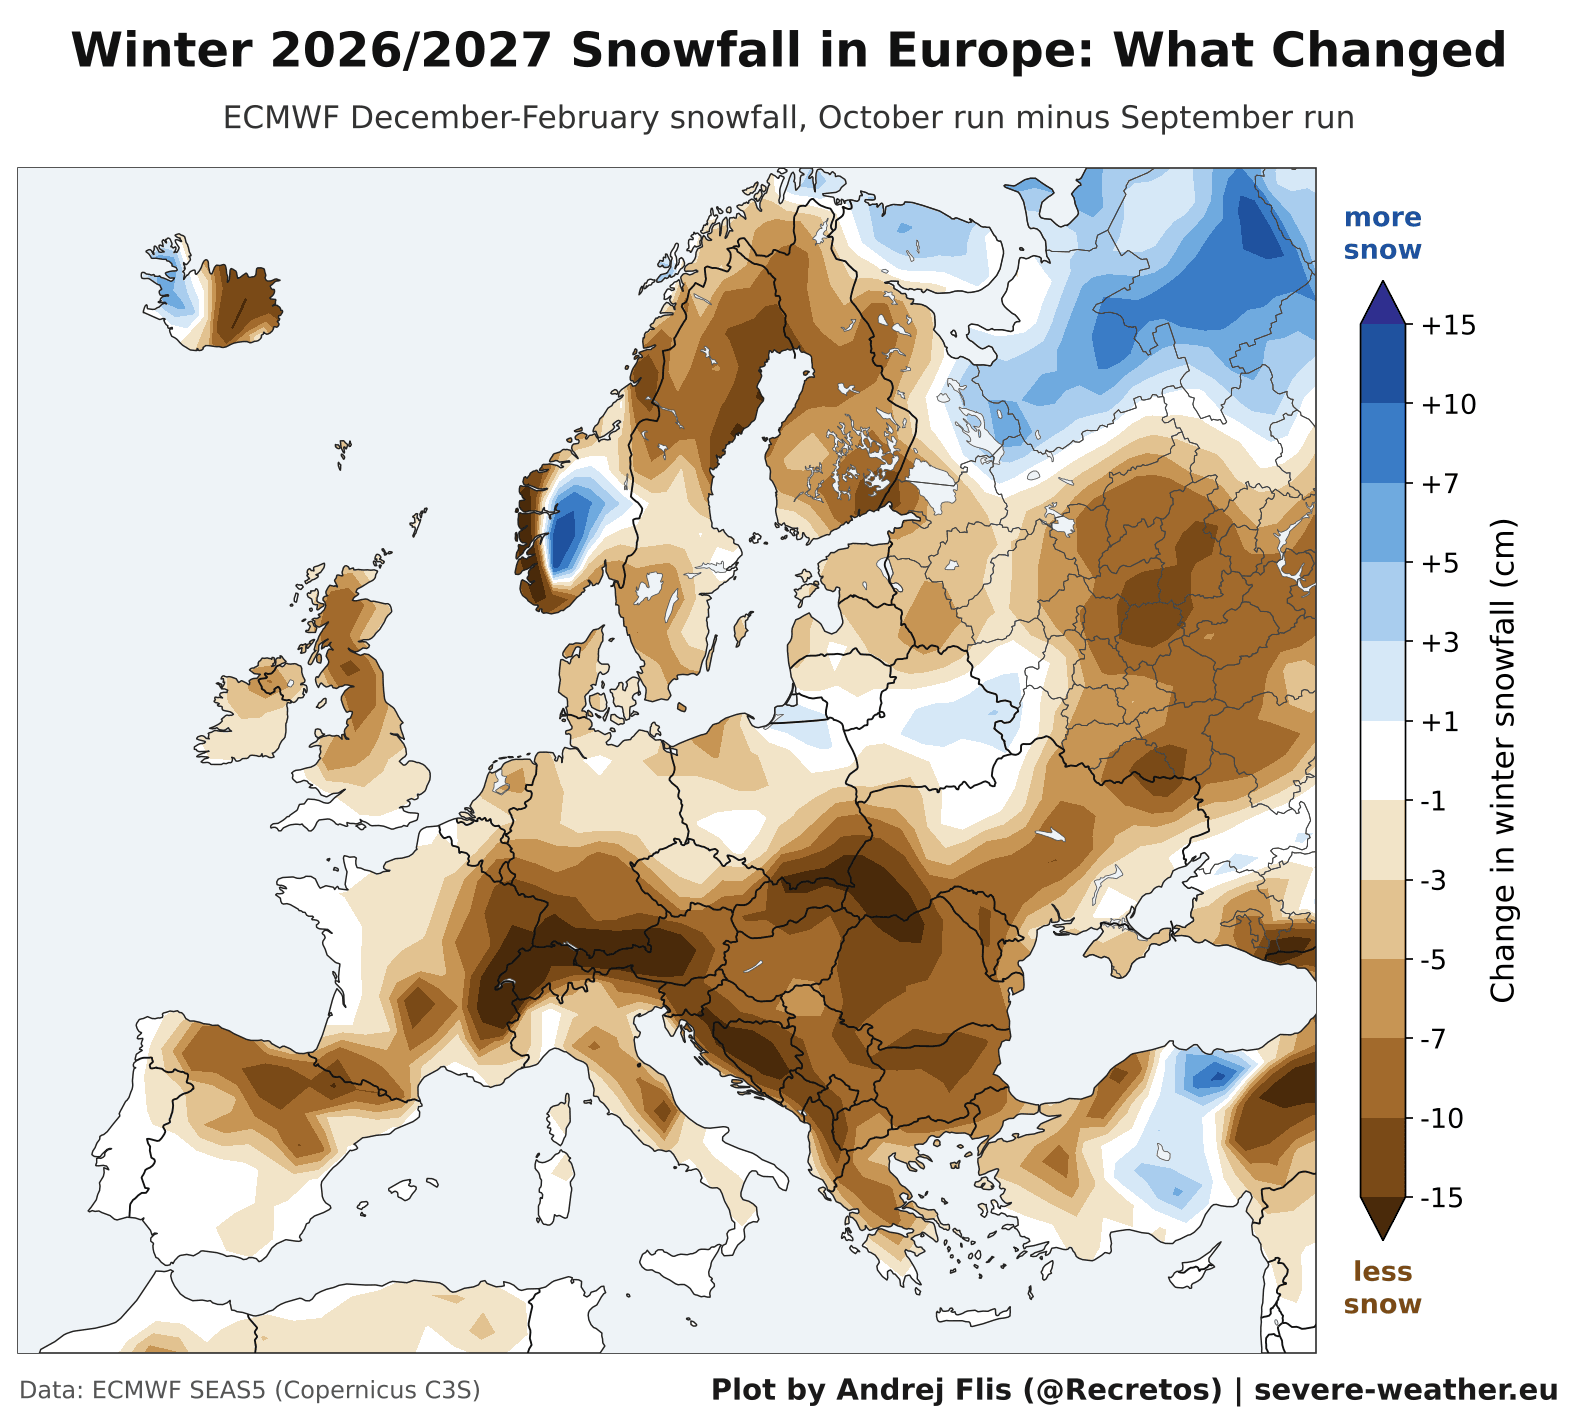
The image below shows how the latest ECMWF snowfall forecast changed from the September to the October run. Blue colors show where the new run has more snow than before, and brown colors show where there is less. This is not yet the actual forecast, but the change in the winter snowfall trend since the previous month.
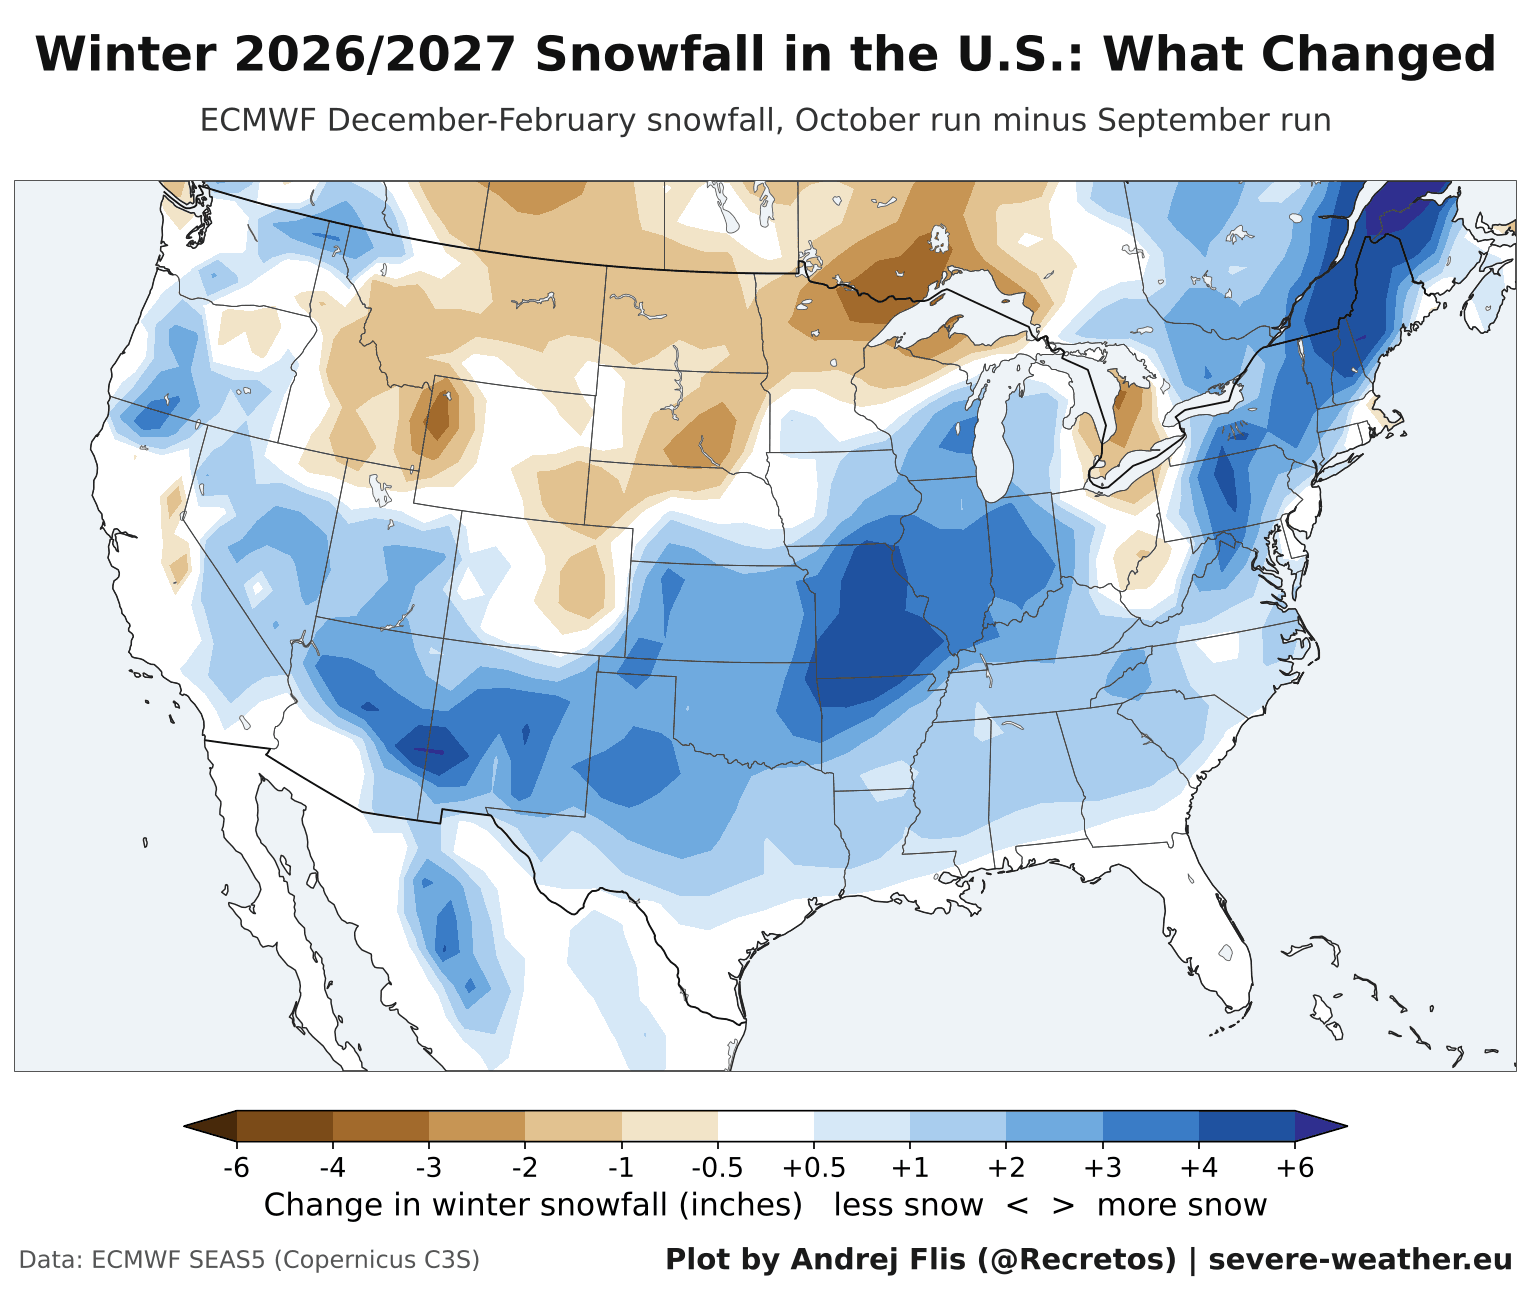
You can see a clear shift toward more snow across the southern and central United States. A large increase is visible in the Ohio Valley and Central Midwest (around +2.7 inches), the Southern Plains and Texas (+2.0 inches), and the Southwest and Southern Rockies (+1.5 inches). At this range, the snow trend matters most, not the raw numbers.
The Northeast gained snow in the latest run, especially in Maine, New Hampshire, and Vermont. At the same time, the October run took some snow away from the Northern Plains, the Upper Midwest, and parts of Montana and Wyoming.
For Canada, the October run added snow over Quebec (+6.7 cm), British Columbia and Atlantic Canada. But we can see that the Prairies and Ontario lost a few centimeters compared to September forecast data.
In Europe, the October run brought a weaker snow outlook. The ECMWF change map below shows less snow than in September across most of Europe, with the largest drops over the southern and central parts.
These changes do continue an established trend, giving more confidence in the overall winter pattern across the Northern Hemisphere. This is largely driven by a strong Super El Niño event in the Pacific, which is dominating the seasonal signal.
How a Super El Niño Shapes Winter Snowfall
The latest tropical Pacific ocean analysis below from NOAA CRW data shows the area covered by significant El Niño warm anomalies. Peak ocean anomalies are found in the eastern parts, reaching over 7°C above normal (12.6°F) across a large area. An event of this magnitude is expected to easily drive the seasonal patterns into spring 2027.
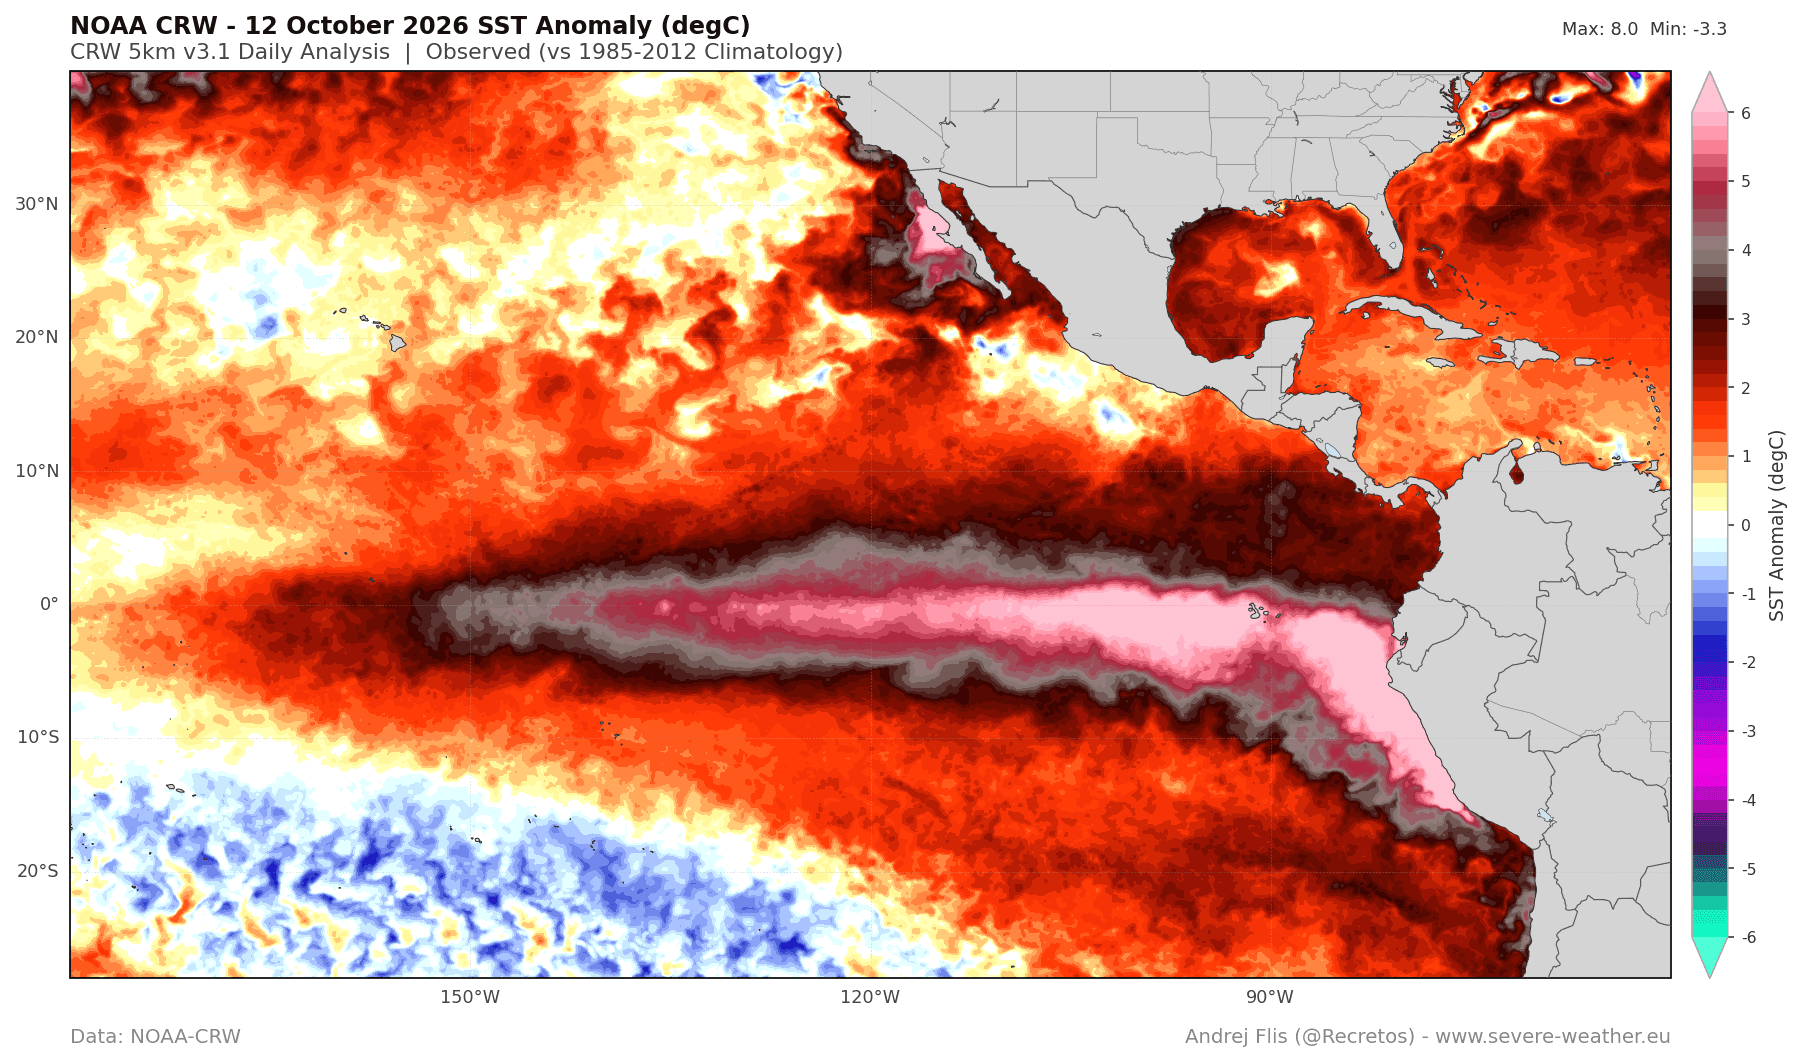
Most El Niño events peak in late fall or early winter. A strong El Niño usually brings an extended Pacific jet stream, along with lower pressure, cooler temperatures, and more moisture across the southern United States. This combination can really increase the snowfall potential across the central, southern, and eastern United States if enough cold air is available.
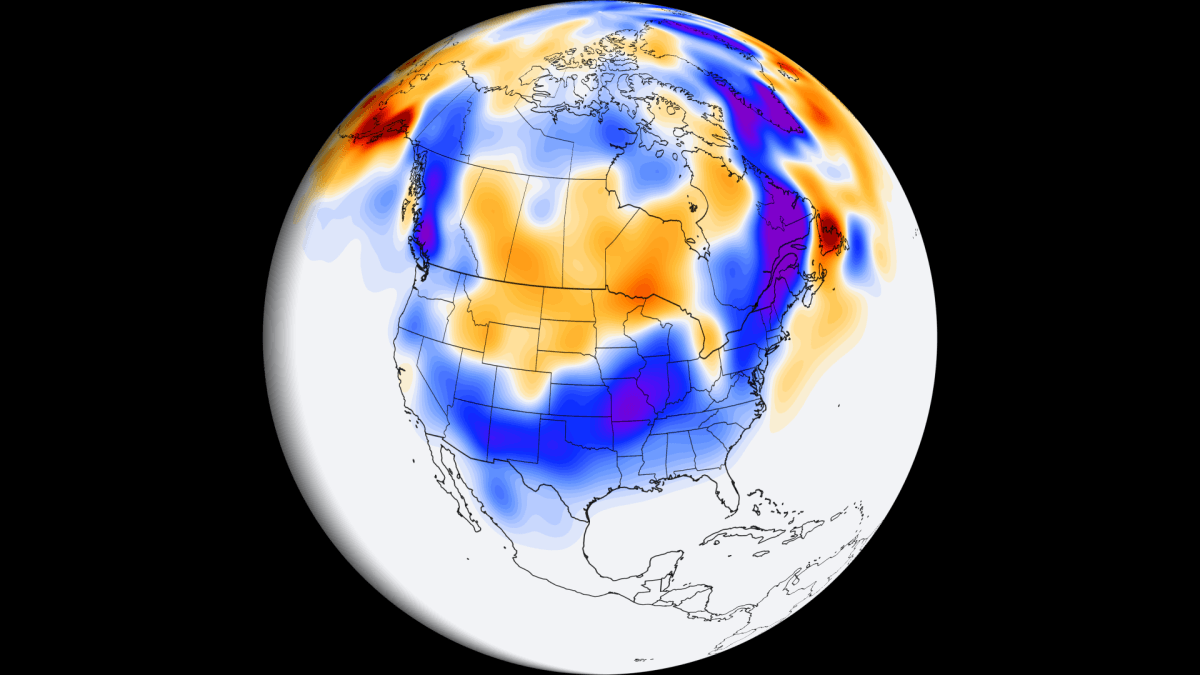
Below is a snowfall composite for all moderate and strong El Niño events. Above-normal snowfall (blue) occurred across the Sierra Nevada, the Four Corners, the Southern Rockies, parts of the Central Plains, and into the South and parts of the eastern United States. Image: NOAA
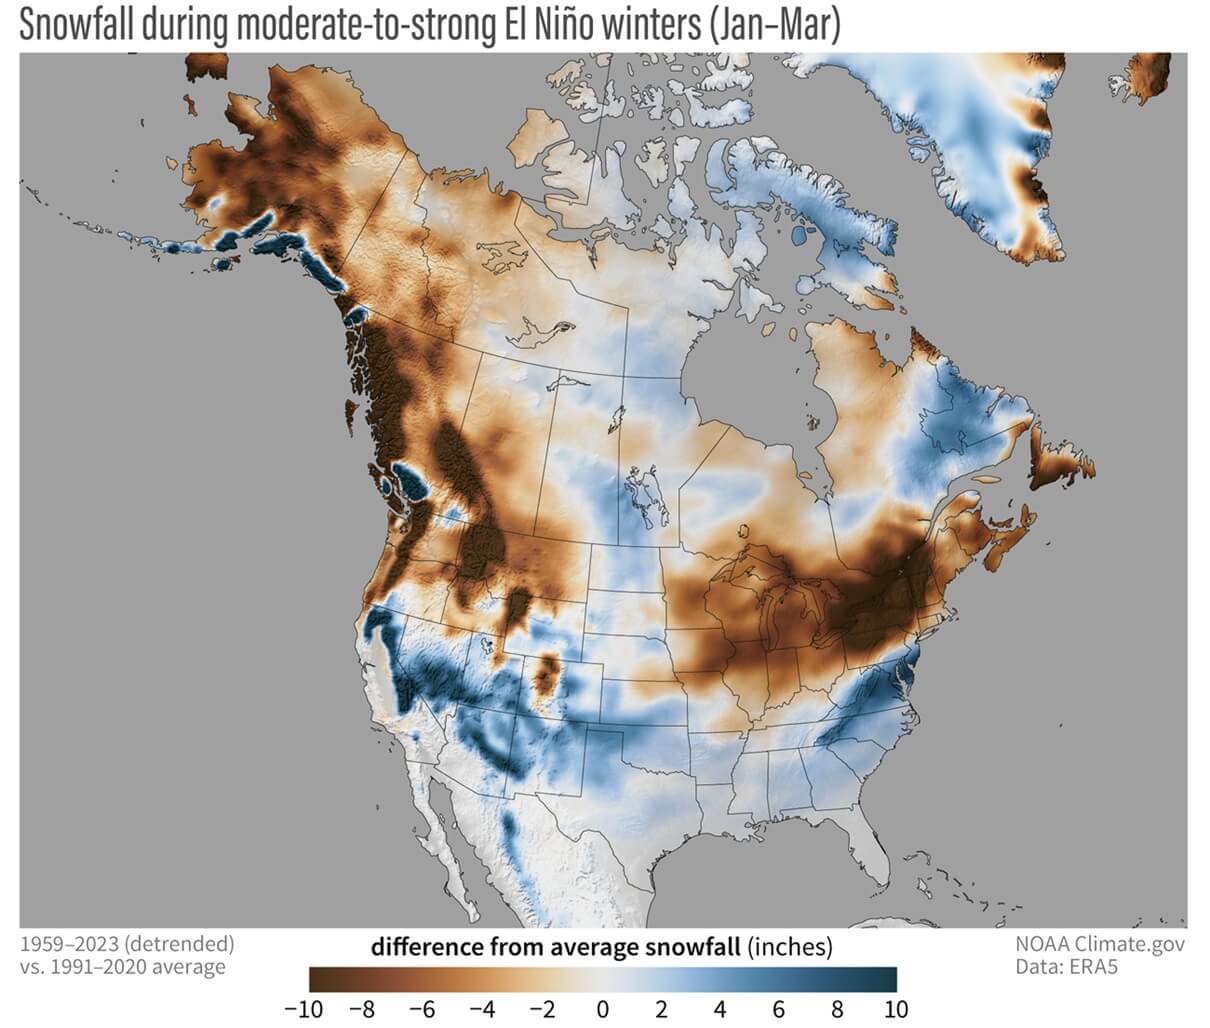
Large snowfall deficits (brown) were recorded over the Pacific Northwest, the Great Lakes, and the Northeast. This is because a Canadian high-pressure anomaly limits cold-air intrusions and can suppress sustained northern storm tracks.
We can take a quick look at the last Super El Niño in 2015/2016 to see what’s possible. Just after Christmas 2015, the southern storm track produced a severe blizzard across New Mexico, Texas, and Oklahoma. Parts of eastern New Mexico recorded 20-30 inches of snow, with 6-10 foot drifts that closed Interstate 40 from Albuquerque to Amarillo.
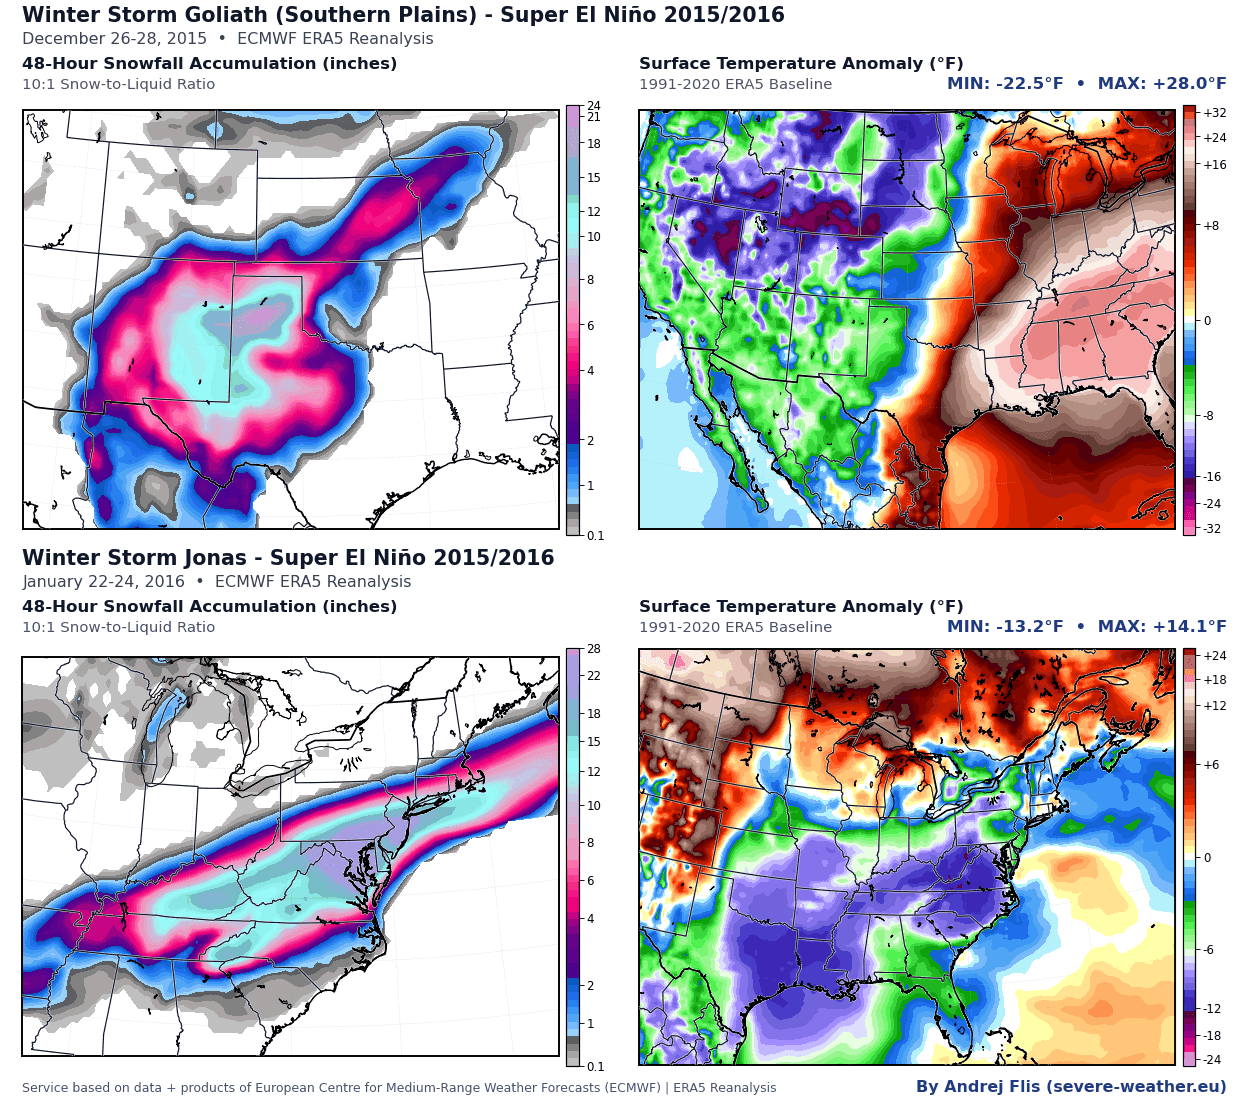
In January 2016, a historic nor’easter buried the East Coast in heavy snowfall. In total, over 100 million people were affected, and nearly 24 million saw more than 20 inches of snowfall.
Research (linked below) shows that the snowfall response becomes more defined as El Niño strengthens, with reduced snowfall typically developing across much of the northern United States. We all know that snowfall is strongly controlled by temperature. So even a strong southern storm track doesn’t guarantee above-normal snow if conditions stay too warm.
But what does the latest forecast actually look like?
Winter 2026/2027 Snow Outlook: United States, Canada, and Europe
Below is a snow outlook for Winter 2026/2027 (December-February), based on the multi-model data. White and light blue hues show where more snow than normal is expected, while the brown colors show where below-normal snowfall is currently forecast.
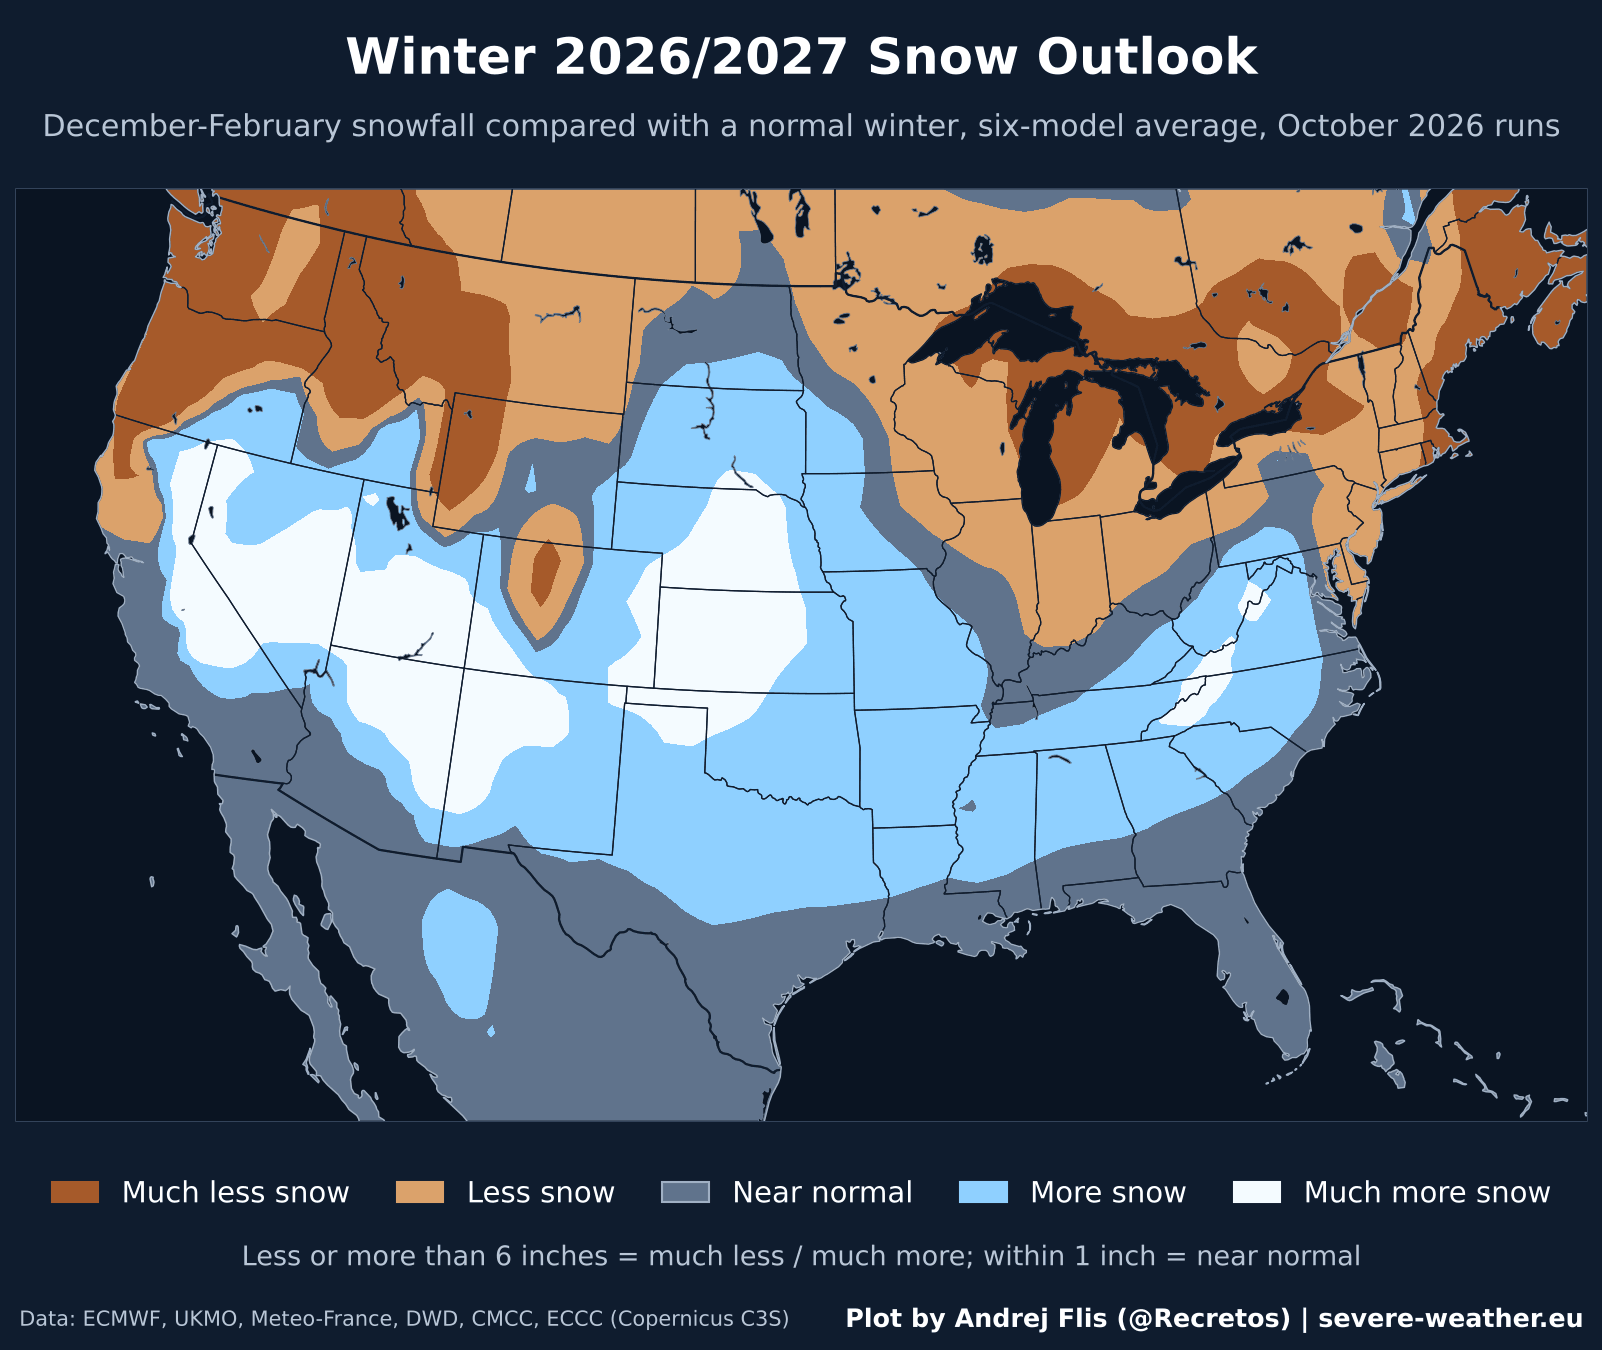
You can see a large area of above-normal snowfall from Nevada and Utah into Arizona and New Mexico, and over Kansas and Nebraska. A wider area of increased snowfall also covers the Southern Plains, the South, and the Southern Appalachians. The forecast is reversed over the northern parts of the U.S. and southern Canada.
The Pacific Northwest, Idaho and Montana, the Great Lakes, and northern New England all show below-normal snowfall. The largest snow deficit is currently forecast across the Northwest and around Michigan. Areas around the Gulf Coast, Florida, and southern Texas stay near normal, as they rarely see snow anyway.
But the total snowfall does not tell us when the peak of the snow season will arrive. I created the map below from multi-model data to show the month with the biggest snow boost compared with normal, from December through March.
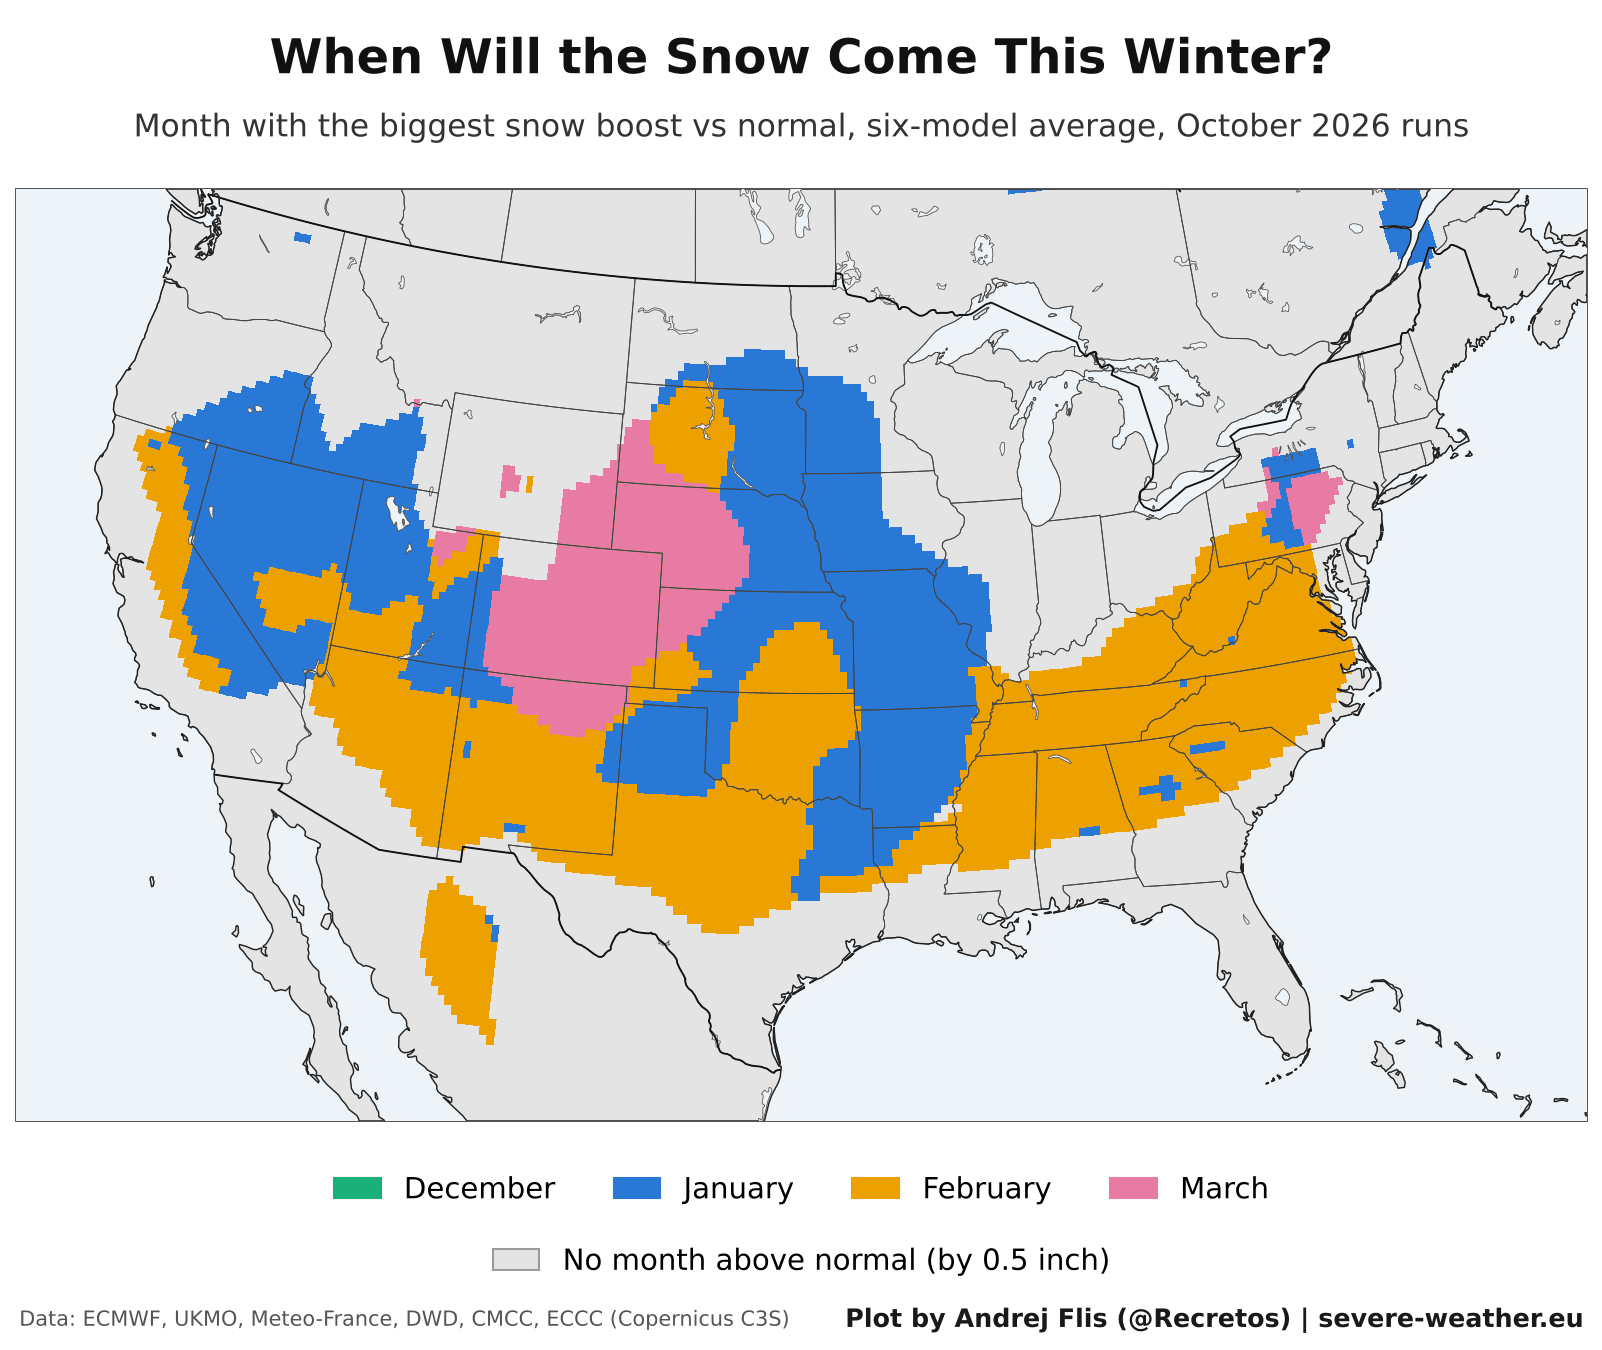
Not surprisingly, no region gets its biggest boost in December, which is a typical El Niño signal with a slow start. January leads over the Great Basin and the Central Plains, while February brings the main snow signal to the Southwest, the South, and toward the East.
March stands out over Colorado, southern Wyoming, and western Nebraska, extending the snow season into early spring. Grey areas show where no month is forecast to be above normal, which covers most of the northern United States and the southern half of Canada.
Below is also a regional summary using the two main seasonal models, ECMWF and UKMO. The first two columns show the snowfall forecast from the last two runs, and the change column shows how much the forecast moved in the latest run. The last column shows the winter total trend and whether both models agree on more or less snow than normal.
The biggest change is over the Northeast, where the latest run added 2.9 inches compared with last month. But despite the increase, the winter total is still below normal in both models. The Ohio Valley and Central Midwest gained 2.7 inches and now show more snow in both models, with the Southern Plains and Texas also looking snowier.
Both the Northern Plains and Northern Rockies lost a bit of snow in the latest run. But the overall picture did not change, keeping the total winter snowfall above normal in the Plains and below in the Rockies.
The table below shows the same breakdown for Canada, with all values in centimeters. Three regions gained snow this run, but the winter remains below normal for Canada, a signature winter pattern of a Super El Niño.
But the impact of the Super El Niño will also be felt across other parts of the Northern Hemisphere.
Europe: Snow Outlook Update for Winter 2026/2027
For Europe, the snow outlook below shows a clear signal for a weak snow season across most of the continent. The below-normal anomalies cover nearly all of western, central, and southern parts, based on the average of six seasonal models.
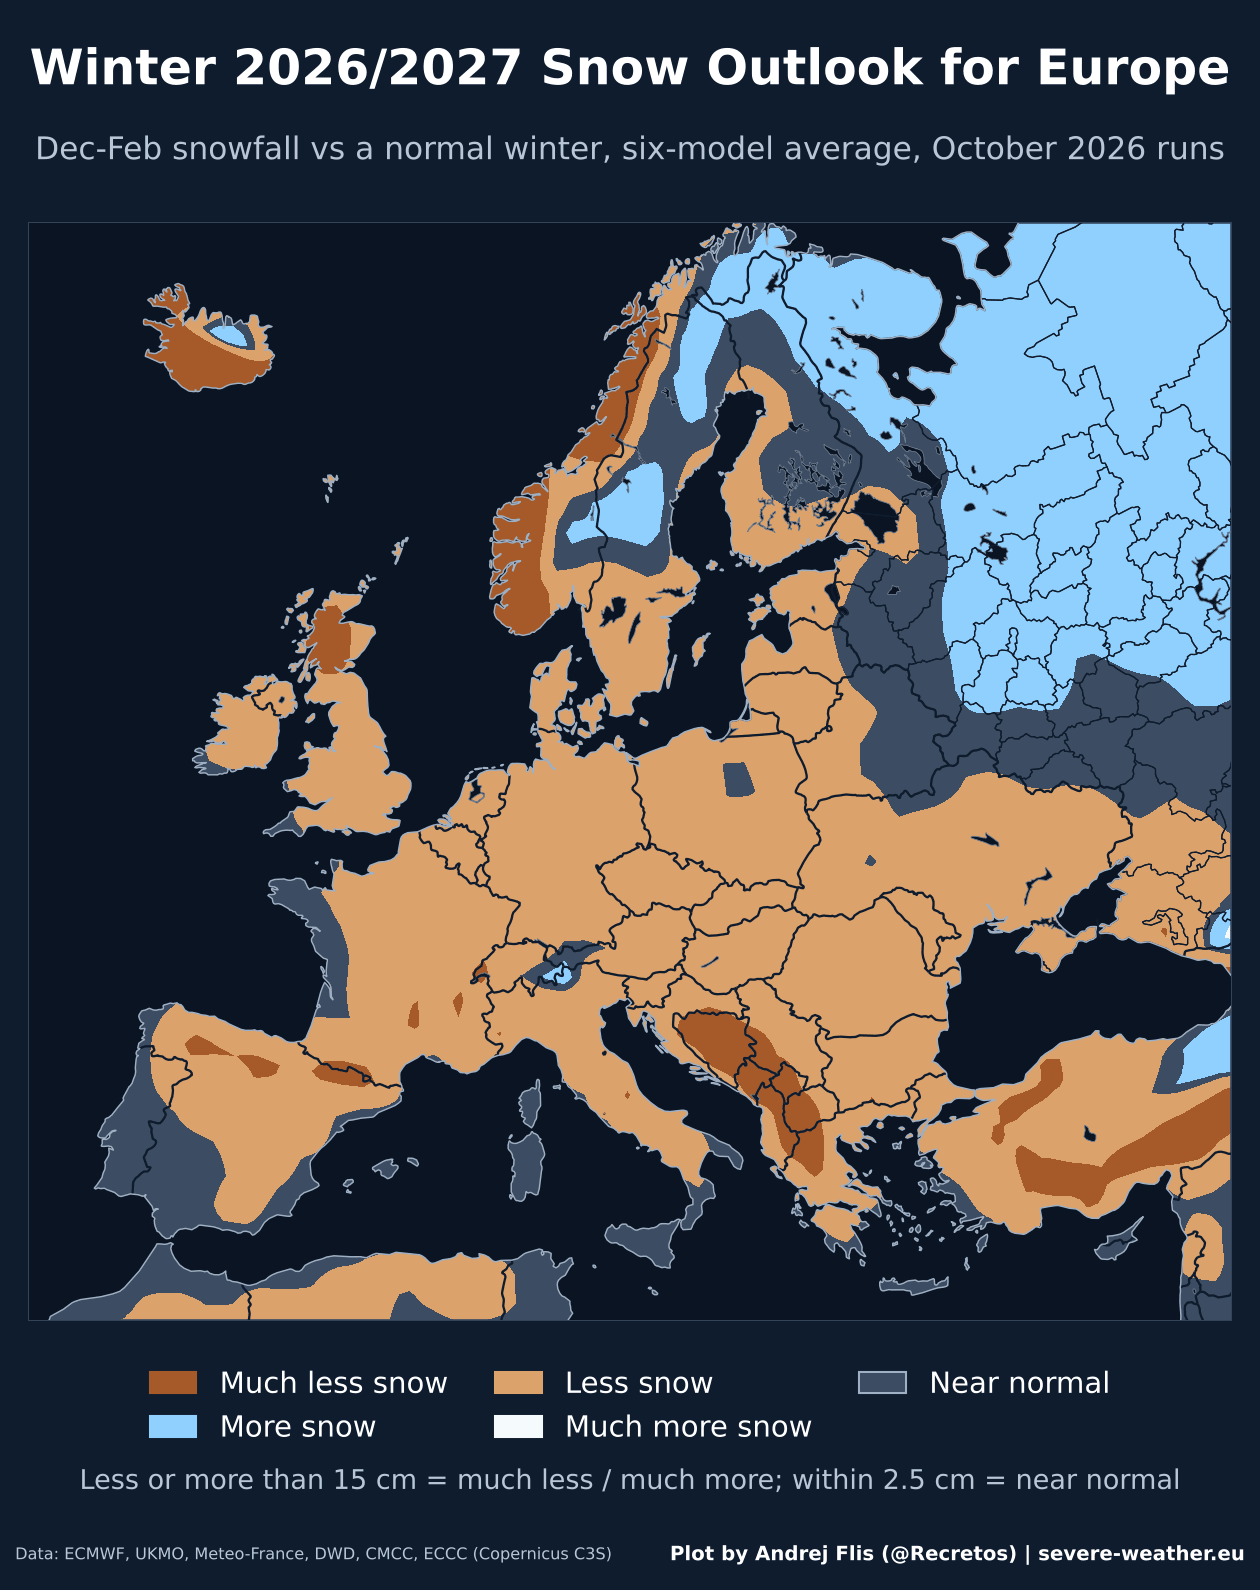
We can see the largest deficits are along the western coast of Scandinavia, in the northern UK, and over the western Balkans. Only the far northeast and small parts of the northern mountains show more snow than normal.
The snow timing map below shows when the peak snow is expected. Across most of western, central and southern Europe, no month is forecast above normal.
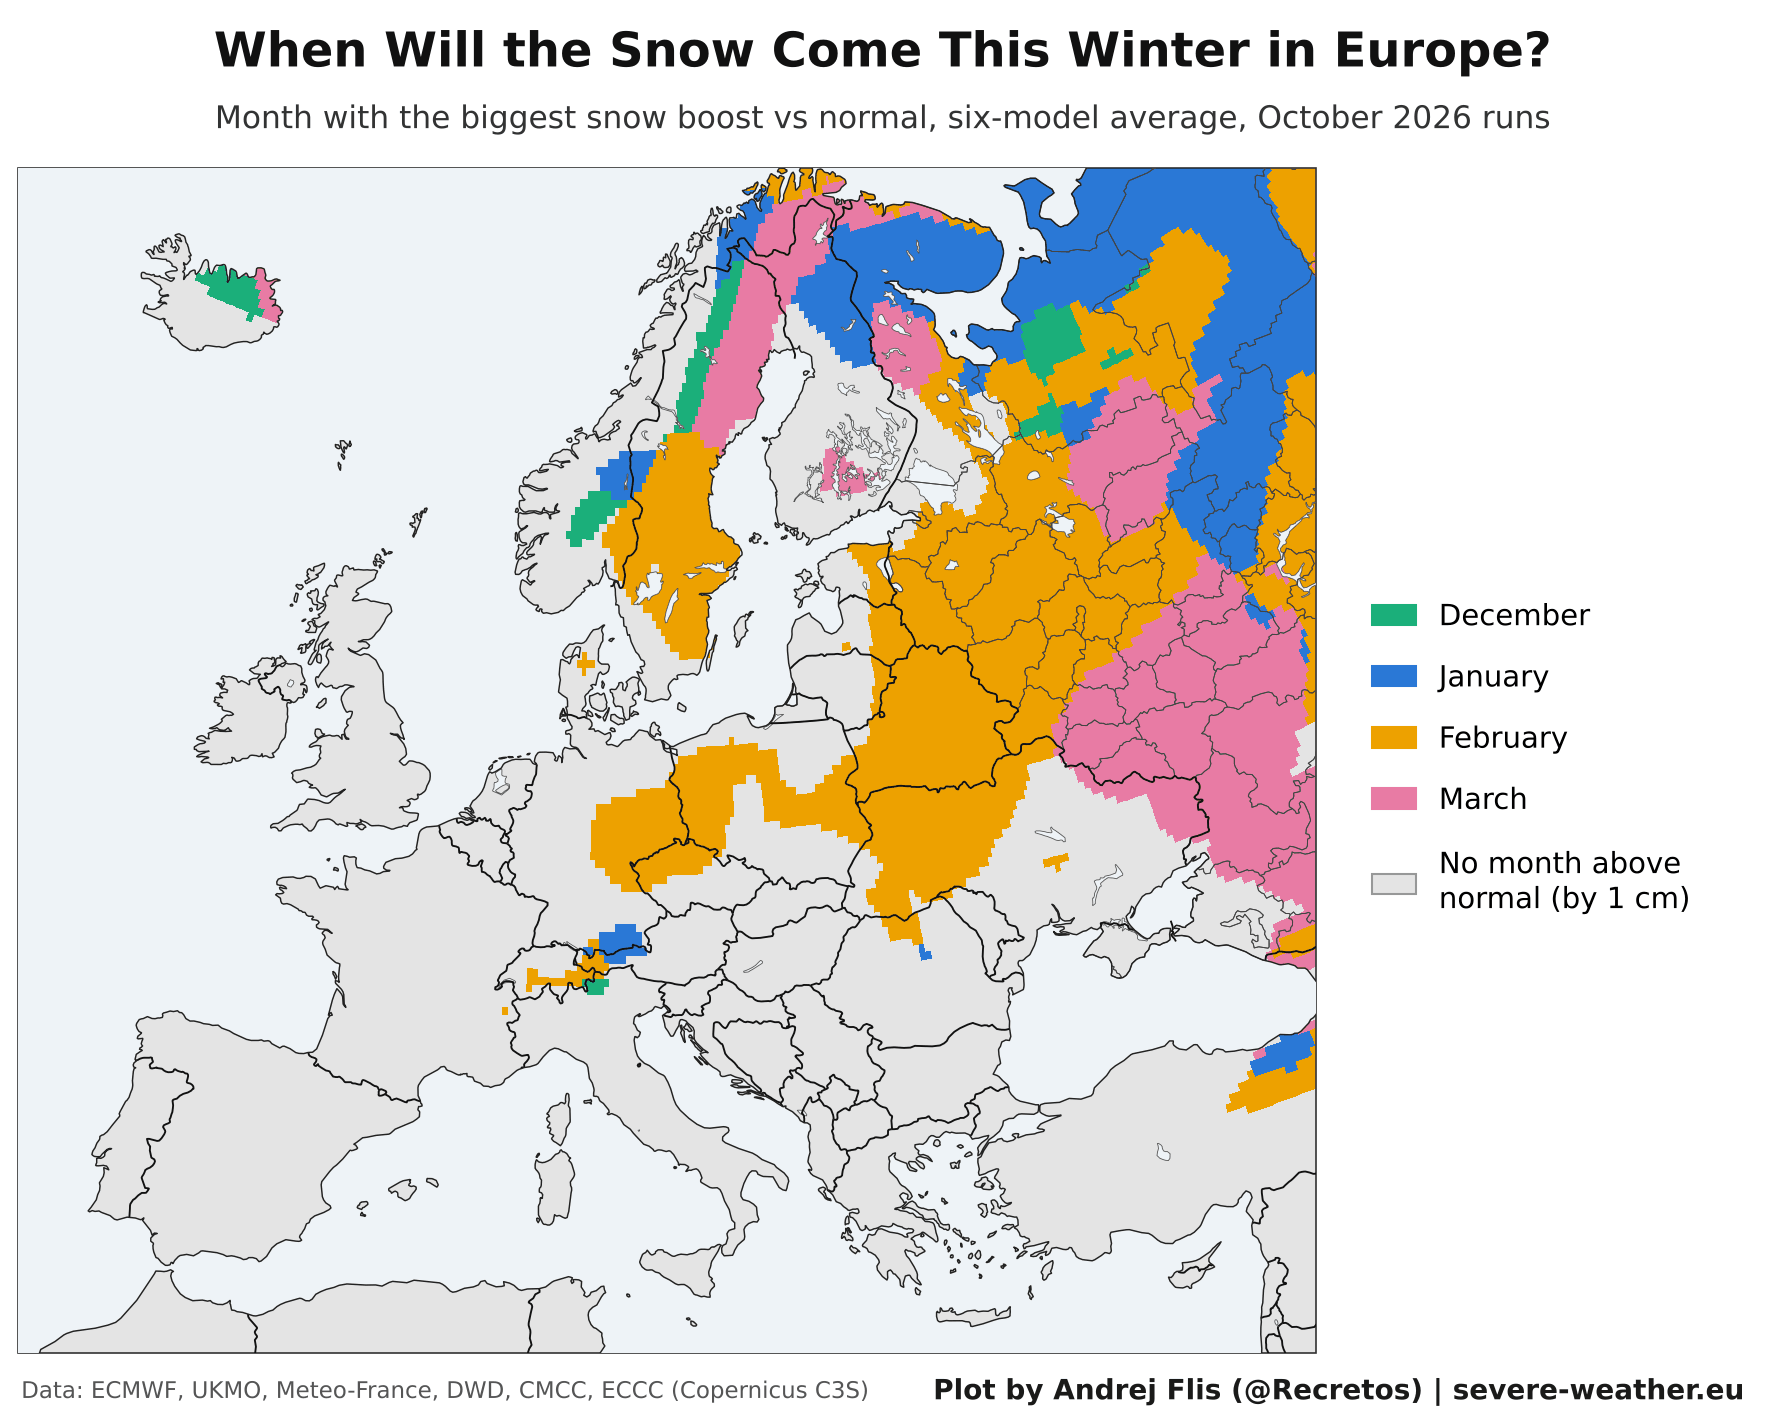
February stands out over a broad area from east-central to northeast, and parts of the north. March also shows above-normal conditions in the far north. This indicates that any snowier periods in Europe are more likely in the second half of winter, overlapping the peak seasonal cold.
The table below summarizes the European regions, showing how the forecast changed between September and October runs, and how both models agree on the winter total.
Every region lost snow in the latest October run. The largest drops are over the southern and central parts. In the last column, both models now agree that total snowfall will be below normal for all seven main regions.
For proper trend and snowfall signals, I prepared a full regional and state/country Snowfall Explorer below. There, you will be able to explore the detailed snowfall forecasts for each region of the United States, Canada, and Europe, on a seasonal or monthly breakdown.
Below the Snowfall Explorer, we also look at snowfall forecasts for major ski centers.
Winter 2026/2027 Snowfall Explorer for Your Region, State, Province, or Country
Besides the regular snowfall maps, the Snowfall Explorer also includes a two-panel view, with one panel showing the snowfall over time and the other showing it across the area. Below is a quick look at both parts, using the Northern Plains forecast as an example.
In the top panel, you can see snowfall accumulation for a specific region or individual state/country. This nicely reveals the snowfall forecast trend (red line) and when the forecast shows more/less snowfall during winter compared to the historical baseline (black line). In the example below, you can see an above-normal snowfall trend for the Northern Plains, from late January onward.
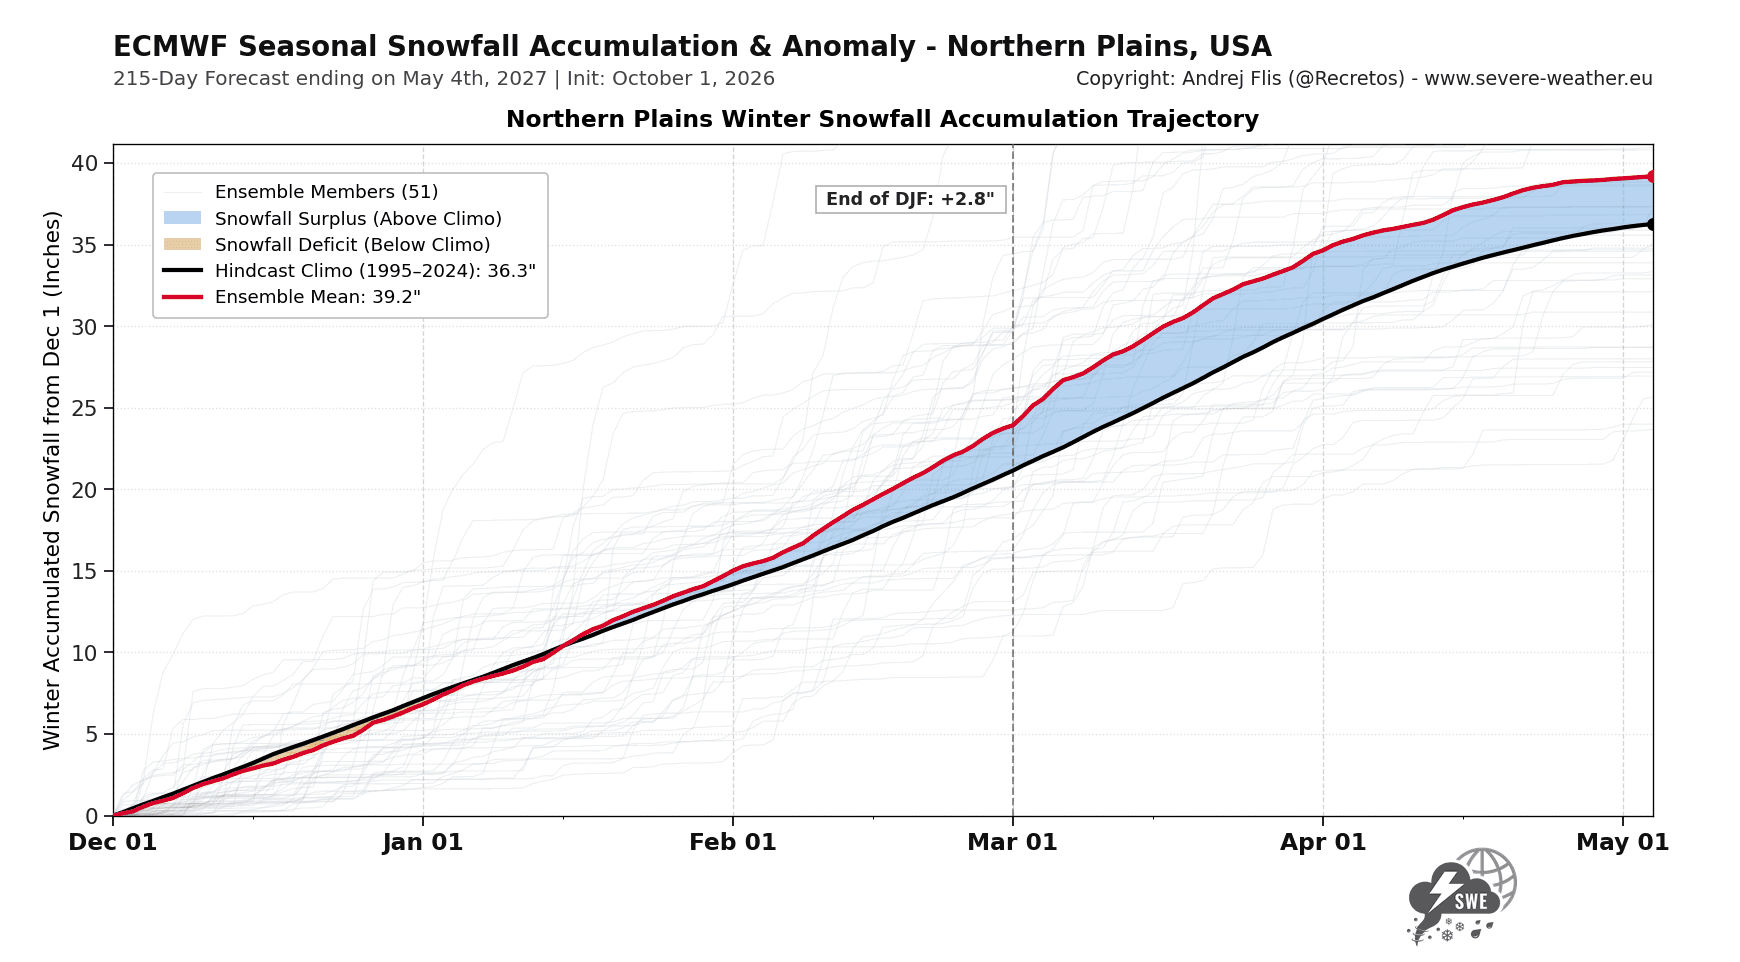
One important thing: Since this shows total snowfall, we have to know that if the graph goes flat, that means no new snowfall is forecast, even if it stays in an above-normal area. This is most evident in April, when some areas have a flat graph with no new snowfall, but the graph is above-normal, only showing the total snowfall since Dec 1st.
The bottom panel shows the full spatial view for the same period/region as in the graph. So while a graph can show above-normal snowfall for the whole region/state combined, there can be a part of the state still left with below-normal snowfall, which this map nicely reveals.
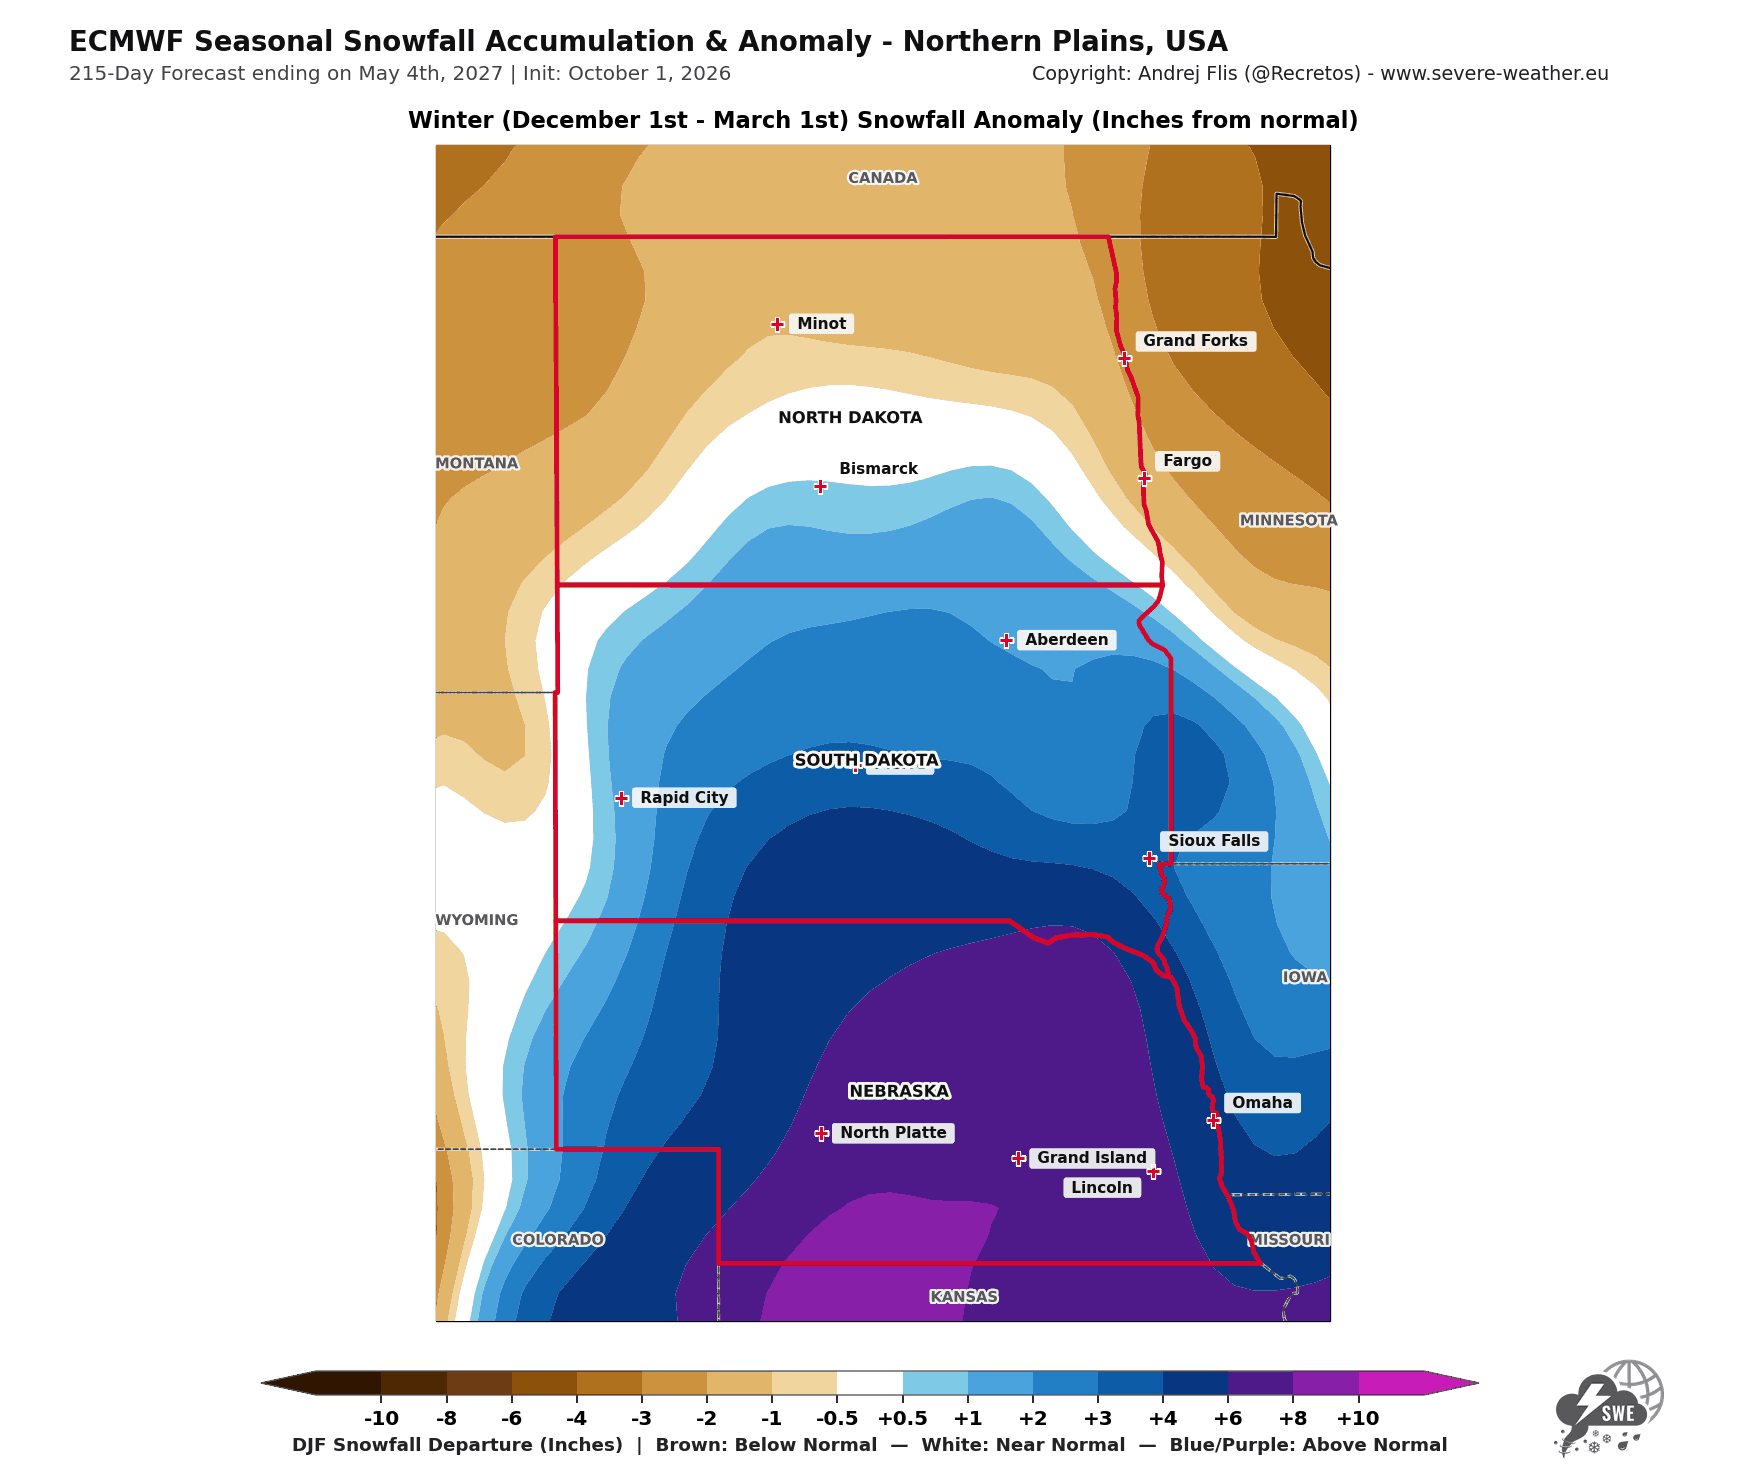
I will update the Snowfall Explorer monthly as we head into Winter 2026/2027, with a full regional and monthly breakdown. Note: Only the ECMWF model provides the top panel for the snowfall accumulation, as UKMO does not provide the required data. But both models provide a full area breakdown.
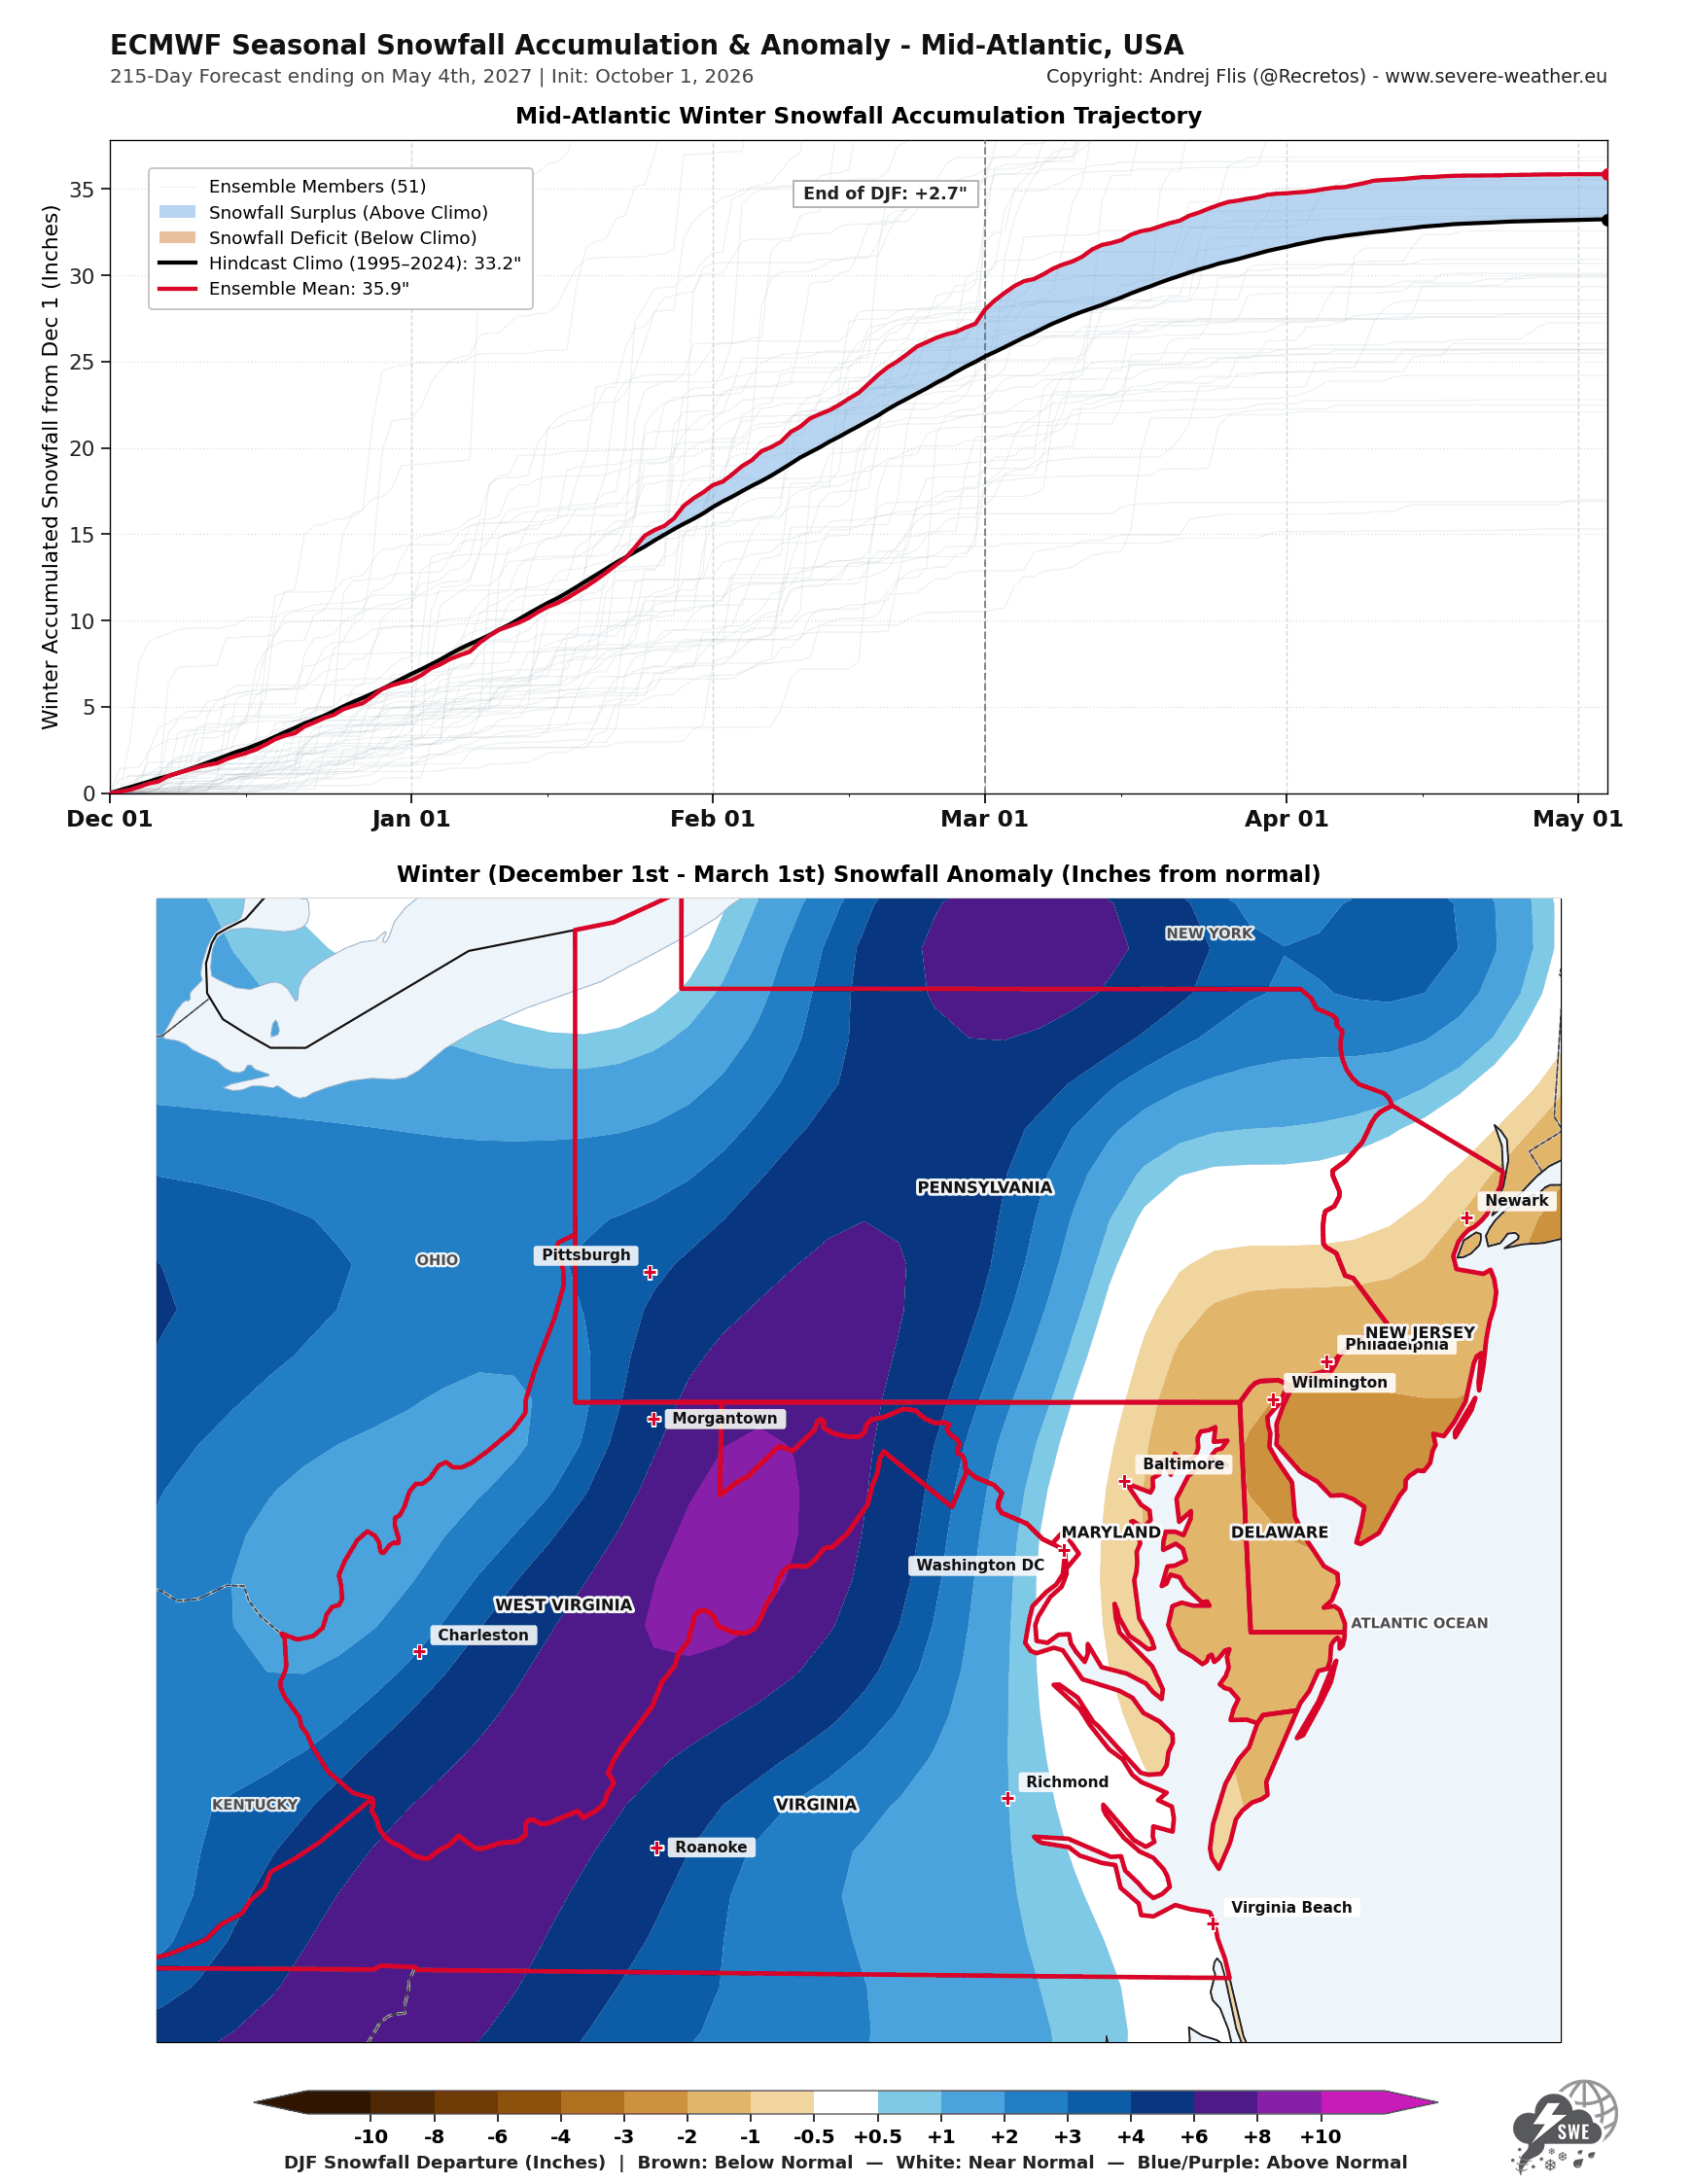
With a strong Super El Niño snow season approaching, this will also create a major redistribution of snow across all the main ski centers, which I analyzed below.
Winter 2026/2027 Ski Season Outlook: Winners and Losers
For skiers and snowboarders, the big question every fall is simple: will my favorite resort get a good winter? To find out, I calculated the winter snowfall outlook for the main ski areas across the United States, Canada, and Europe, using the October data from six seasonal models.
Keep in mind that these predictions run on a grid of around 100 km (60 miles). This means the values cover the wider area around each ski region, not the exact snowfall on the slopes. What matters is whether snowfall is trending above or below normal.
U.S. Ski Areas: The Southwest Wins Big With a Super El Niño
Below is the snowfall outlook for 16 ski areas across the United States, from the Southwest to the Northeast. You can see a clear north-south El Niño-forced split, with the southern ski areas under better conditions and the northern ones with an overall slow snow season. Again, the trend matters most, not raw numbers.
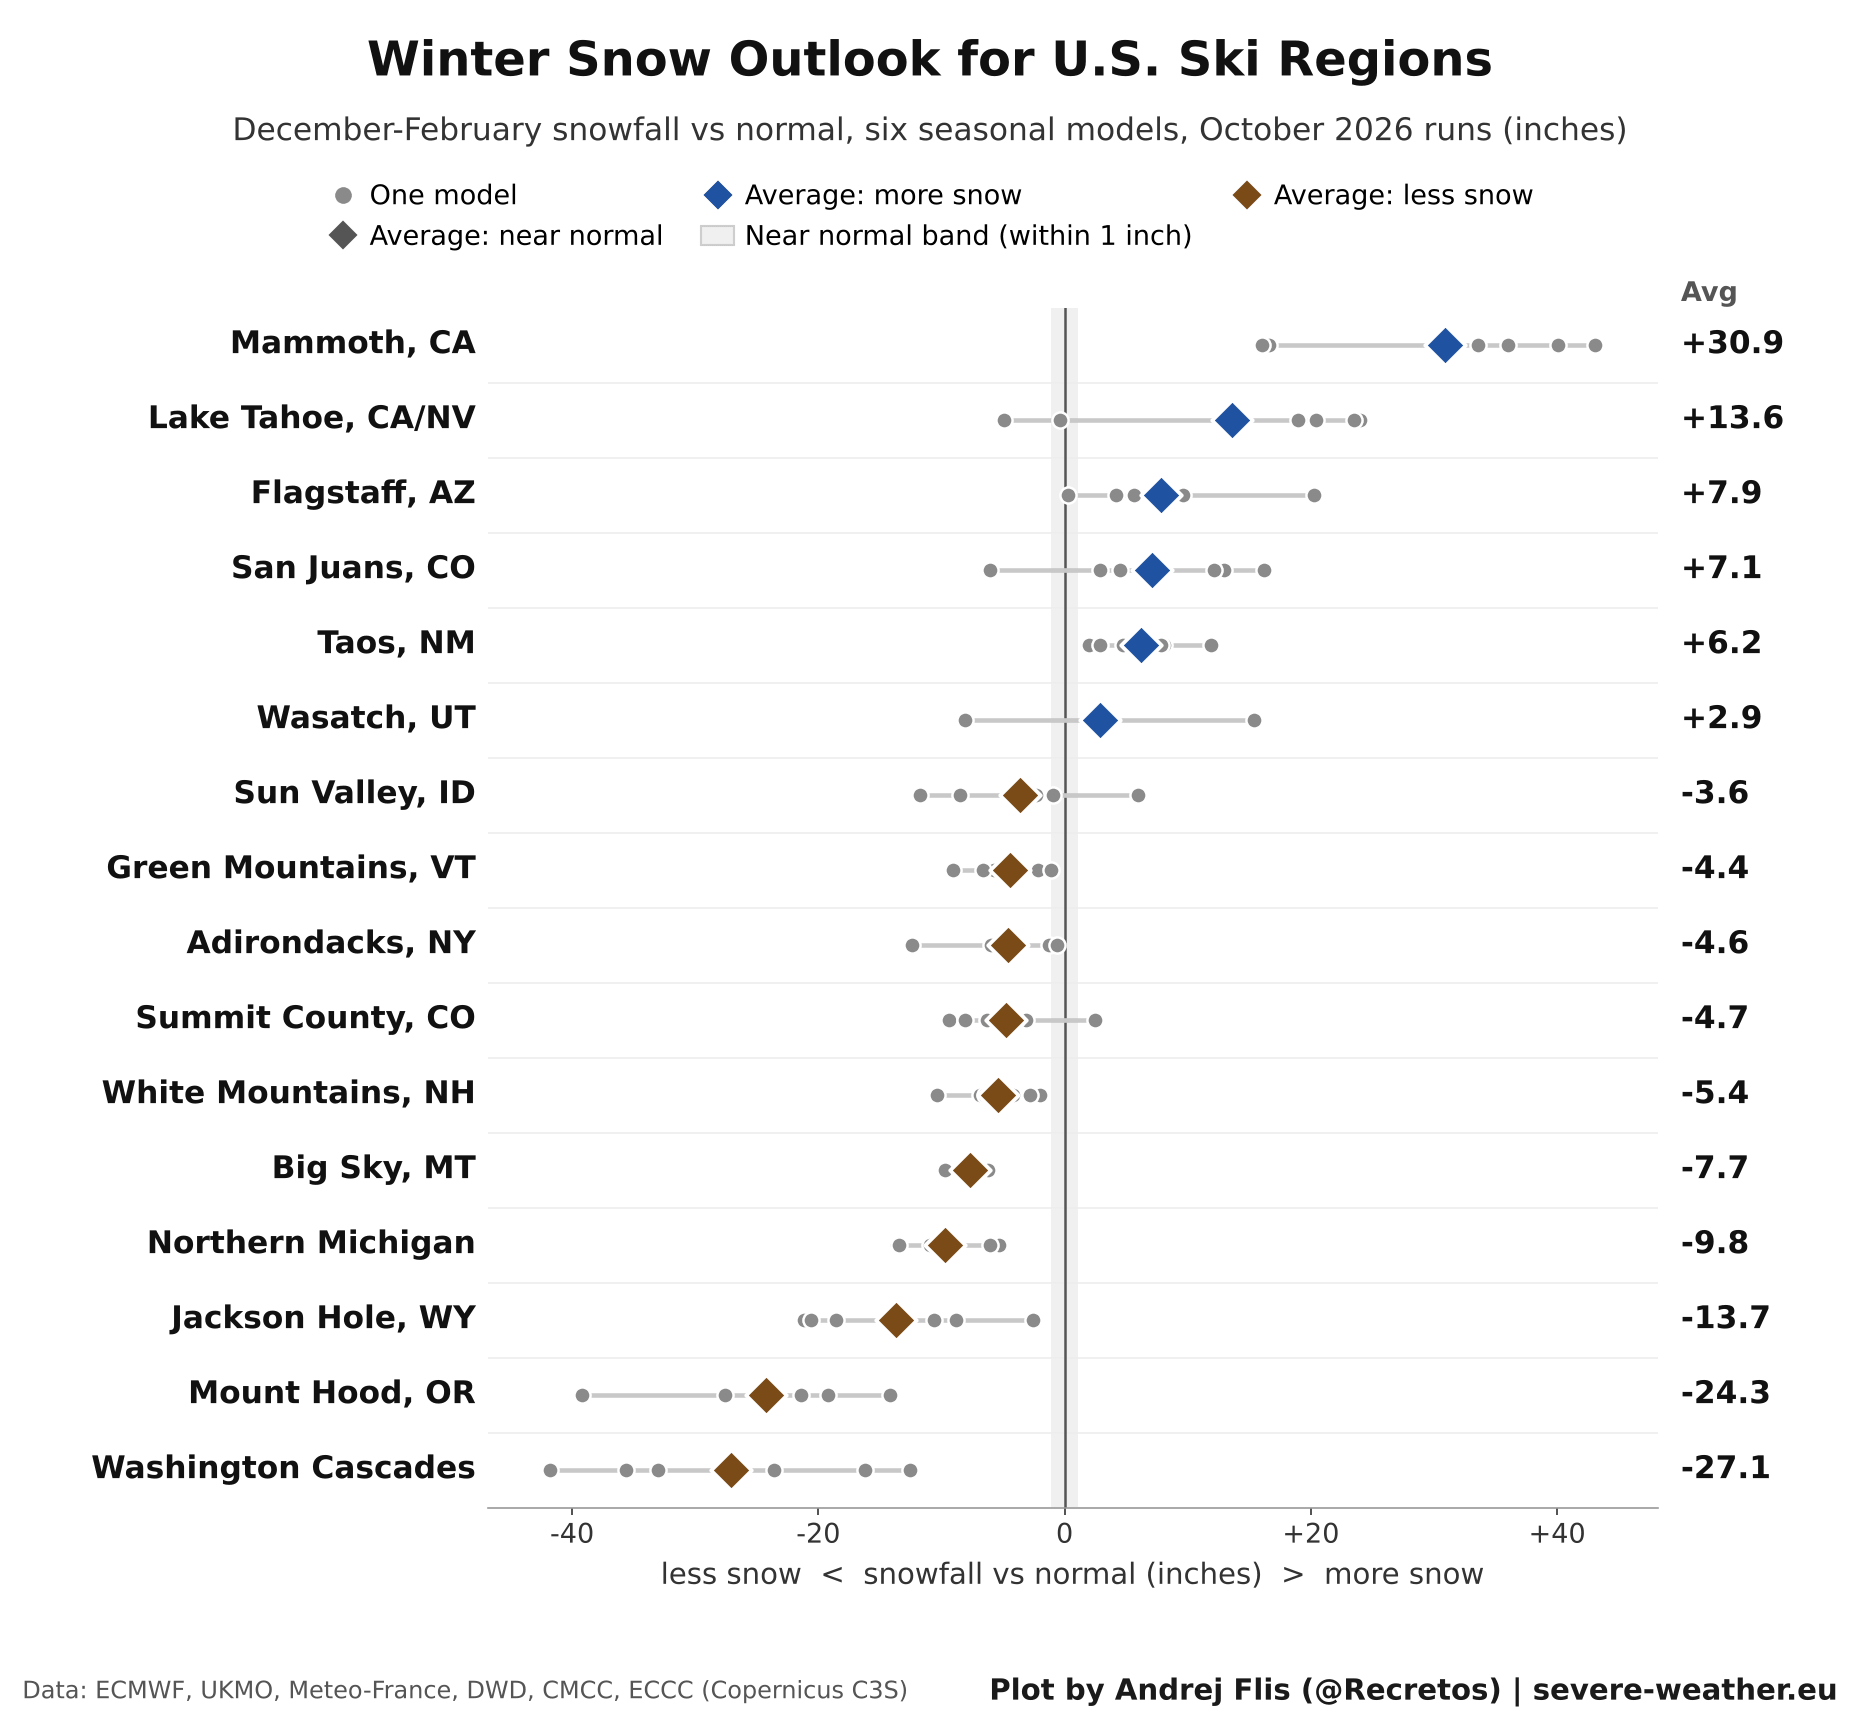
Mammoth leads the list with around 31 inches more snow than normal, and all six models agree it will have a good snow season. Lake Tahoe is on the snowier side with around 14 inches above normal, along with Taos, NM, the San Juan Mountains in southern Colorado, and the Wasatch in Utah.
As we can see, Colorado is split in two. The San Juans in the south are above normal, while Summit County in the north is on track for below-normal snow. This is a typical El Niño pattern, with the main storm track running across the southern Rockies.
The weakest snow season is forecast for the Pacific Northwest and the Northern Rockies. The Washington Cascades and Mount Hood are both more than 20 inches below normal, while Jackson Hole and Big Sky also show a clear deficit, with all six models in agreement.
In the Northeast, the Green Mountains, the White Mountains, and the Adirondacks are running around 4-5 inches below normal. This deficit is smaller than in the West, but still showing a below-normal snowfall season.
Canadian Ski Areas: A Weak Season in the Making
Below is the snowfall outlook for the main ski regions across Canada, from British Columbia to Newfoundland. Unlike the United States, there is no clear winner here, as every ski region is forecast below normal this winter, due to the Super El Niño impact.
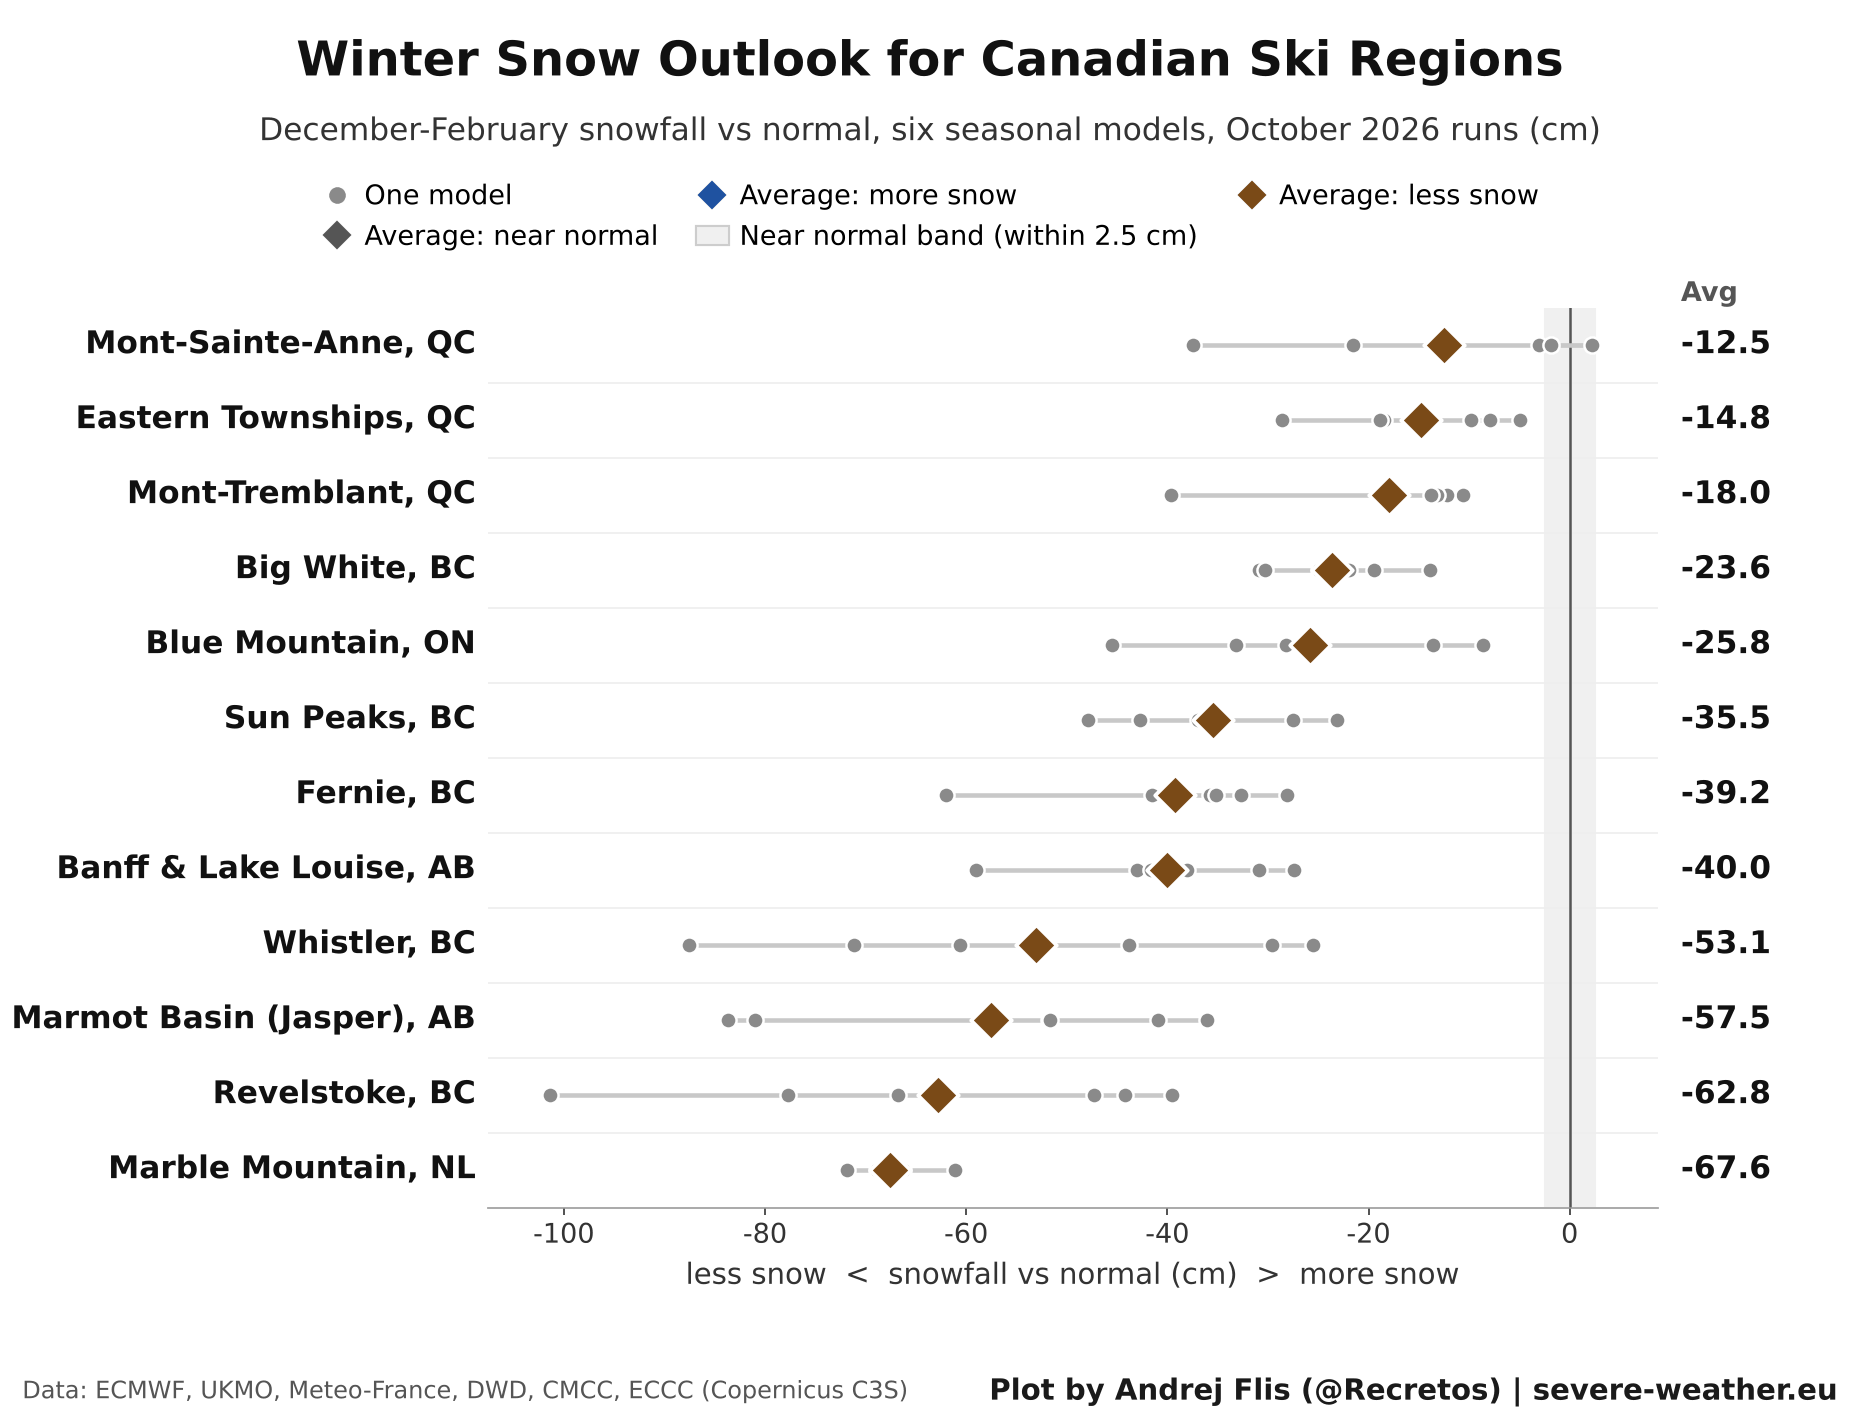
The western mountains face a very weak snow season. Revelstoke, Marmot Basin and Whistler are all more than 50 cm below normal, while Banff, Fernie and Sun Peaks deficit is around 35 to 40 cm.
In the east, Marble Mountain in Newfoundland shows the largest deficit, close to 68 cm. Quebec looks best, with Mont-Tremblant, the Eastern Townships, and Mont-Sainte-Anne around 12 to 18 cm below normal.
European Ski Areas: A Slow Snow Season
Below is the snowfall outlook for some of the larger ski regions across Europe. Most areas show a below-normal snow signal due to El Niño, but the Alps stand out for a different reason.
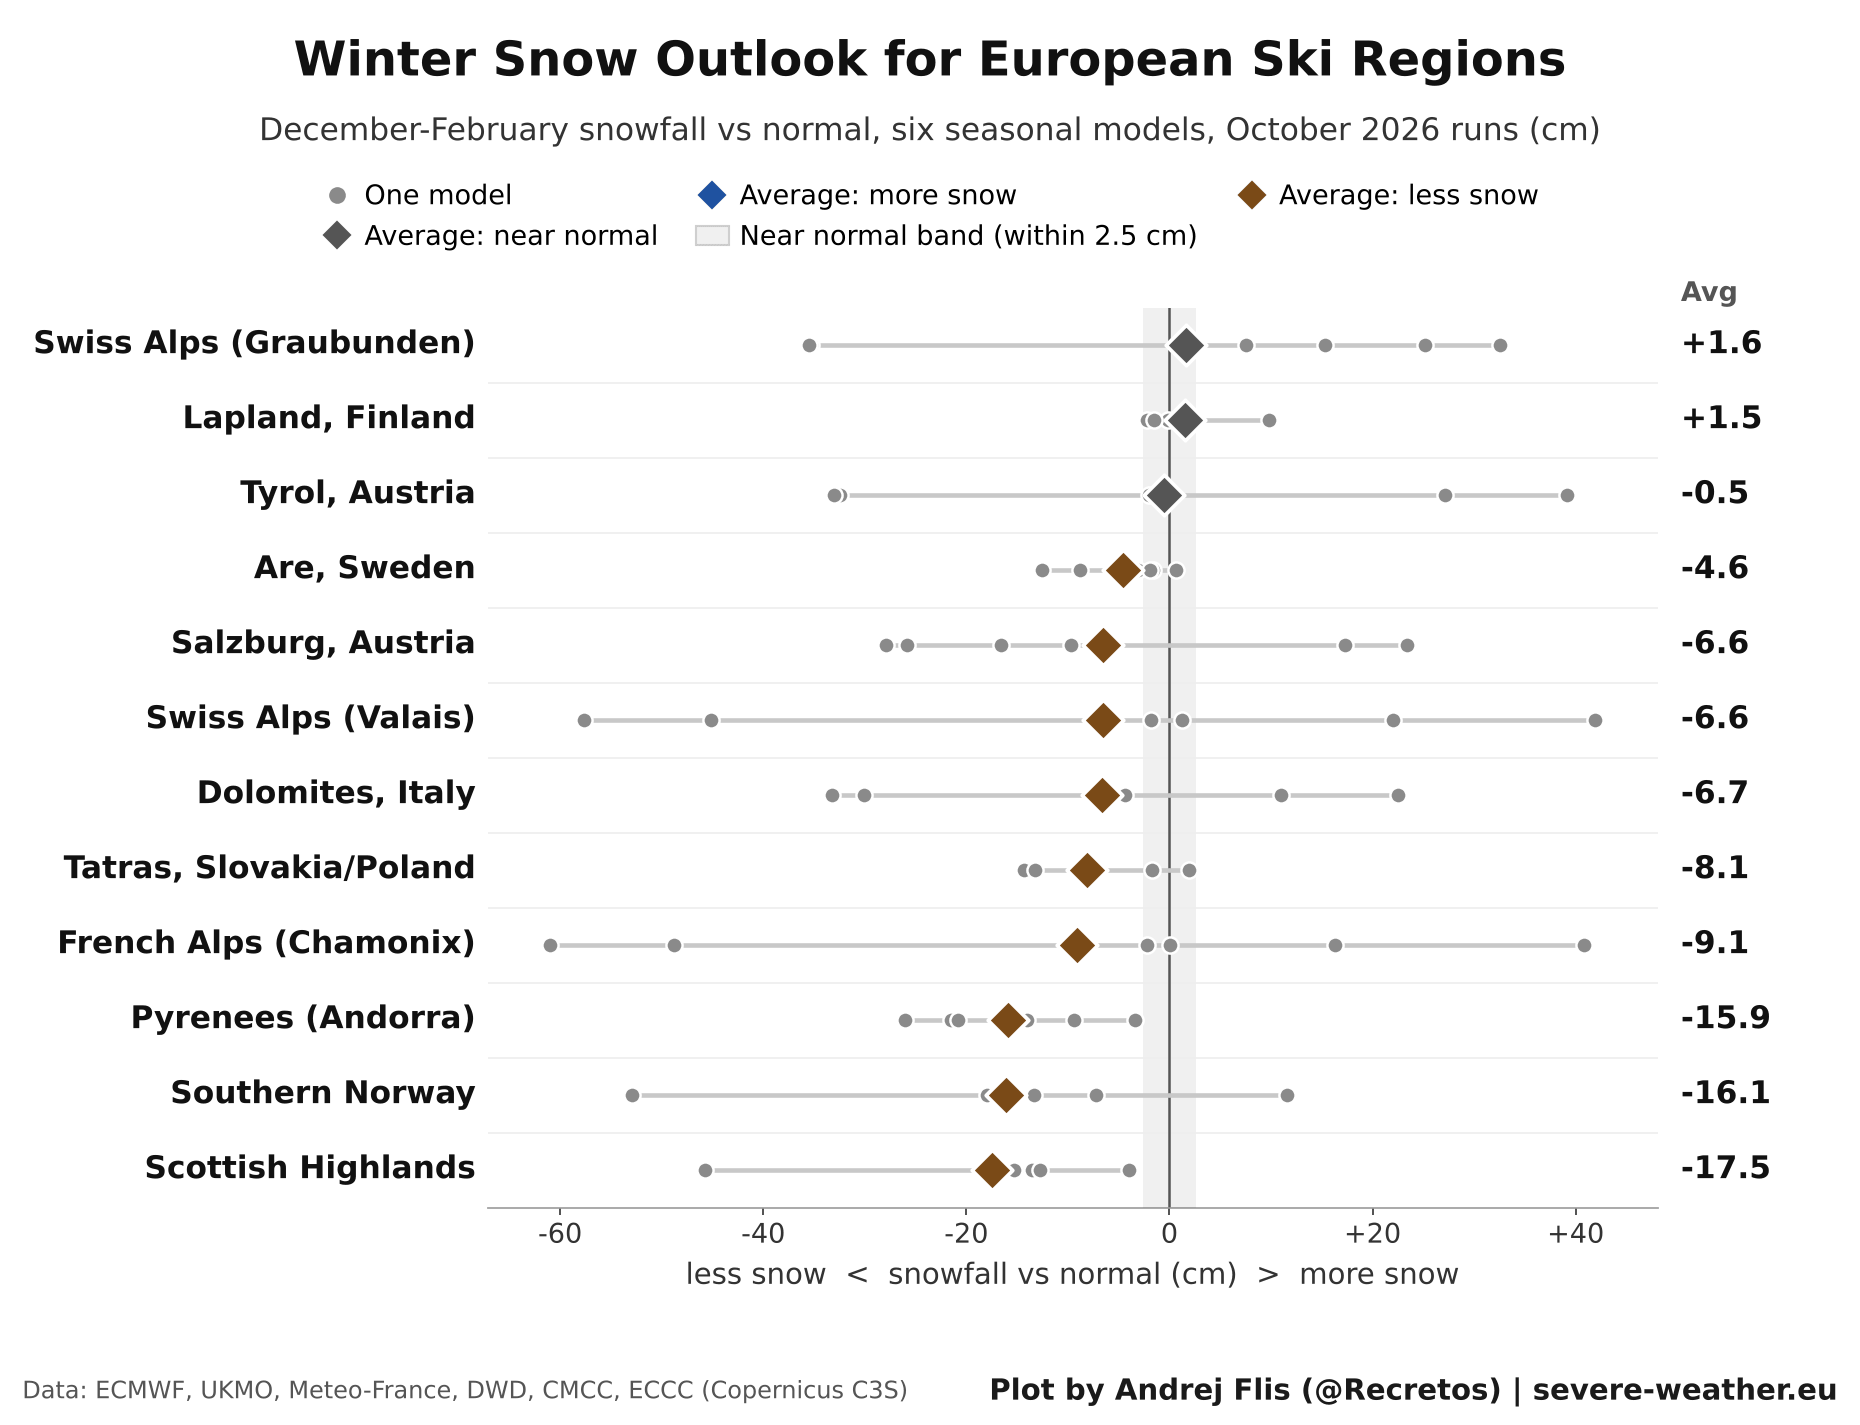
Over the Alps, the six models strongly disagree, ranging from over 30 cm more snow than normal to a deficit of 30 to 60 cm. This leaves the average near normal in the eastern Alps and slightly below in the west, with very low confidence in the total snow.
Winter 2026/2027 Snowfall Forecast: Key Takeaways
- Six seasonal models now agree on the Super El Niño snow pattern, with more snow from California across the Southwest and into the Central and Southern Plains, and into the South and the Southern Appalachians.
- Less snow is expected for the Pacific Northwest, the Northern Rockies, the Great Lakes and the Northeast.
- The Ohio Valley is now snowier in the two main models, after a near-normal signal in September.
- December starts slowly, while January and February bring the main snow signal, with March extending the season over the Central Rockies and Plains.
- For skiers, the Southwest is the big winner, while the Pacific Northwest, the Northern Rockies and western Canada face a low-snow season.
- Canada and most of Europe are forecast below normal, with the Alps remaining the most uncertain region in the models.
I also prepared a short video recap, seen below. It shows the main forecast points from October 2026, including the multi-model forecast and various snow tables.
Another important wildcard for the upcoming winter will be the Polar Vortex. A disruption later in the season could bring colder air and more chances of snow to the regions currently forecast to be below normal, as I covered in my October winter forecast update. I will follow its development closely in the coming weeks.
Peer-Reviewed Research Used in This Article
- El Niño and U.S. Winter Snowfall: How Well Do Seasonal Climate Anomalies Match Expected El Niño-Southern Oscillation (ENSO) Impacts? - L'Heureux et al. (2024).
- Strong El Niño and Extreme Snowfall: Trends in Twentieth-Century U.S. Extreme Snowfall Seasons - Kunkel et al. (2009).
Don't miss: Can October Snow Predict Your Winter? I Tested a Famous Forecast Signal Across 47 Winters
We will keep you updated on the global weather pattern development, so don't forget to bookmark our page. Also, if you have seen this article in the Google App (Discover) feed, click the like or the star button there to see more of our forecasts and our latest articles on weather and nature in general.