The new November snowfall forecast for Winter 2026/2027 added snow across a large part of the United States, from the West and the Plains to the Mid-Atlantic and the Northeast. Only one region saw a clear drop in this run, while southern Canada and most of Europe still face a weaker snow season.
The latest data also gives us a first look at Christmas week, showing where fresh snow is most likely in late December across the U.S., Canada, and Europe.
Below, I look at what changed in the new forecast, the snow outlook from six seasonal models, the forecast for the main ski areas, and a Polar Vortex signal that could matter for snow in mid-winter. You can also check the snow outlook for your own state, province, or country in the updated Snowfall Explorer.
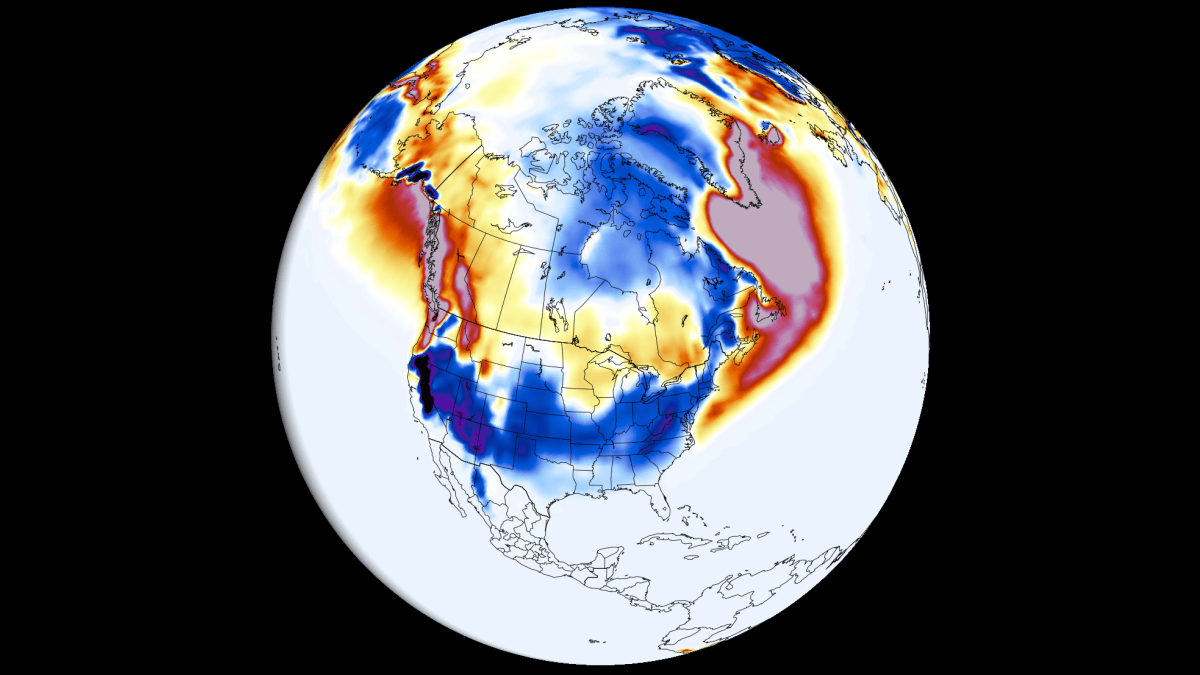
What Changed in the November Snowfall Forecast
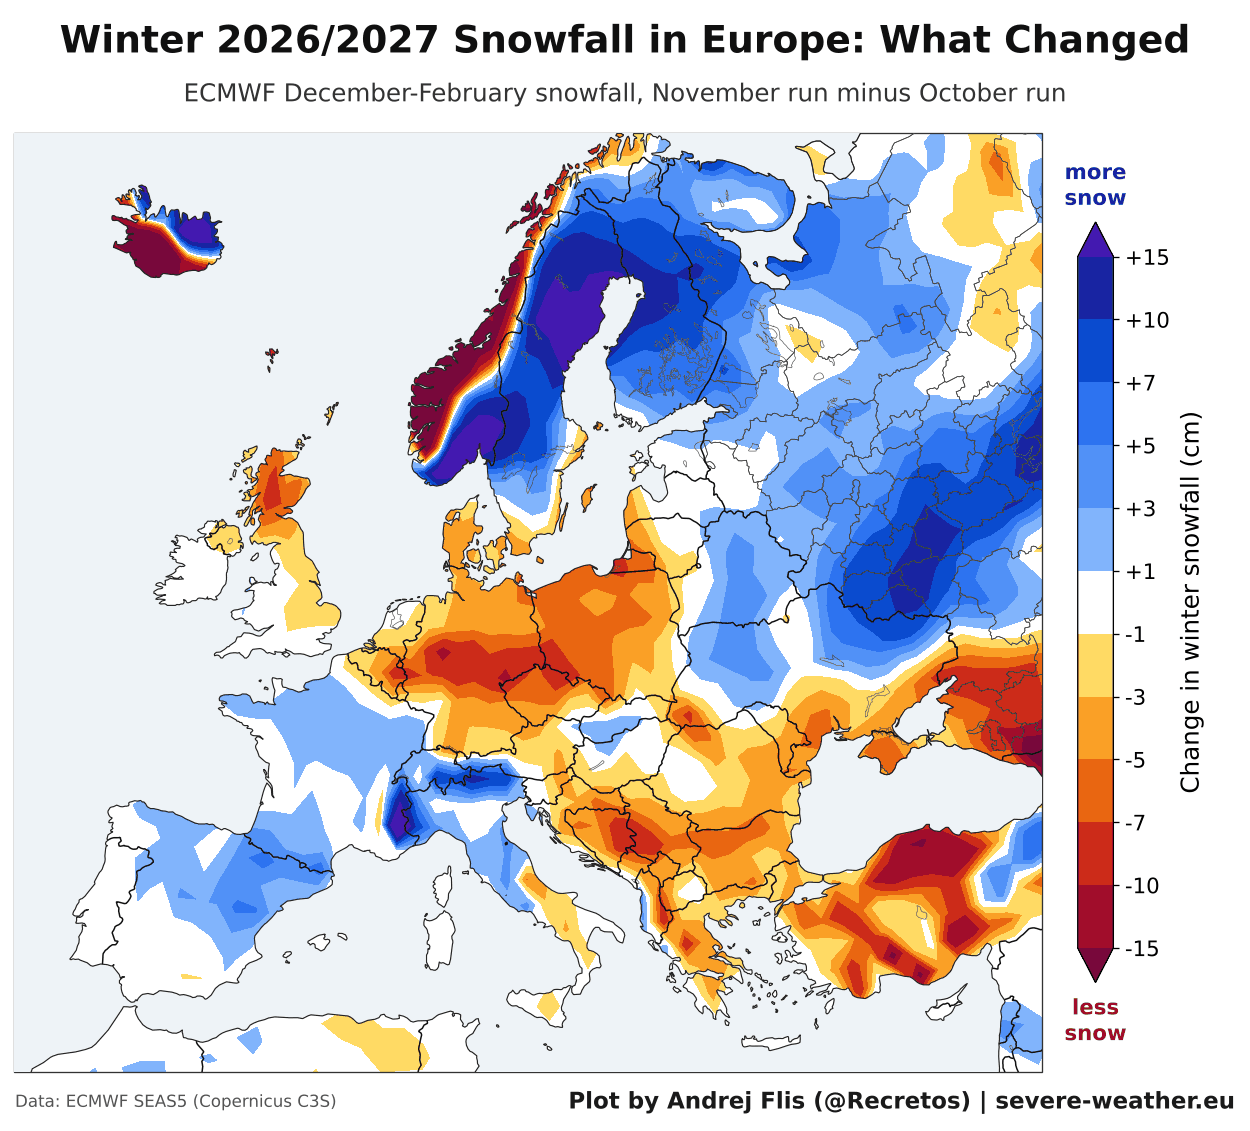
The images below show the latest ECMWF snowfall forecast change from the October run to the new November run. Blue shows where the new run has increased snowfall, and brown shows where it has reduced. This is not the actual snowfall amount forecast, but the change in the winter snowfall trend since the previous data, and where the forecast is trending.
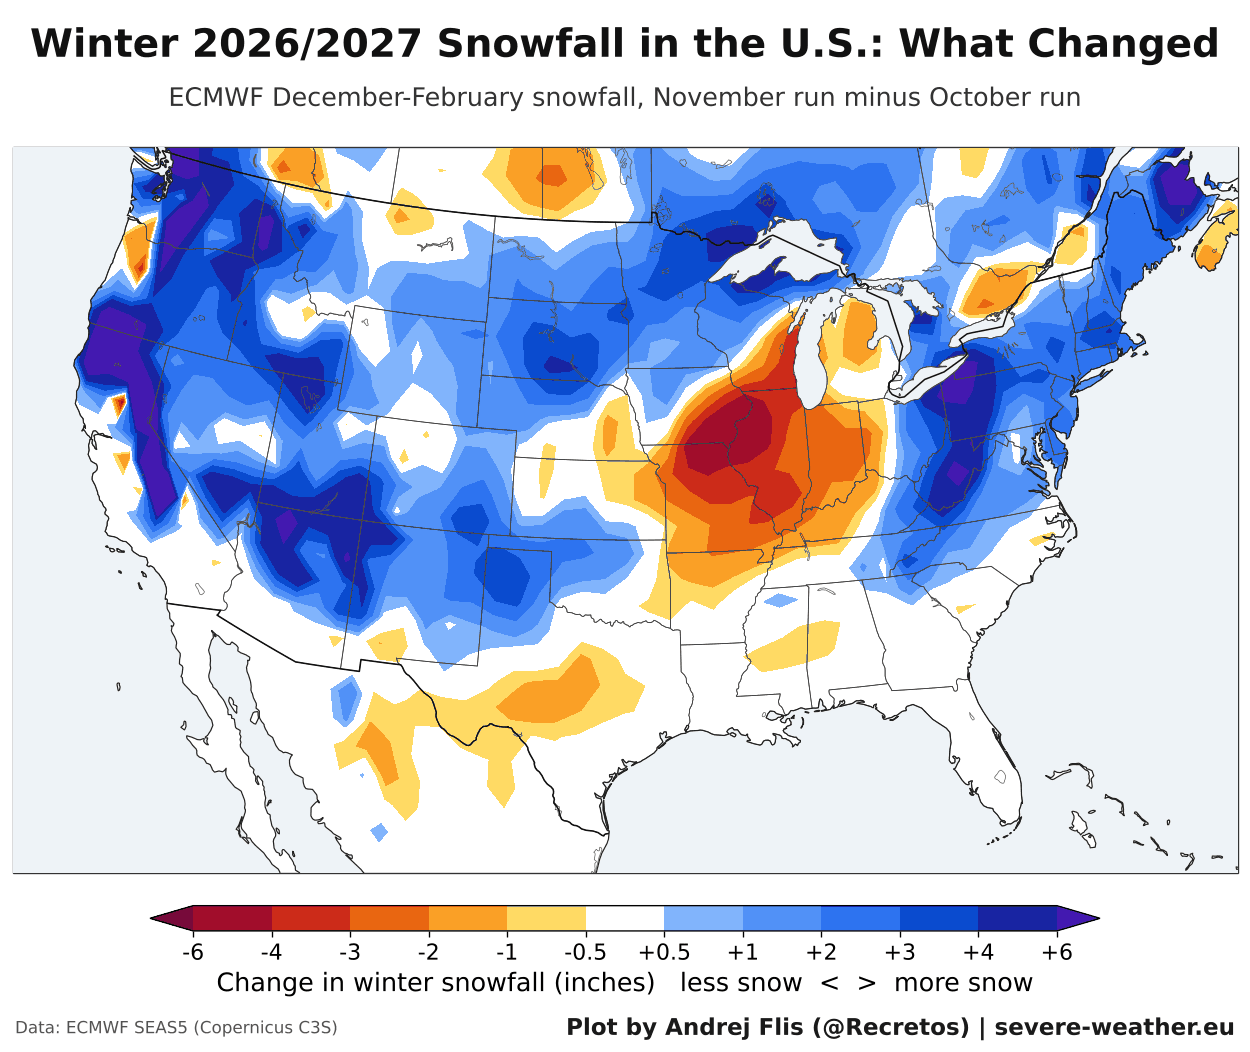
You can see that the latest run added snow across much of the western United States, from the Pacific Northwest and California into the Great Basin, and over the central and northern Plains.
Another strong increase runs along the Appalachians, from the Mid-Atlantic into the Northeast. The main exception is the central Midwest, where the latest run removed a few inches of snow around Missouri, Iowa, and Illinois. A slight reduction is also seen over parts of Texas.
To make the change easier to read, I averaged it across the main U.S. regions to show the actual change. The bars show how much snow each region gained or lost since October, and the numbers on the right show where each region now stands relative to a long-term normal.
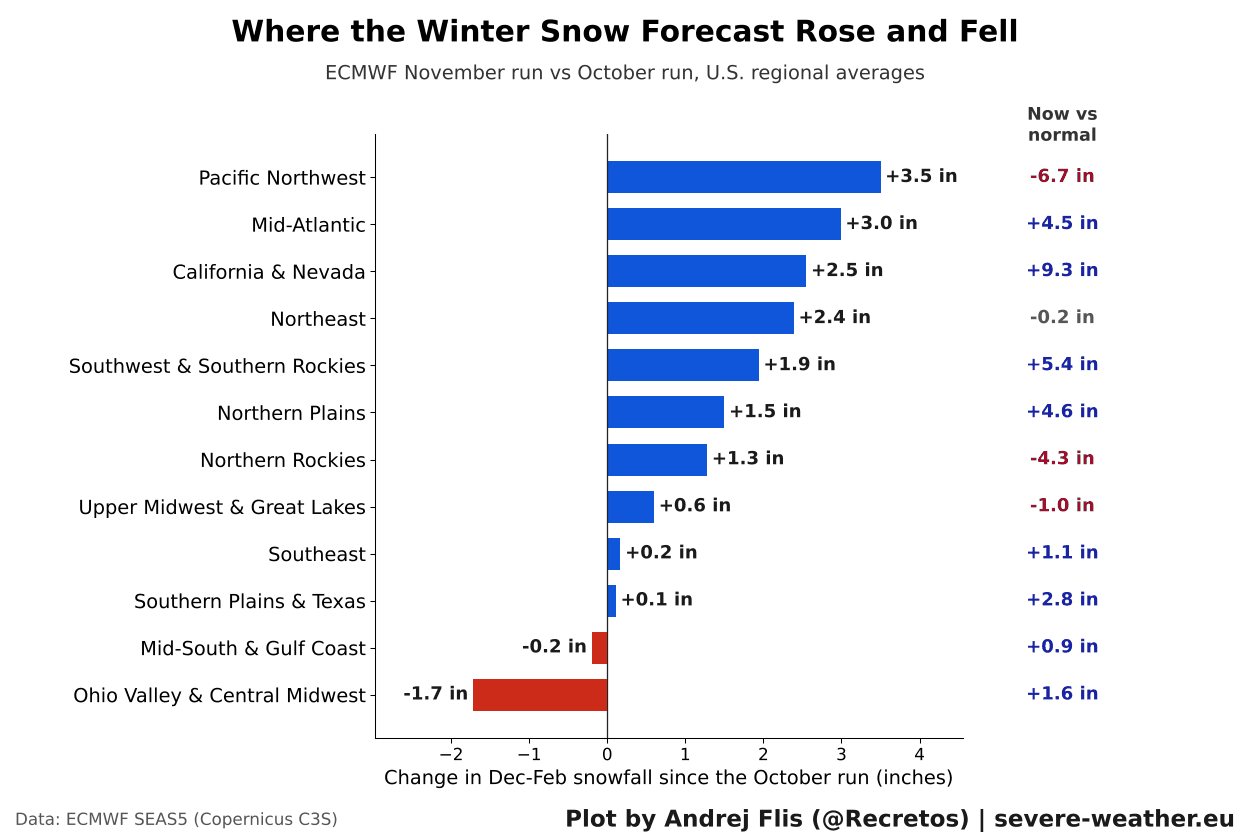
The largest gains are in the Pacific Northwest (+3.5 inches), the Mid-Atlantic (+3.0 inches), California and Nevada (+2.5 inches), and the Northeast (+2.4 inches), which is now in its 3rd consecutive increase and getting close to normal overall. The Ohio Valley is the only region with a clear drop, losing 1.7 inches. Even so, it remains slightly above normal in the latest run.
A gain still doesn’t mean a very snowy winter. The Pacific Northwest is still close to 7 inches below normal despite a large increase this run, so this just reduced the snow deficit.
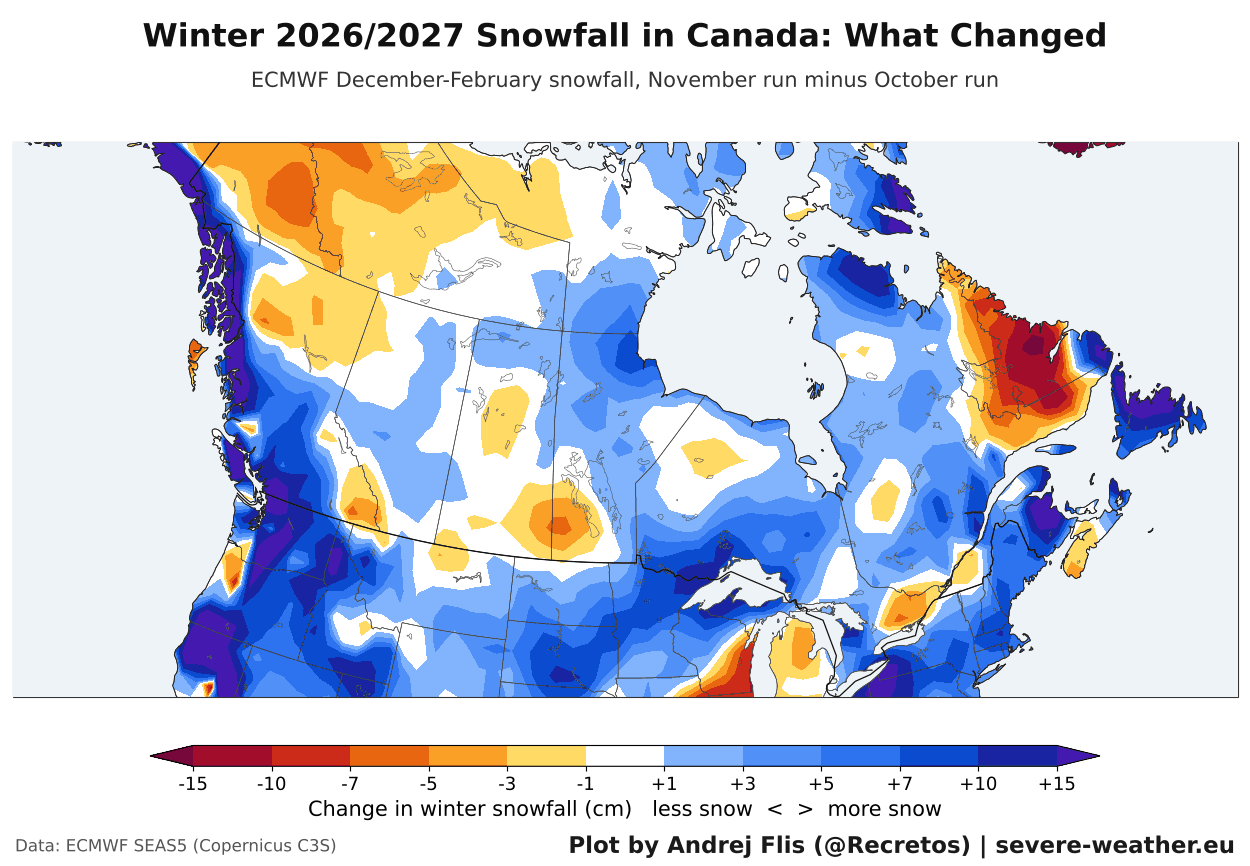
The latest run also added snow along the coast of British Columbia, around the Great Lakes, across southern Quebec and over Newfoundland. Overall, British Columbia gained around 6 cm and Ontario around 3 cm of snow, while the Prairies did not change. Less snow than in the October run is seen over Labrador and parts of the far northwest.
In Europe, the new run added snow over the north and northeastern parts of the continent, and a little over the west and southwest. It also removed snow over east-central, south-central, and southeastern parts, and over the UK, with the strongest reduction along the western coast of Scandinavia.
The main driver behind the weather patterns and snowfall this season will be the strong El Niño event in the Pacific. We can use snow data from past similar events as a guide for what usually occurs in these seasons.
How a Super El Niño Impacts Winter Snowfall
The latest Pacific Ocean analysis below from NOAA CRW data shows the significant El Niño warm area. Peak ocean anomalies are found in the eastern parts, reaching over 7°C above normal (12.6°F) across a large area. Based on raw anomalies, this is the strongest El Niño in at least 70 years.
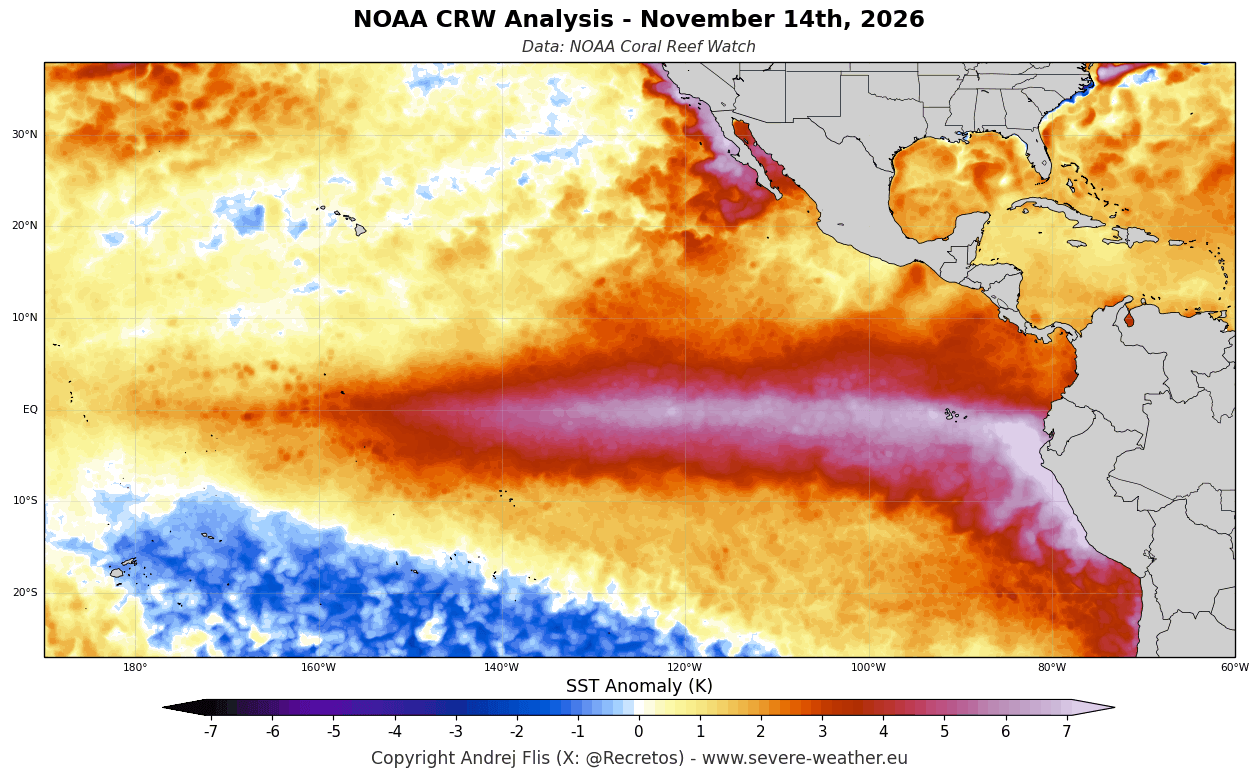
A strong El Niño tends to bring an extended Pacific jet stream, with lower pressure, cooler temperatures, and more moisture across the southern United States. This alters the snowfall potential across the central, southern, and eastern United States, depending on cold air access.
Below is a composite I produced from ERA5 data, showing average winter snowfall anomalies in the past 4 Super El Niño events. Above-normal snowfall (blue) occurred across the Sierra Nevada, the Four Corners, the Southern Rockies, and parts of the Central Plains and the upper Midwest.
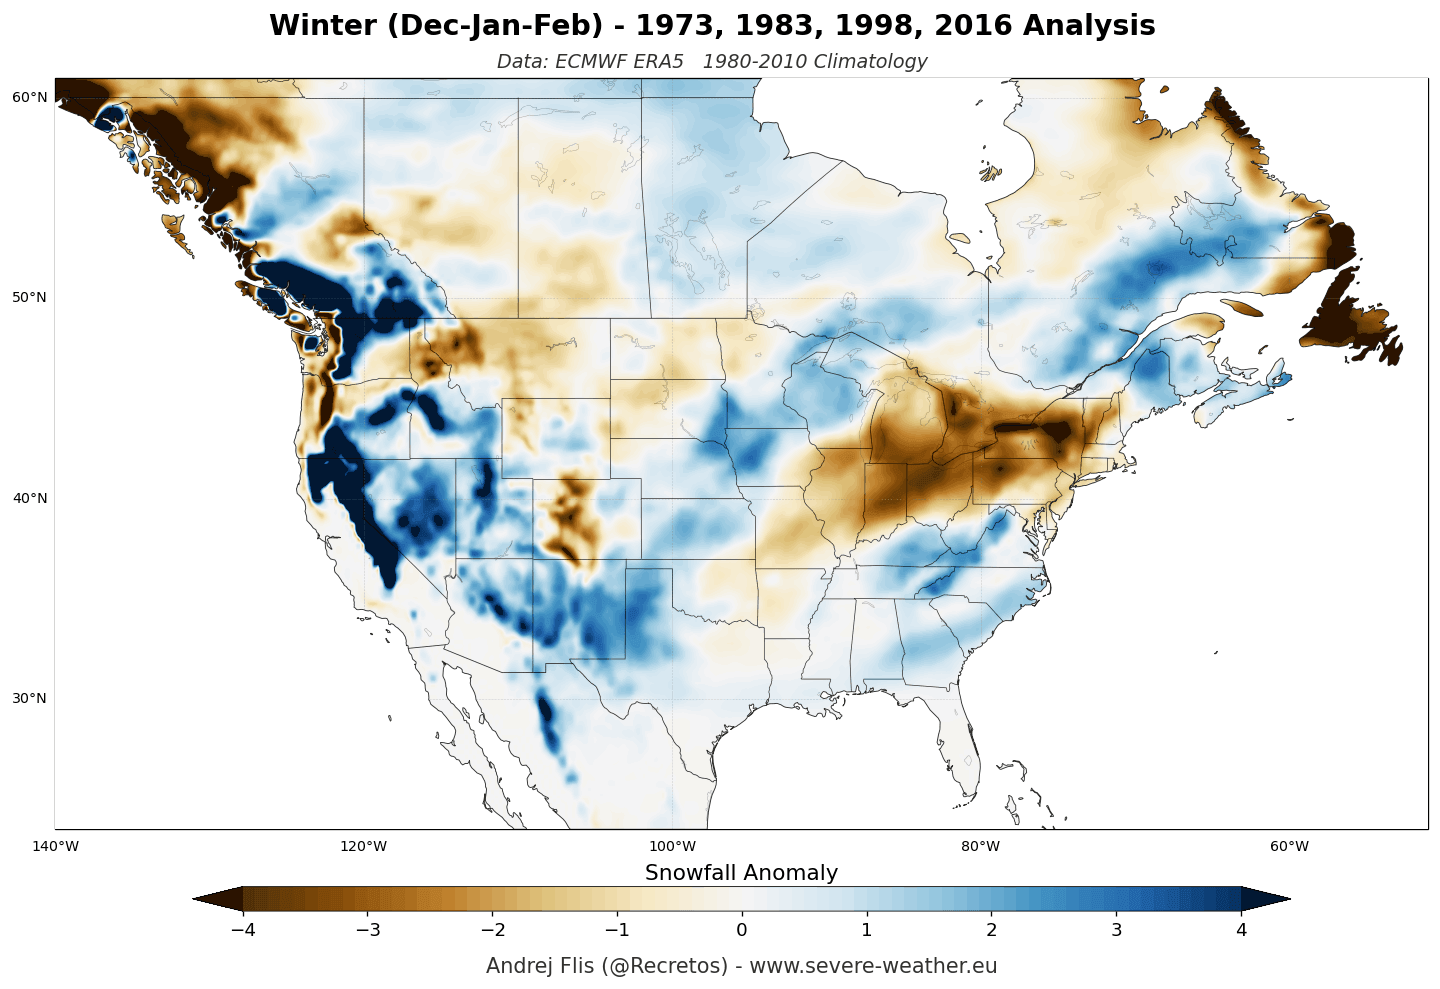
Large snowfall deficits (brown) were recorded over parts of the Pacific Northwest, the northern Rockies, the Great Lakes, the Ohio Valley, and the Northeast. This shows that even with a good jet stream position, the warm Canadian ridge limits cold-air intrusions and suppresses sustained northern storm tracks.
A Super El Niño also tends to reduce snowfall over a large part of Europe, except to the north and northeast. The main reason is a mild westerly flow from the Atlantic and a rising southerly ridge, keeping temperatures too high to support widespread snow cover except at higher elevations.
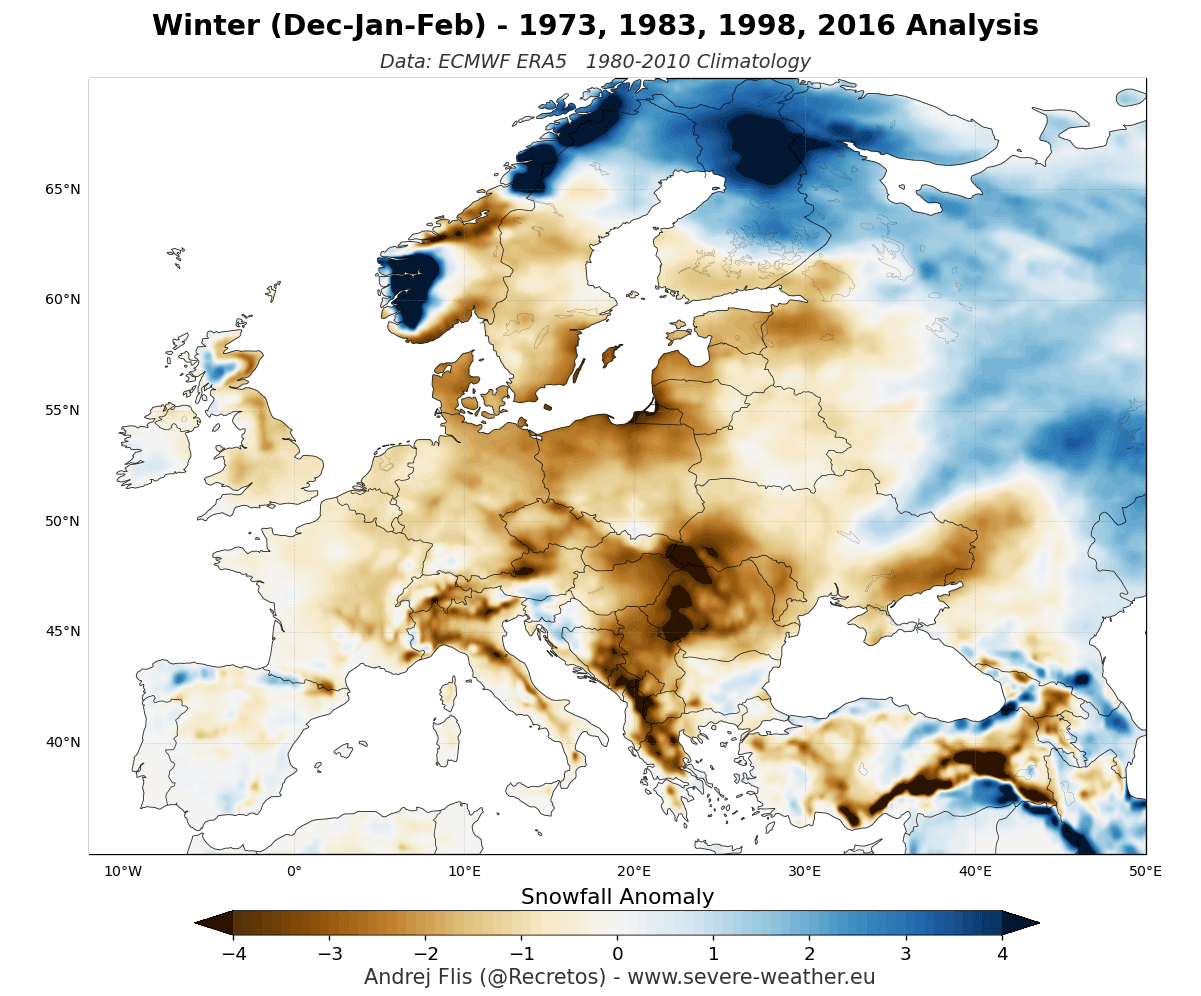
These are just examples of an average Super El Niño season, especially over the United States and Canada, which are more directly affected. Each year has its own variations of this winter pattern, so the map just shows an average picture of 4 individual events.
Now we can switch to the latest snowfall data and trends and look at what the latest forecast actually looks like.
Winter 2026/2027 Snow: Latest Outlook for the United States, Canada, and Europe
Below is a snow outlook for Winter 2026/2027 (December-February), based on the forecast data from six different centers. Blue hues show where more snow than normal is expected, while the warm colors show where below-normal snowfall is currently forecast.
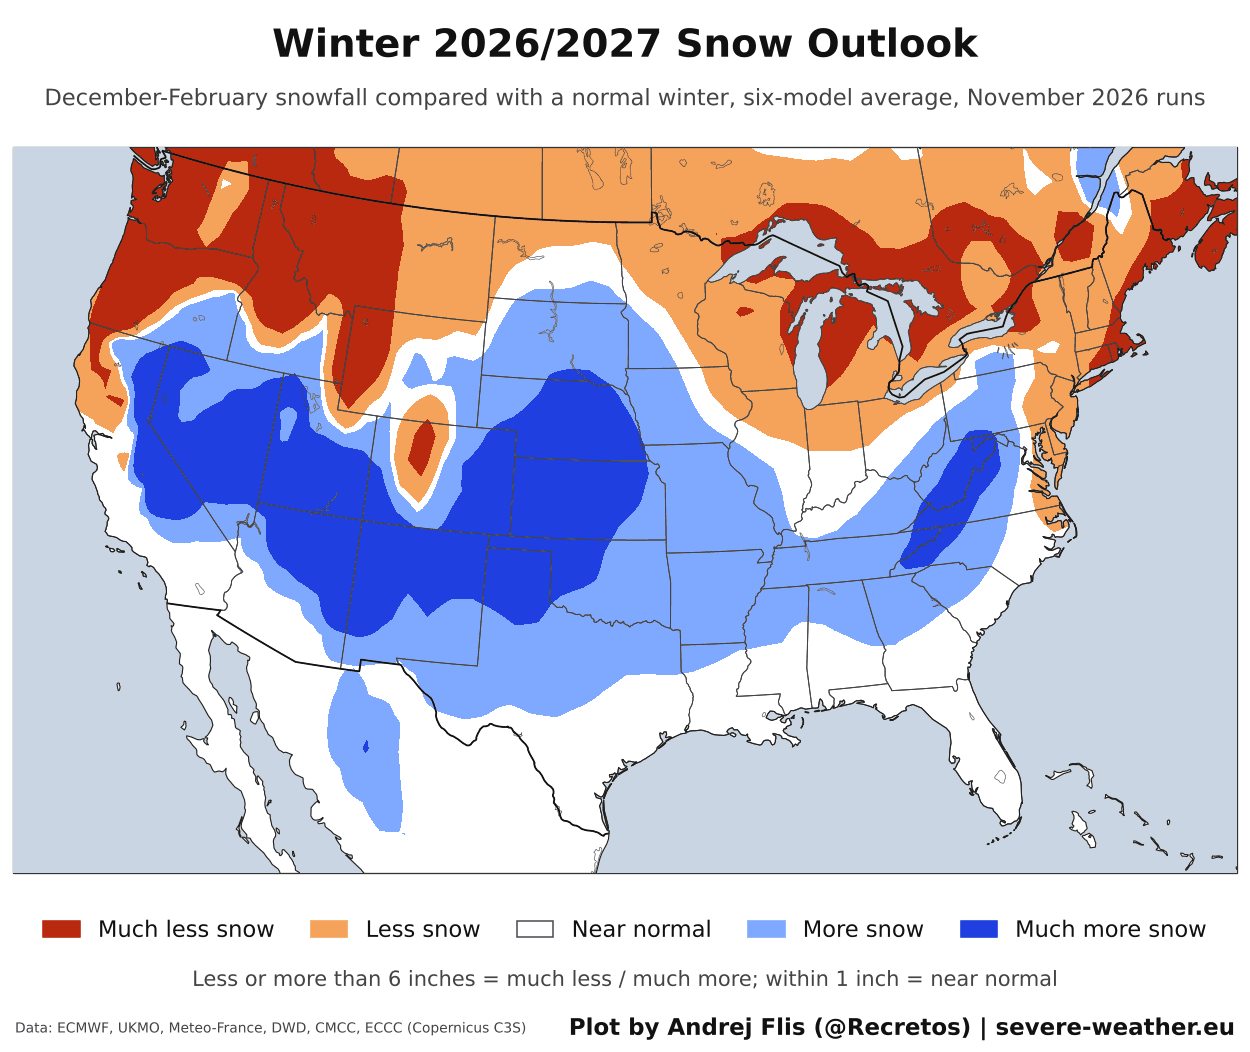
You can see the main snow band stretching from California and Nevada across the Great Basin and the Southwest into the Central Plains, with the highest values over the Sierra Nevada. A second area of more snow covers the central Appalachians and the interior Mid-Atlantic.
The northern parts show the opposite picture. The Pacific Northwest, the Northern Rockies, the Great Lakes, northern New England, and southern Canada are all below normal, with the largest deficits over the Cascades and the mountains of Idaho and Montana.
Individually, the month with the most above-normal snowfall coverage is January, closely followed by February. The next image below shows the average January snowfall forecast from six different seasonal models.
Well over half of the continental United States has above-normal snowfall in January. The main area stretches from the Sierra Nevada and the Great Basin across the Southwest into the Central and Northern Plains. A second area covers the Tennessee Valley and the central Appalachians, reaching into the Ohio Valley and interior Northeast.
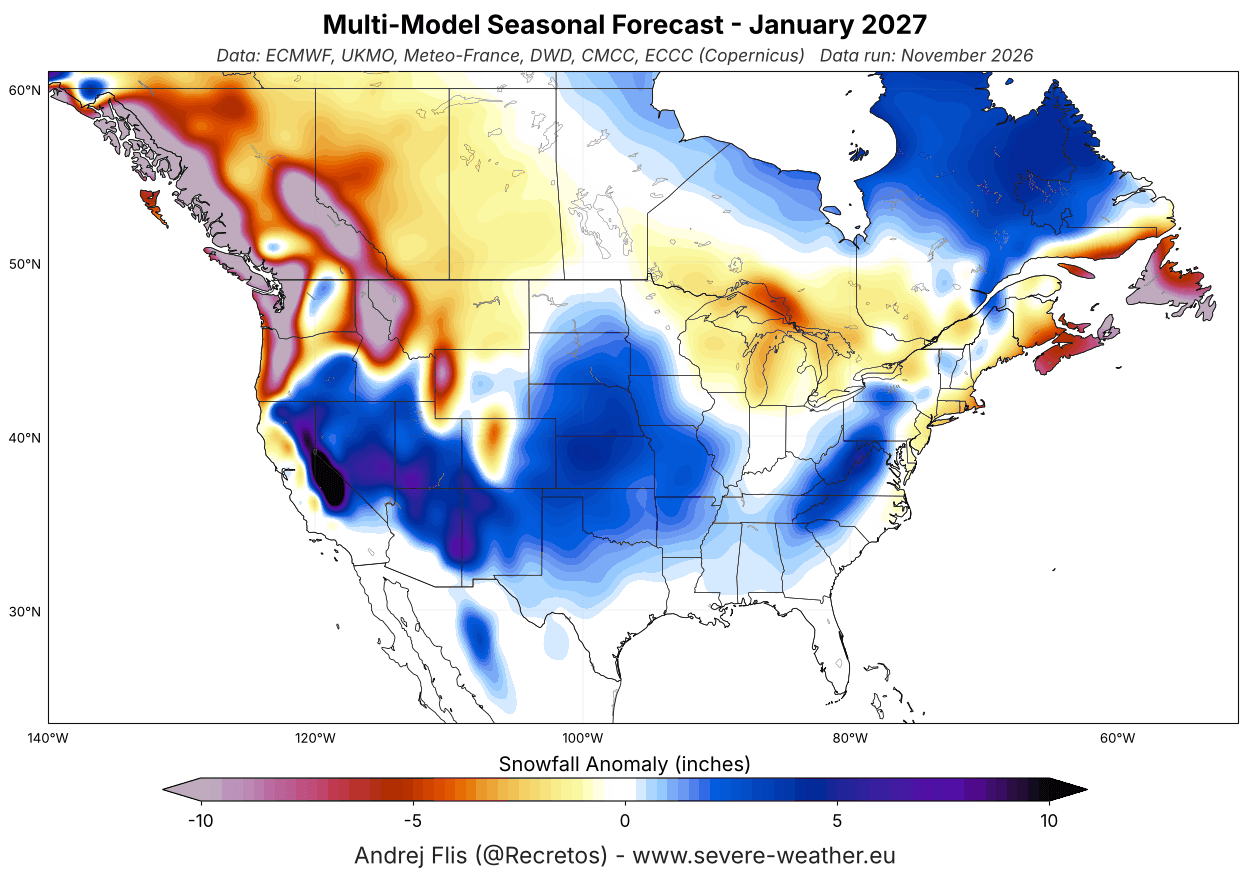
Below-normal snowfall is forecast for the Pacific Northwest and the Northern Rockies, around the Great Lakes, and along the Northeast coastal zone. In Canada, most of the west and the south are below normal, with more snow across northern Quebec and around Hudson Bay.
Over Europe, the snow outlook below continues to show a clear signal for a weaker snow season across most of the continent. The below-normal snowfall area covers nearly all of western, central, northwestern, and southern parts, based on the average of six seasonal models.
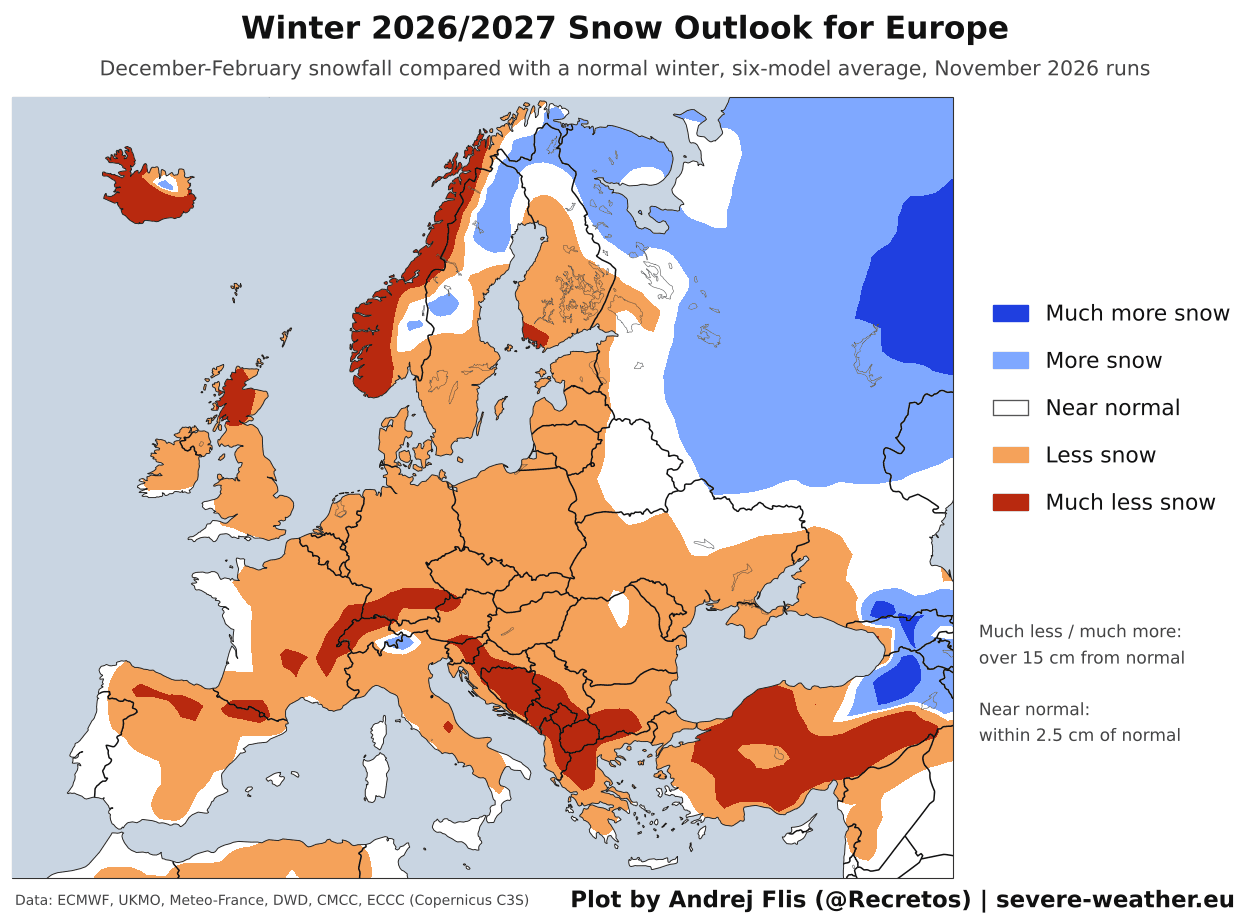
Only the far northeast and small parts of the northern mountains show more snow than normal, as a milder flow covers the rest of the continent.
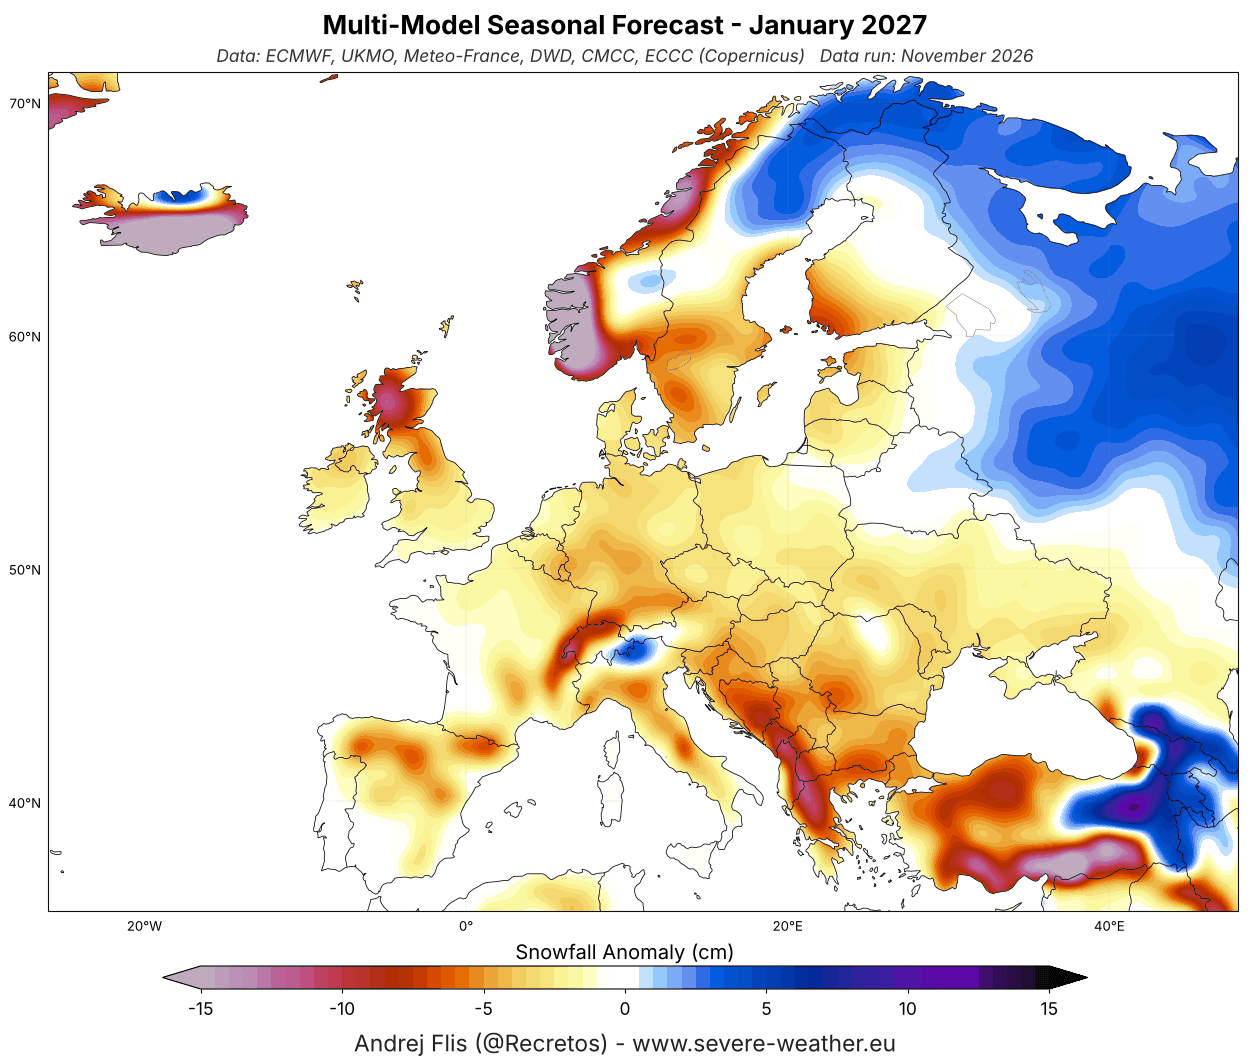
For Europe, January also has the most above-normal snowfall coverage. But as you can see in the multi-model forecast below, that coverage is small, and almost all of it is over the far northeast, the far southeast, and a small part of the Alps.
But anomalies can only tell us so much. Below is the latest seasonal total snowfall forecast. It shows total seasonal snowfall through April 1st, and indicates snowfall and snow coverage for the coming season.
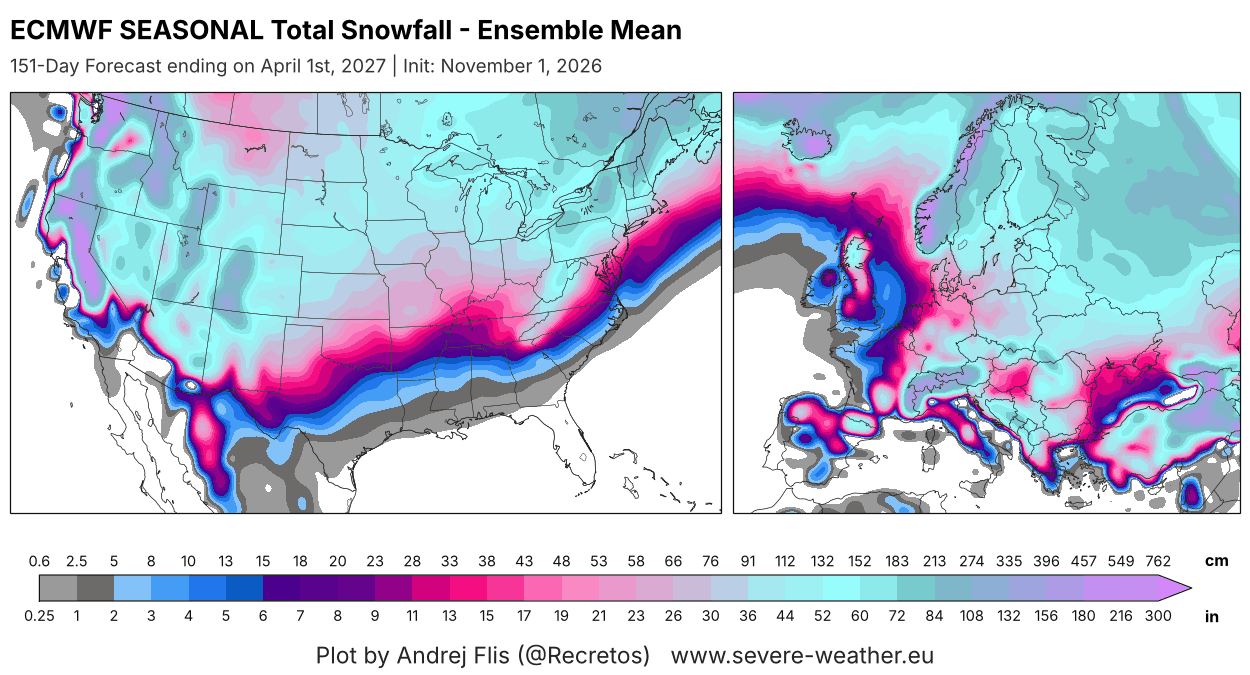
This is perhaps not a directly useful plot on its own, except that it clearly shows that while some areas are forecast with below-normal snowfall, that is not equal to no snowfall at all. It just means those areas are expected to see less snowfall than usual, while still seeing some snow on the ground during the season.
To get a better sense of total seasonal snowfall, I created the latest version of the Snowfall Explorer for the 2026/2027 snow season.
Winter 2026/2027 Snowfall Forecast for Your Region, State, Province, or Country
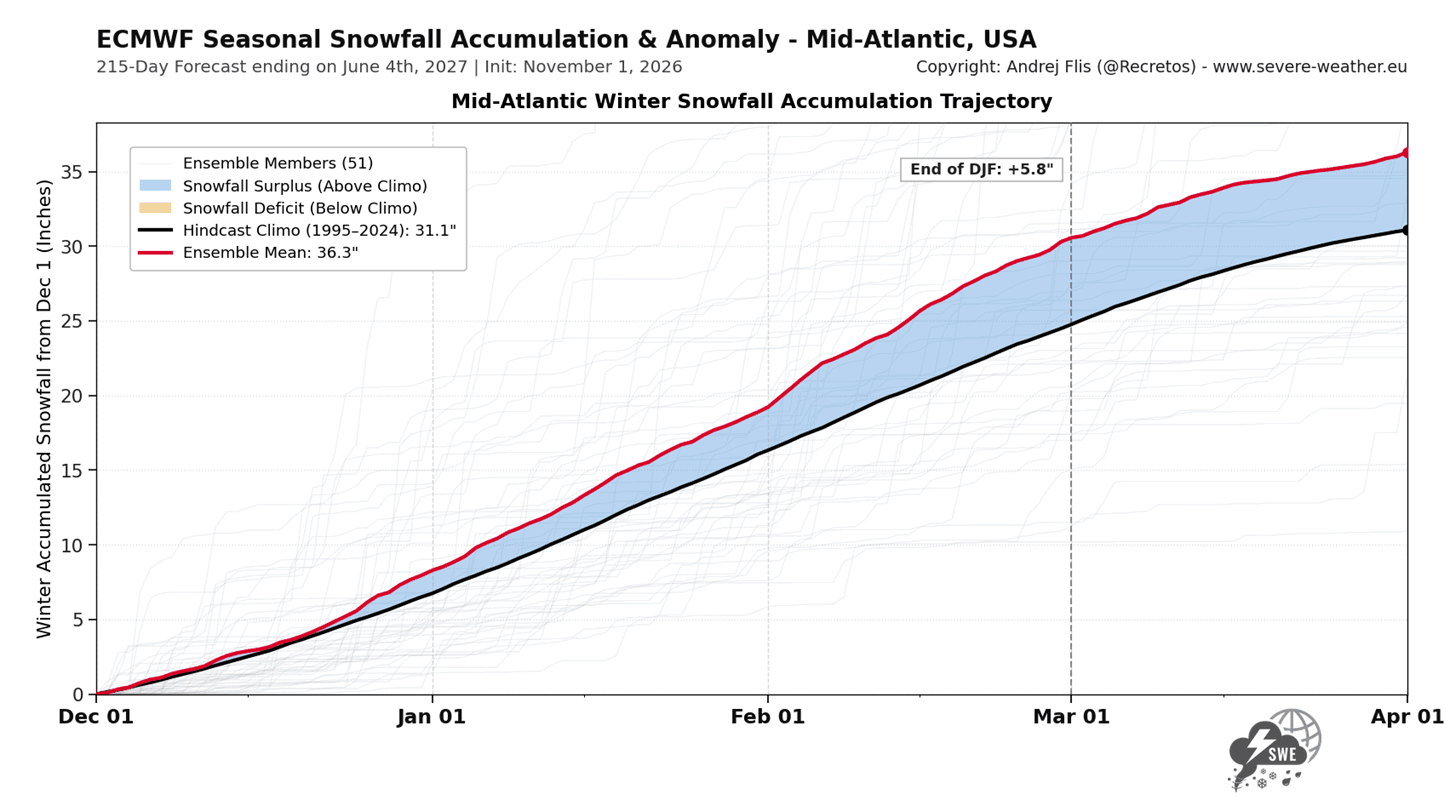
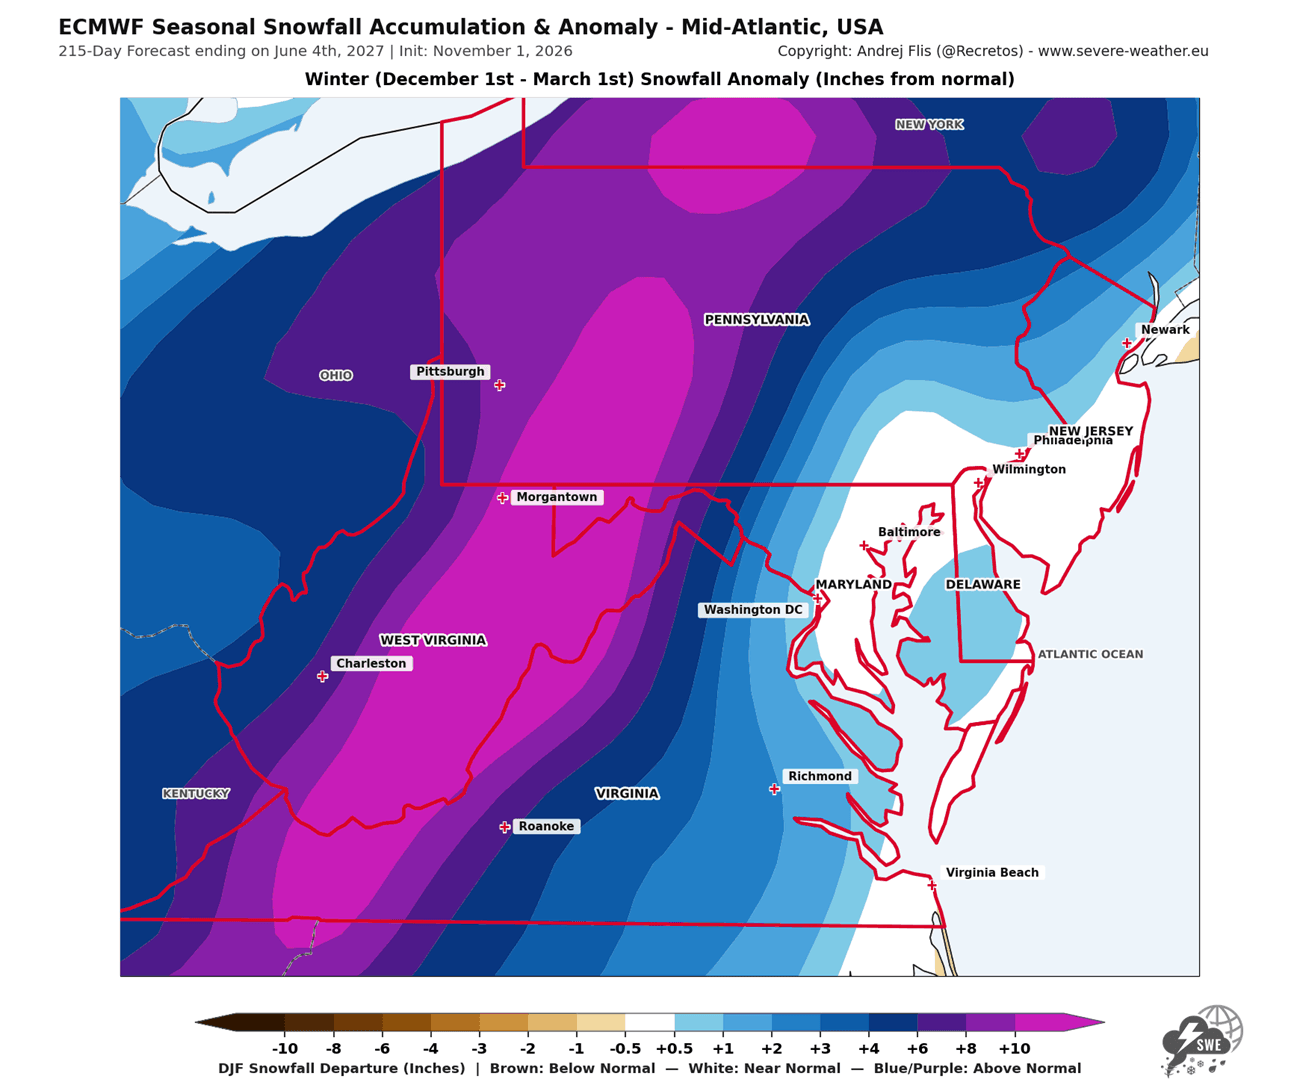
Besides the usual snowfall maps, the Snowfall Explorer includes a two-panel view: one panel shows snowfall over time, and the other shows it across the area. Below is a quick look at both parts, using the latest Mid-Atlantic, USA forecast as an example.
In the top panel, you can see snowfall accumulation for a specific region or individual state/country. This clearly shows the snowfall forecast trend (red line) and when the forecast shows more/less snowfall during winter than the historical baseline (black line). In the example below, you can see an above-normal snowfall trend for the Mid-Atlantic, from late December onward.
The bottom panel shows the full view for the same period/region as in the graph, marked with a red outline. So while a graph can show above-normal snowfall for the whole region/state combined, part of the region can still have below-normal snowfall, which this map will reveal.
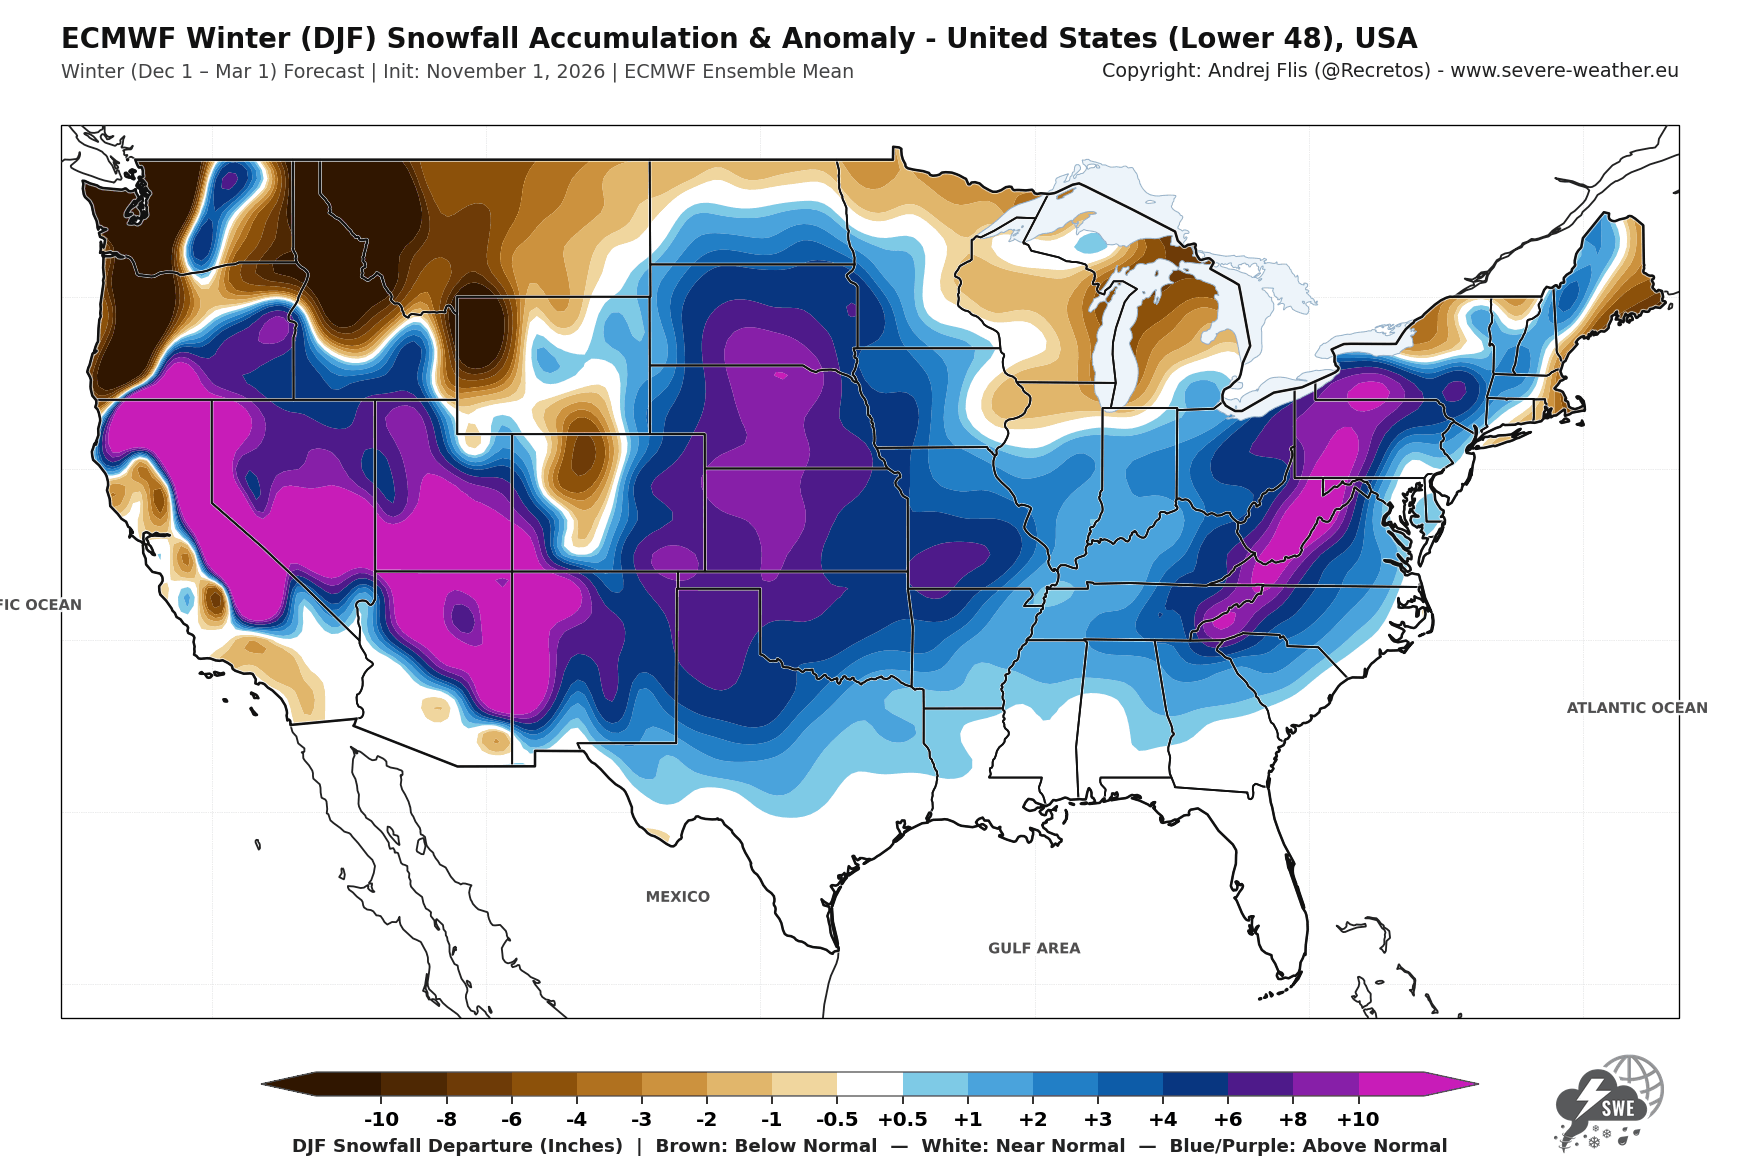
The Snowfall Explorer has a full regional and monthly breakdown. Note: Only the ECMWF model shows the top panel for the snowfall accumulation, as UKMO does not provide the data needed. But both models provide a full area and monthly breakdown.
Since the latest data was issued recently, this means we can look at first trends for the Christmas week snowfall from seasonal and weekly data.
Christmas Week 2026: A First Look at the Chance of Fresh Snow
Looking at seasonal data first, the ECMWF long-range model runs 51 different scenarios (members), and the map below shows the share of those scenarios with at least 1 inch (2.5 cm) of new snow between December 20th and 26th.
British Columbia, eastern Canada, the Rockies, the Great Lakes snowbelts, and northern New England have over a 70% chance of Christmas week snow. From the Central Plains to the big cities of the Northeast, the chance is between 30 and 50%, and it drops below 10% across the Southern United States.
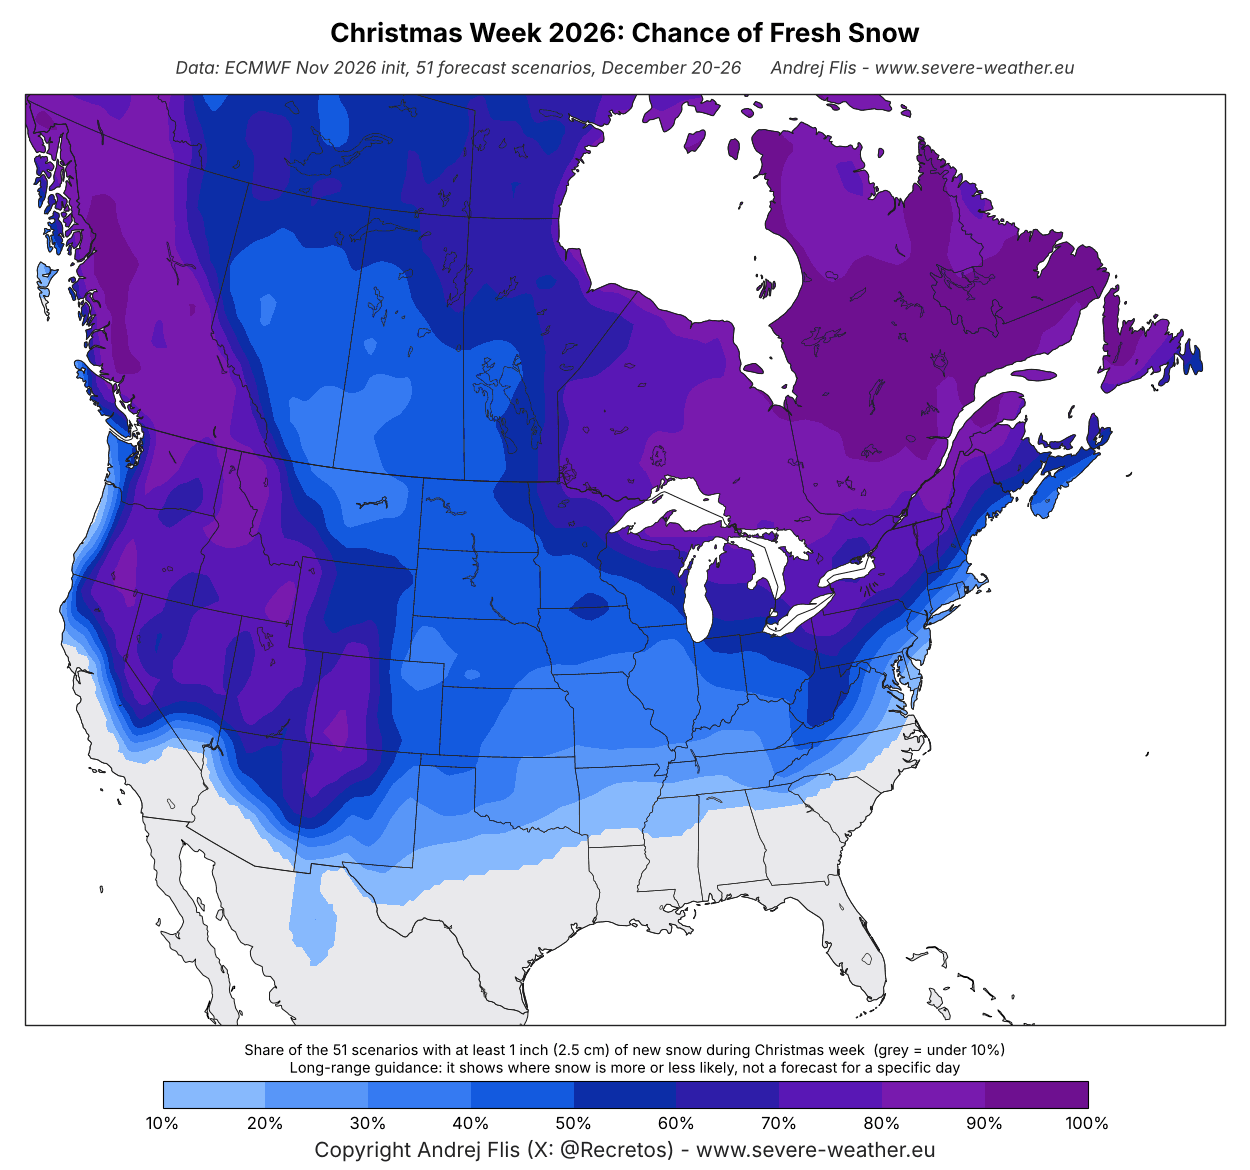
This is not yet a White Christmas forecast for a specific place. At this range, the map shows where snow is usually likely in late December (climatology), with a small push from the forecast weather patterns.
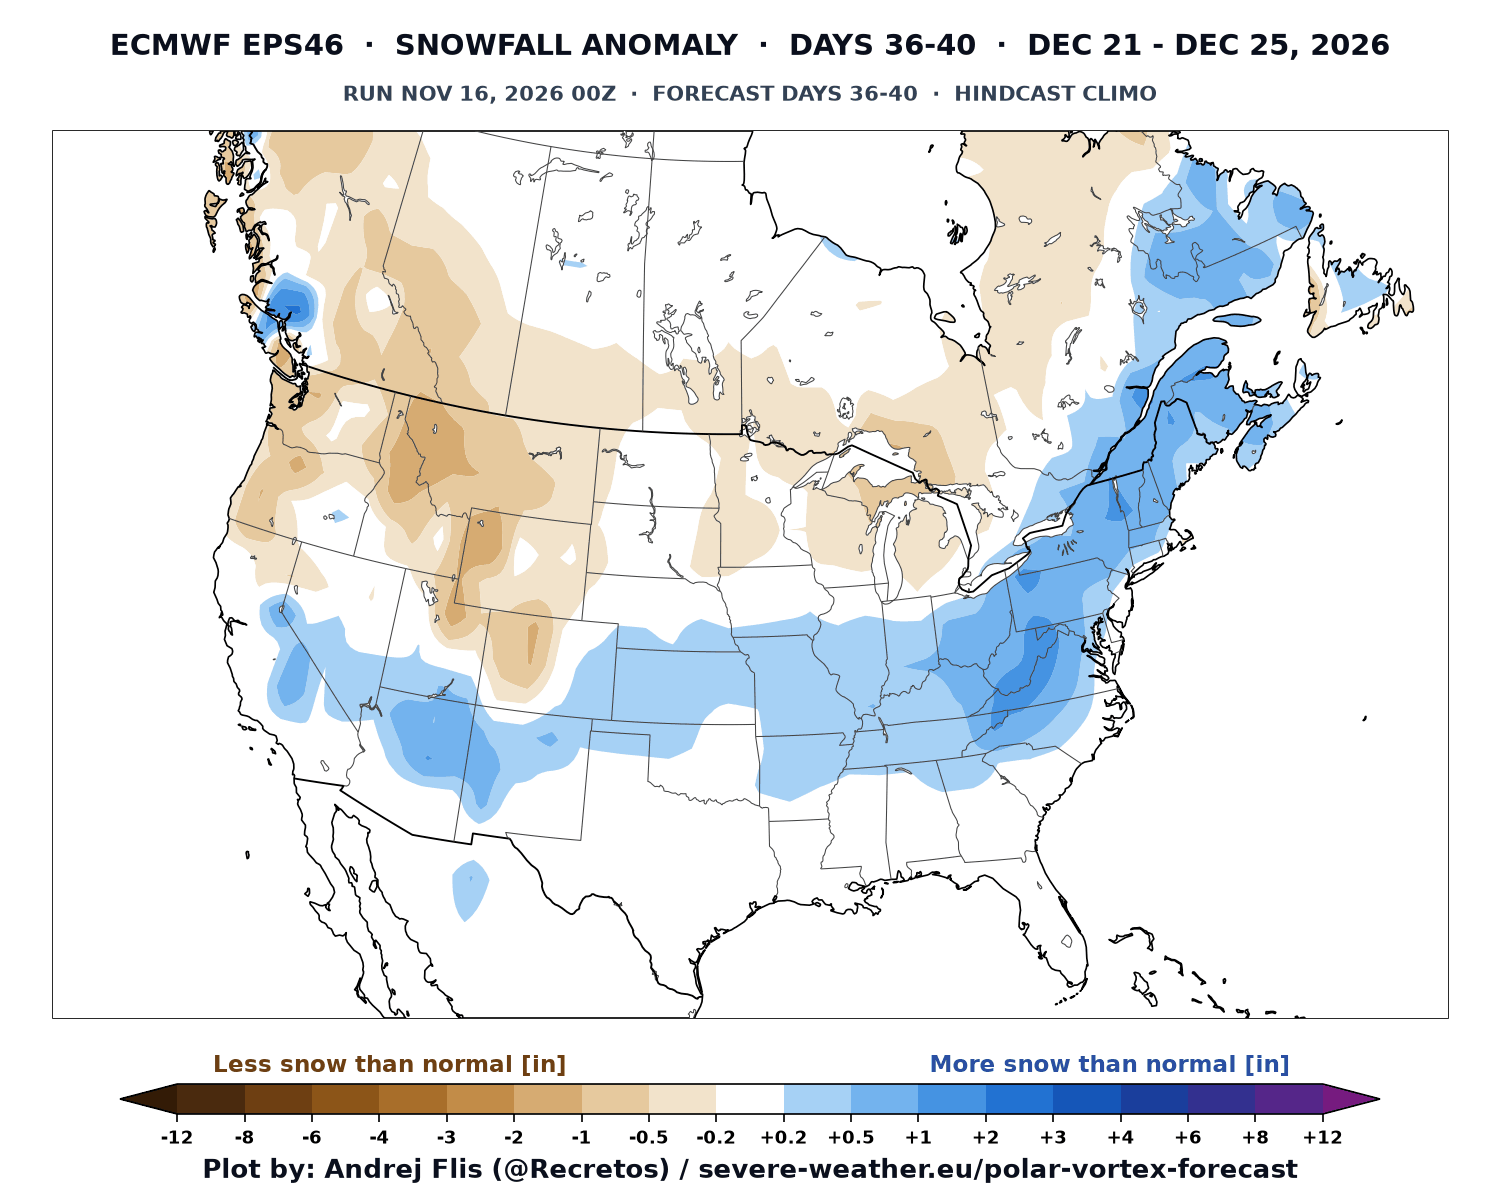
The ECMWF extended-range forecast now already reaches Christmas week, at the very end of its range. Below is its snowfall forecast for December 21-25, compared to normal. At 36 to 40 days out, this is only a first hint of the pattern, not a snow forecast for any single place.
You can see a band of more snow than normal from the Southwest across the southern Plains and the Ohio and Tennessee Valleys, into the Appalachians, the Northeast, and southeastern Canada. Less snow than normal is indicated for the Pacific Northwest, the northern Rockies, western Canada, and around the Great Lakes.
In Europe, the chance of fresh snow in Christmas week is highest across Scandinavia, the eastern parts of the continent and the Alps. It is around 40 to 60% across central parts, dropping to 10% or less over the south, west, and UK.
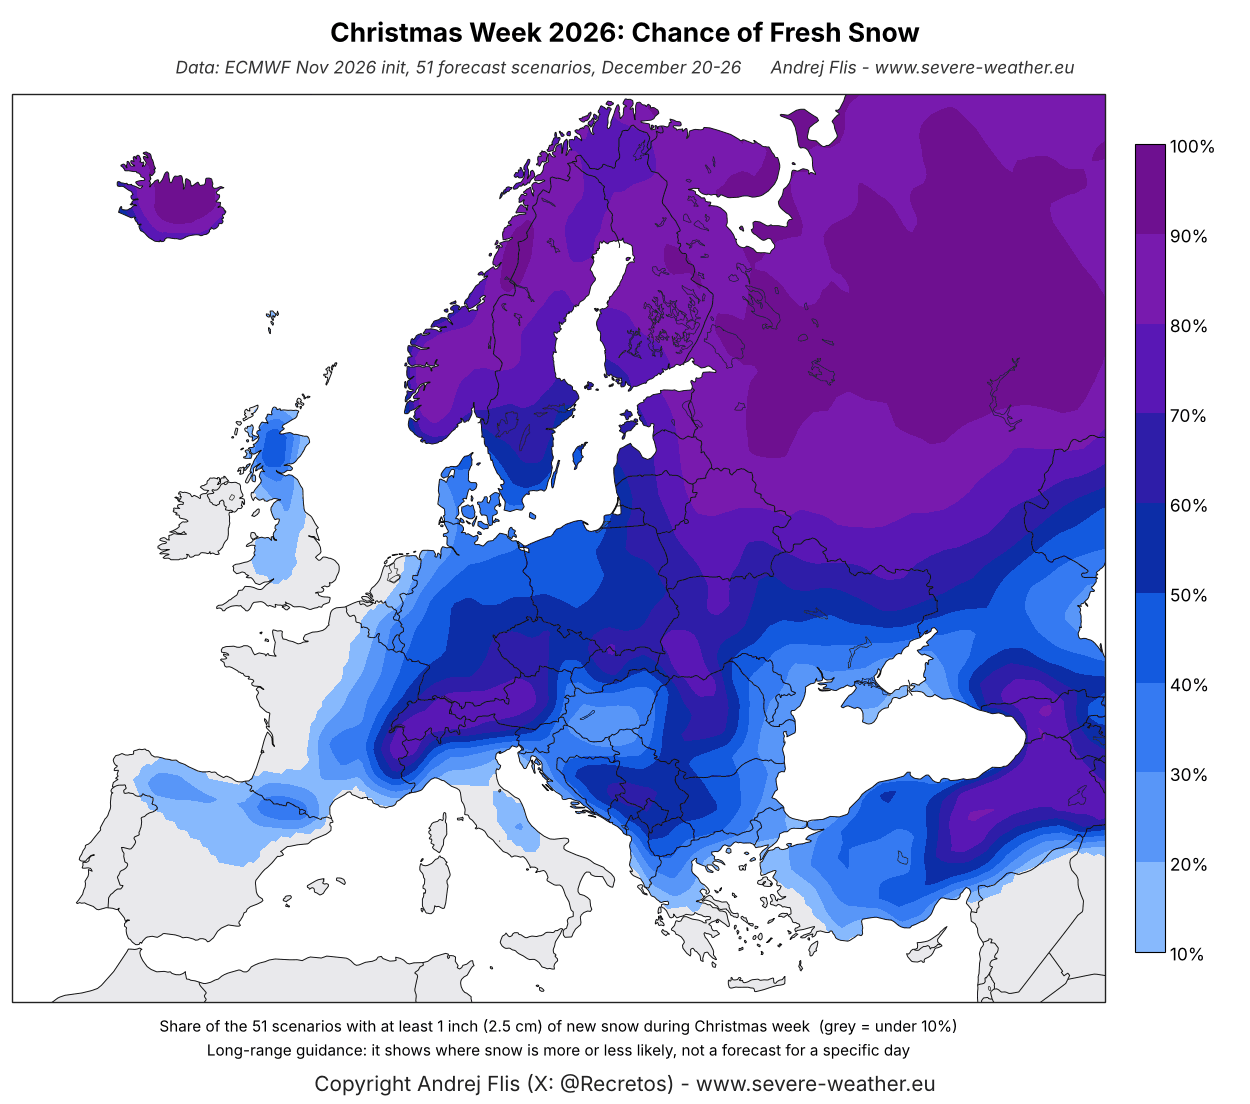
Again, this mostly reflects where snow is normal at that time of year. It does not mean that a snowy Christmas is expected or ruled out for any single city just yet.
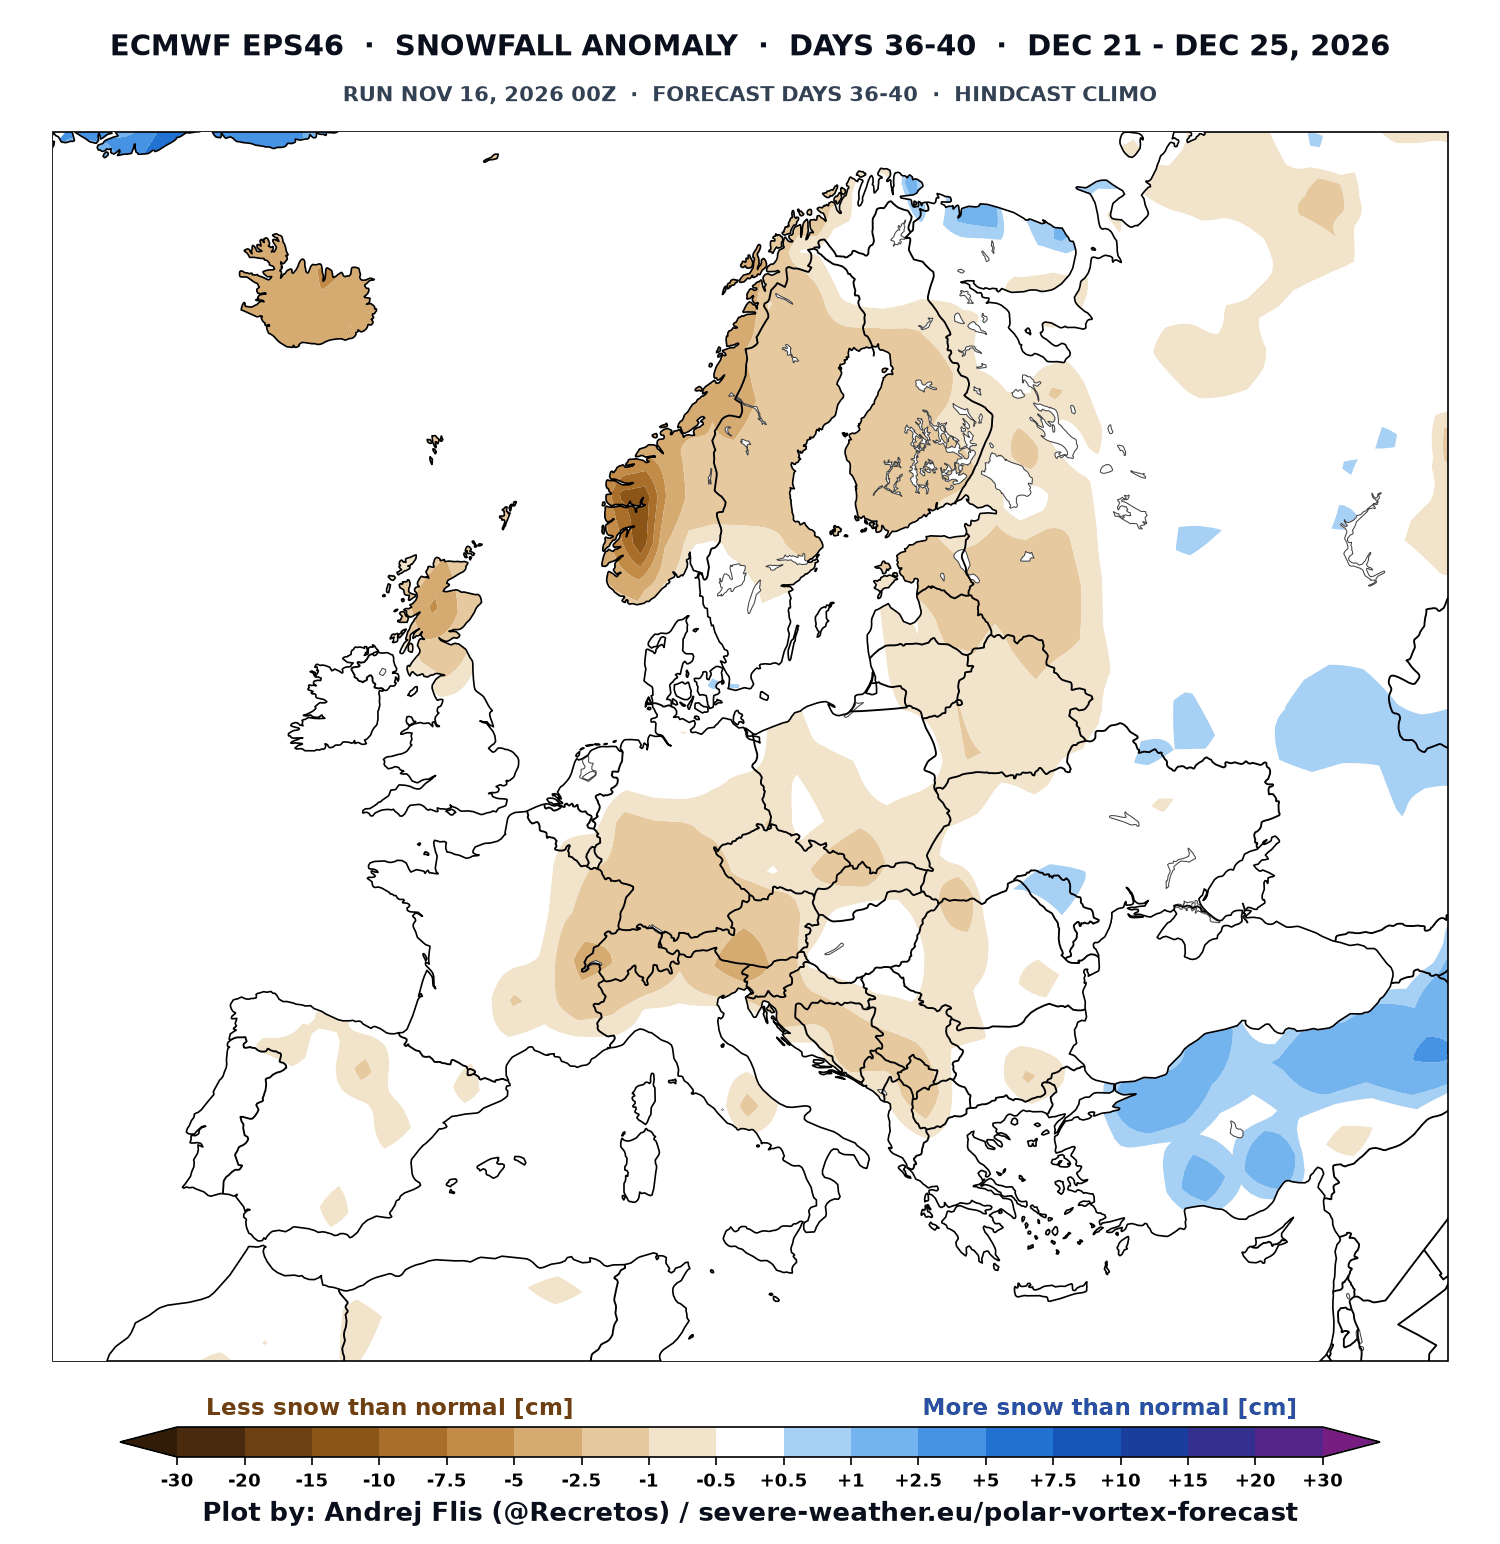
The extended-range forecast for Europe shows less snow than normal across most of the continent in Christmas week. The main signal for more snow than normal is limited to the southeast. But these maps do update regularly, so I will write a separate article on the latest developing trends for Christmas week snow.
With a strong Super El Niño snow season approaching, this will also create a major redistribution of snow across all the main ski centers, which I analyzed below.
Winter 2026/2027 Ski Season: November Outlook for the Main Ski Areas
For skiers and snowboarders, the main question is usually the same every season: will my favorite resort get a good winter? To try and answer that, I calculated the winter snowfall outlook for the main ski areas across the United States, Canada, and Europe, using the November forecast data from six seasonal models.
Keep in mind that these predictions run on a grid of around 100 km (60 miles). This means the values cover the wider area around each ski region, not the exact natural snowfall on the slopes. What matters is whether snowfall is trending above or below normal.
U.S. Ski Areas: California and the Southwest Stay on Top
Below is the latest snowfall outlook for 16 ski areas across the United States. A clear north-south El Niño split shows southern ski areas in better shape, while northern areas face an overall slow snow season. Again, what matters here is the trend, not raw numbers.
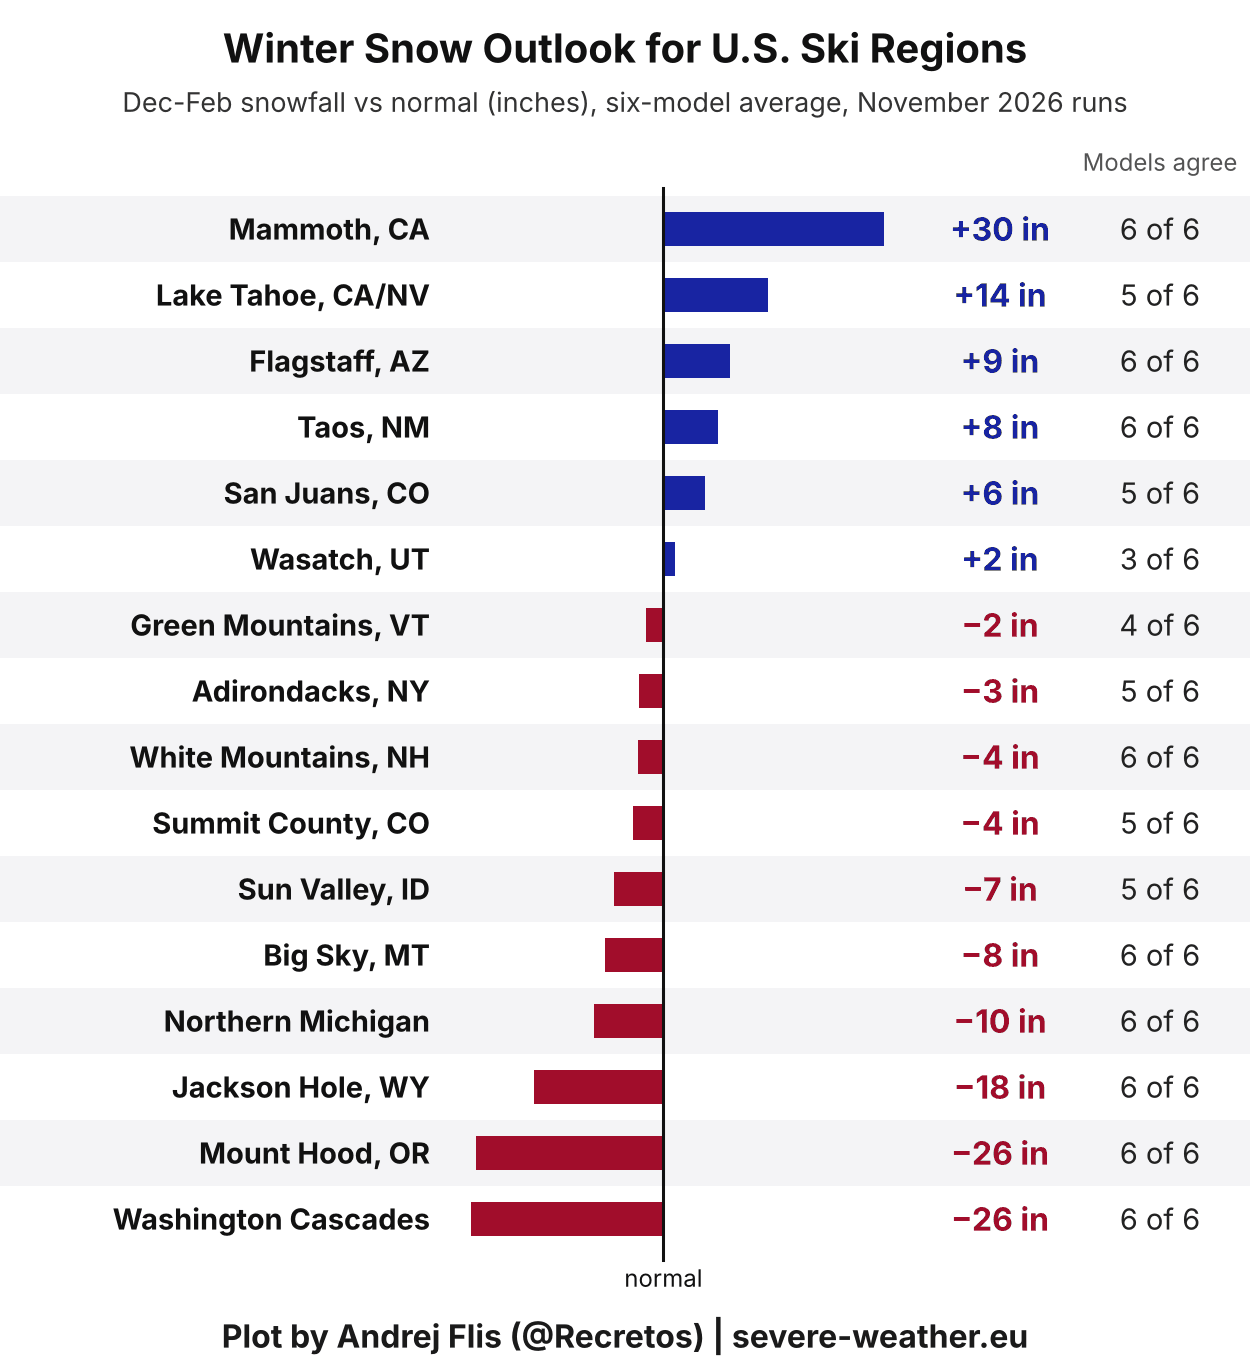
The best ski season is forecast for California and the Southwest. Mammoth Mountain leads with around 30 inches more snow than usual, followed by Lake Tahoe, Flagstaff, Taos, and the San Juan Mountains in southern Colorado.
The northern mountains show the opposite signal. The Washington Cascades and Mount Hood are about 26 inches below normal, with Jackson Hole and Big Sky also on the low side as the main El Niño storm track stays farther south.
In the Northeast, the deficit is much smaller than in the previous run, with the Green Mountains, the Adirondacks, and the White Mountains only 2 to 4 inches below normal.
Canadian Ski Areas: El Niño Snowfall Reduction
The snowfall outlook for Canadian ski regions is less optimistic. Unlike the United States, there is no clear winner here, as every ski region is forecast below normal this winter, due to the Super El Niño impact with a high-pressure zone developing.
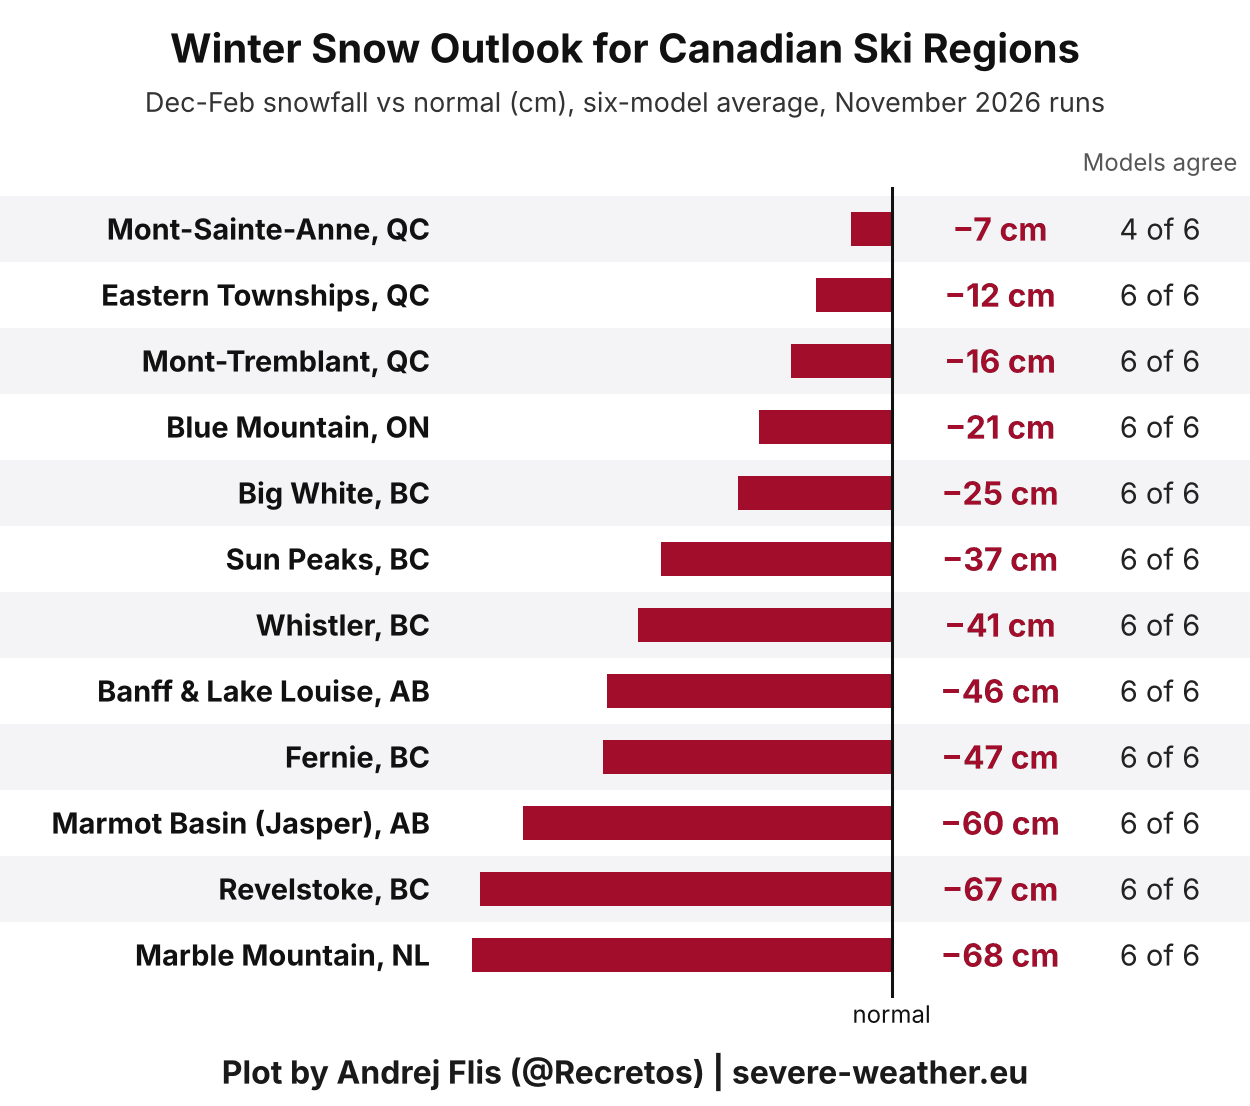
The western mountains show a very weak snow season: Revelstoke and Marmot Basin are around 60 to 67 cm below normal, while Whistler, Banff and Fernie show a deficit of 41 to 47 cm, and Sun Peaks around 37 cm. In the east, Marble Mountain in Newfoundland shows the largest deficit, close to 68 cm.
The best so far is Quebec, with Mont-Tremblant, the Eastern Townships, and Mont-Sainte-Anne around 7 to 16 cm below normal. But overall, with a lack of precipitation under a high-pressure zone, higher altitude areas can compensate with artificial snow.
European Ski Areas: A Below-Average Season
Looking at Europe, most ski areas show a below-normal snow signal due to El Niño and a milder continental flow, with only parts of the Alps and Lapland close to normal.
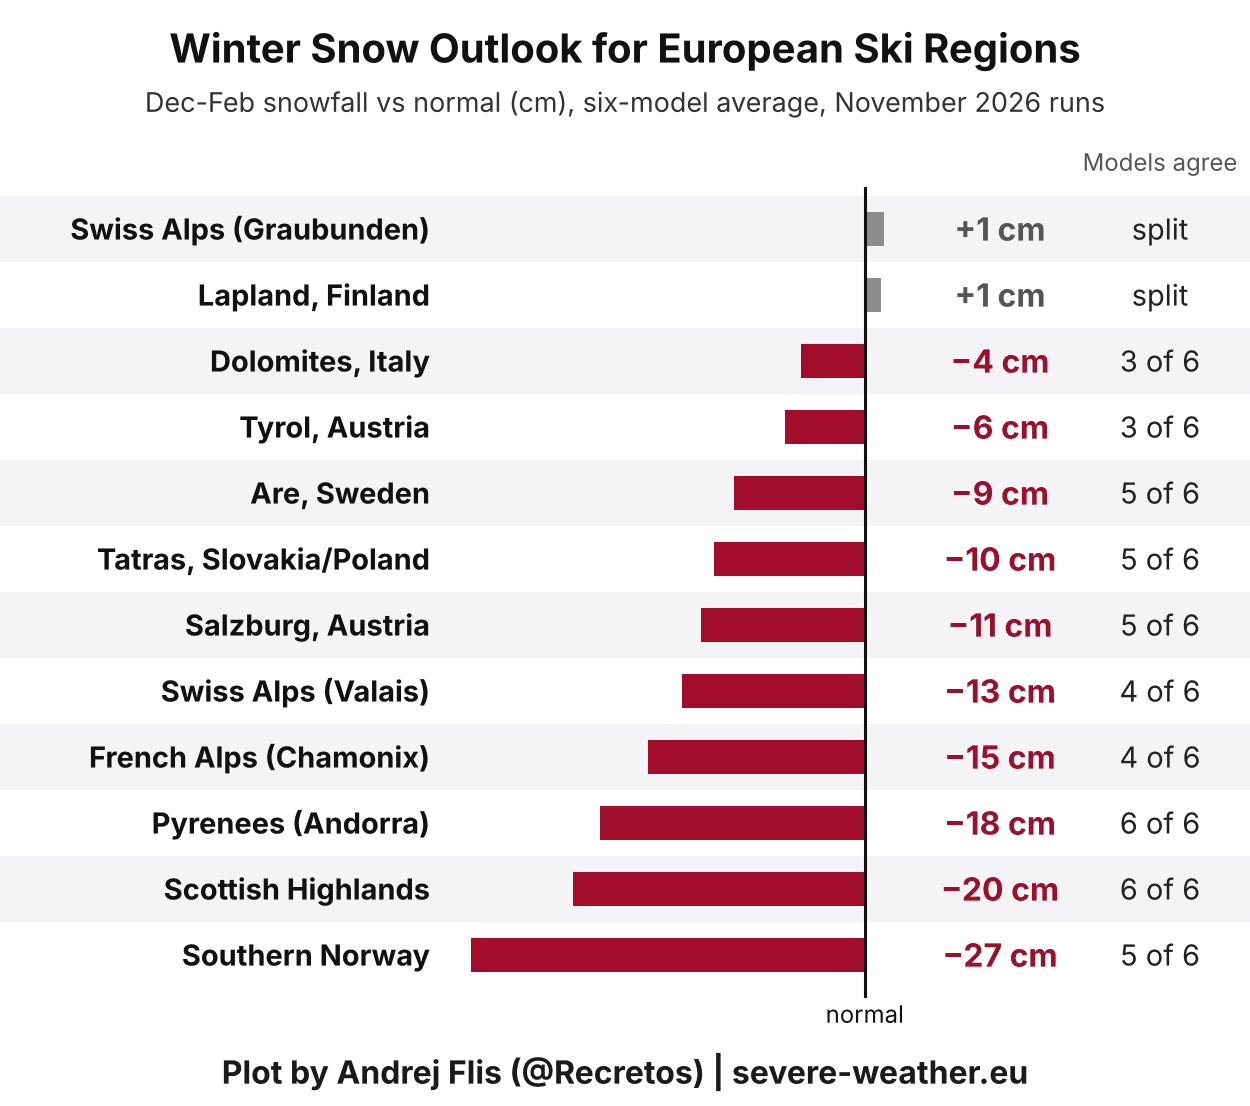
Over the Alps, the six models still strongly disagree, ranging from around 30 cm more snow than normal to a deficit of 30 to 50 cm. This leaves the average near normal in parts of the eastern Alps and around 11 to 15 cm below normal in the west.
But aside from the strong El Niño, I already wrote about another impact factor that can play a role in mid-winter: the mighty Polar Vortex disruption in the stratosphere.
Polar Vortex: What a Mid-Winter Disruption Could Mean for Snow
The Polar Vortex is the broad winter circulation over the Northern (and Southern) Hemisphere that keeps the cold air locked over the polar regions when strong. If disrupted enough, that cold air can escape, flowing into the mid-latitudes.
The main disruption usually arises from a rise in pressure and temperature in the stratosphere, known as a Sudden Stratospheric Warming (SSW) event, or from other dynamics that can originate from the lower levels.
I produced a high-resolution 3D video below that shows the Polar Vortex structure during a major Sudden Stratospheric Warming (SSW) event in mid-winter, and the typical weather result, bringing cold air to the central and eastern United States and parts of Europe.
We measure the strength of the Polar Vortex by its winds. Below is the most recent ECMWF seasonal forecast, which shows an unusual weakening of the stratospheric westerly winds in January and into February. You can see that the black line (forecast) goes well below normal (red and blue lines), indicating a likely disruption event from around mid-January onward.
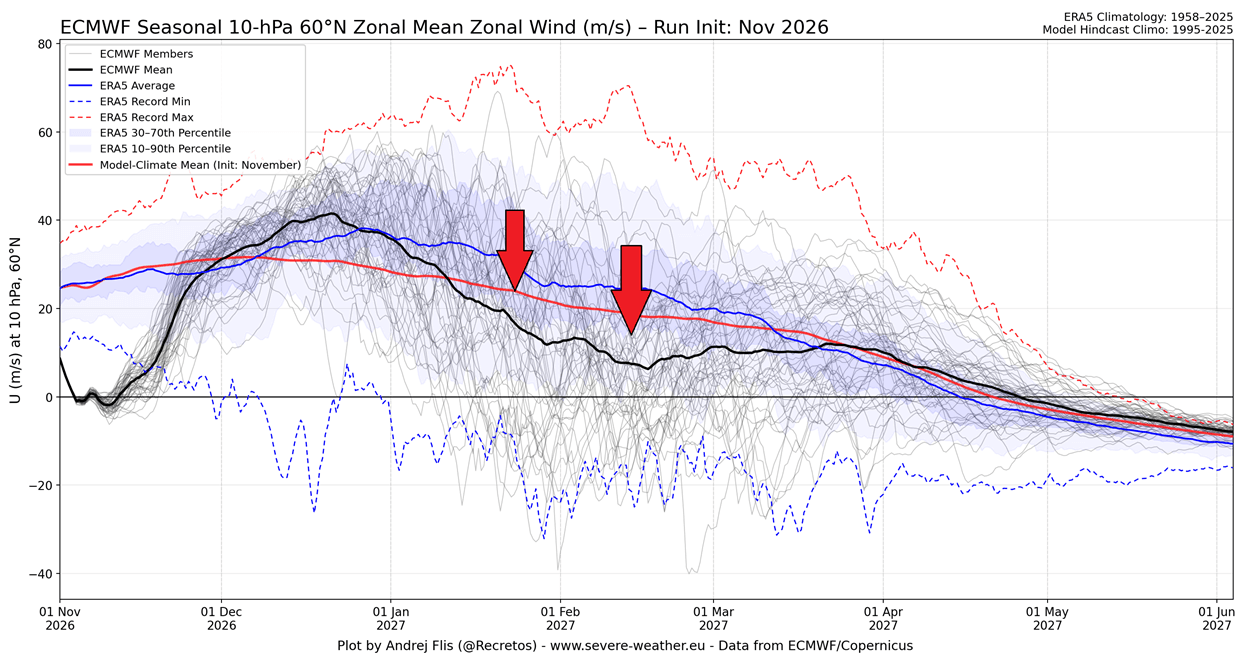
You can also see a weakening and a reversal (negative winds) in early November, which is the recent Polar Vortex disruption, the earliest such event on record. But because it's so early in the season, its impacts are more modulated than in mid-winter.
But what would a Stratospheric Warming event in January-February mean for snow? Below is the average snowfall anomaly in the first 30 days after major SSW events in an El Niño season, based on climate model simulations.
On average, snowier conditions become more likely across large parts of the central and eastern United States and southeastern Canada, following a collapse of the Polar Vortex circulation.
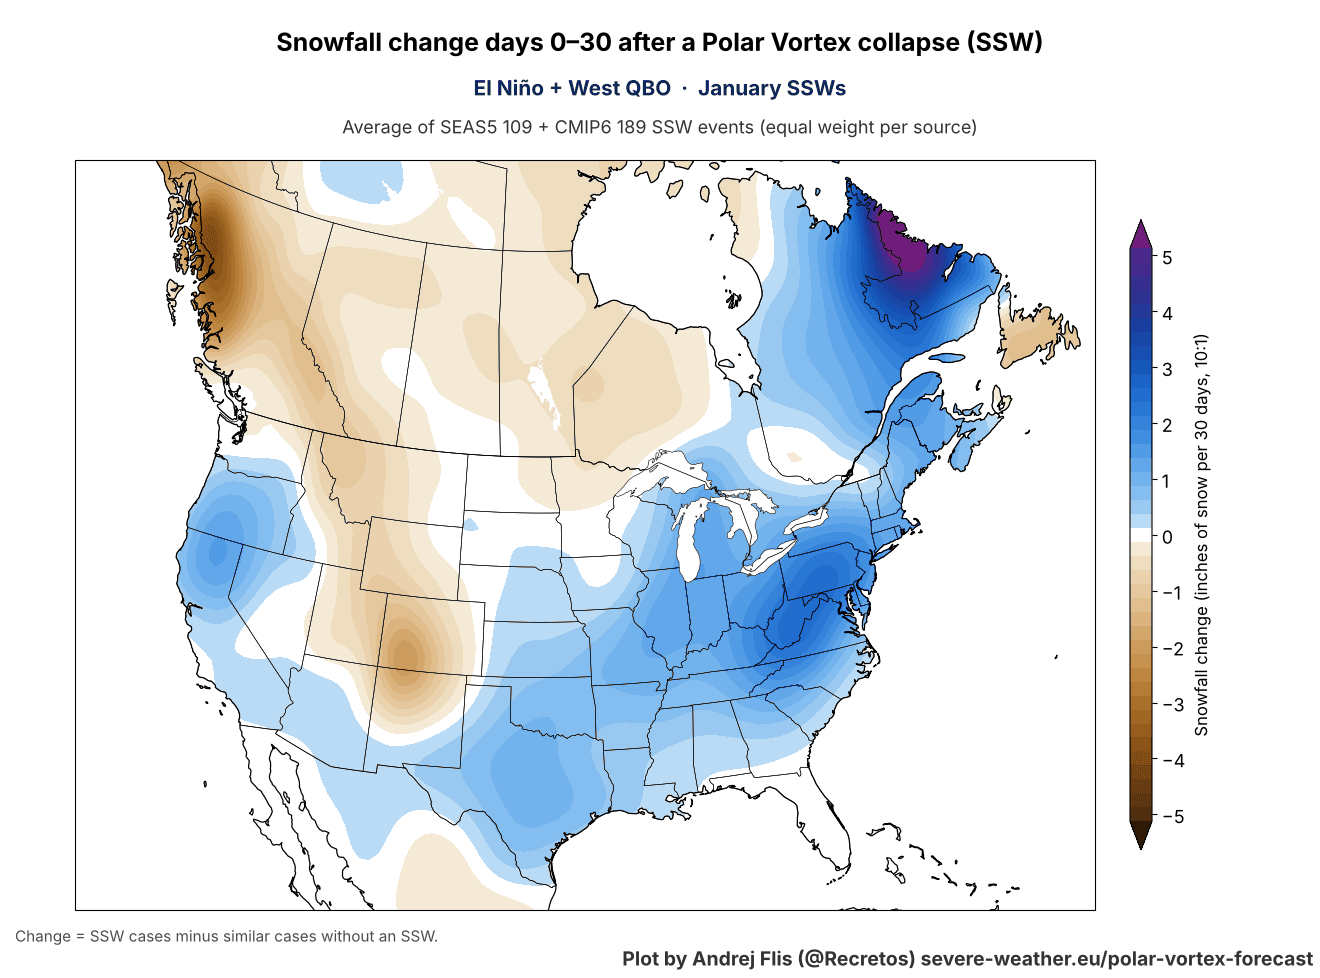
This is similar to the pattern that we saw last winter over the United States, with a disrupted lower Polar Vortex core moving into North America. It created a “Polar Express” pattern, with a cold corridor from the polar regions across central Canada into the United States.
Over Europe, the same Stratospheric Warming events tend to bring increased snowfall across much of the continent, including the southern UK and the whole central area.
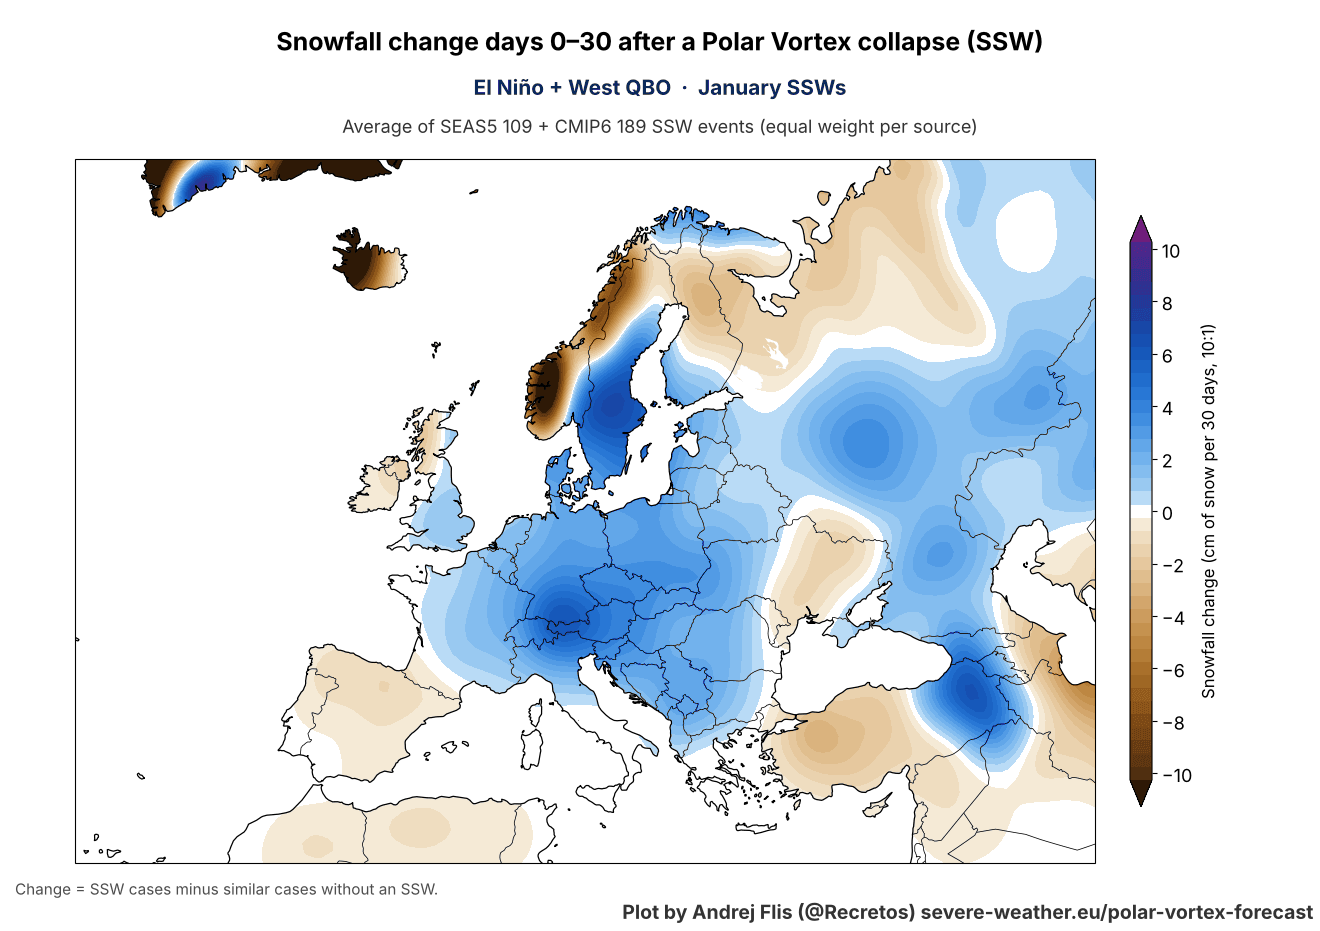
But the Polar Vortex can behave very differently from one winter to another, so the two images above are not forecasts, but an average expected response.
Winter 2026/2027 Snowfall Forecast: November Data Key Takeaways
- Six seasonal models agree on the Super El Niño snow pattern, with more snow from California across the Great Basin and the Southwest into the Central Plains, and over the central Appalachians and the interior Mid-Atlantic.
- Less snow is expected for the Pacific Northwest, the Northern Rockies, the Great Lakes, northern New England and southern Canada.
- The November run added snow across the West, the Plains, the Mid-Atlantic and the Northeast, while the Ohio Valley and central Midwest saw some reduction.
- January has the widest snow signal, with above-normal snowfall over more than half of the continental United States, closely followed by February.
- The first look at Christmas week shows the best chance of fresh snow across the Rockies, the Great Lakes snowbelts, northern New England and eastern Canada. At this range it mainly reflects where snow is normal in late December, but the early extended-range data hints at an active snow band from the Southwest into the Ohio Valley and Northeast.
- For skiers, California and the Southwest have the best outlook, while the Pacific Northwest, the Northern Rockies and every Canadian ski region are below normal.
- Most of Europe is forecast below normal, with the Alps remaining the most uncertain region in the models, due to altitude compensating for the lack of colder air.
- A Polar Vortex disruption from mid-January could bring more snow to the central and eastern United States and parts of Europe, but for now it is only a developing signal.
Peer-Reviewed Research Used in This Article
- El Niño and U.S. Winter Snowfall: How Well Do Seasonal Climate Anomalies Match Expected El Niño-Southern Oscillation (ENSO) Impacts? - L'Heureux et al. (2024).
All charts and analyses in this article are my own, based on seasonal forecast data from six centers (ECMWF, UK Met Office, Météo-France, DWD, CMCC, and ECCC), provided by the Copernicus Data Service, ERA5 reanalysis, NOAA Coral Reef Watch data, and CMIP6 climate model data.
Don't miss: New Winter 2026/2027 Forecast: Latest Temperature and Precipitation Outlooks
We will keep you updated on the global weather pattern development, so don't forget to bookmark our page. Also, if you have seen this article in the Google App (Discover) feed, click the like or the star button there to see more of our forecasts and our latest articles on weather and nature in general.