The 2026 Super El Niño continues its historic rapid intensification across the equatorial Pacific ahead of Winter 2026/2027. New oceanic and atmospheric data confirm another major jump in strength. Latest long-range data predict this event is on track to become one of the most intense El Niño events in over a century.
This surge in power is driven by record-breaking westerly wind bursts and a collapse of the Pacific trade winds. The atmosphere is already responding worldwide, locking in a stationary wave pattern that will dominate global circulation for several months, likely deep into Spring.
Below, I break down the record atmospheric and ocean anomalies, the deep subsurface Kelvin wave, and the latest peak projections for early Winter, including pressure-pattern impacts. Finally, you will be able to use my new Winter Forecast Explorer to see the latest temperature, precipitation, and snowfall forecasts for every state/province in the United States and Canada, and countries across Europe and Asia.
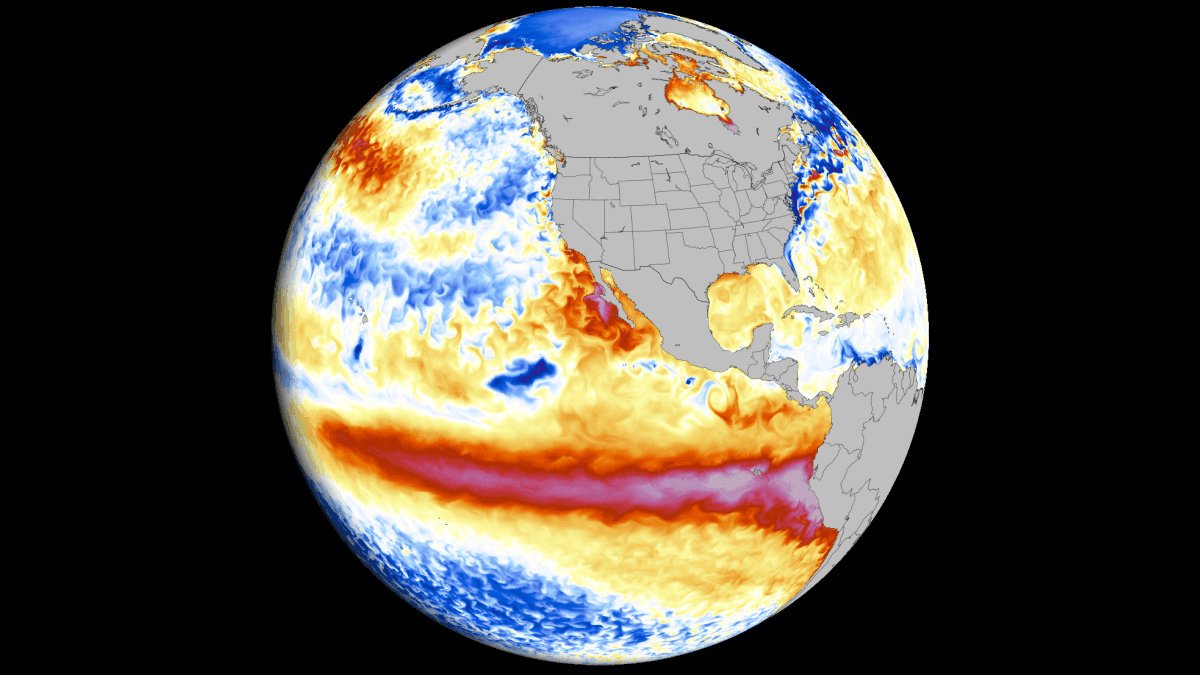
Super El Niño 2026: How Extreme Events Reshape Winter Weather
El Niño is a warm ocean anomaly in the central and eastern Tropical Pacific. It comes to life through shifts in tropical winds and broad pressure changes. When these events grow past a certain threshold, we call them (unofficially) Super El Niño events.
In recent weeks, the Super El Niño event has been the world’s top weather news, and for good reason. It has followed previous forecasts and strengthened rapidly, becoming a major global weather driver for 2026/2027.
While a moderate event produces a mild wave pattern, a Super El Niño triggers a far more aggressive shift in the jet stream. The transition from a Moderate to an Extreme El Niño leads to a deeper Pacific trough and a stronger Canadian ridge, forming an amplified atmospheric highway.
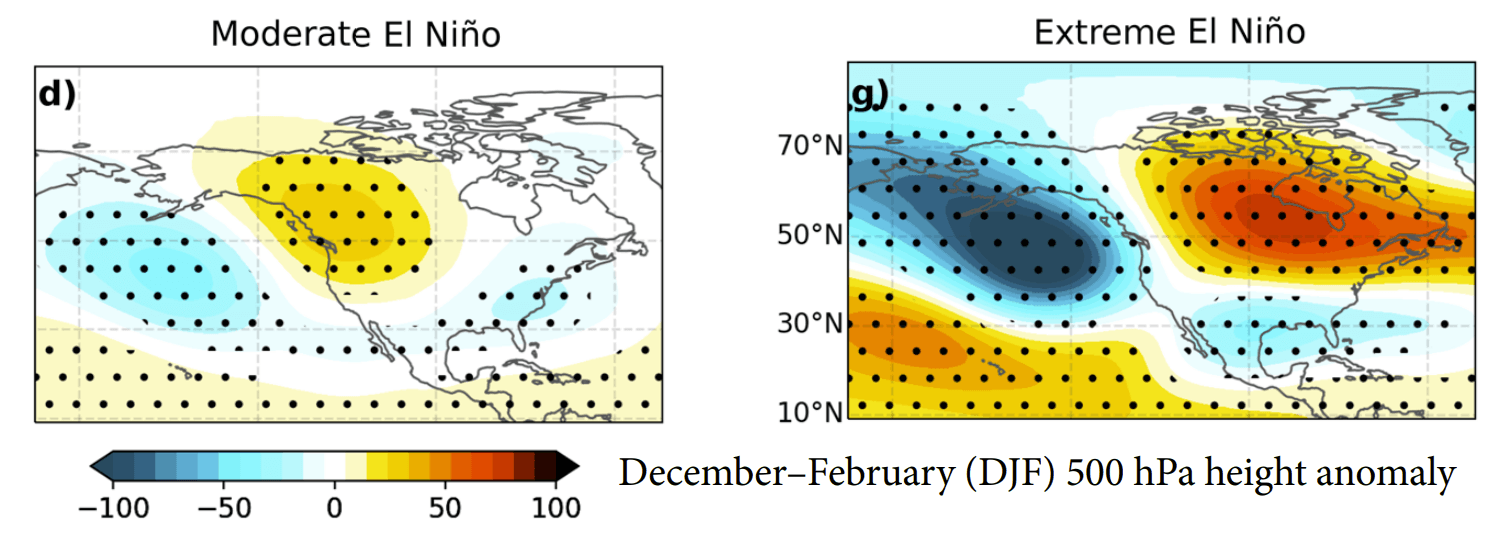
This favors milder conditions in the northern U.S. and south Canada, while driving an active storm track across the southern United States. The image above is from a study (linked below) that compared winter pressure anomalies during different El Niño events.
Below is my combined analysis image of the last 4 Super El Niño events, showing their typical ocean temperature profile. You can see a very strong warm anomaly across the central and eastern tropical Pacific, with peak areas exceeding +4°C (+7°F). This proximity to North America means direct, strong impacts on seasonal weather in the United States and Canada.
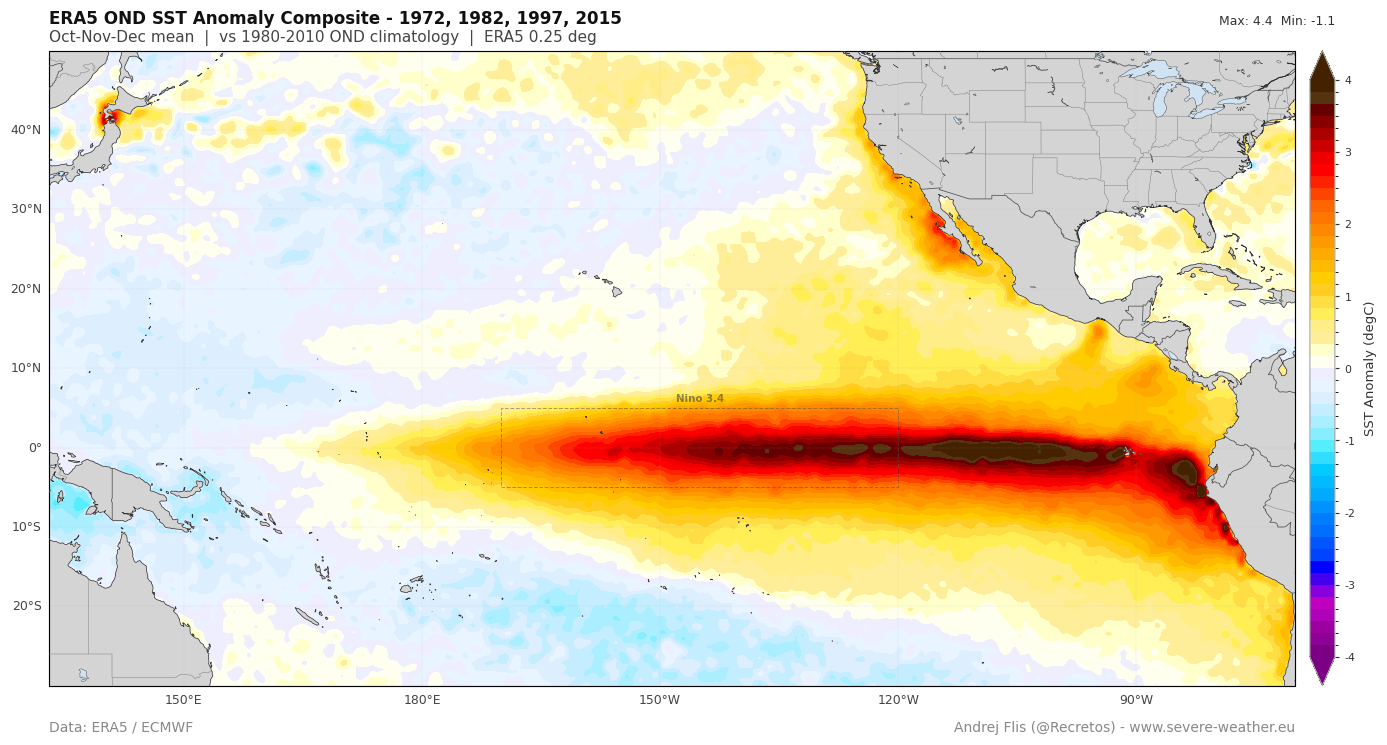
While El Niño events happen every few years, Super events are rare and usually occur once per decade or less. To create such a strong event, we need a combined effort from the oceans and the atmosphere.
The latest analysis data confirms this process is occurring at a very high level. This allowed a record-strong El Niño to unfold, with at least 2 months left before it reaches peak power. But we can already see obvious winter weather impacts, which you will be able to explore further down in our full Winter Explorer.
The Powerful Kelvin Wave Beneath the Pacific
The latest analysis from NOAA CRW ocean data below shows the ENSO area covered in very strong anomalies. You can see the peak warmth in the eastern parts reaching well over 6°C (11°F) above normal over a large area. This is a substantial anomaly, with very rapid El Niño growth. And the peak strength is still around 2 months away.
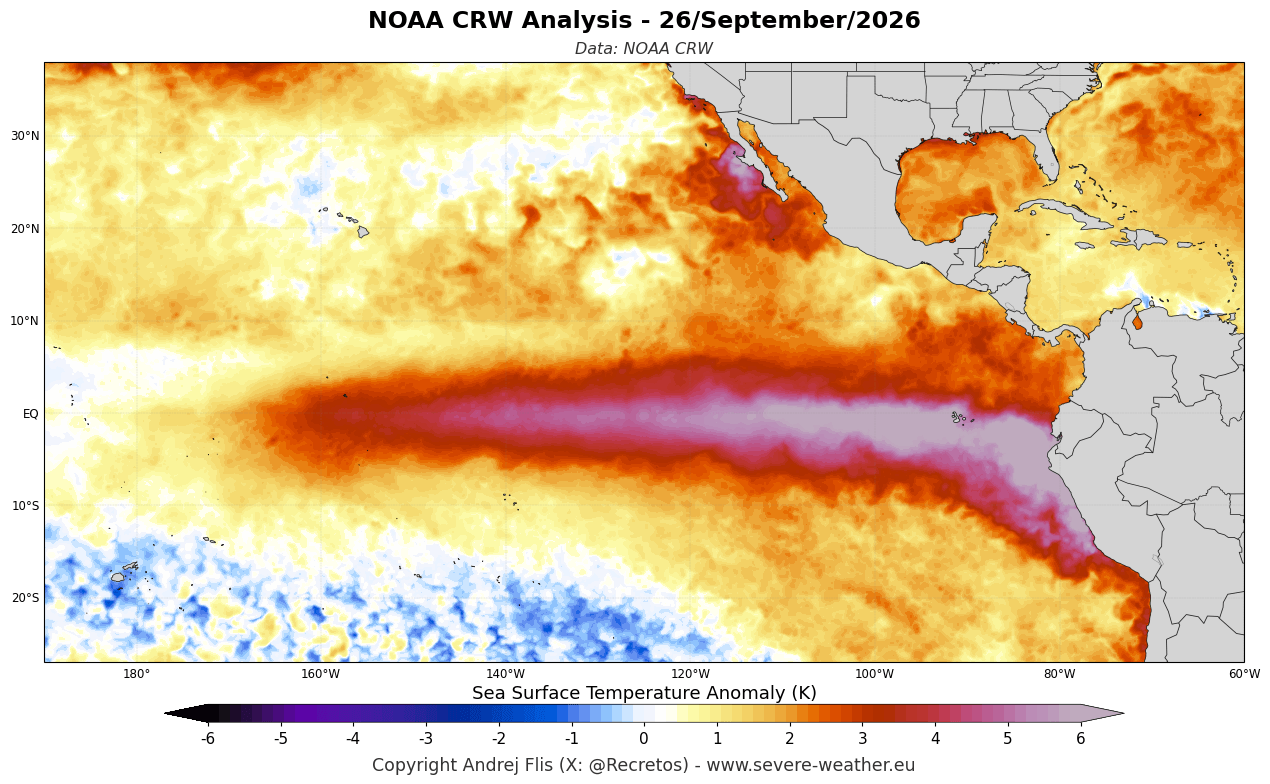
The unusually rapid growth can be seen in the latest analysis graph below for the main ENSO region. It compares the evolution of the current versus past Super El Niño events. You can see right away just how much stronger the 2026 Super El Niño is at this stage, far above the previous events in terms of raw ocean anomaly.
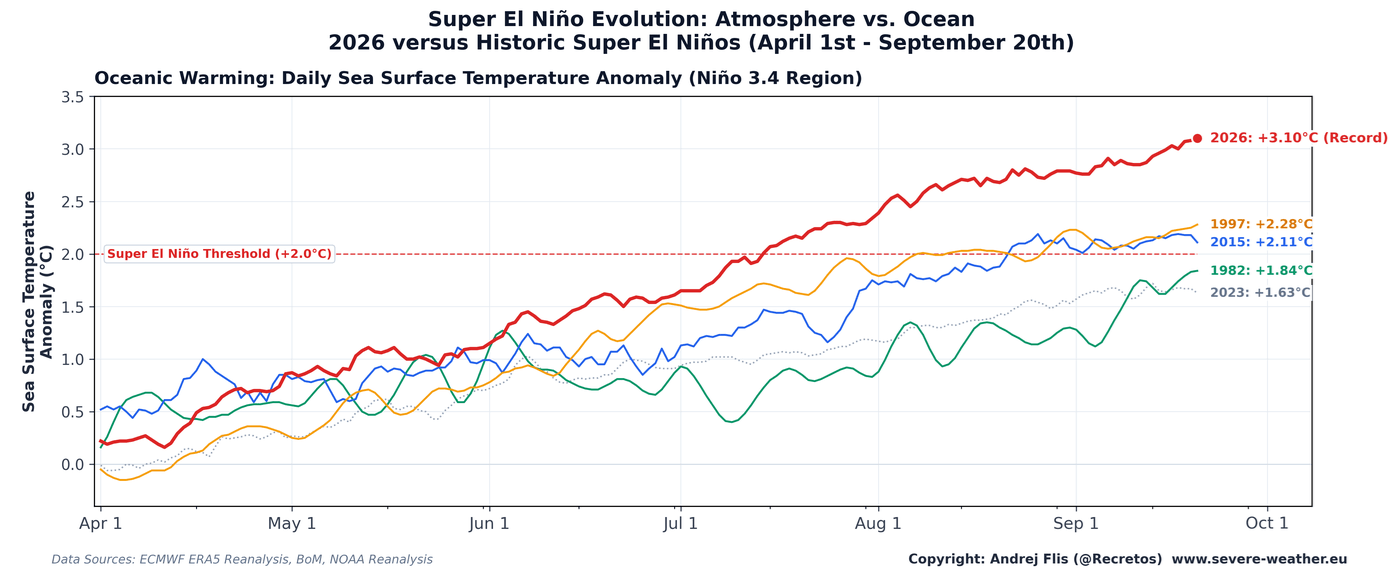
We have detected accelerated El Niño growth and strengthening since early summer. The 2026 event has quickly surpassed the last Super El Niño event (2015-2016) in speed and strength, and has also surpassed all events in recent decades.
But surface anomalies are only the final result of even stronger, invisible forces at play. The true power that is driving this rapid warming and Super El Niño development sits deep below the ocean surface and in the atmosphere.
Below is the subsurface temperature anomaly across the tropical Pacific. In the top 200m (650ft) of the ocean, you can see the engine of the 2026/2027 Super El Niño event: a powerful downwelling Kelvin Wave, with peak anomalies over 10 degrees (18°F) above normal. It is still slowly pushing eastward and rising toward the surface.
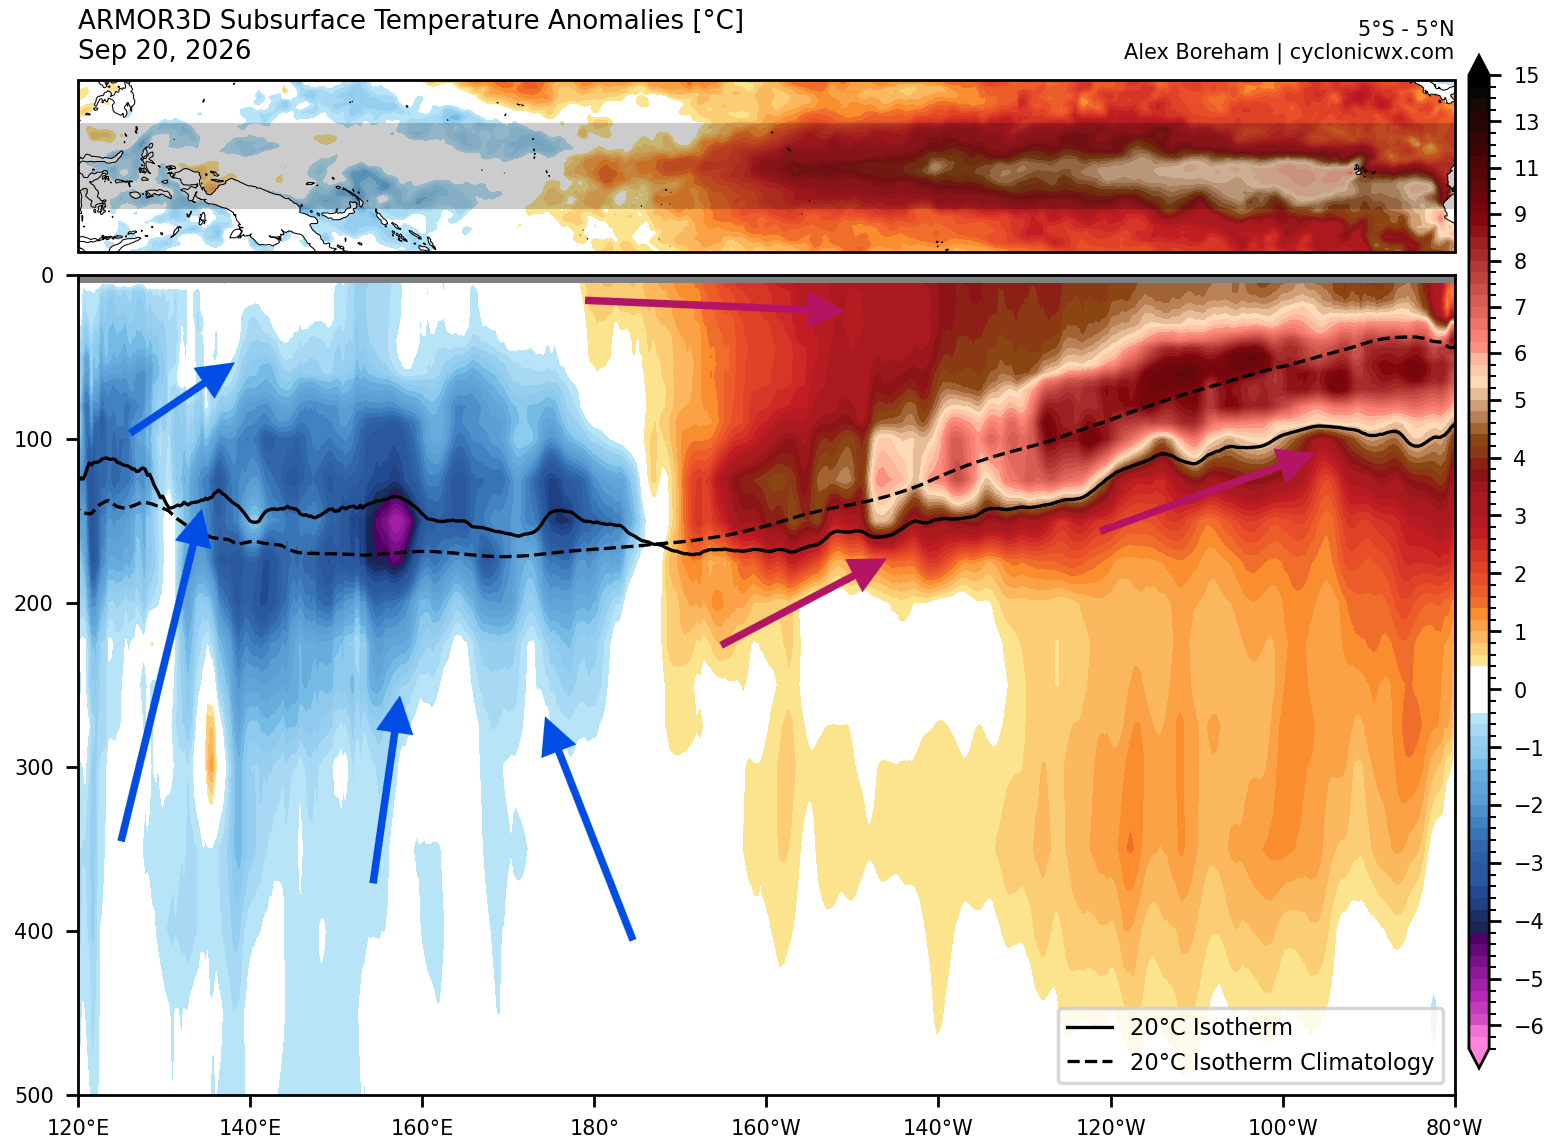
This shows us that the surface anomalies are just the final footprint of this massive subsurface warm core. Here we can see the full reversal of the usual thermal cycle under the ENSO regions, explaining the record-strong event on the surface.
I produced a video below that shows the development of these subsurface temperature anomalies over the past weeks. You can clearly see the movement and growth of this large Kelvin Wave and its eventual rise as a Super El Niño in the eastern parts.
But even these strong Kelvin Waves below the surface are driven by the westerly wind burst across the tropical Pacific, pushing the warmer subsurface ocean waters to the east, where they rise to the surface. This now leads us to the atmospheric part of the record El Niño story.
Record Westerly Wind Anomalies Fuel Super El Niño 2026
Below is the zonal wind ranking for July and August 2026, which I calculated using the latest ERA5 data. You can see how the westerly wind anomaly in the past two months compares to the past 86-year record. In the past two months, a broad region of the western and central equatorial Pacific recorded its strongest low-level westerly wind anomalies on record, with surrounding areas ranking in the top five.
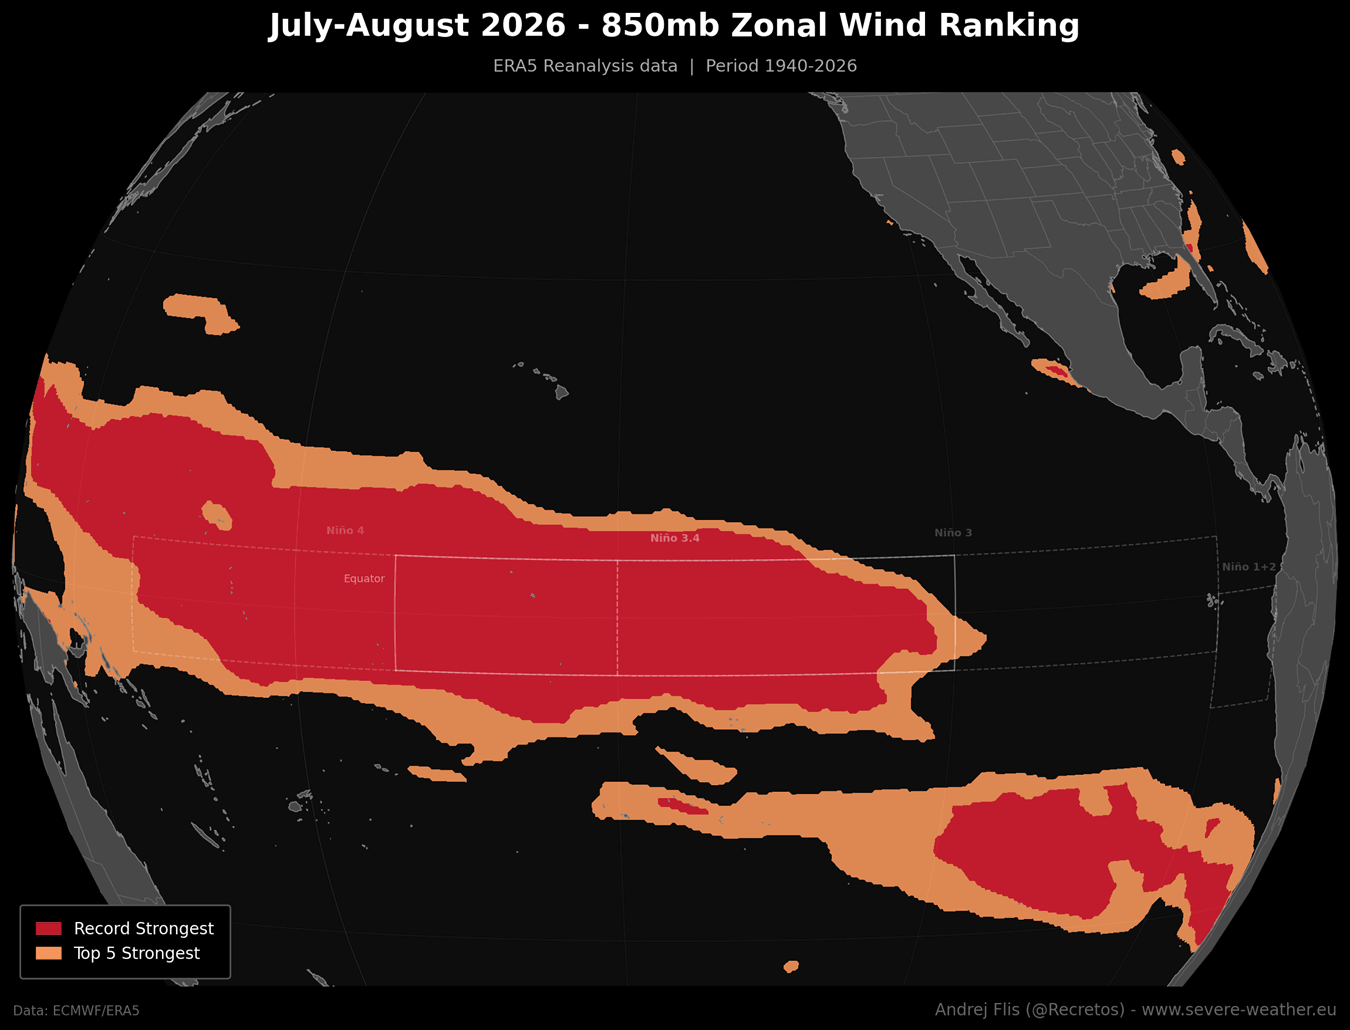
This matters because achieving such an absolute record in an 86-year dataset for a two-month average requires a major trade wind collapse. This is the “smoking gun” showing that the record atmospheric shift is behind one of the strongest El Niño events to develop.
And this shift is also visible in the ocean heat content below, which looks at the ocean down to 300m (1000ft) depth. You can really see an expanding warm subsurface anomaly across the tropical Pacific and ENSO regions from Spring to now, driven by the westerly wind bursts that push the warm Kelvin Wave eastward.
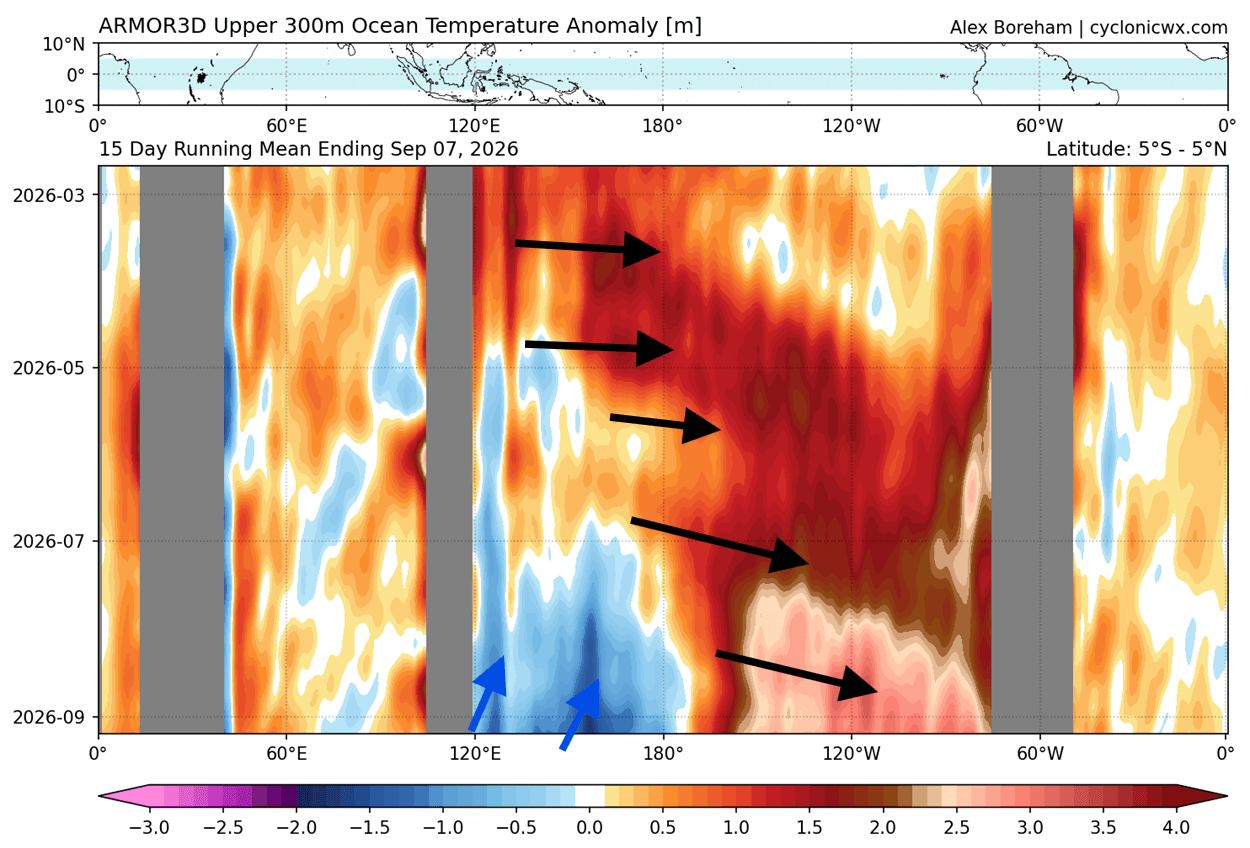
Continued westerly winds will help further sustain and strengthen the Super El Niño anomalies. The image above also shows the emerging cold area in the western Pacific. That occurs as the strong westerly winds push warm waters east, bringing up deeper, colder water in the west.
Below is the latest forecast of the trade winds across the tropics. You can see sustained strong westerly wind-burst anomalies (warm hues) over the main El Niño region. This will further strengthen the 2026/2027 super event, which is predicted to peak in November-December.
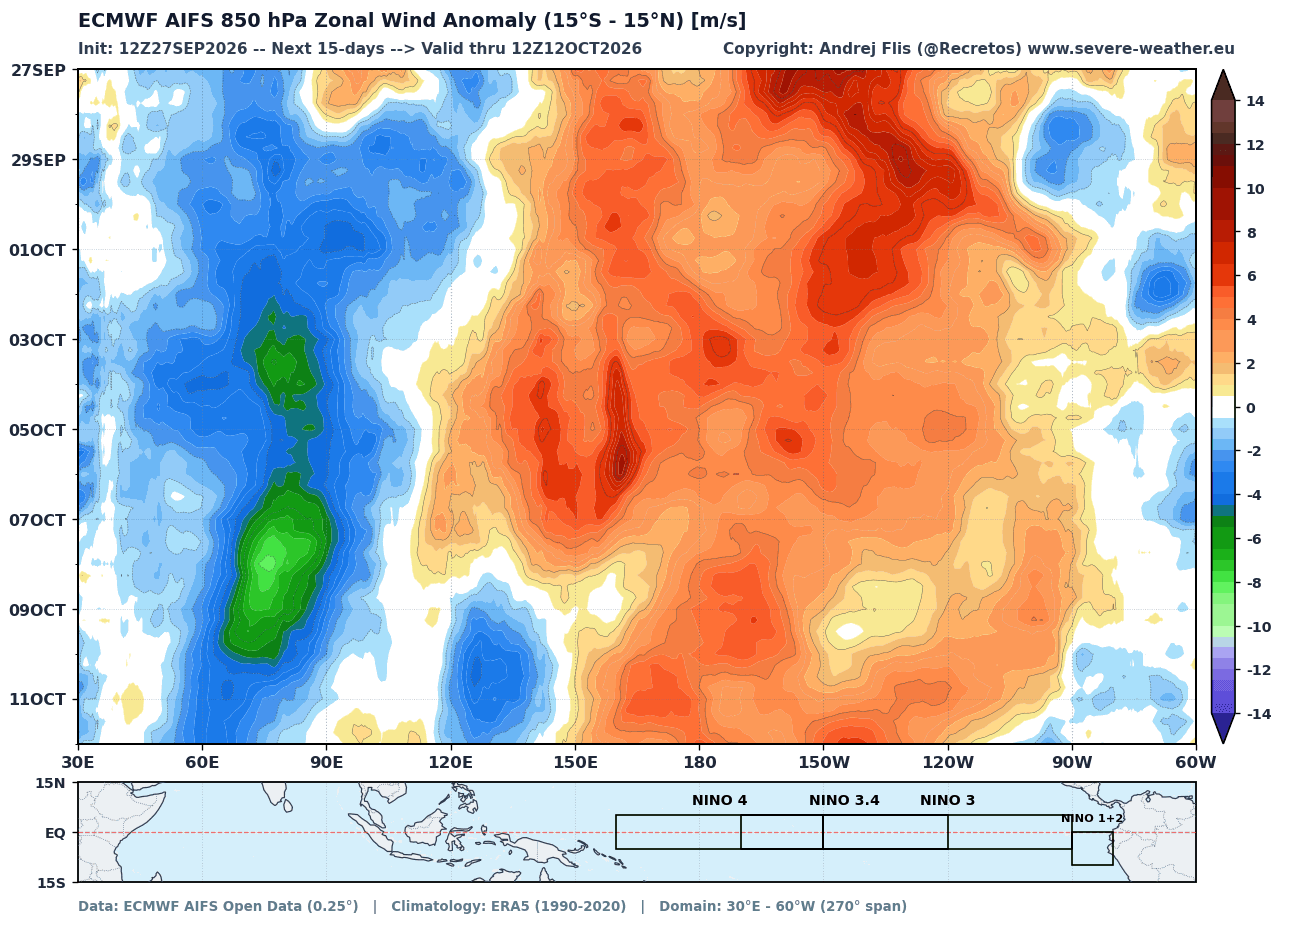
And looking into the coming weeks and months, the long-range predictions have finally come together on what development to expect for Winter 2026/2027.
Latest El Niño Forecast: A Historic Peak Ahead of Winter 2026/2027
Below is a comparison I produced using the latest ECMWF forecast. You can see the current progression (black) and the latest forecast (red), compared with the last four super El Niño events and all El Niño events in the past 70+ years. The 2026/2027 event is clearly projected as the strongest in over 7 decades, peaking higher than any El Niño in this period.
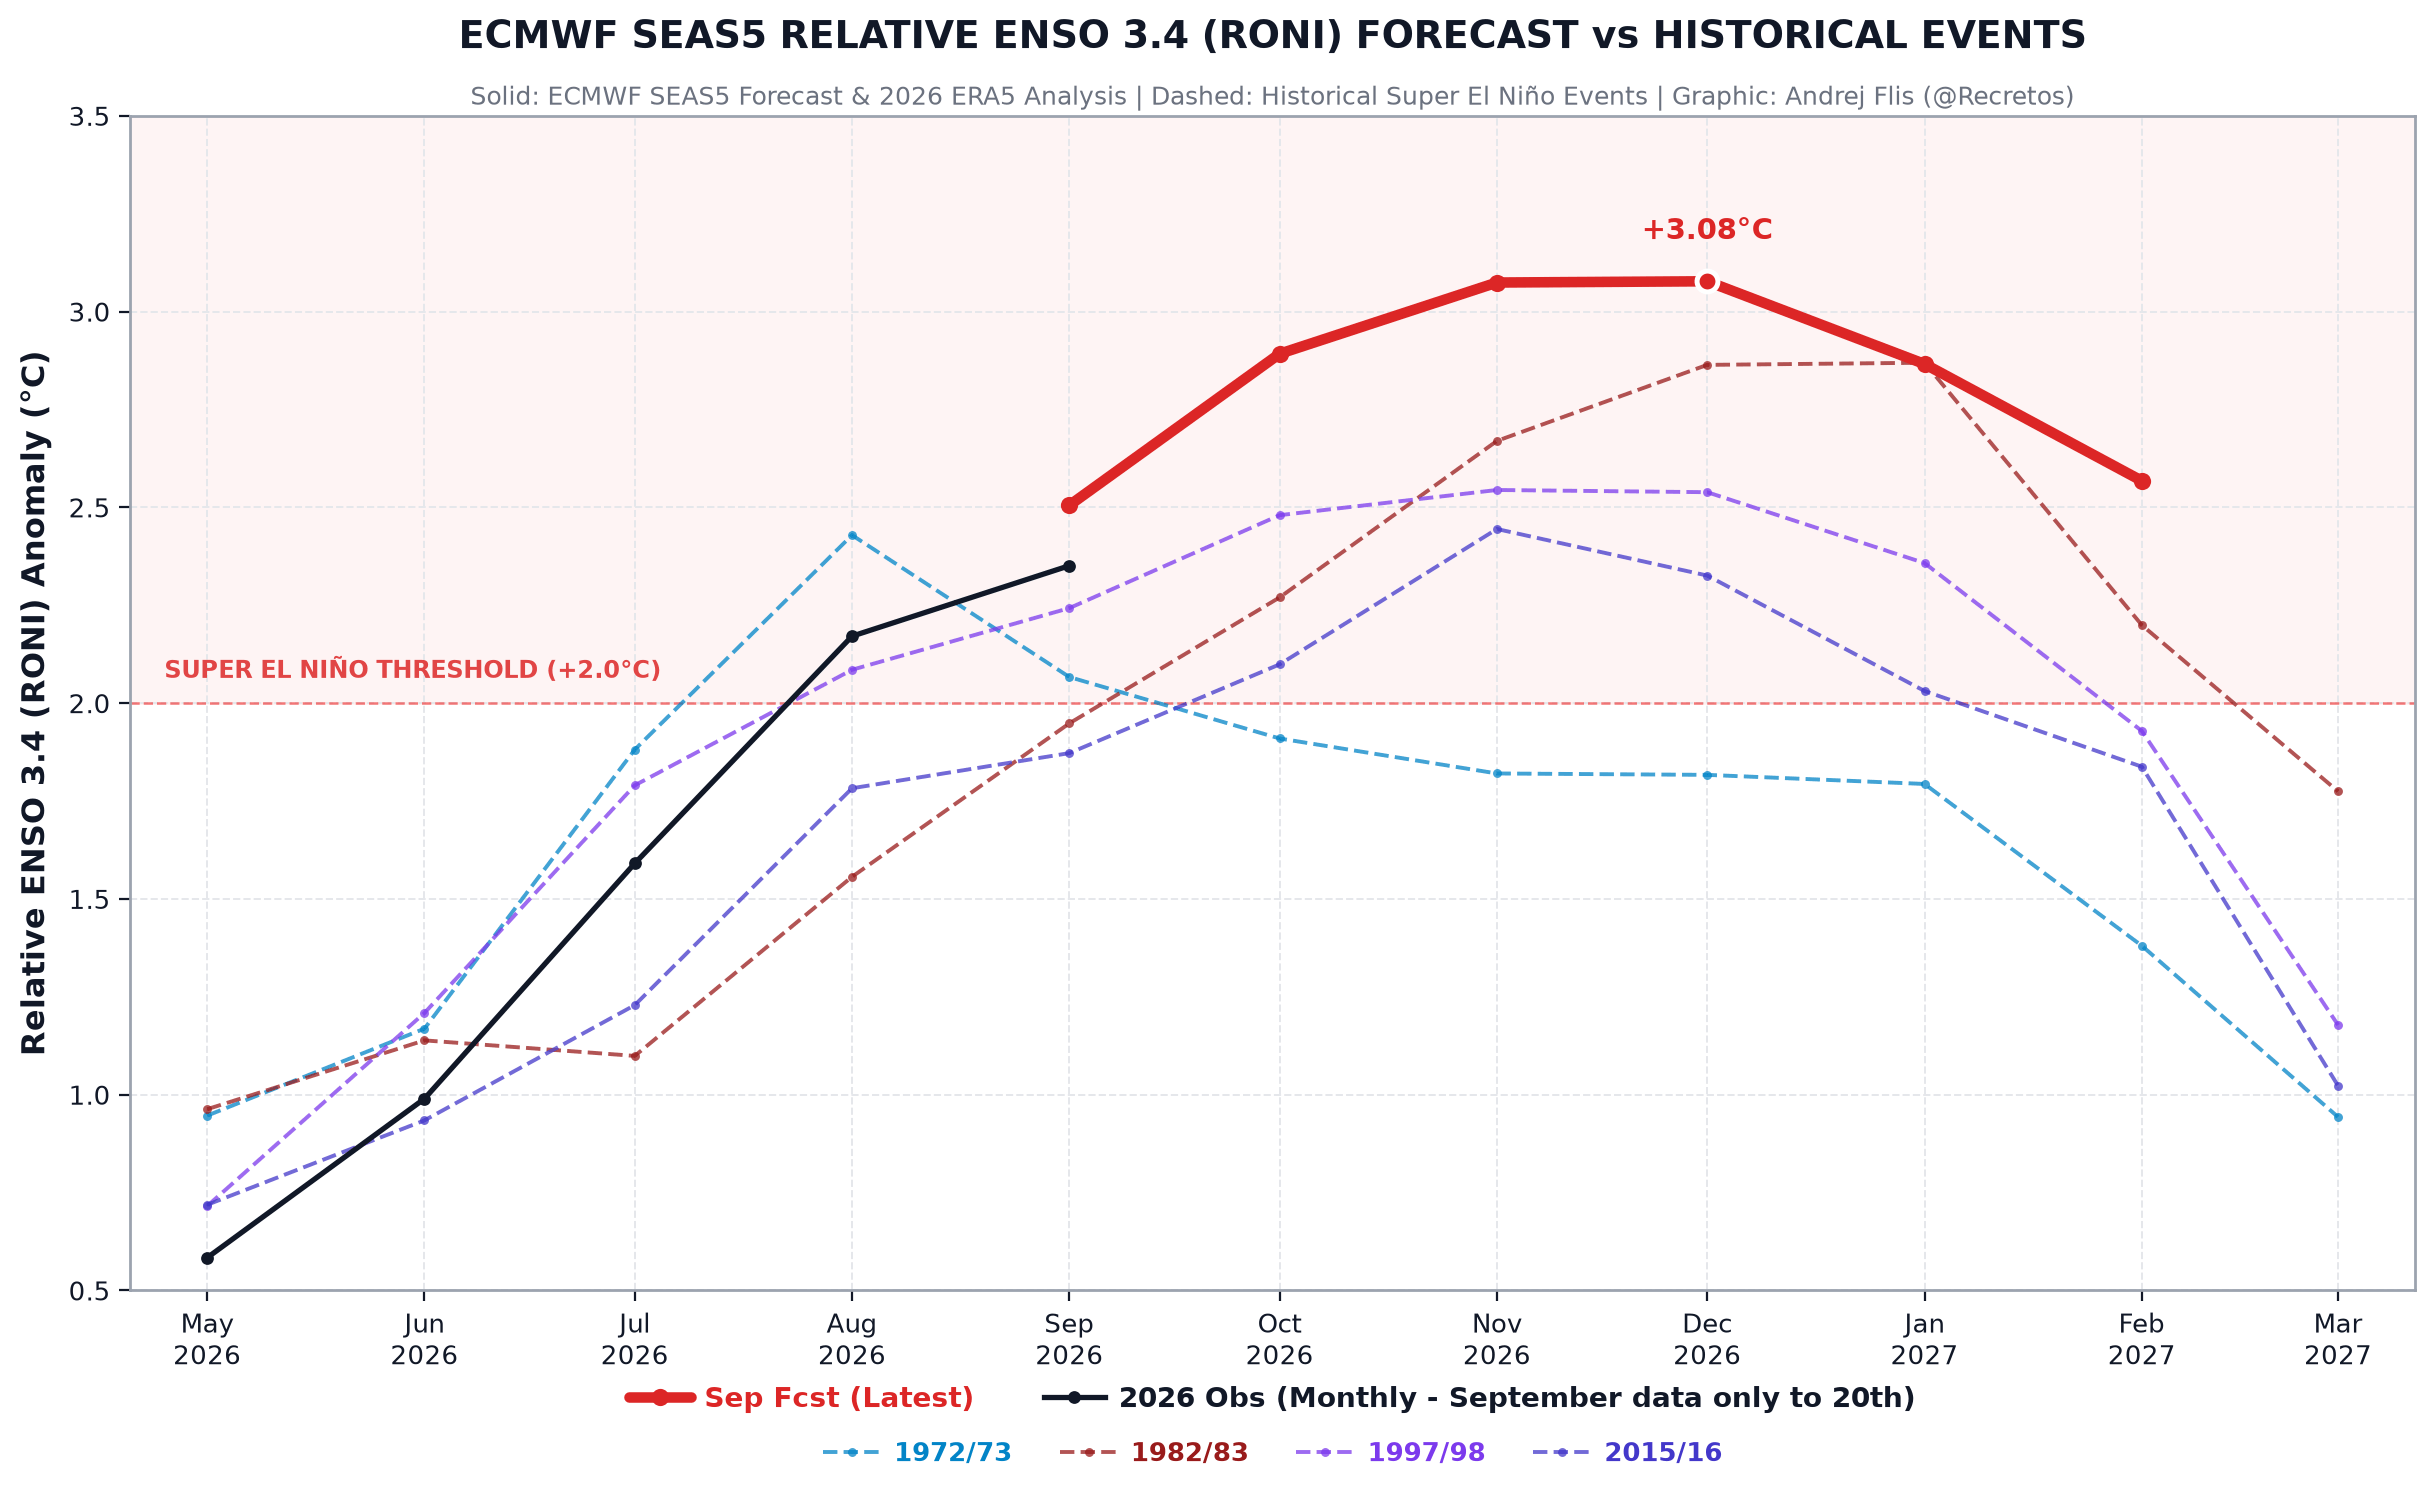
No El Niño event, even in extended records back to the 1800s, has peaked monthly above +3°C (+5.4°F). And I am using the Relative (normalized) scale, which is also used by NOAA and WMO, making all events comparable across decades.
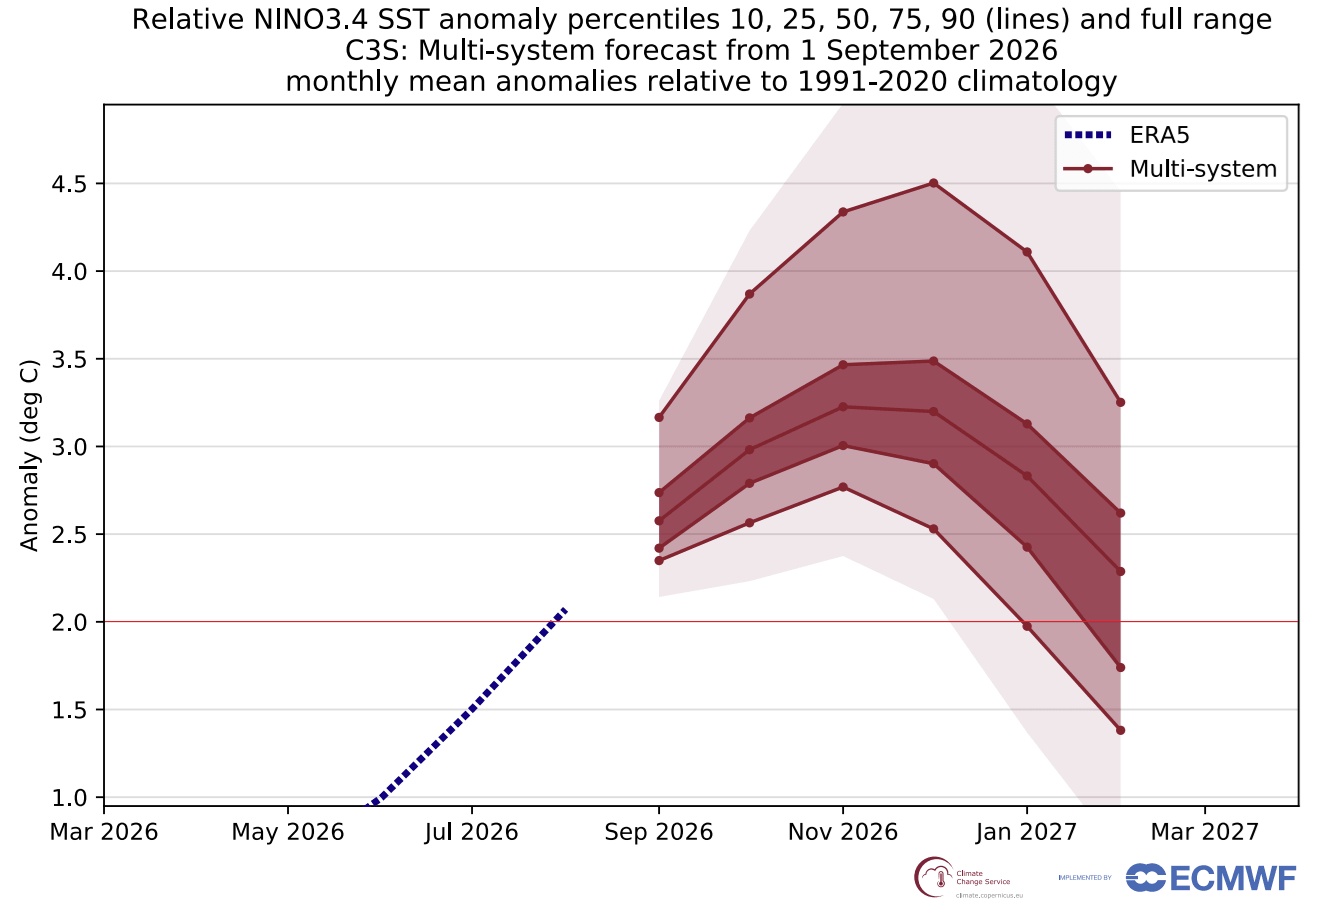
The multi-model forecast below shows the exact same evolution. It also predicts a strong El Niño peak above +3°C (+5.4°F) in the average, making this the strongest El Niño in at least 8 decades, with a December peak event and a rapid drop-off.
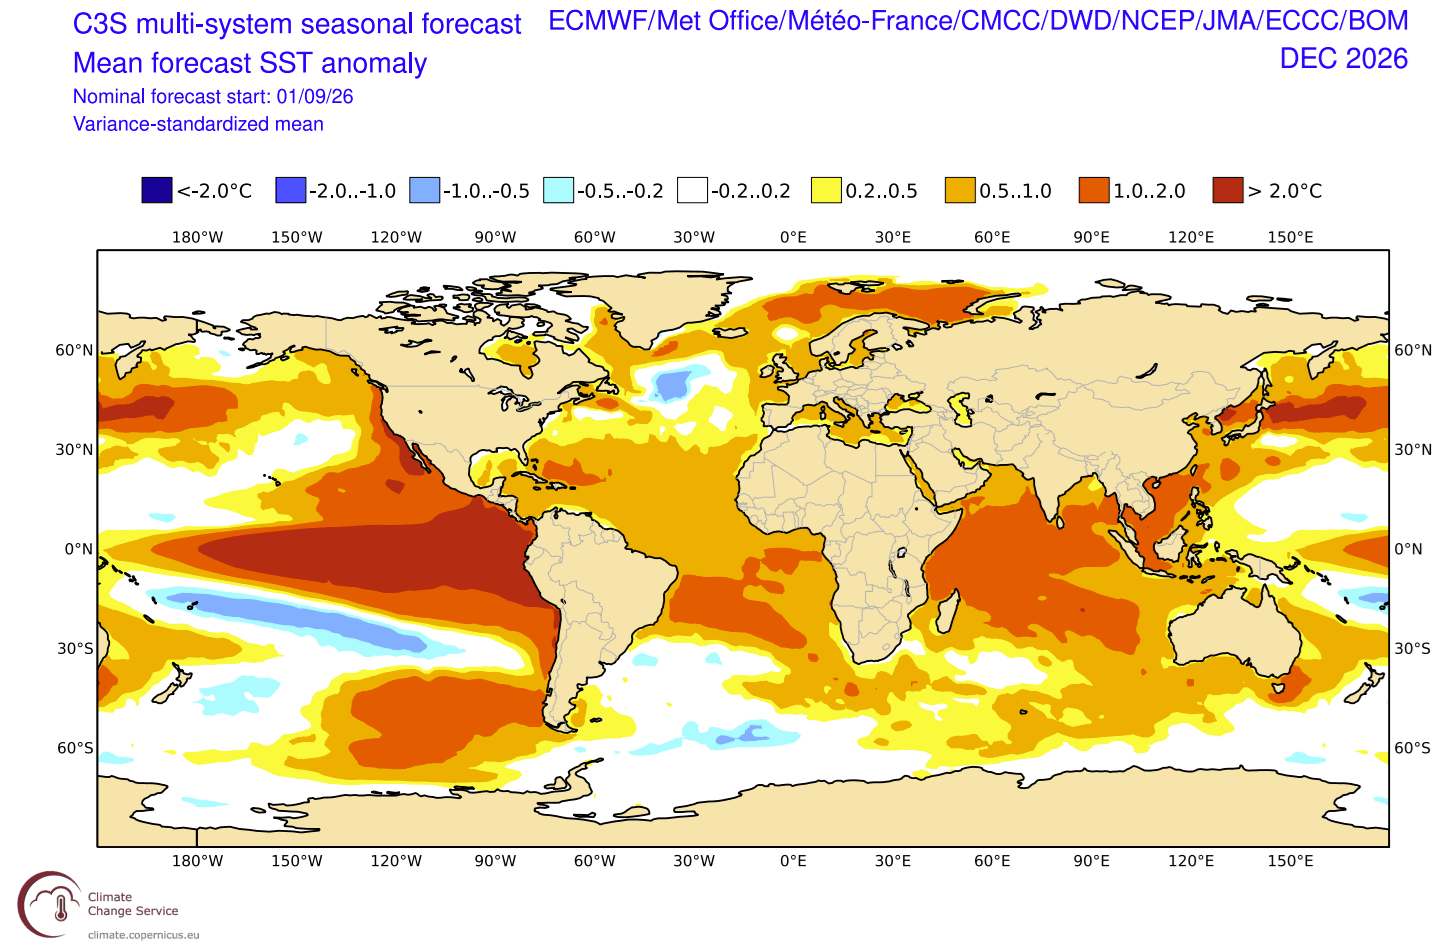
Looking at the oceanic forecast below for December, you can see a significant Super El Niño event that stands out across the global oceans. Peak anomalies reach over 7°C (12.5°F) above normal in the eastern parts, making this a truly historic event, unfolding live.
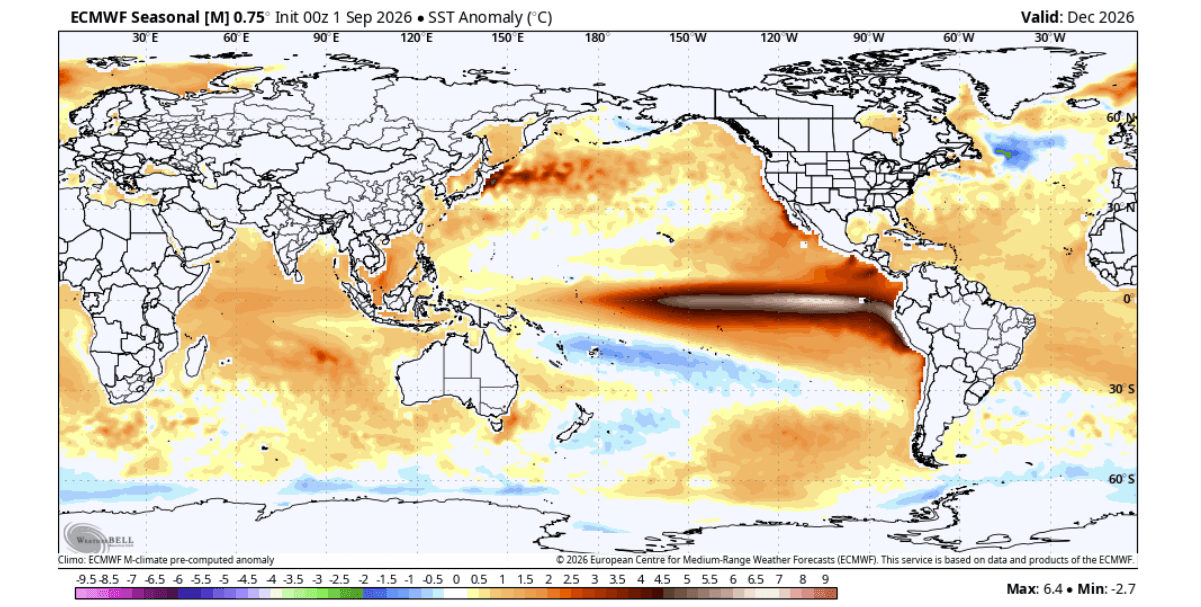
El Niño events always peak later in the year, with the latest forecasts trending toward a max anomaly around November to December, as seen above. The multi-model forecast below for November also shows a very strong event, with the Super El Niño-related anomalies covering over 10% of the global ocean surface.
But as the data show, the atmosphere is also responding strongly to this El Niño event, with clear seasonal impacts in late Fall and Winter 2026/2027.
How Super El Niño Reshapes Global Circulation
To detect the atmospheric impact of the Super El Niño, we need to find its circulation effect, very easily visible in the global circulation.
We monitor the global atmospheric circulation pattern by looking at broad areas of rising and sinking air, called a Walker cell. These areas are usually dynamic, moving around the globe with different atmospheric waves and drivers. But with a Super El Niño, the strong ocean heat and energy can lock down these areas in place.
What this does is create a so-called atmospheric standing wave. You can see this in the ECMWF forecast below, which shows the main areas of the Walker cell almost fixed/stationary over time, for the duration of the forecast through late September and into October.
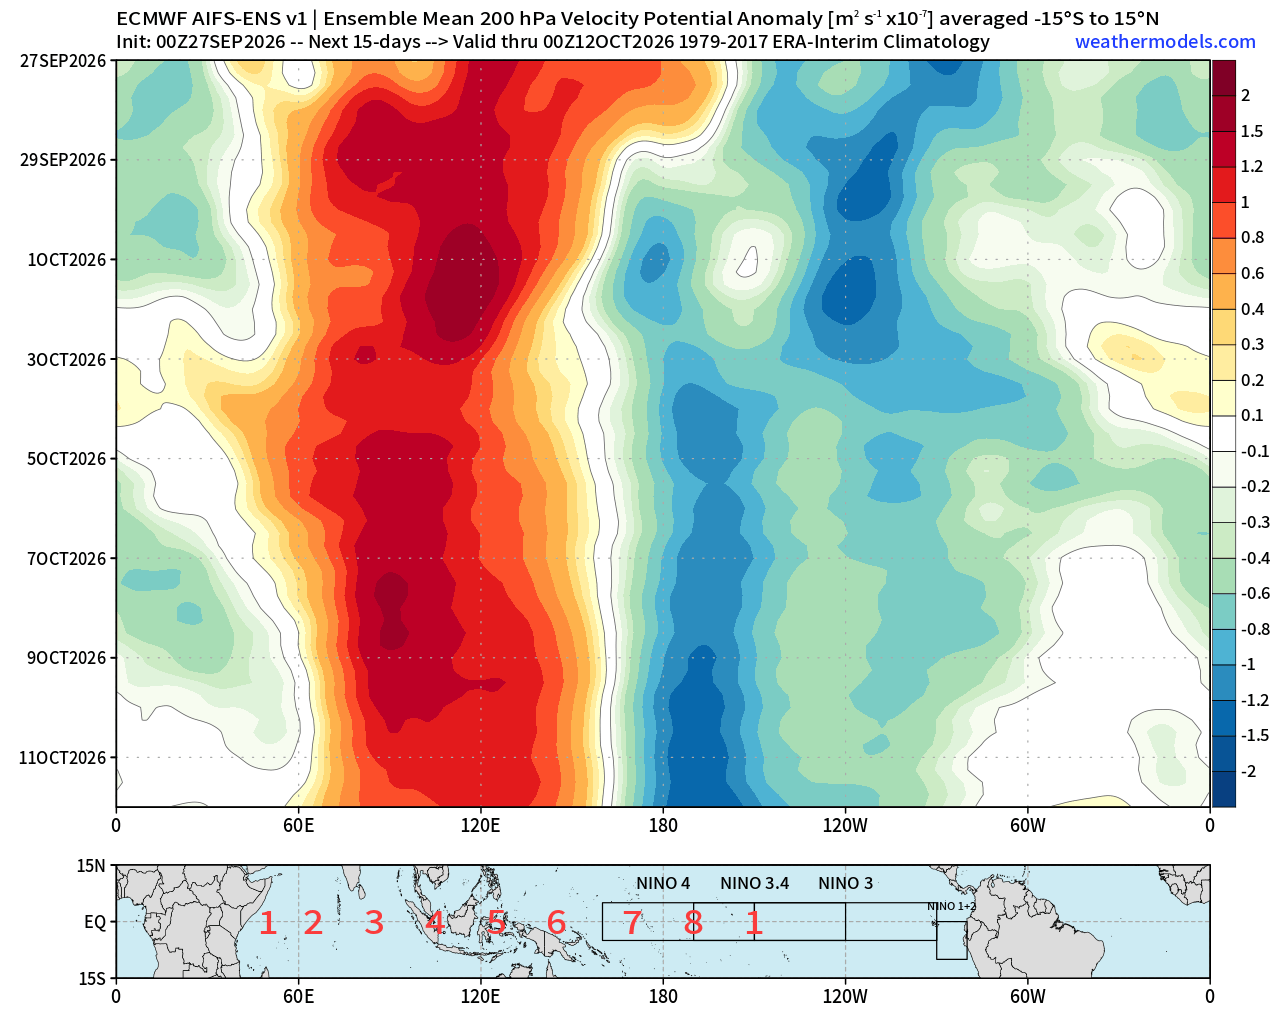
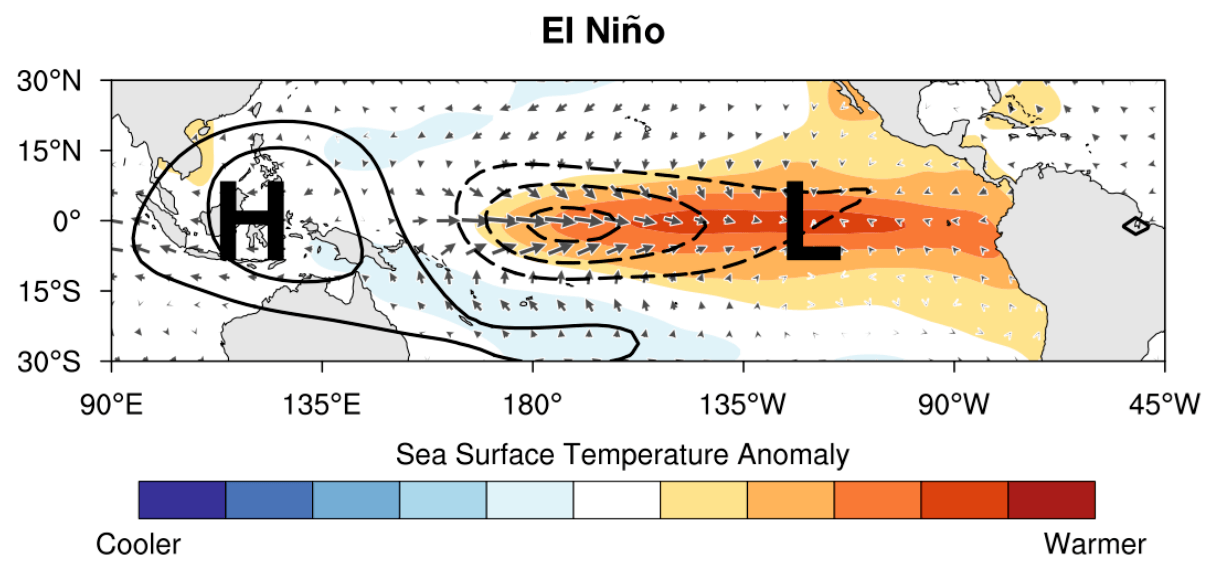
You can see the two main areas of rising and sinking motion: low pressure over the tropical Pacific and stable sinking air over the Indian Ocean, which together reveal the standing-wave formation. In the schematic below from NOAA PSL, you can see how this looks in nature, impacting the pressure patterns further out.
But to put this into a more reasonable scale, NOAA has created the Multivariate ENSO Index (MEI). This index combines oceanic and atmospheric data into a single measure of the ENSO state. This reveals how strongly the El Niño signal is established across both the ocean and atmosphere.
The MEI table below shows the bimonthly values for 2026, compared with the last 3 Super El Niño events. The latest value shows that 2026 reached a record-high July-August (JA) value of +2.5, the highest for this period in the NOAA record since it began in 1979.

Values above +2 are found only during the strongest El Niño events. This confirms just how strongly the oceanic and atmospheric signals have already developed in 2026. It also means the weather in your backyard is directly or indirectly connected to what’s happening in the tropical Pacific, no matter where on this planet you live.
With a record 2026/2027 Super El Niño event, we are entering near-uncharted waters in terms of atmospheric impacts.
Winter 2026/2027 Forecast Explorer: See the Regional Impacts For Your Area
There is nothing in the past data to directly compare to the 2026 event and Winter impacts. But we can still look at the last 4 Super El Niño events and how the average Winter looked in those seasons.
The pressure analysis is the most telling, as it shows the average positioning of the pressure systems across these four events, with a strong atmospheric wave over North America. The main feature is the deep, intense low-pressure anomaly over the North Pacific.
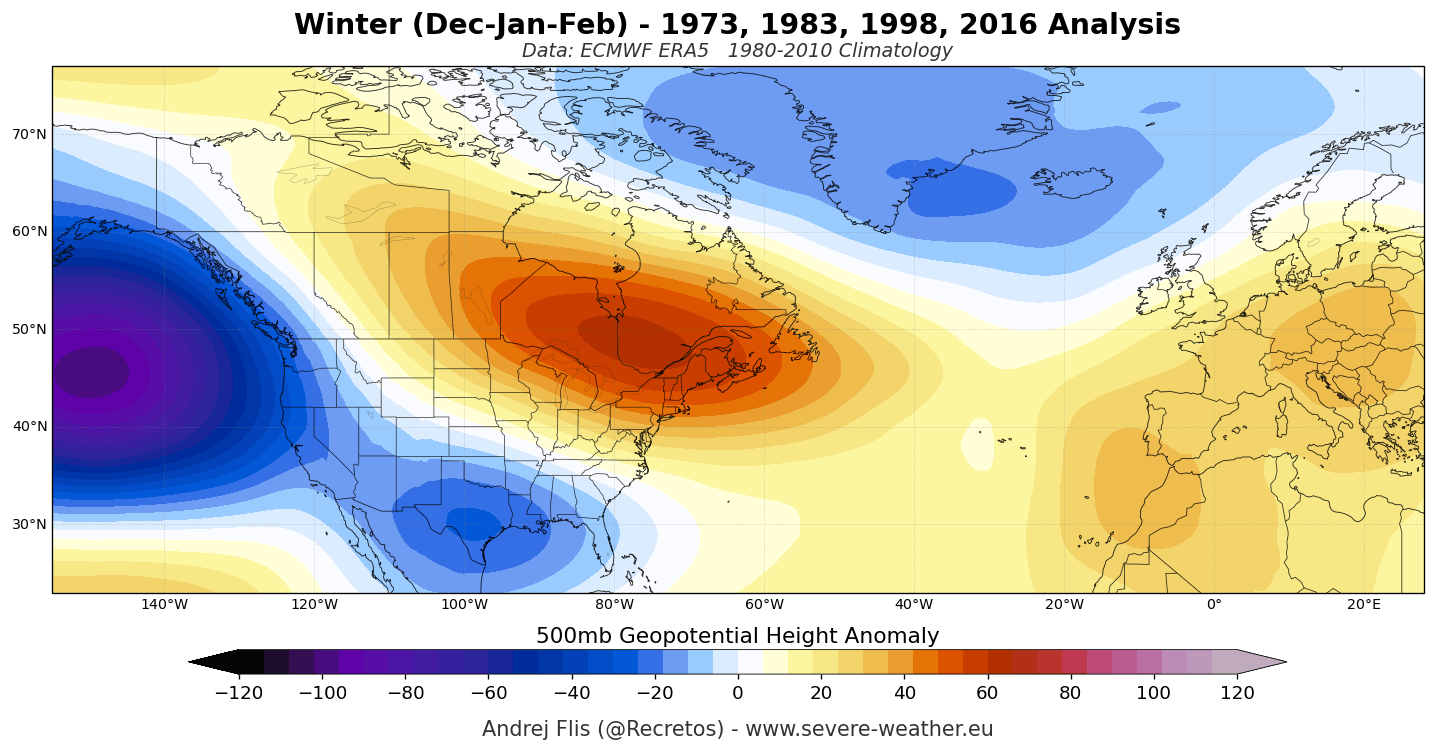
Such a deep low helps to build a massive high-pressure ridge over Canada, the northern U.S., and the Great Lakes, forcing the jet stream to split. This keeps the coldest air deflected away from the northern parts, with an active storm track across the southern United States. This brings lower pressure over the North Atlantic and a milder westerly flow across most of mainland Europe.
The temperature analysis below confirms this story, showing the average temperature anomalies across past Super El Niño events. It clearly highlights the sharp contrast between the warmer air mass under the high-pressure zone in Canada and the northern U.S., and the low-pressure highway to the south.
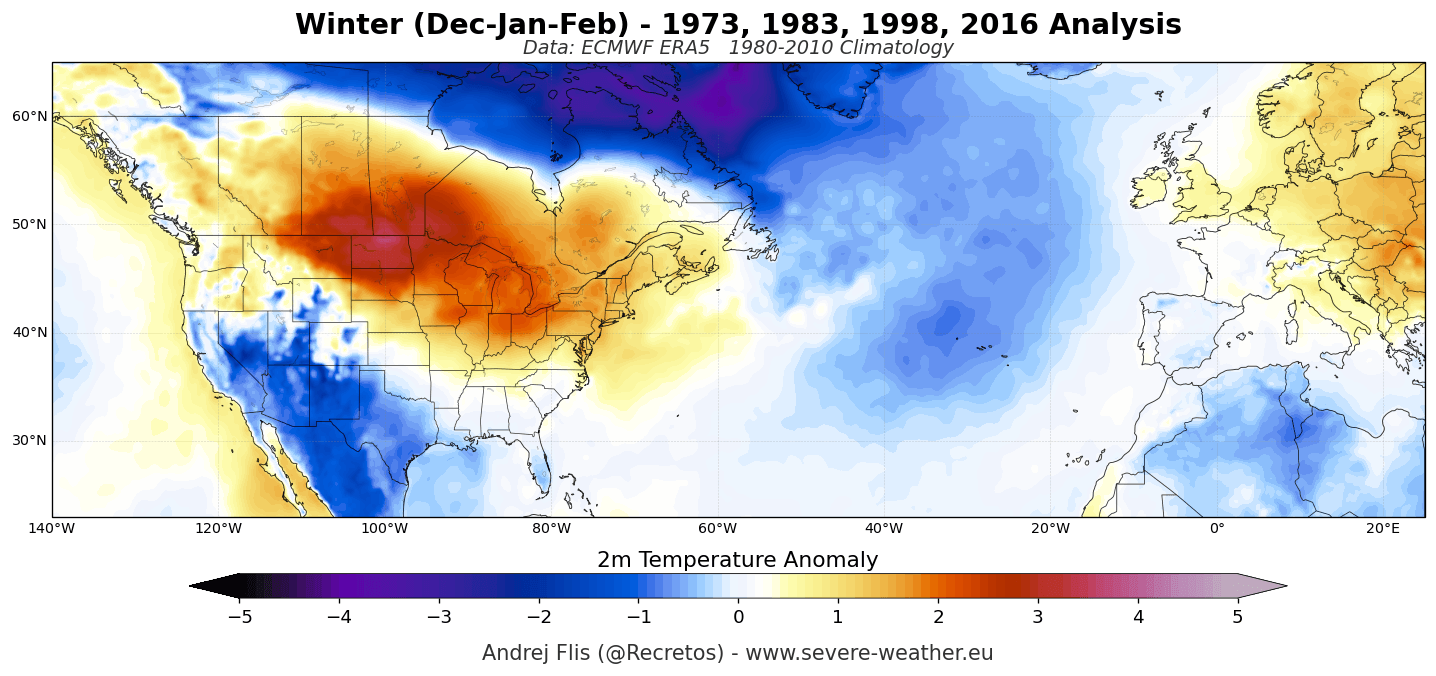
Over the Northern United States and southern Canada, temperatures are well above normal. But an amplified subtropical jet stream keeps temperatures cooler across the southern United States. Over Europe, the dominant westerly flow drives above-average temperatures across most of the continent.
This really shows just how strong the Super El Niño global forcing is. You can also see this on the example forecast map from our Winter Explorer below, with sharply separated hot and cold anomalies over the United States in a forecast for February. Use the menu below to view the full forecast fields for your state, province, or country from two major seasonal models.
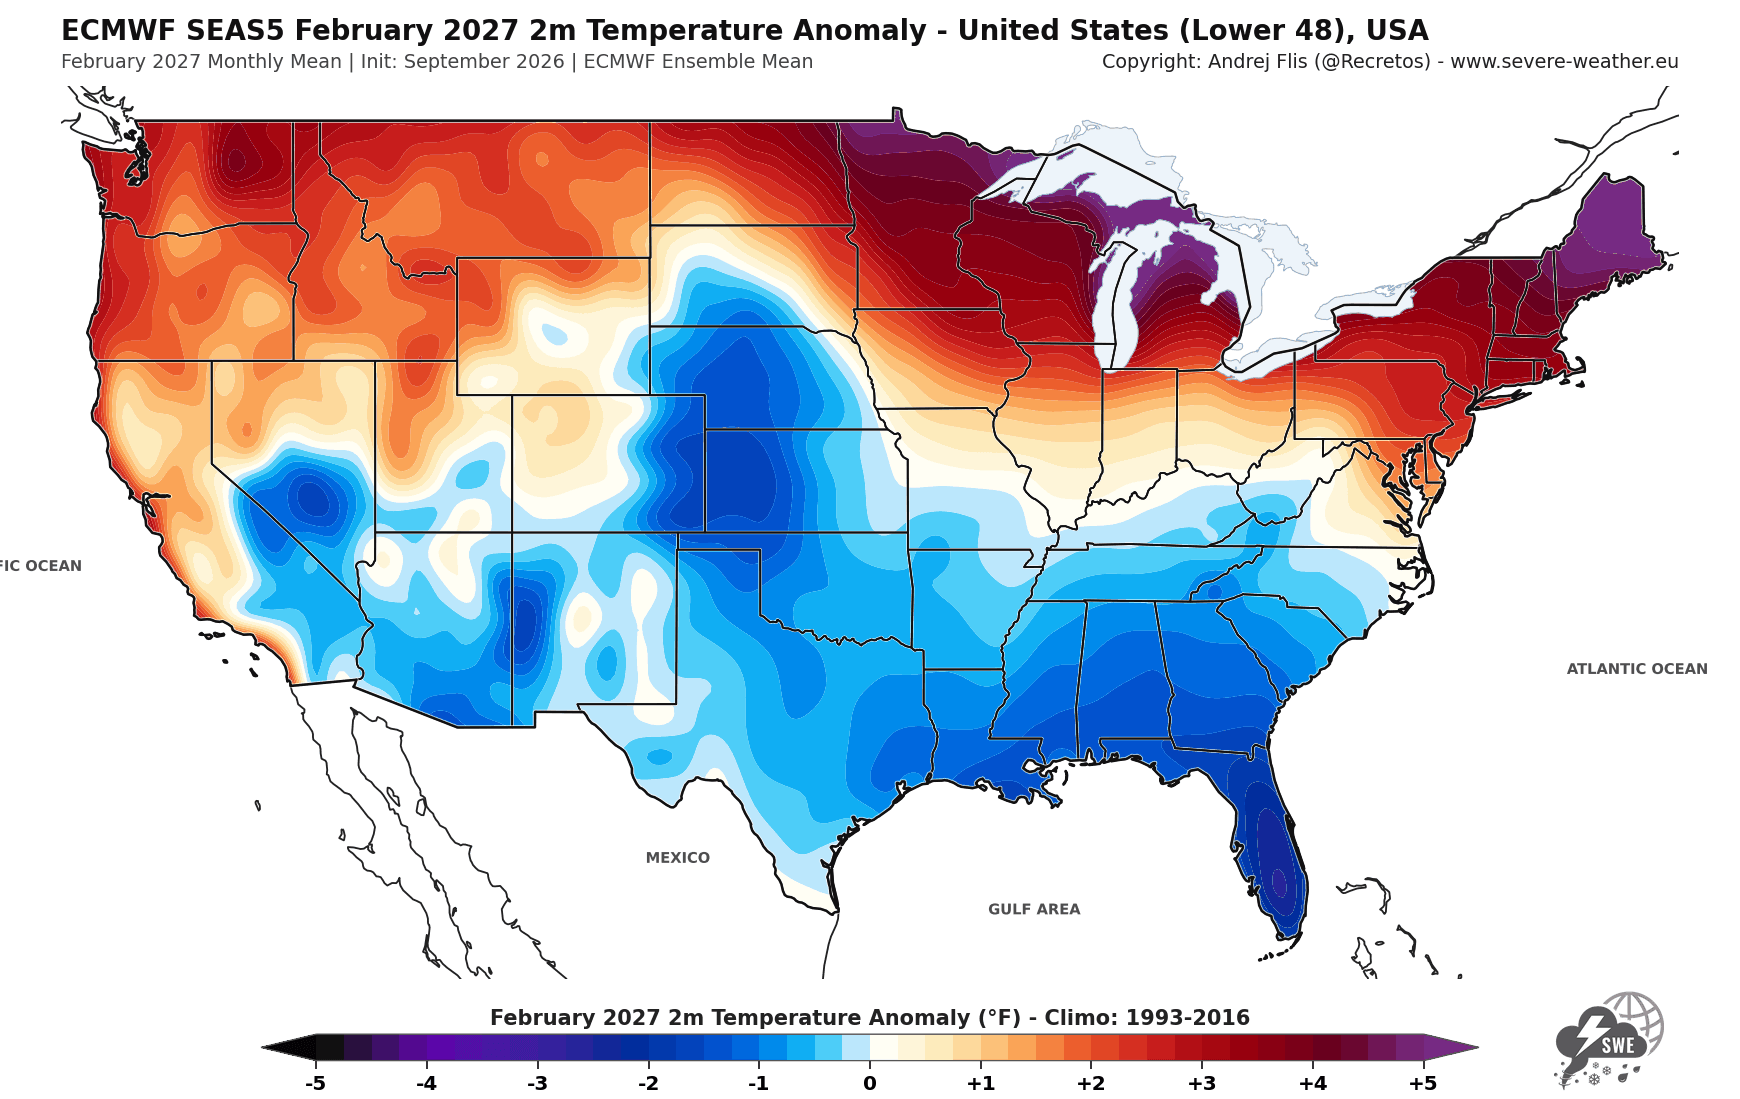
Below, in our winter explorer, you can explore the latest snowfall, temperature, and precipitation forecasts and trends for every state, country, and region across the United States, Canada, Europe, and parts of Asia. Images are high-resolution, so you can freely pinch-zoom on mobile.

Scientific Research Used in this Article
- Extreme El Niño Teleconnections: A Distinct and Reproducible Teleconnection Pattern over North America during Extreme El Niño Events - Beniche et al. (2024).
Forecast and analysis images in this article are from ECMWF, CyclonicWX, weathermodels.com, and WeatherBell (using a commercial license).
See the Latest Snowfall Forecast for Your State and Region: Winter 2026/2027 Snowfall Explorer
Polar Vortex Watch: A New Polar Vortex Is Emerging Over the North Pole, With a Winter 2026/2027 Disruption Risk
We will keep you updated on the global weather pattern development, so bookmark our page. Also, if you have seen this article in the Google App (Discover) feed, click the like (♥) or the star button there to see more of our forecasts and our latest articles on weather and nature in general.