Every fall, the same question appears on weather forums and social media: Is snow spreading fast across Siberia? Many weather enthusiasts believe that a quick October snow advance there is an early warning sign of a cold, snowy winter for the United States, Canada, and Europe.
This idea comes from a famous scientific study published in 2011, and it has been repeated every winter since. With a fast snow surge forecast again this October, I decided to test whether it still works in the modern era. I went through 47 winters of data, from 1979 to 2025, using four different snow datasets, including the satellite data used in the original study.
The results were surprising, and they change how we should read this October’s snow. Below, I explain how October snow is supposed to disrupt the Polar Vortex, why the theory looked so convincing, what the data really shows, and what the latest forecasts indicate for Winter 2026/2027.
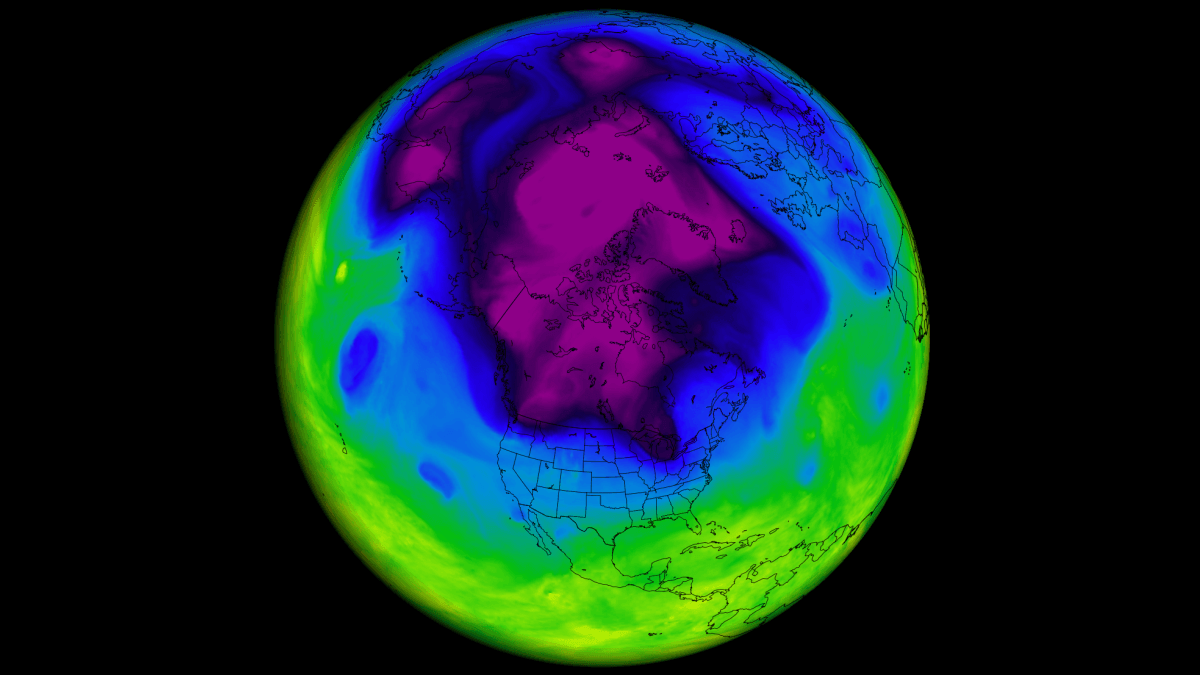
The Expanding Snow Theory: How a Snowy October Became a Winter Signal
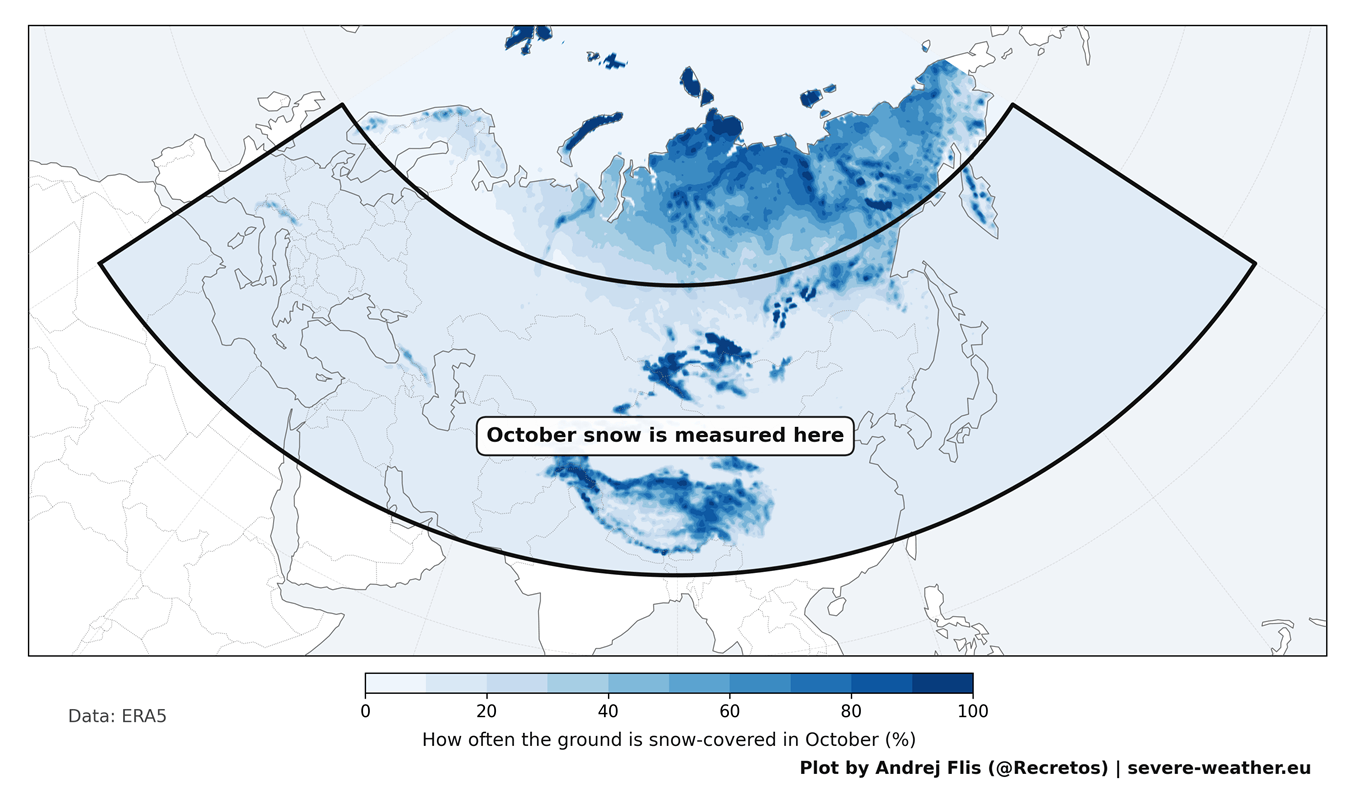
In 2011, scientists Judah Cohen and Justin Jones found a remarkable winter signal. They measured how fast snow cover expanded across Eurasia during October and its potential impact on the following winter season. The faster the snow advanced, the more likely the winter was to bring outbreaks of cold Arctic air into the mid-latitudes of the U.S. or Europe.
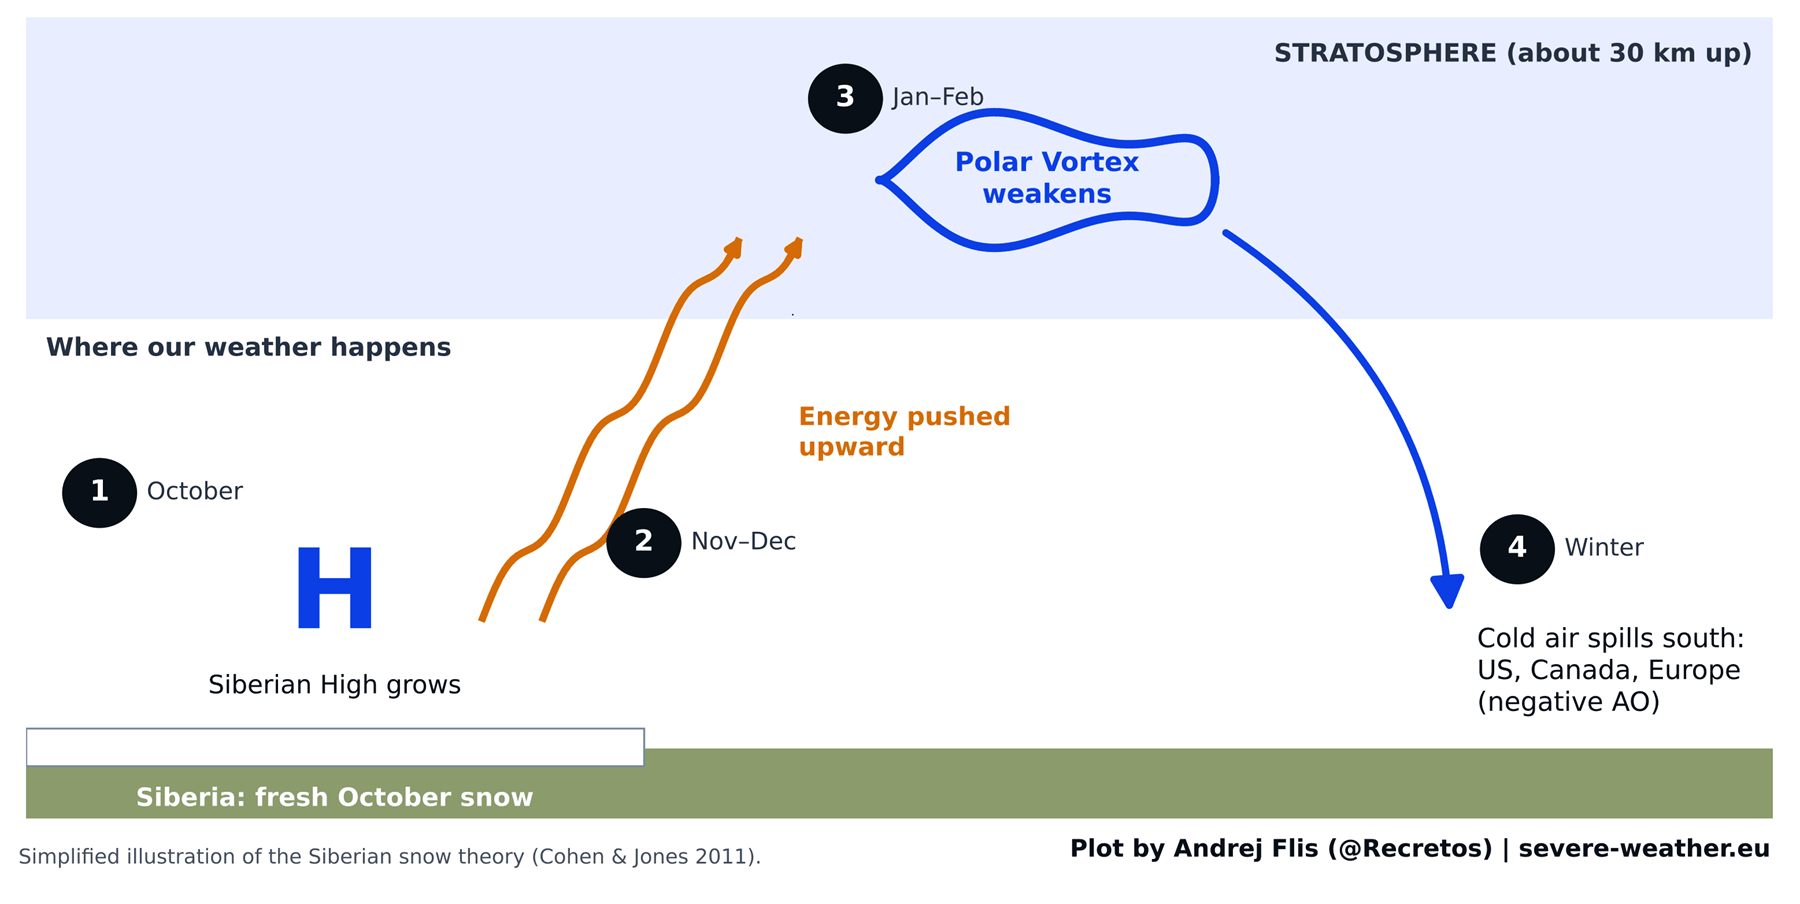
The idea behind it makes complete physical sense. Fresh snow cools the ground and strengthens the Siberian high-pressure zone, a large area of cold, heavy air over northern Asia. This pushes extra energy upward, high into the stratosphere, around 30 km (18.5 miles) high. There, it can weaken the Polar Vortex, a well-known ring of strong winds that keeps the coldest air locked over the Arctic.
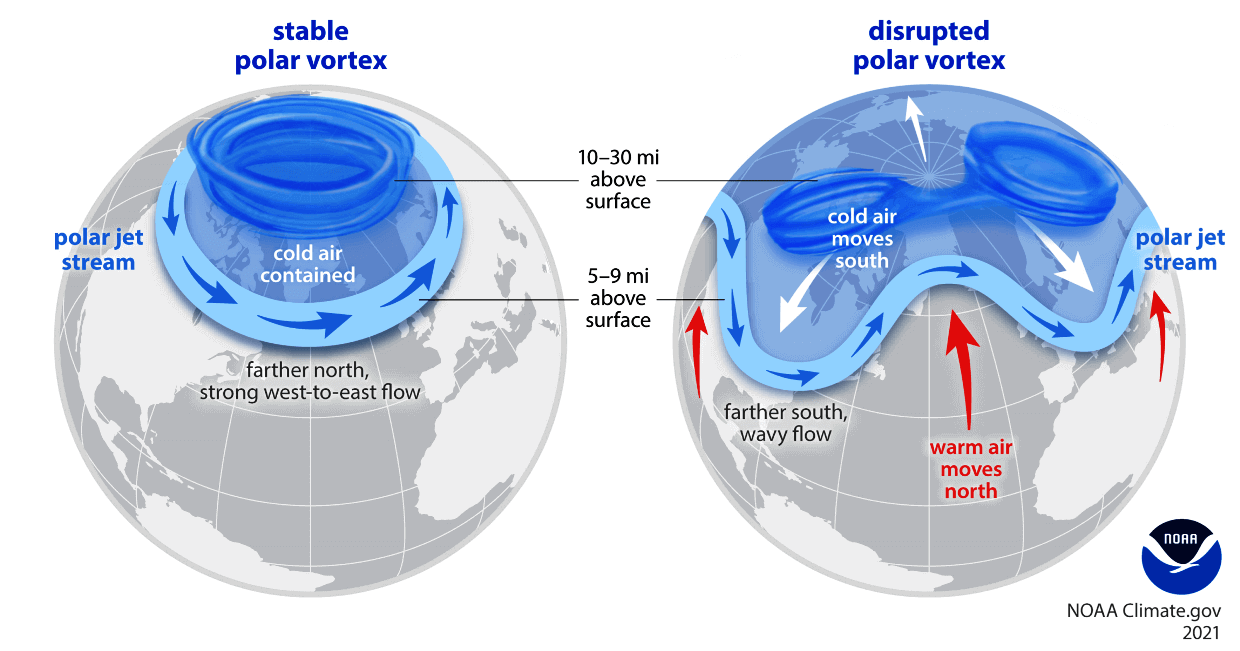
To show the Polar Vortex dynamics, I produced a high-resolution 3D video below that reveals its evolution under stress. This video shows the Polar Vortex structure disruption in early 2026, which brought a cold-air outbreak to the central and eastern United States and parts of Europe, in this case unrelated to the snow advance in the preceding October.
When the Polar Vortex weakens, the cold air it normally keeps in the Arctic can break out and spill south into North America and Europe. Meteorologists track the resulting weather pattern with a simple index called the Arctic Oscillation (AO). When the AO is positive, the cold stays locked in the Arctic, and winters tend to be milder.
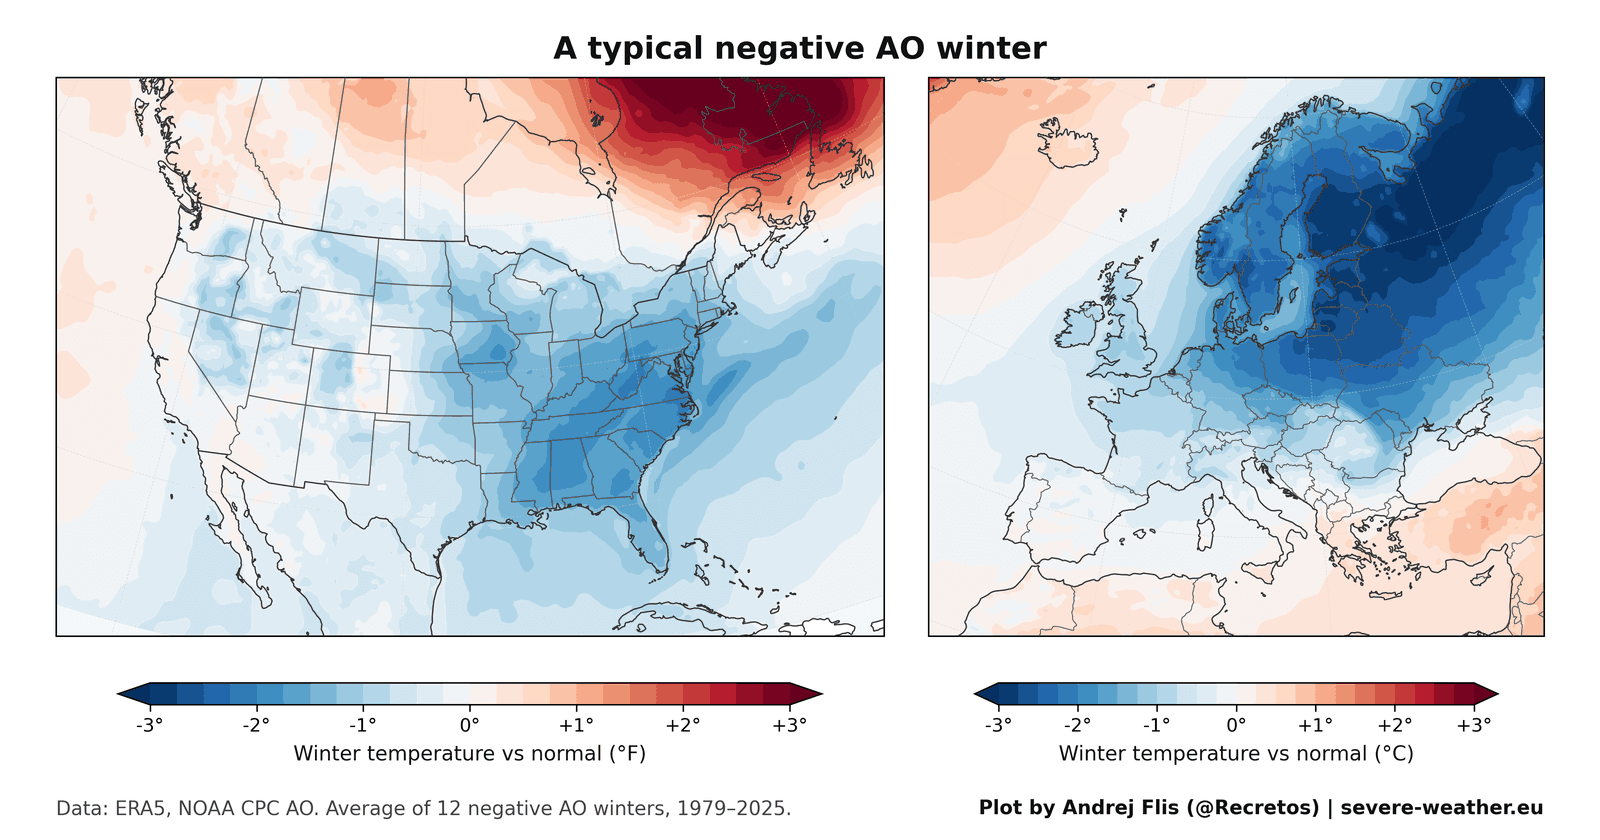
In the United States, the cold is focused on the eastern half of the country, from the Ohio Valley and the Mid-Atlantic down to the Southeast and Florida, while the West stays near normal. At the same time, eastern Canada is much milder than normal, because the cold air that is normally stored there is pushed south.
In Europe, the strongest cold is over the north, spreading into the UK, Ireland, and Central Europe, with southern parts remaining closer to normal.
This is the kind of winter that the Siberian snow theory favors after a fast October snow advance. And that is the big question of this article: does a snowy October in Siberia still deliver this pattern, and where do we stand for Winter 2026/2027?
How I Put the October Snow Theory to the Test
Between 1997 and 2010, this theory was really strong and quickly became one of the more popular winter forecasting signals to this day. But the original study perhaps had one limitation. Back in 2011, daily satellite snow maps only went back to 1997, so the scientists had just 14 winters to work with. That is not much, but it was still a very good baseline.
Today, much more data is available, and it is also very high quality. I looked at the past 47 winters and, more importantly, 15 new winters since the study was published. This is the real test of any forecast idea: does it still work on years it has never seen?
To be sure the results are real, I also checked everything with four different snow datasets, from satellite observations to modern weather reanalysis. The first results were good news for the original study: every dataset still shows a link between October snow and the winter AO for the original 1997-2010 period. The scientists did not make a mistake.
The Snow Signal Worked, Then Started to Shift
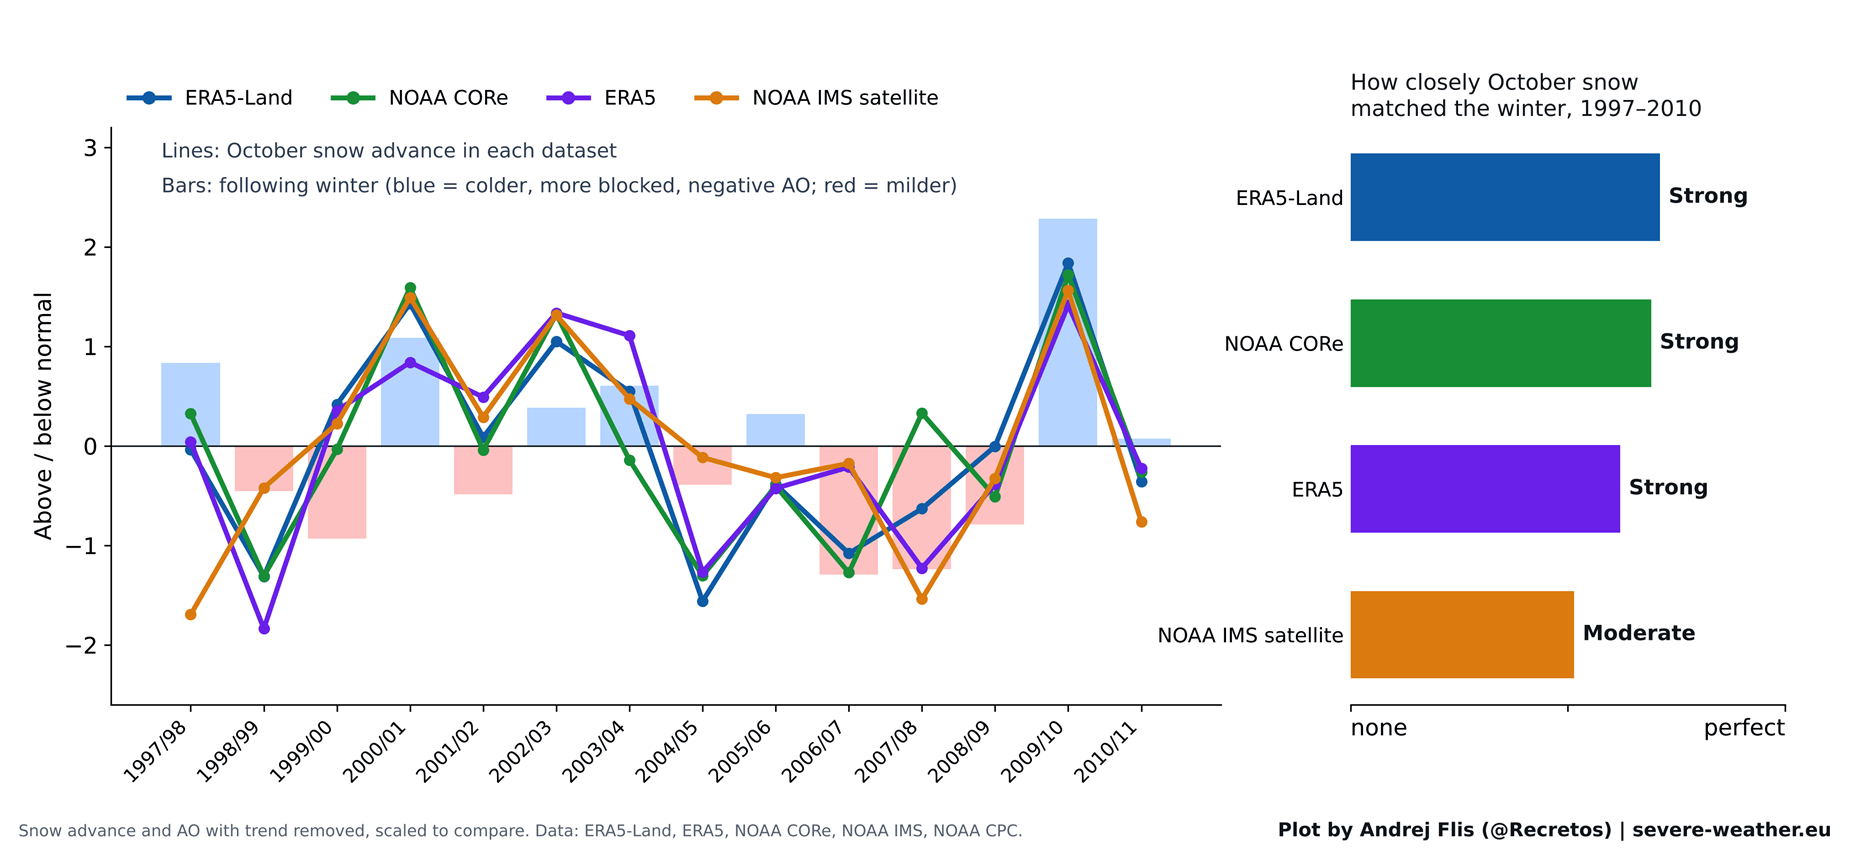
But then the signal started to fade. The graph below shows how strong the snow-winter connection was over time. Each point looks at a 15-year window of winters. When the line is in the green zone, the link was strong enough that it is unlikely to be just luck.
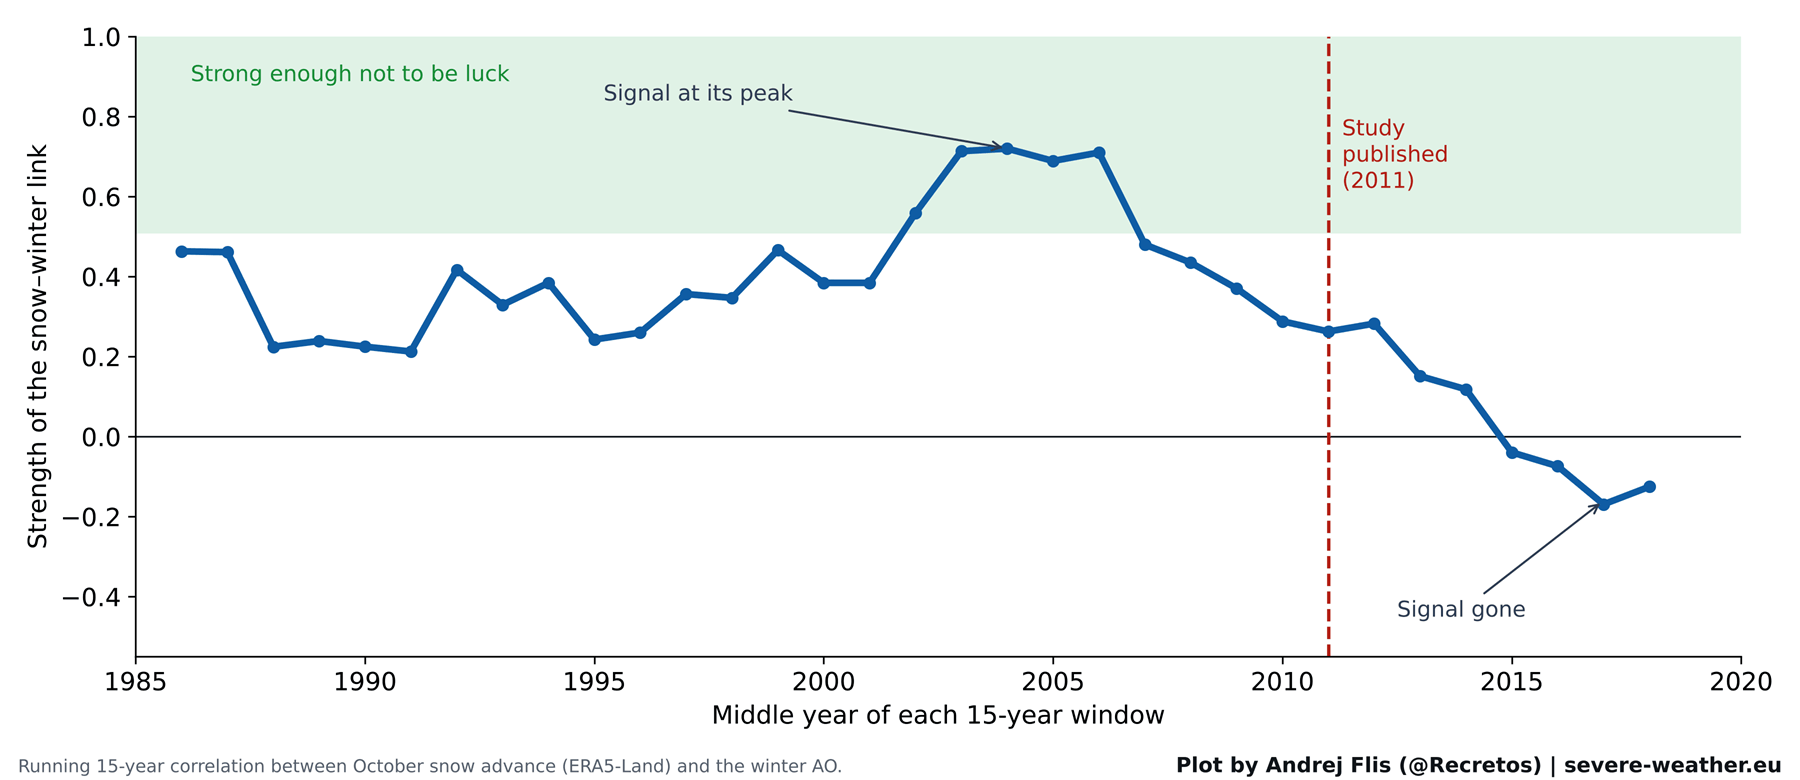
You can see that the signal was only strong for a short period in the early-to-mid 2000s, right around the time the study was done. Since then, it has steadily faded, and in recent years it has even slightly turned the other way.
A Coin Flip Over 47 Winters?
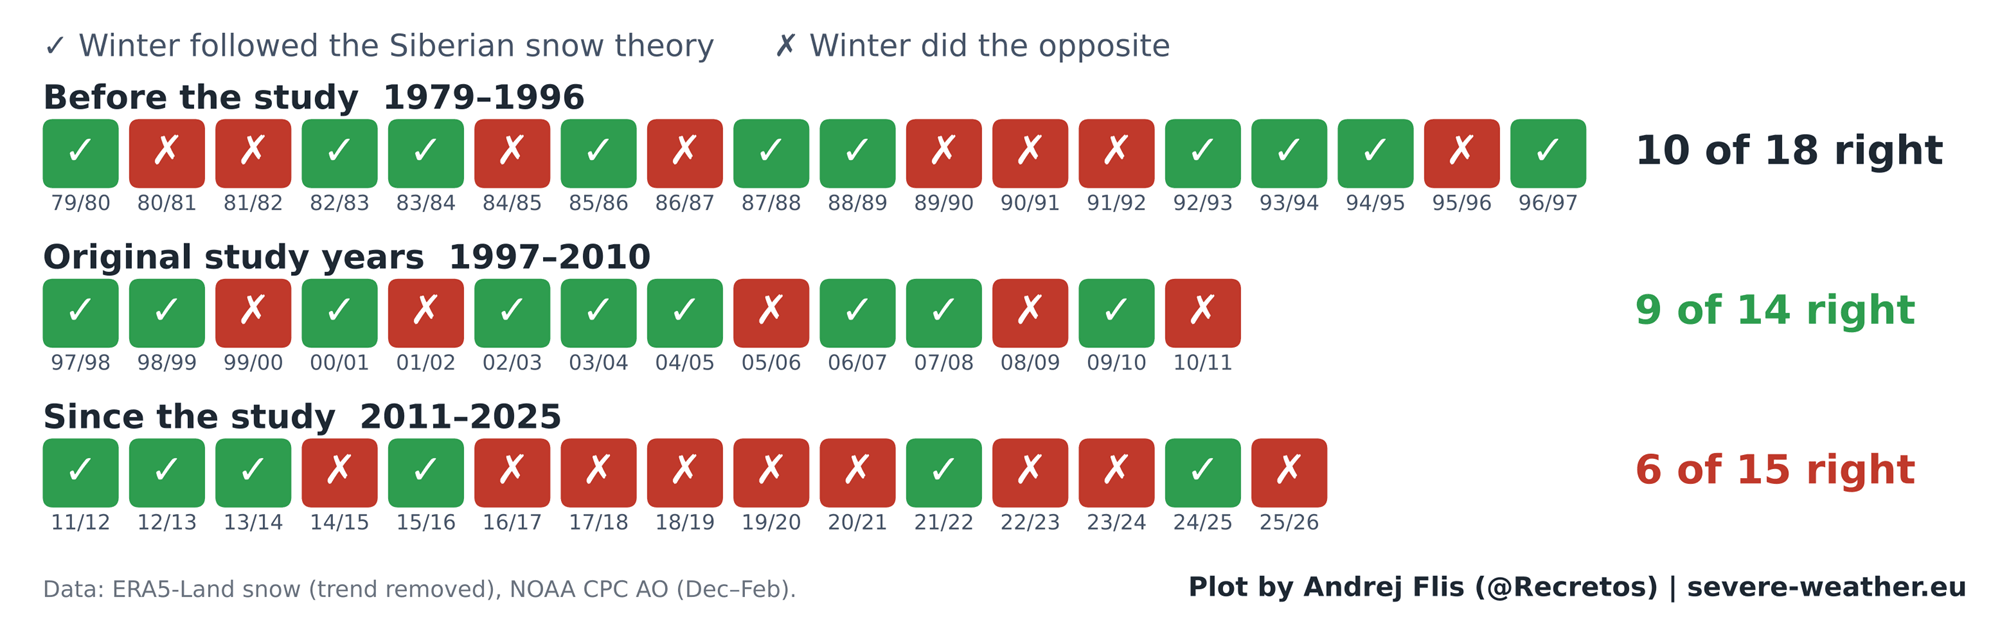
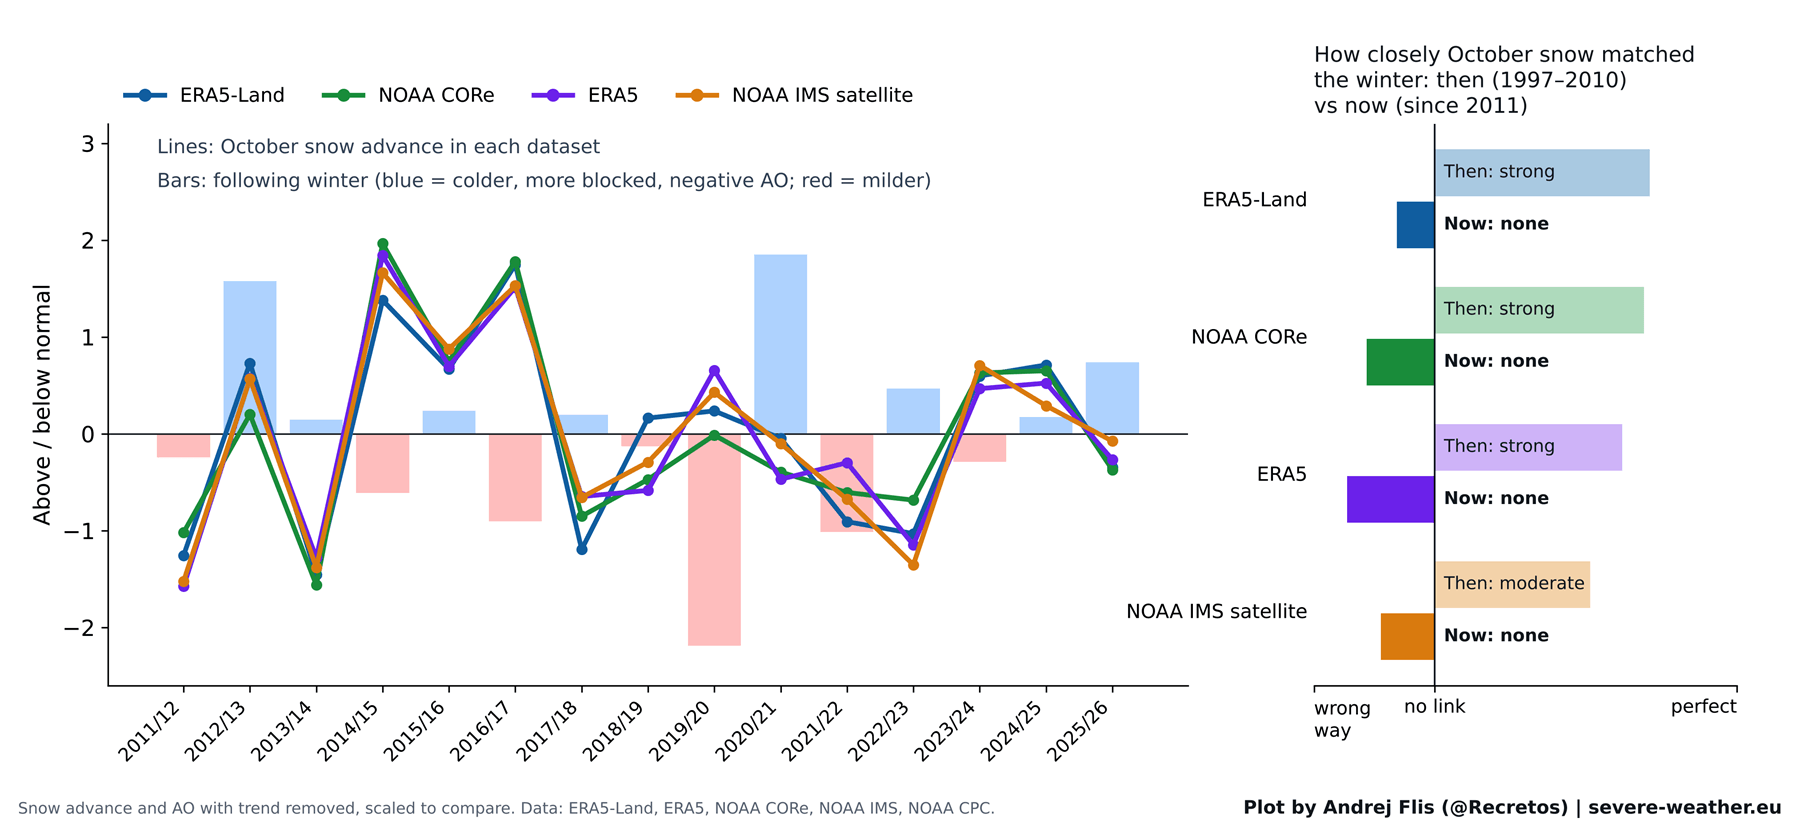
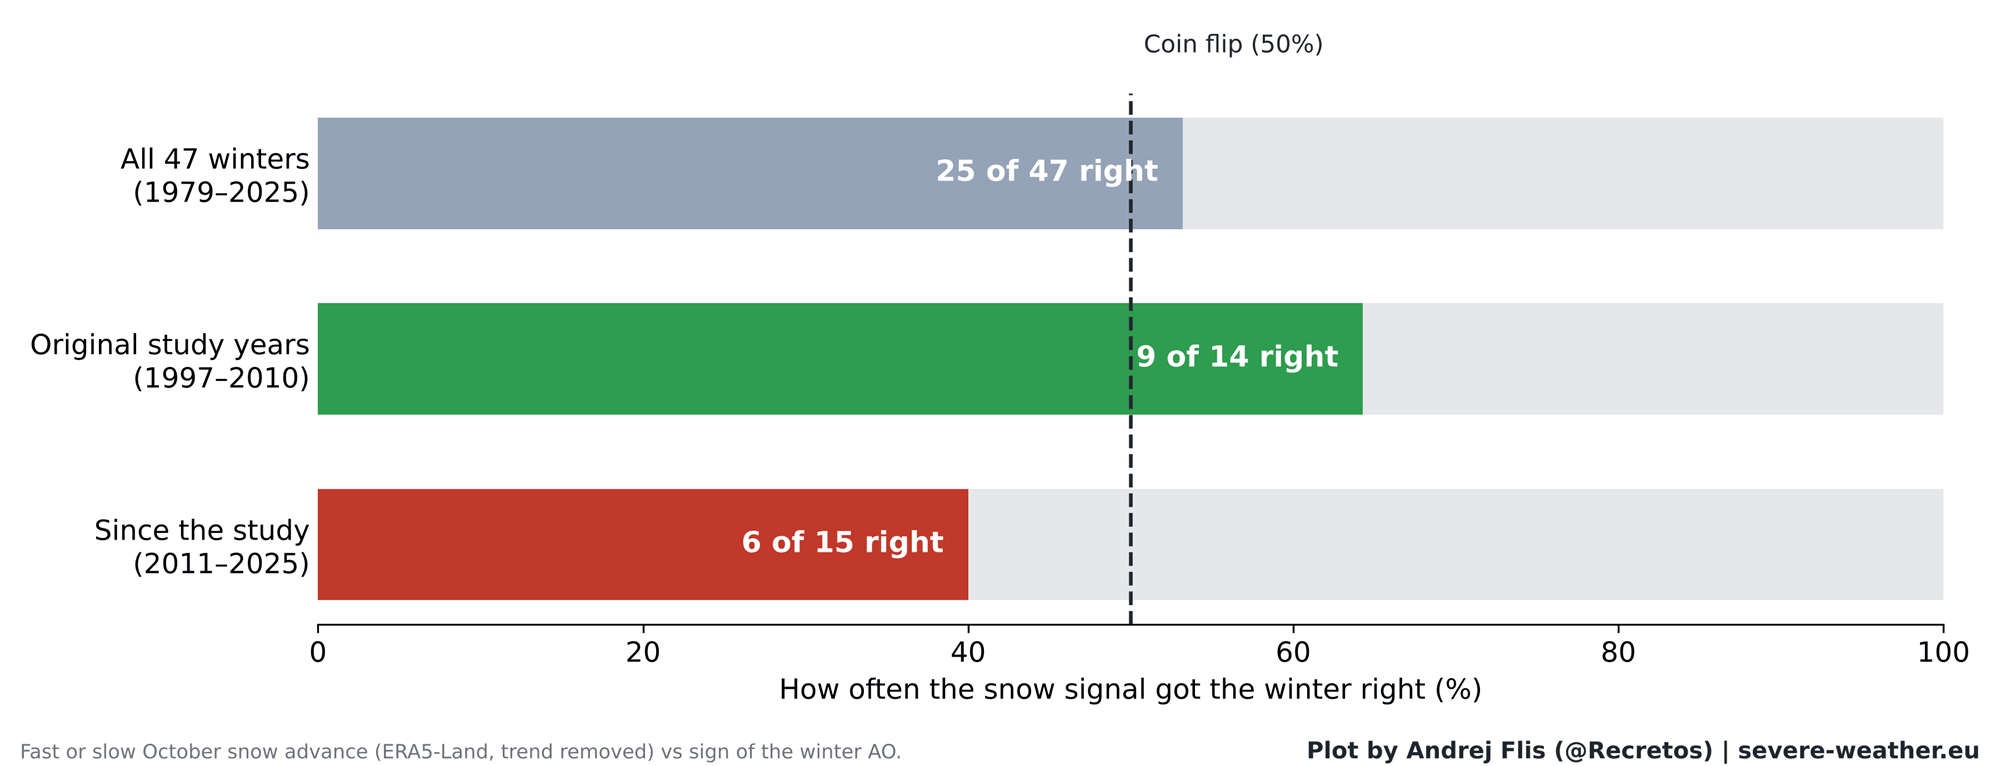
Over all 47 winters, the snow signal was right 25 times and wrong 22 times. That is what most people would call a coin flip. During the original study period, it was right 9 out of 14 times, which is clearly better than chance. But in the 15 winters since the study was published, it was right only 6 times, which is actually worse than a coin flip.
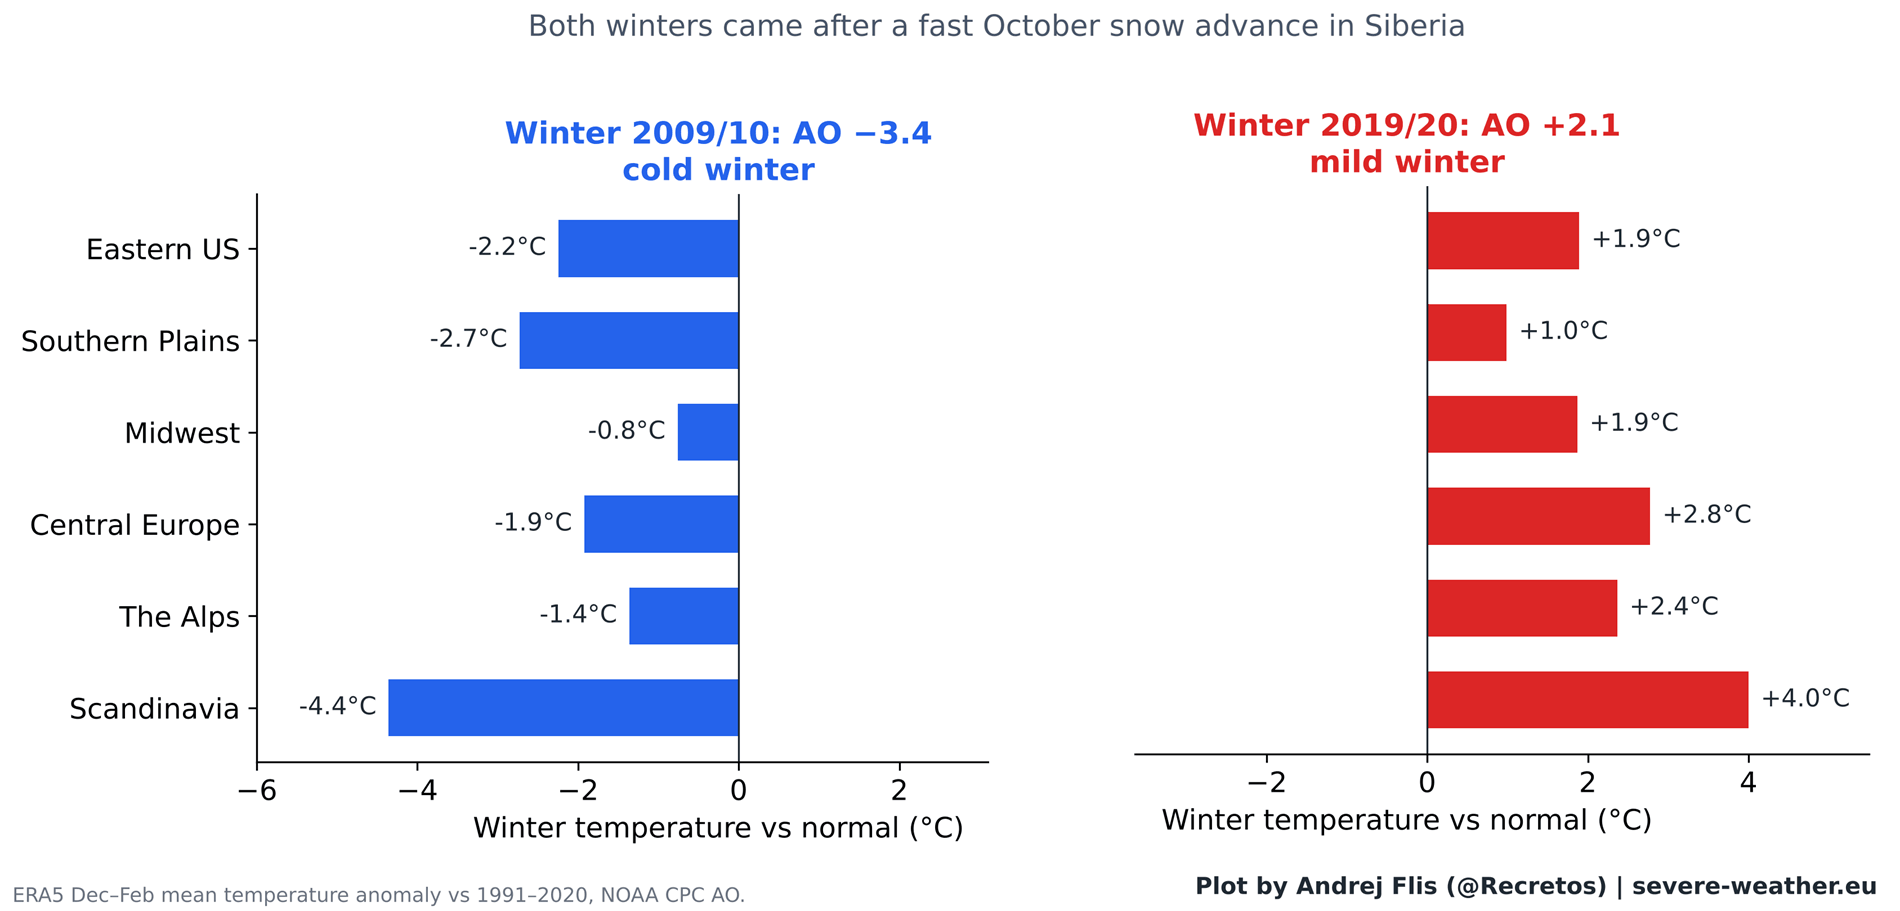
So why did it look so convincing back in 2011? One key contributor is winter 2009/2010. That winter followed one of the fastest October snow advances, and then delivered the most negative AO on record at the time. It produced a cold winter in Europe and the famous February 2010 snowstorms in the Eastern United States.
It was the perfect example of the theory with a strong winter response. That one extreme winter made the whole connection look stronger and more reliable.
But the opposite also happened recently. Winter 2019/2020 also followed a fast October snow advance, but it became one of the strongest positive AO winters and one of the warmest winters on record at the time in Europe, with mild conditions and little snow also over much of the United States.
Why Did It Stop Working? The Stratosphere Still Responds, but the Snow Link Is Gone
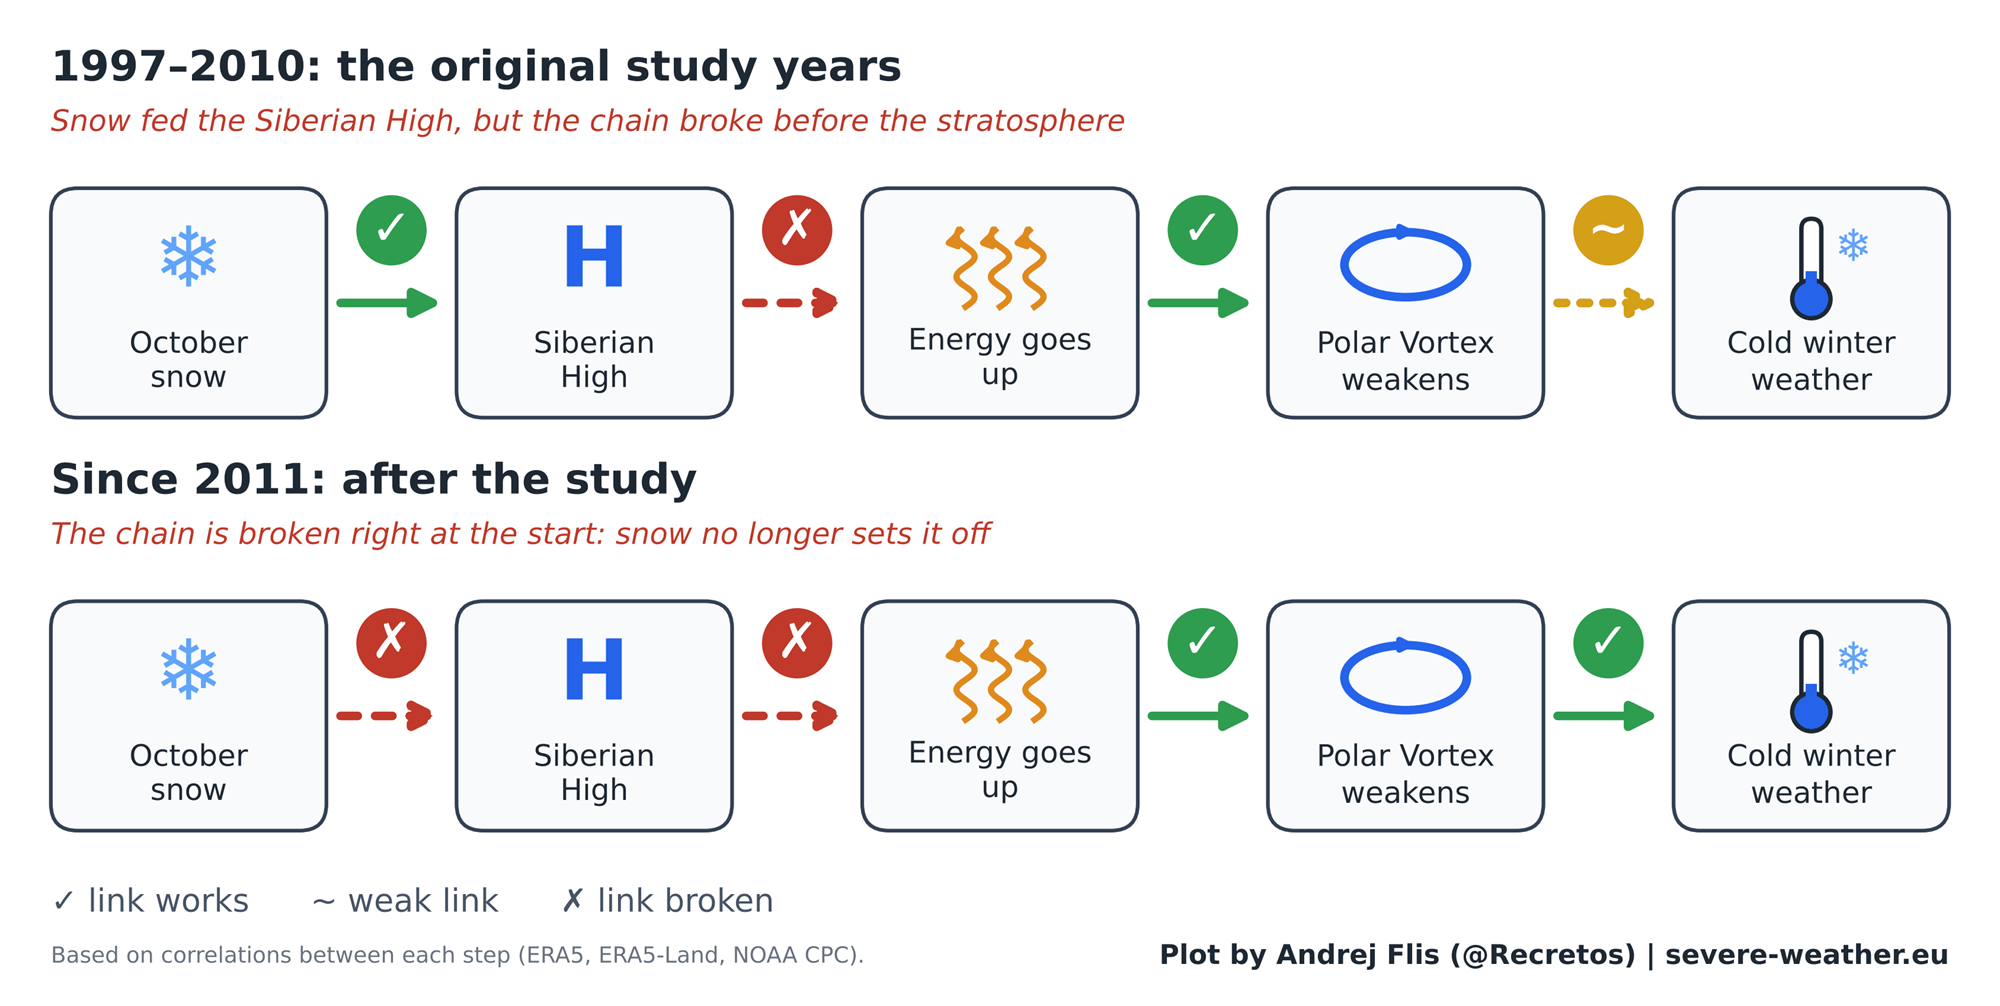
The later part of the chain works in both periods. If more energy flows up into the stratosphere in November and December, the Polar Vortex weakens in January and February, and the winter weather tends to follow. This is solid, well-known physics, and it is exactly what we watch every winter.
The weaker point is at the very start. The original study linked October snow to a stronger Siberian high-pressure zone, but that link has weakened since. In essence, the stratospheric Polar Vortex still responds to energy from below, but Siberian snow no longer reliably sends it in recent years.
Even in the original study years, the stronger Siberian High did not clearly send more energy upward. So while the snow and the winter AO moved together, the link did not clearly run through the stratosphere, as the main theory suggests.
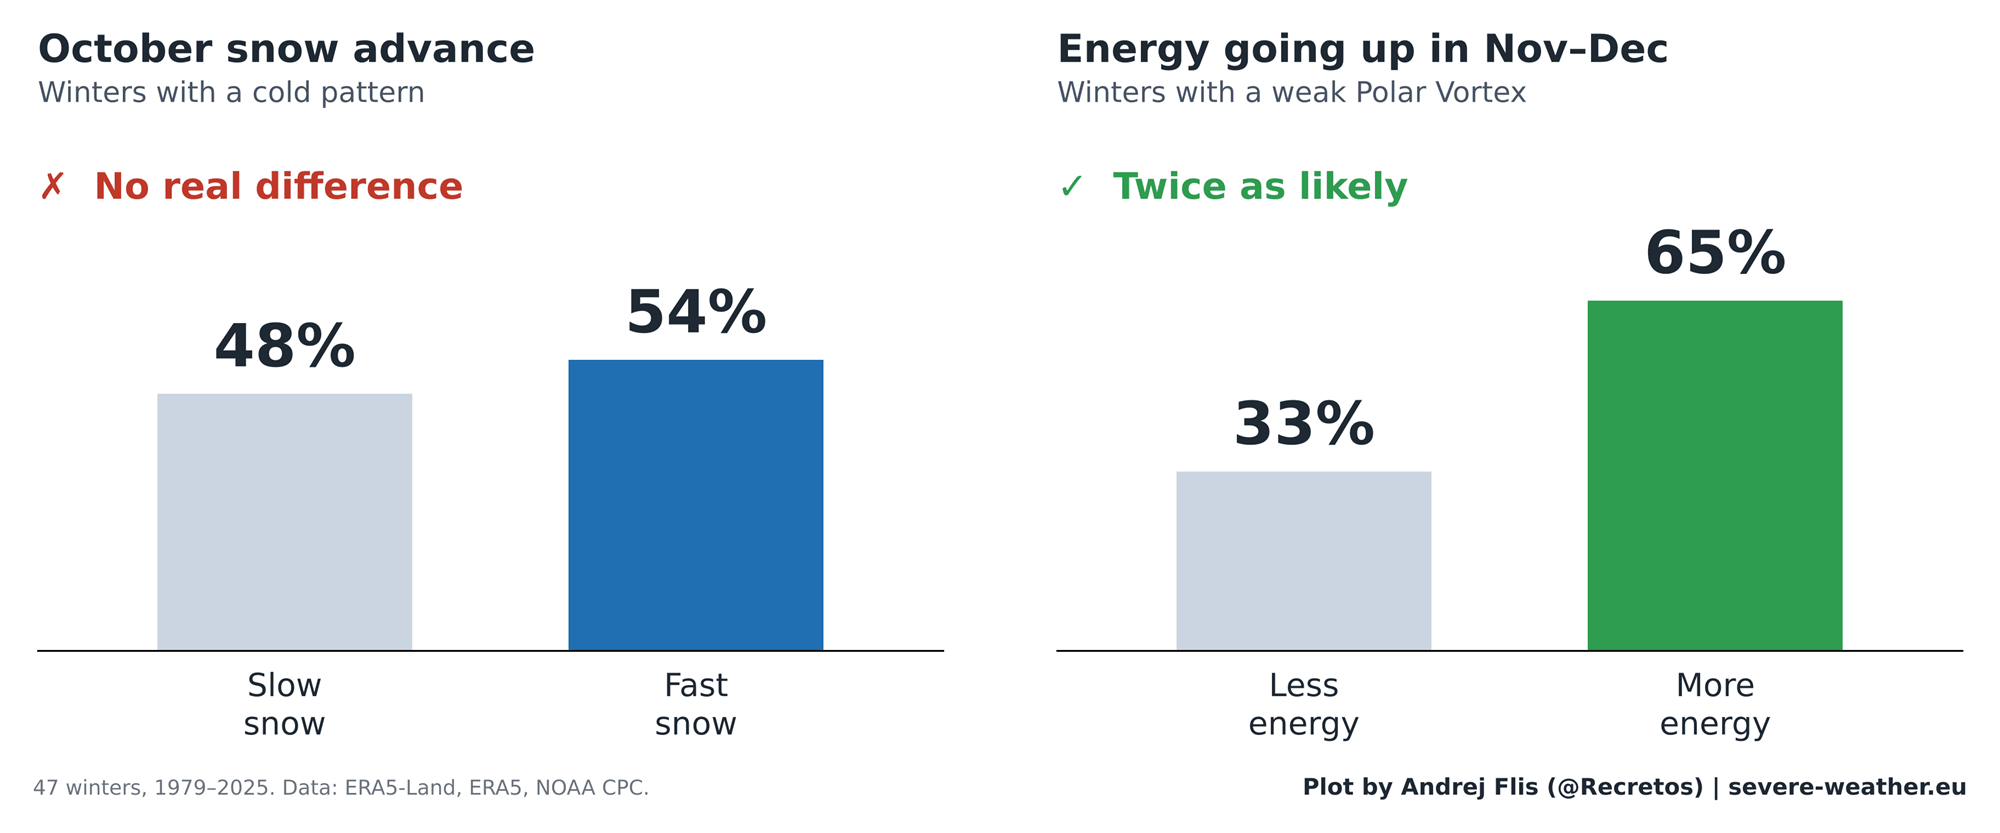
I have two possible explanations for what happened: The first is that the strong 1997-2010 connection was partly a lucky streak, boosted by the extreme 2009/2010 winter. The second is that the connection was real, but the surrounding conditions have changed. The data leans slightly toward the first, but neither can be ruled out.
Rapid Arctic sea ice loss, warmer oceans, and shifts in the Siberian High may have changed how the atmosphere responds to snow advance in recent years. Earlier research going back over a century of data has also found that this link tends to come and go over the decades, so it may return in the future.
Part of the snow signal may even come from the Pacific, as fast snow advances have tended to happen slightly more often in developing El Niño years.
What About Winter in the United States, Canada, and Europe?
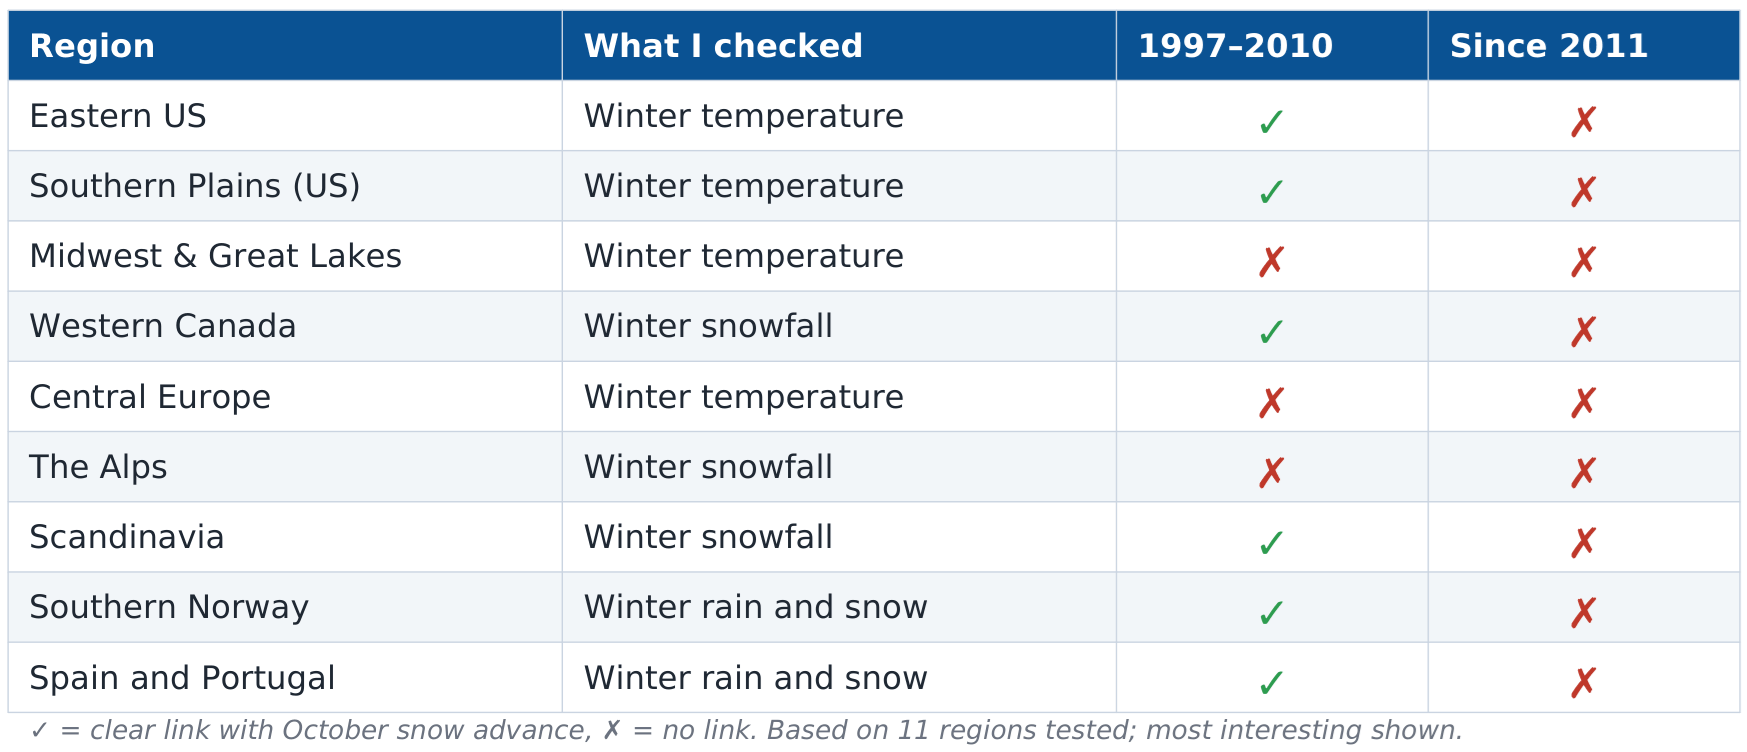
During the original study period, several regions showed a clear link. Winters in the eastern United States were noticeably colder after rapid snow advances, and winter rain in southwestern and northern Europe aligned well, too. But since 2011, all of these links have broken down.
Out of 44 regional checks for the years since 2011, only one showed a real signal. The only region with a hint of a long-term link is Western Canada, but even there it is not strong enough to be useful for forecasting.
October and Winter 2026/2027: A Slow Start, With a Fast Snow Surge to Follow?
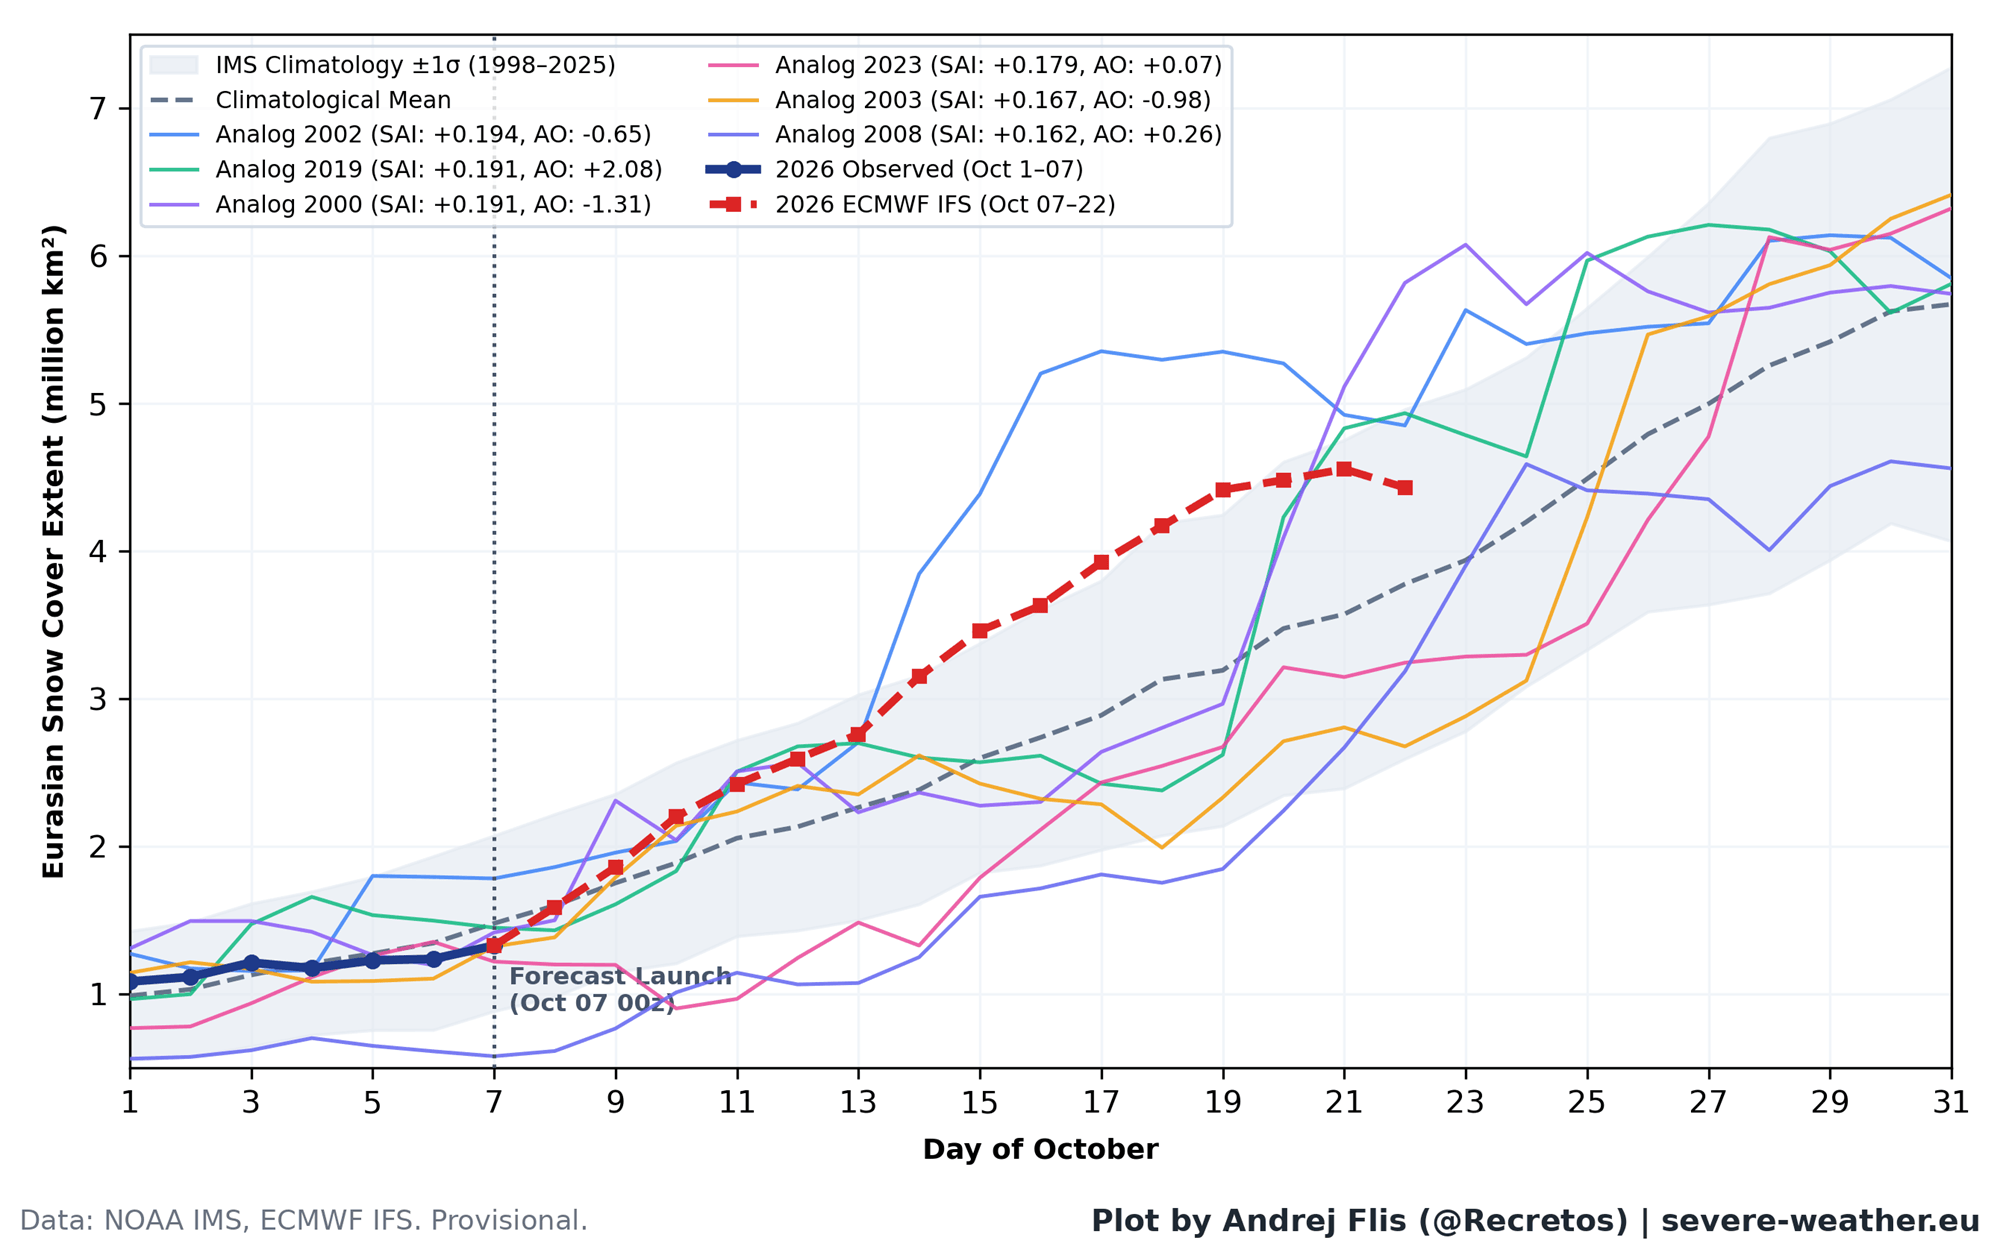
The first week of October was a bit slower than normal. But the forecast shows a big surge of snow coming in the next two weeks. If it verifies, this would be one of the faster October snow advances of the last three decades, roughly in the top 15% for this period of the month.
Keep in mind that this is still an early look, as most of the data comes from the ECMWF forecast, which updates several times per day. The true final number will only be known after October 31.
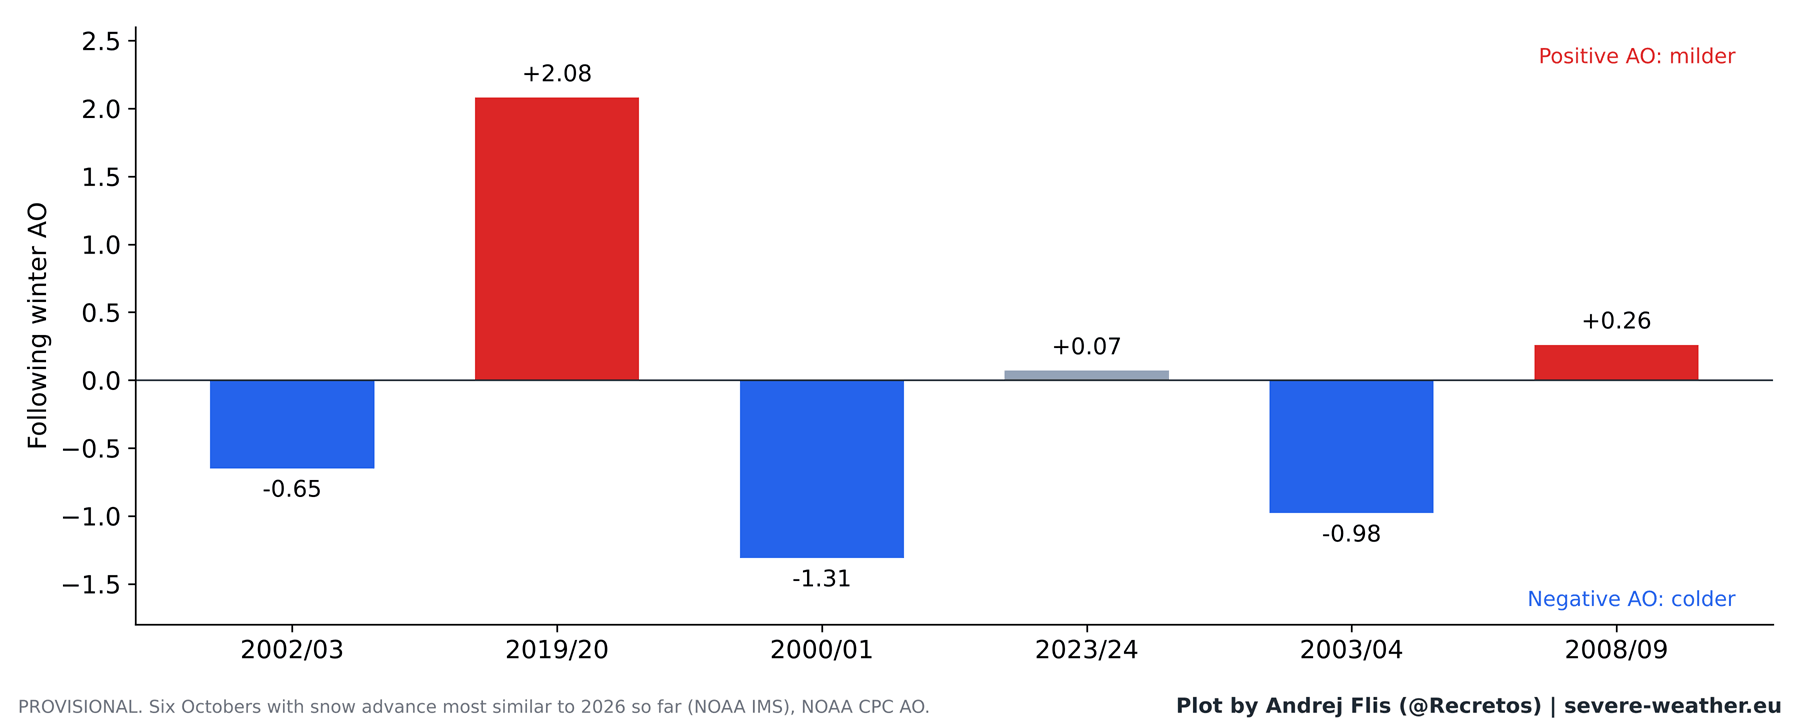
The following winter AO was negative three times, near neutral once, and positive twice. Three of these years, 2002, 2019, and 2023, also had active El Niño, like this year, but they still produced three very different winters. So on its own, a fast snow advance this October tells us little about the coming winter in the modern era.
What Really Matters for Winter 2026/2027
So, should you worry about, or hope for, a cold winter because of Siberian snow? The first answer is, not really. A fast October snow advance does not guarantee a cold winter, and a slow one does not rule it out. The famous signal worked for a while, but it has not worked to predict the AO mode since it was discovered.
This does not mean winter is completely unpredictable. This research also confirmed which signals really work. The amount of energy flowing up into the stratosphere in November and December is a strong early warning for a disrupted Polar Vortex in mid-winter, and we will watch it closely as winter approaches.
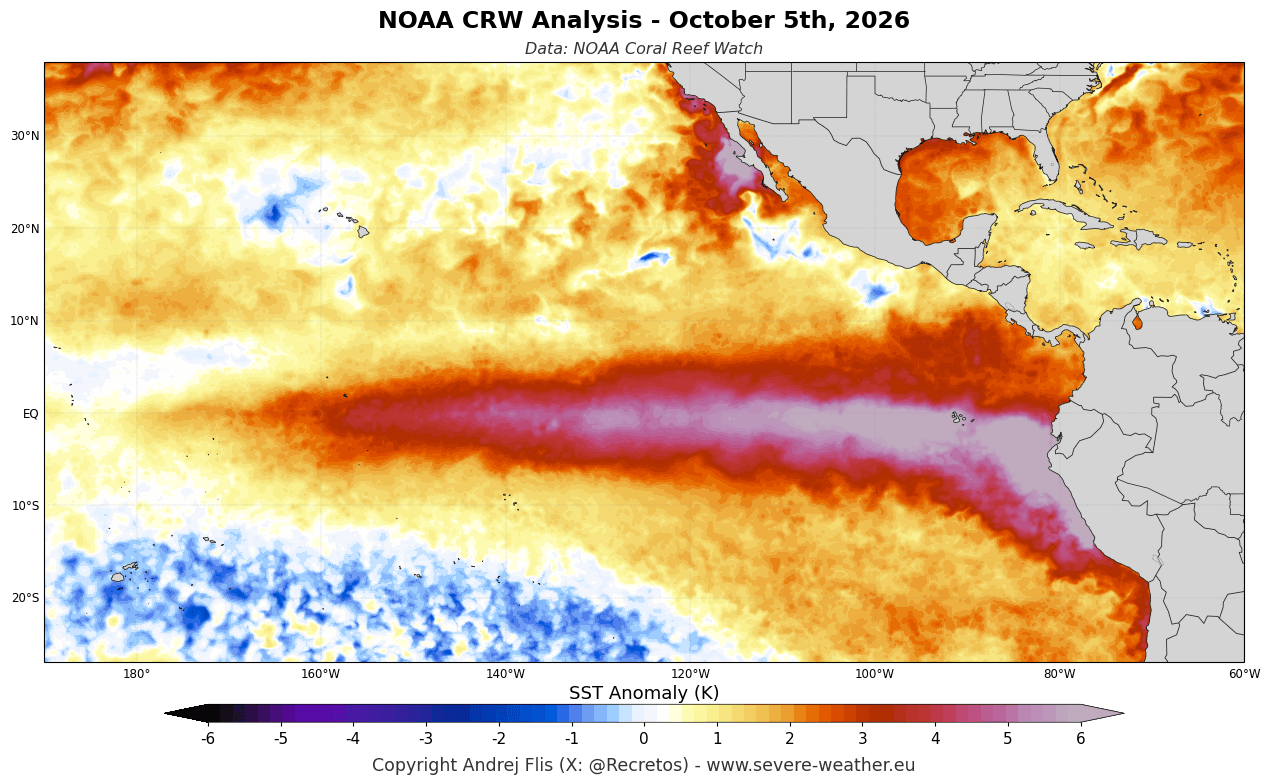
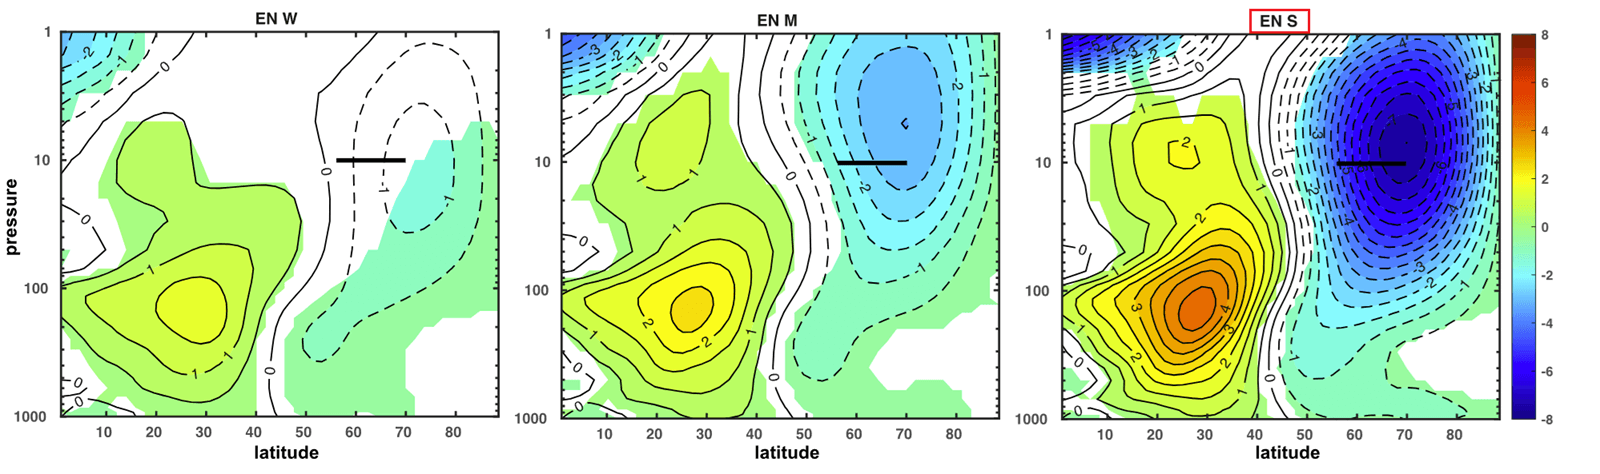
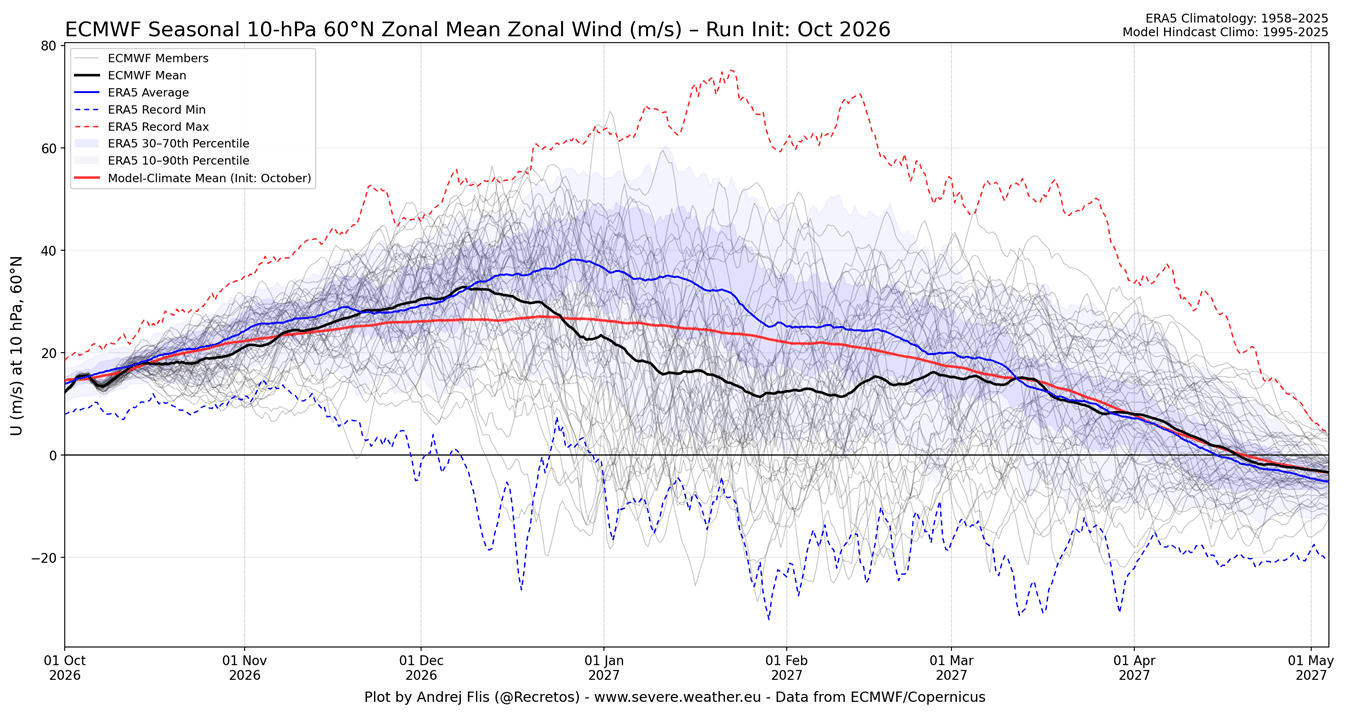
The forecast keeps the Polar Vortex near normal into mid-December. But from late December, the average drops well below normal, and many members show the winds reversing completely. That is the sign of a Sudden Stratospheric Warming, a sudden collapse of the Polar Vortex. This fits well with a strong El Niño, which tends to weaken the Polar Vortex in the second half of winter.
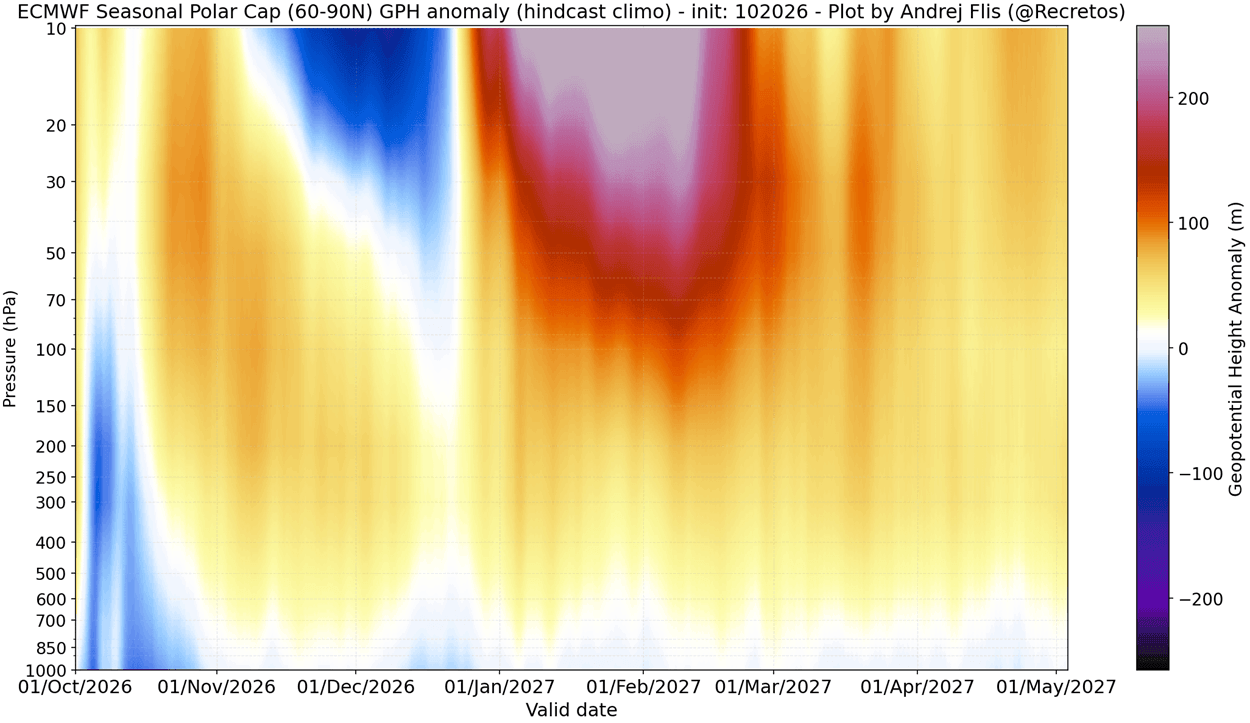
You can see the high pressure starting high up in late December and slowly working its way down through January and February. When that happens, the cold Arctic air is more likely to spill south into the United States, Canada, or Europe. This is a seasonal forecast, so it shows a higher chance, not a guarantee, but it is exactly the kind of signal we will be watching closely in the coming weeks.
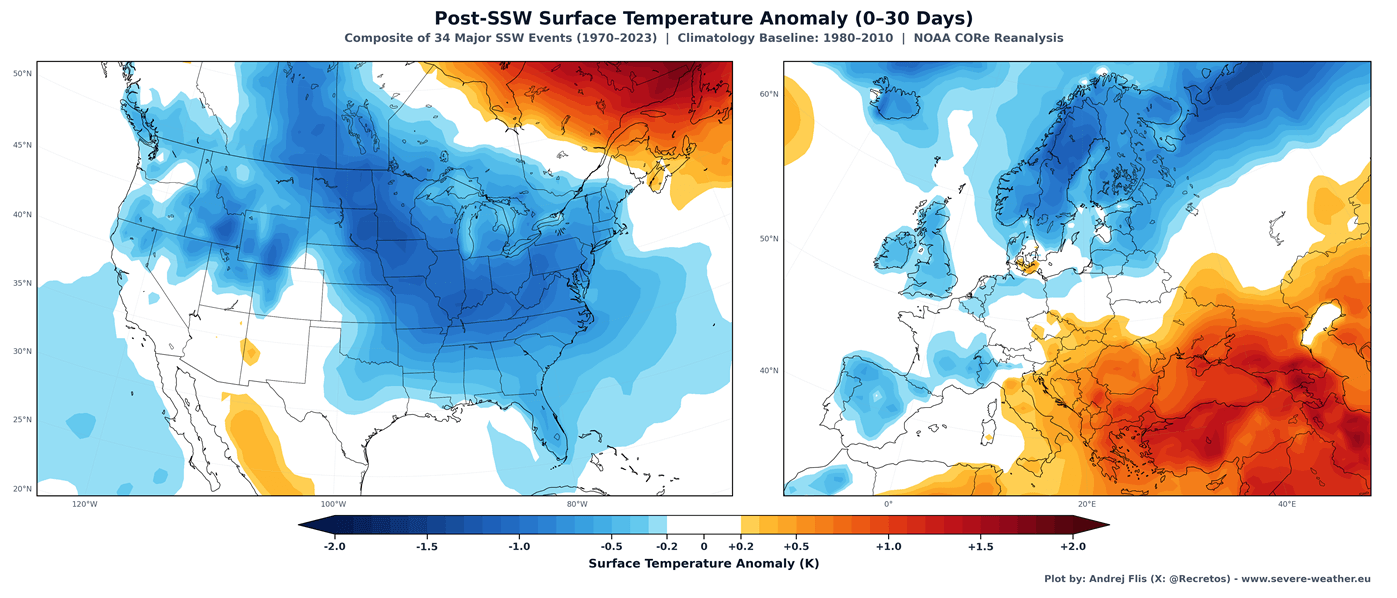
This is a very similar pattern that we also saw last winter over the United States, with a disrupted lower Polar Vortex core moving into North America. It established the “Polar Express” pattern, the same as seen in the image above.
This is a clear Super El Niño temperature pattern, with an amplified Pacific jet stream. The active storm track keeps temperatures cooler across the southern United States because of persistent cloud cover and precipitation.
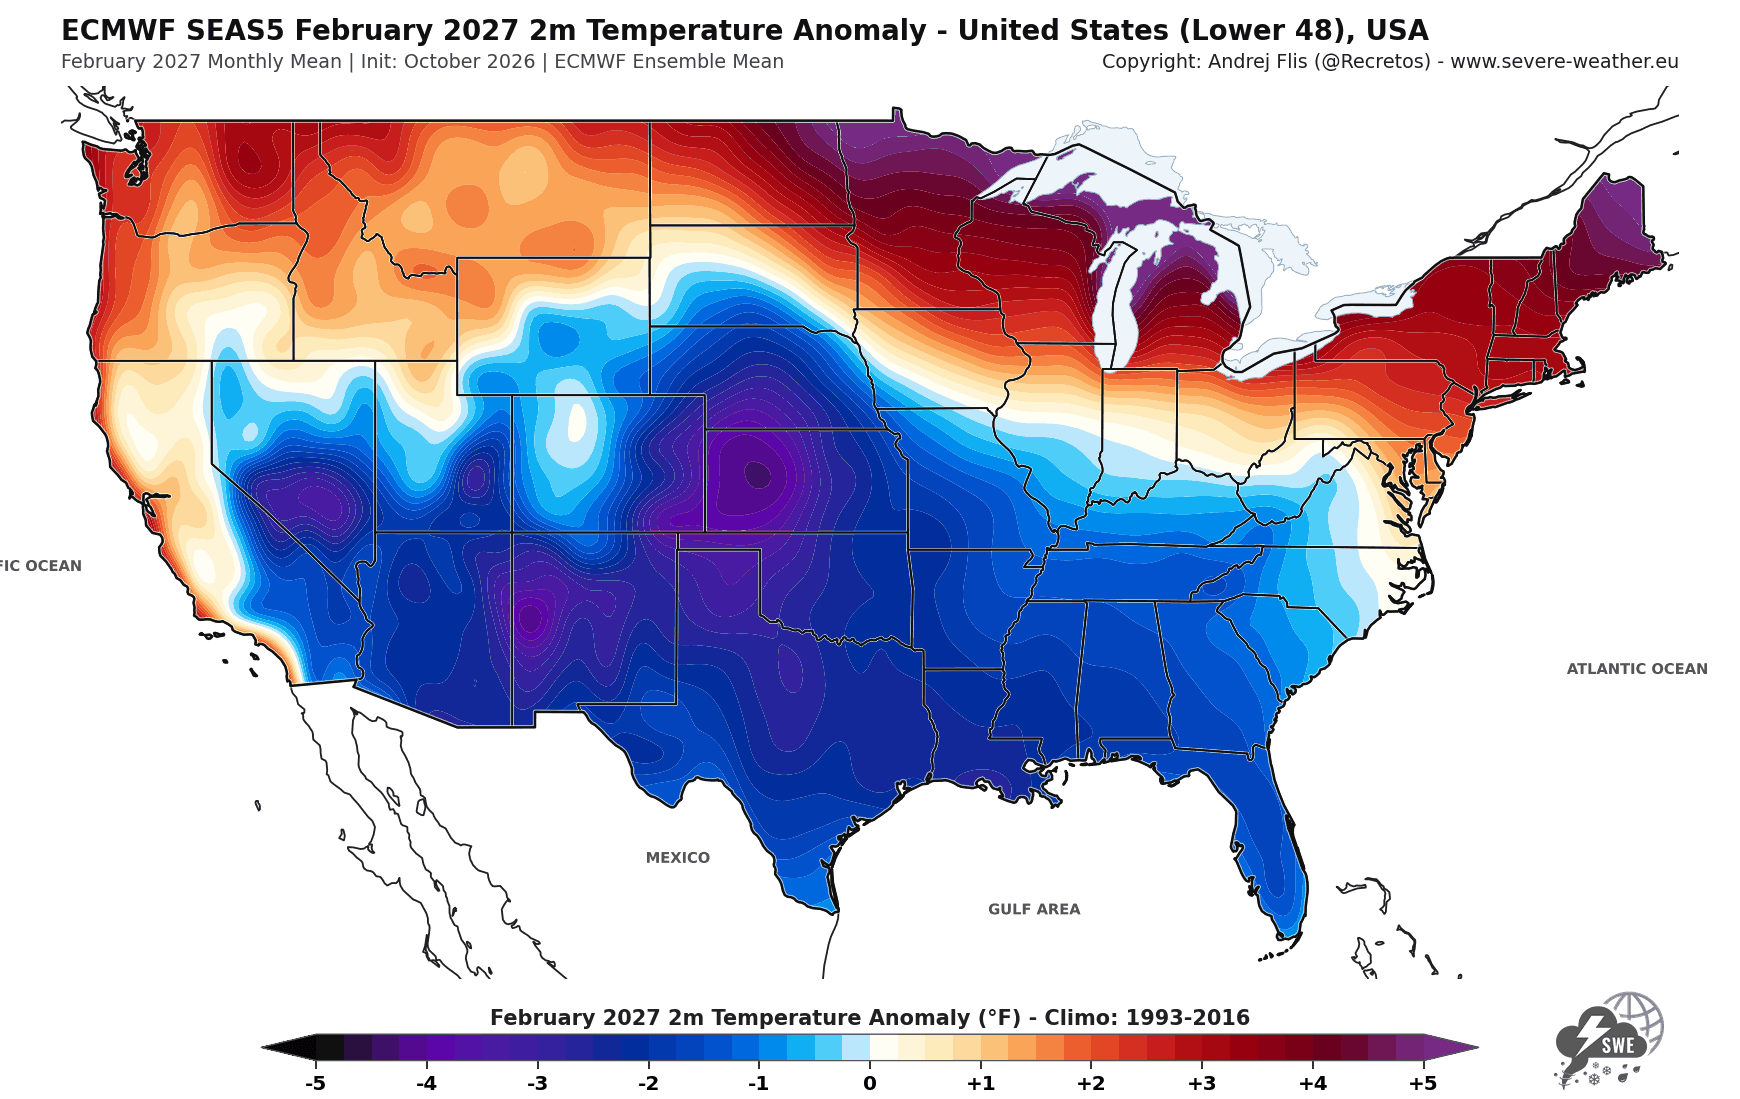
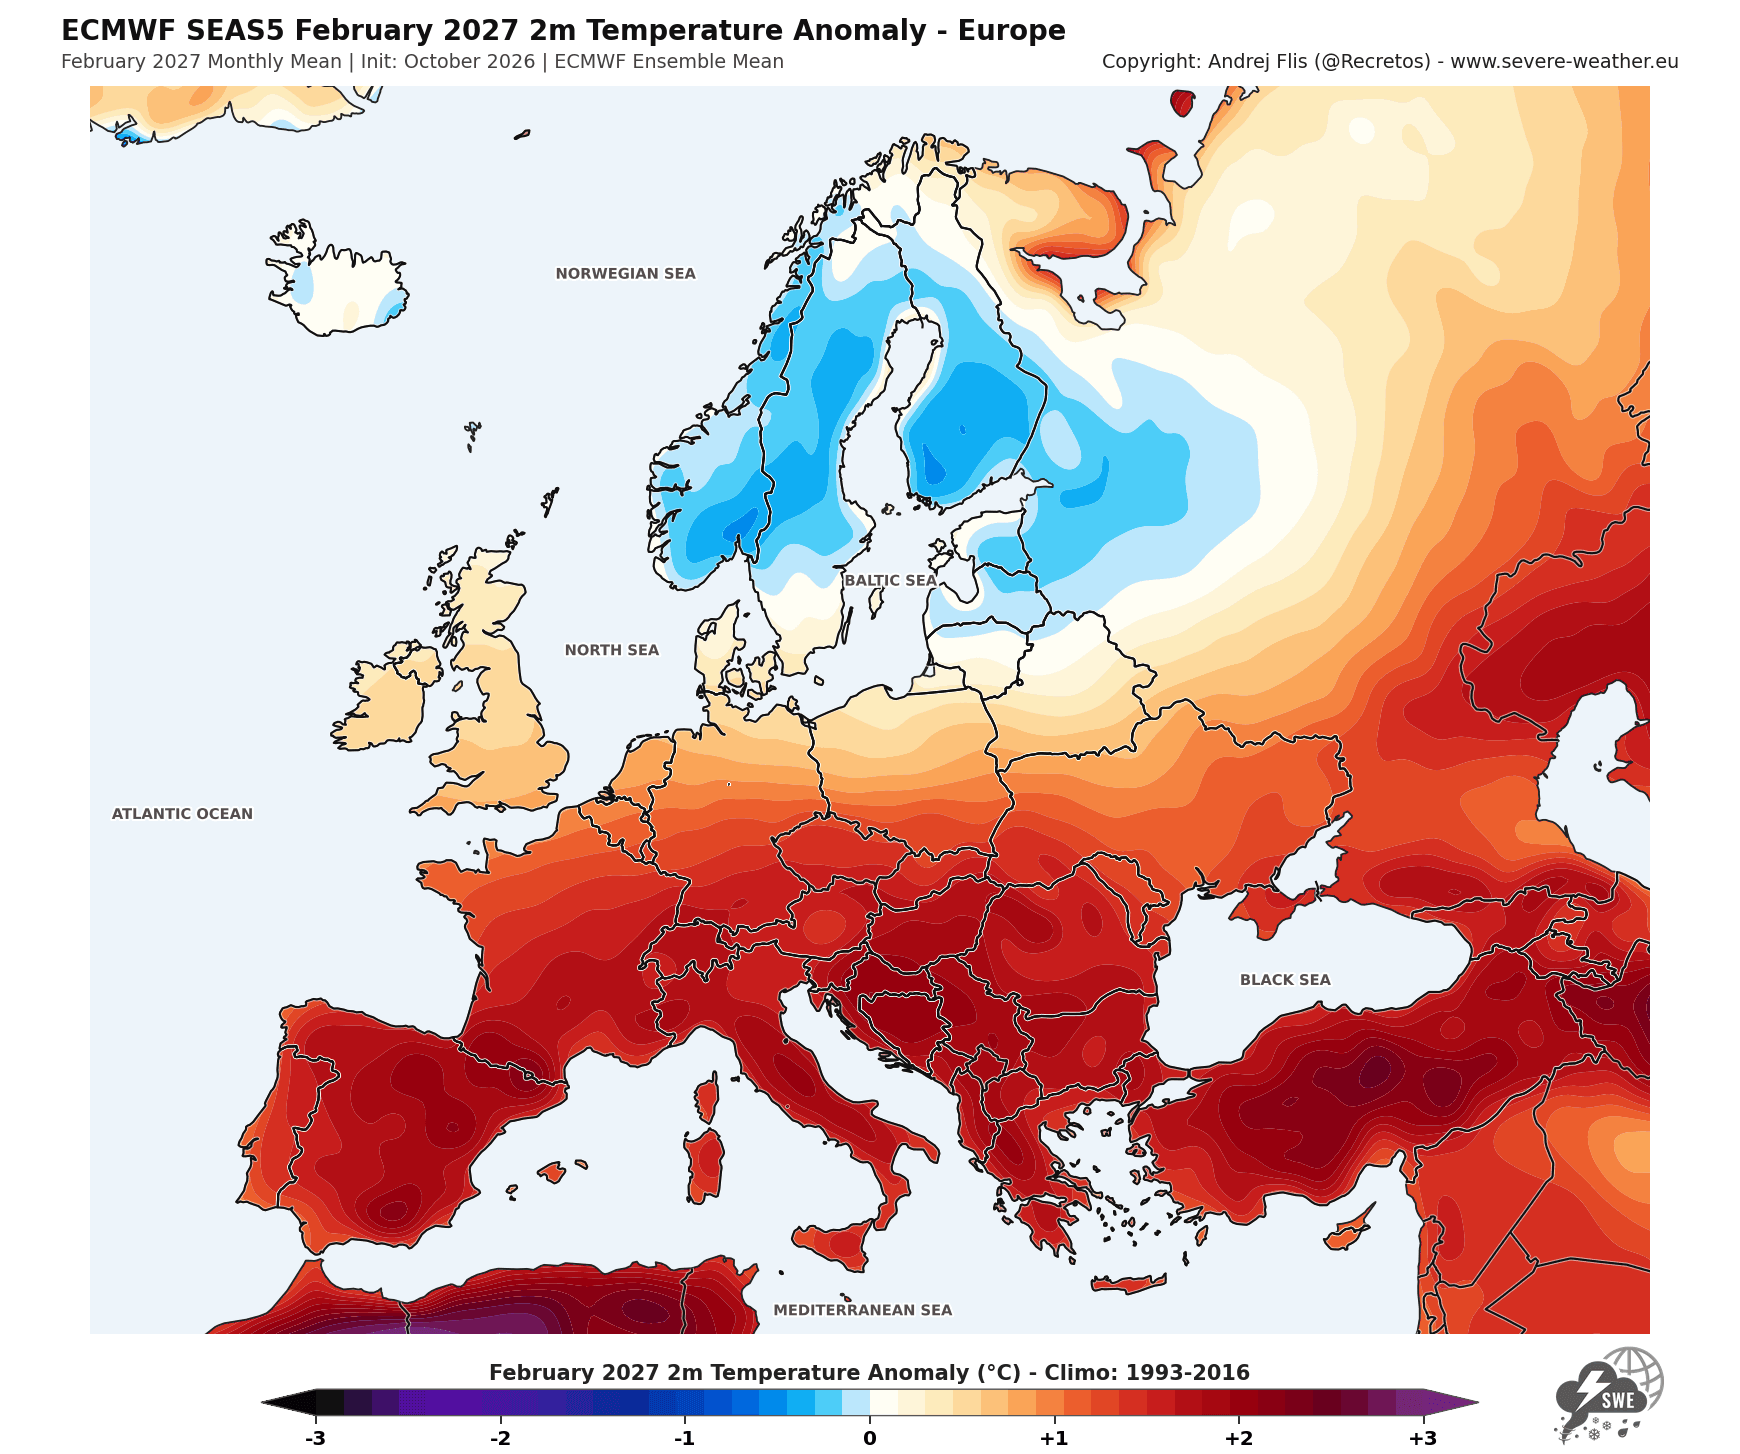
A new study published in September 2026 by Songmiao Fan and Judah Cohen suggests that snowy Octobers in Eurasia may be followed by more frequent “stretched” Polar Vortex patterns, which can bring long cold spells to the eastern United States. But this is a different question from the one I tested here, and an interesting one for a future research article.
A Data Warning on Missing Snow
While doing this research, I found something important for anyone working with weather reanalysis data. In the standard ERA5 dataset, October snow cover across Eurasia suddenly drops by about 40% in 2004. Of course, Siberia did not lose that much snow overnight.
Comparing ERA5 with an independent dataset (NOAA CORe) showed that the drop is specific to ERA5. Its timing matches when the ECMWF reanalyses started using satellite snow maps. The missing snow was mostly in the Siberian lowlands and forests between 50°N and 70°N. ERA5-Land, NOAA CORe, and the satellite data all confirmed the main results, so the conclusions above are not affected.
Peer-Reviewed Research Used in This Article
- Snow Advance Index and Winter Predictions: A New Index for More Accurate Winter Predictions – Cohen and Jones (2011).
- Siberian Snow and the Arctic Oscillation: How Stationary Is the Relationship Between Siberian Snow and Arctic Oscillation over the 20th Century? – Peings et al. (2013).
- Eurasian Snow and Winter Circulation: An Examination of Changes in Autumn Eurasian Snow Cover and Its Relationship with the Winter Arctic Oscillation Using 20th Century Reanalysis Version 3 – Marshall (2025).
- Planetary Waves and Polar Vortex Events: Upward Wave Activity Flux as a Precursor to Extreme Stratospheric Events and Subsequent Anomalous Surface Weather Regimes – Polvani and Waugh (2004).
- Snow Advance and European Winter Precipitation: Seasonal Predictability of Wintertime Precipitation in Europe Using the Snow Advance Index – Brands et al. (2012).
- Eurasian Snow, Polar Vortex and North American Cold: Possible Mechanisms Linking North American Cold Waves to Arctic Sea Ice and Eurasian Snow Cover Interannual Variations – Fan and Cohen (2026).
- ENSO-Stratosphere Pathway: Nonlinearity and Asymmetry of the ENSO Stratospheric Pathway to North Atlantic and Europe, Revisited – Manzini et al. (2024).
Latest Winter 2026/2027 Forecast Update: Winter Forecast: New October Data Shows a Colder, Snowier U.S. Shift
Super El Niño 2026: The Super El Niño is Breaking Records, With Winter 2026/2027 Weather Impacts Ahead
Data I used for this article: ERA5 and ERA5-Land (Copernicus C3S/ECMWF), NOAA IMS 24 km (NSIDC), NOAA CORe, NOAA CPC Arctic Oscillation and Niño 3.4 monthly analyses
We will keep you updated on the global weather pattern development, so bookmark our page. Also, if you have seen this article in the Google App (Discover) feed, click the like (♥) or the star button there to see more of our forecasts and our latest articles on weather and nature in general.