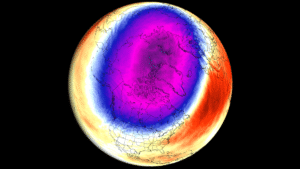
Polar Vortex is the broad winter circulation over the Northern (and Southern) Hemispheres. You can imagine the Polar Vortex as a spinning wall over the polar regions, rising from the surface into the stratosphere, about 50 km/ 31 miles high, locking the cold polar air inside when strong.
When it weakens or breaks apart, often during a Winter Sudden Stratospheric Warming (SSW), that cold air can spill south into the United States, Canada, and Europe in the following weeks.
On this page, you can follow the Polar Vortex with my Polar Vortex Explorer, showing fresh forecast maps up to 16 days ahead, updated twice a day. Below it, I post my latest thoughts whenever the models show something interesting, plus a monthly long-range outlook for Winter 2026/2027.
Polar Vortex Forecast Explorer
Live stratosphere forecasts over the Northern Hemisphere, updated twice a day
What am I looking at?
ECMWF IFS is the global model of the European Centre for Medium-Range Weather Forecasts, here at 0.25° resolution. It is generally regarded as the most skilful model in the stratosphere, especially for the timing and strength of Polar Vortex disruptions. Its maps run 15 days into the future, in 12-hour steps.
GFS (Global Forecast System) is the United States global model, run by NOAA/NCEP, here at 0.25° resolution. Its maps run 16 days ahead, in 12-hour steps. At longer range the GFS can swing strongly from run to run, sometimes showing vortex disruptions that later disappear, but it is a very worthy addition, especially to compare how it agrees on a forecast with the ECMWF.
ECMWF and GFS side by side, both showing the same date and time, even when one model has a newer run. When the two models show the same evolution of the vortex, such as a similar warming or displacement, the forecast is more reliable. When they disagree, the outcome is still uncertain, and the next runs will show which way the trend goes.
10 hPa is around 30 km (19 miles) high, and represents the core of the Polar Vortex in the mid-stratosphere. Sudden Stratospheric Warmings are officially defined at this level, by tracking any wind reversals.
50 hPa is around 20 km (12 miles) high, in the lower stratosphere, about twice the height of the jet stream. Changes that reach this level are closer to our weather, and are more likely to affect the jet stream and the weather patterns at the surface in the following weeks.
10 hPa (around 30 km or 19 miles) and 50 hPa (around 20 km or 12 miles) side by side. Vortex disruptions usually start higher up and work their way down over one to several weeks. When a warming or displacement at 10 hPa also shows up at 50 hPa, it is getting closer to the weather layer, where it can influence the jet stream.
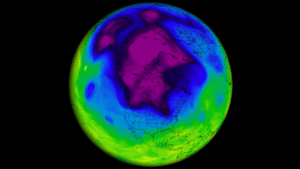
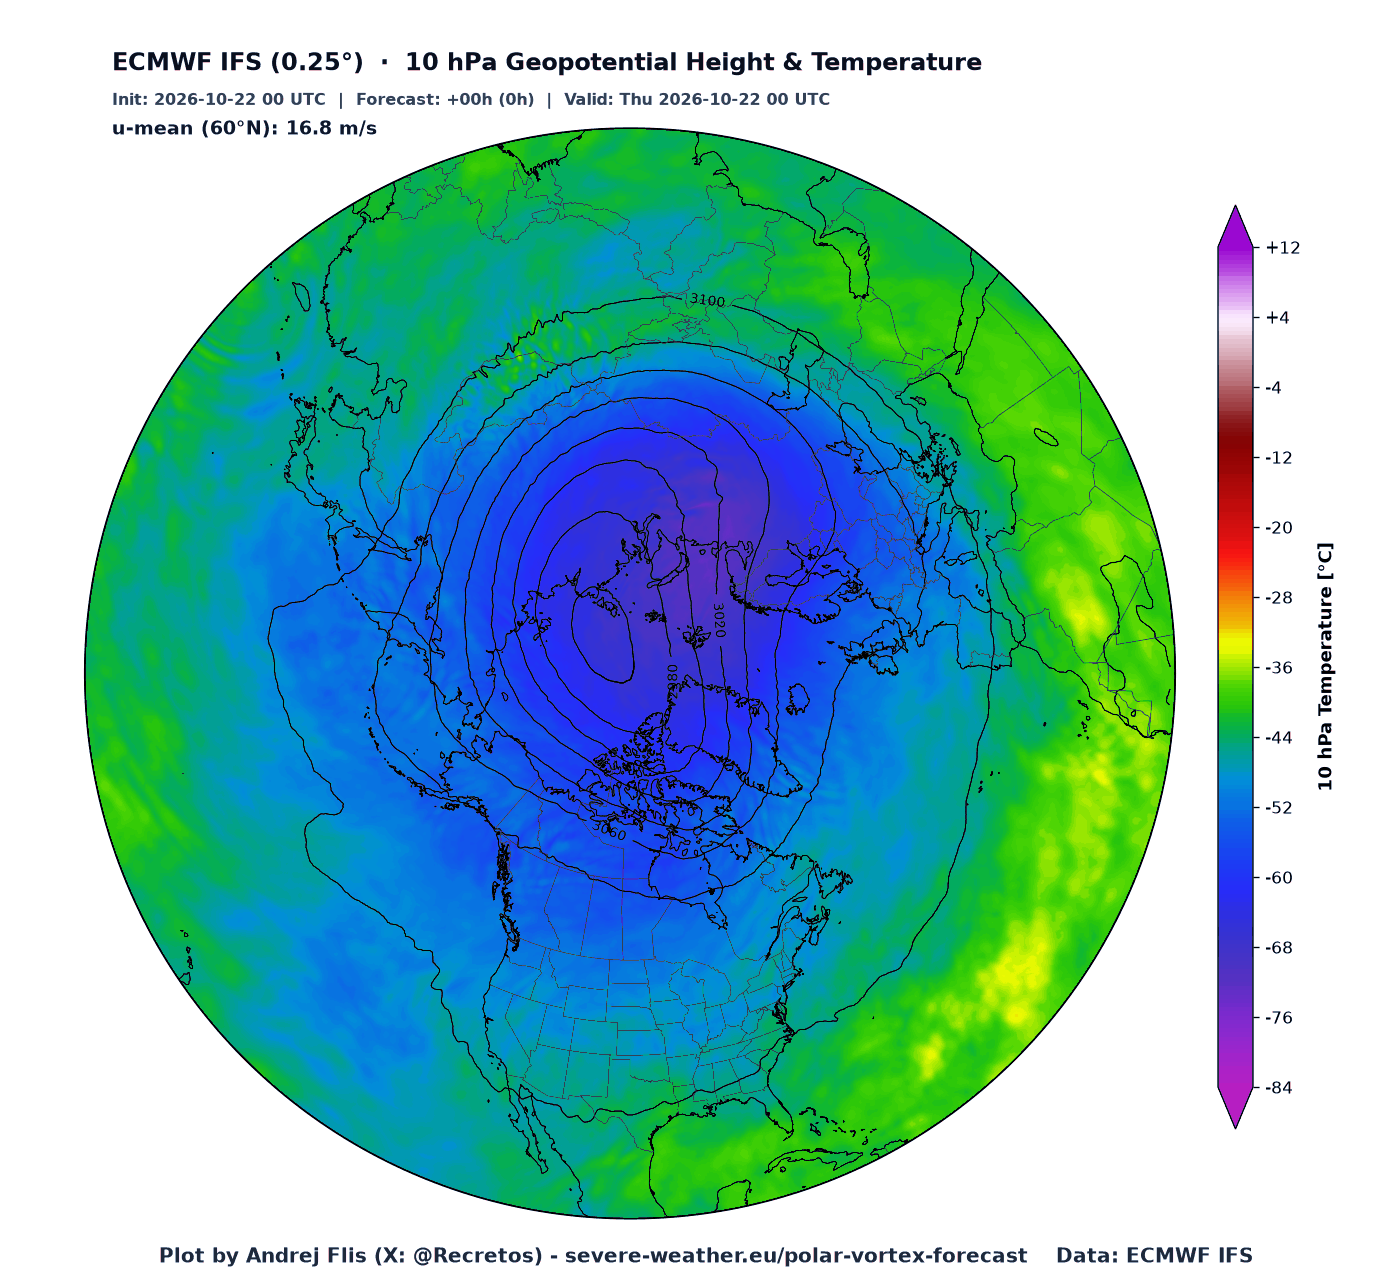
The Polar Vortex as it really looks. The black contour lines show the height of the pressure level in decameters, and the tight ring of lines around the low center marks the Polar Vortex itself, with the strongest winds where the lines are closest together. Colors show the actual temperature, with the coldest air (purple, blue) usually trapped inside the vortex core.
A round Polar Vortex sitting over the North Pole is strong and stable. When it gets stretched, pushed away from the pole (a displacement) or split into two parts (a split), it is undergoing a disruption event, with or without a stratospheric warming wave.
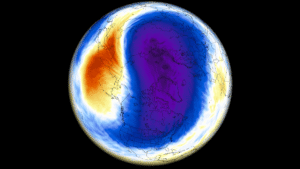
How much warmer (orange, red) or colder (blue) than normal the stratosphere is for this date, compared to the 1990–2020 average. In winter, the air inside the Polar Vortex is extremely cold, often below −70 °C (−94 °F) at 10 hPa.
A rapid warming of tens of degrees over the Arctic within a few days is the signature of a Sudden Stratospheric Warming (SSW), usually caused by large atmospheric waves breaking into the stratosphere from below.
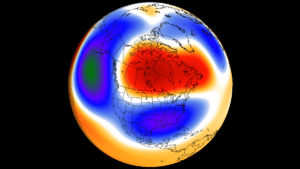
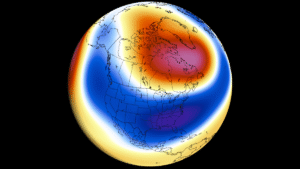
Pressure heights compared to normal (1990–2020). Blue means lower heights than normal, where the Polar Vortex is deeper and stronger. Orange and red mean higher heights than normal, usually a high-pressure ridge pushing into the Arctic, often from the North Pacific side (the Aleutian High).
A large red area over the pole means the Polar Vortex is weakened or displaced, with its cold blue core pushed toward one of the continents, which often brings colder weather below it.
Press play or drag the slider to run the forecast in 12-hour steps, up to 15 days ahead with ECMWF and 16 days with GFS. You can also use the arrow buttons, or swipe the map left or right on a phone.
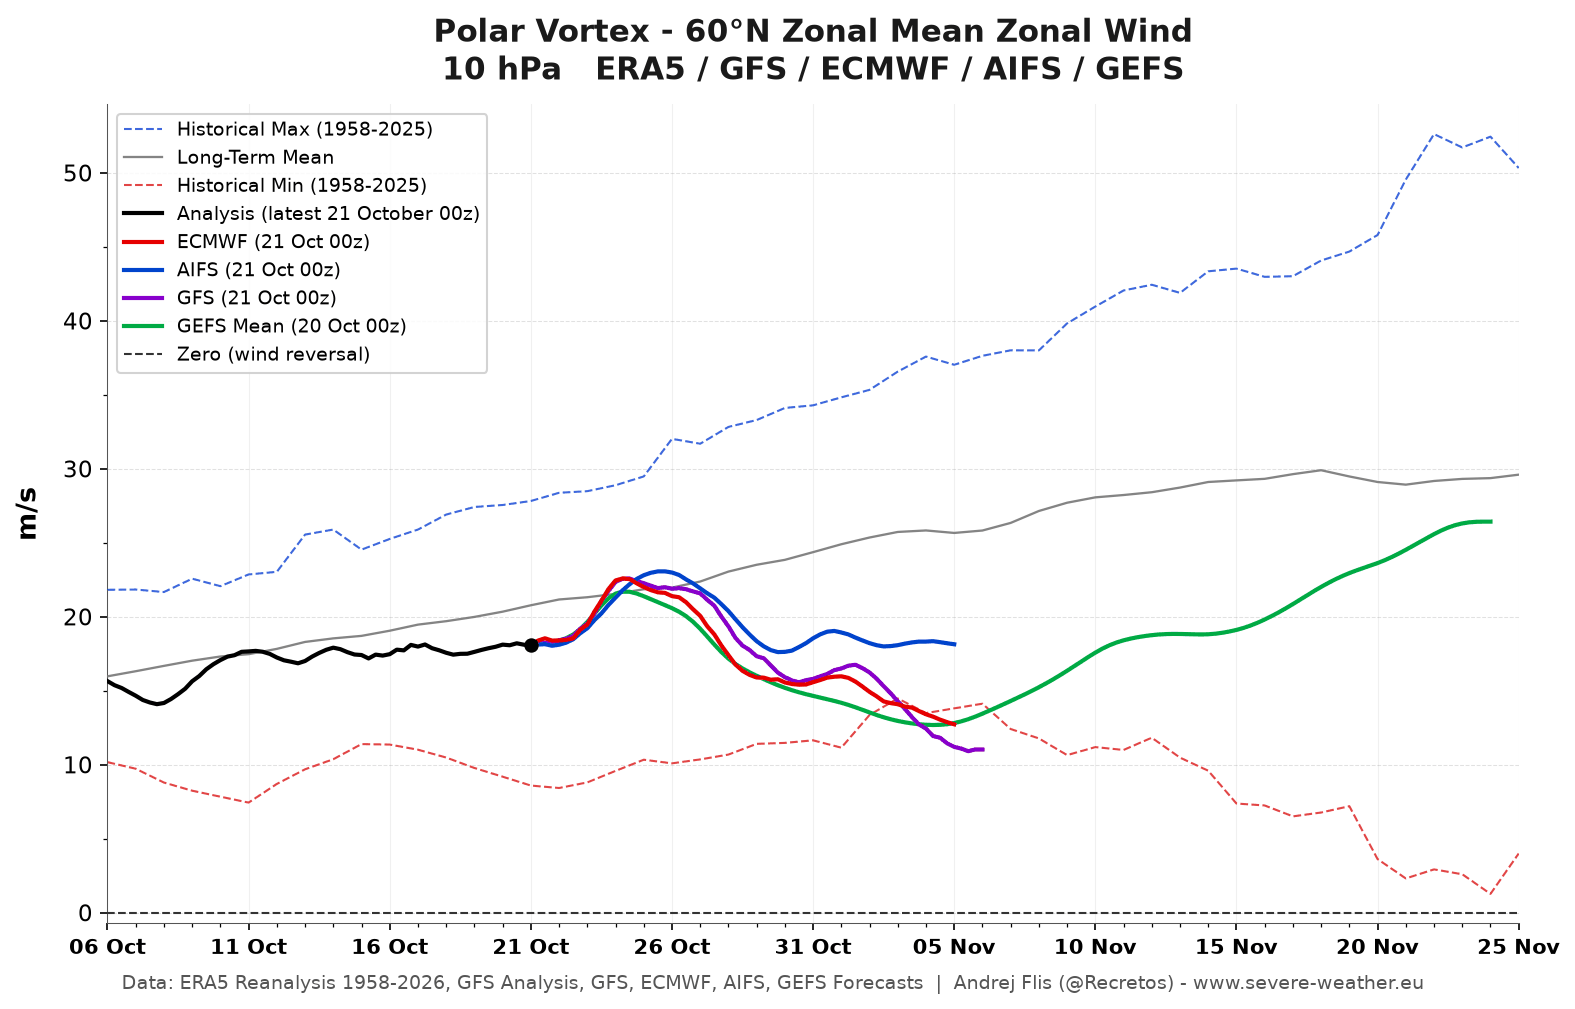
The strength of the Polar Vortex, measured as the average west-to-east (zonal) wind around the 60°N latitude circle at 10 hPa. This is the standard index used to track the strength of the Polar Vortex. Black is the observed analysis, red is the ECMWF, blue is AIFS (ECMWF’s AI forecast model), and purple is the GFS forecast, green the GEFS ensemble mean.
The gray line is the long-term average, and the dashed lines the record highs and lows since 1958. Above the gray line means a stronger than normal Polar Vortex, below it a weaker one. If the wind drops below zero (black dashed line), it reverses to easterly. That is the official definition of a major Sudden Stratospheric Warming event.
The average temperature of the polar cap (60–90°N) at 10 hPa, around 30 km (19 miles) high, from 15 days ago to 35 days ahead. Black is the observed analysis, red is the ECMWF, blue is AIFS (ECMWF’s AI forecast model), purple is the GFS forecast, and green is the GEFS ensemble mean. The gray line is the long-term average (1980–2020), and the dashed lines are the record warmest (red) and coldest (blue) values since 1958. The left scale is in °C, the right one in Kelvin.
A strong Polar Vortex keeps the polar cap cold, near or below the gray line. A sharp rise of 15 to 30 °C (27 to 54 °F) within a few days, often climbing toward the record warm line, is the signature of a Sudden Stratospheric Warming.
The same vortex wind index over the whole season, from August to April. The gray shading shows the usual range from past winters (the middle 40% and 80% of years), and the dashed lines the record highs and lows. The orange line is last winter. The wind normally strengthens through autumn, peaks in mid-winter, and turns easterly in spring, when the vortex breaks down for the summer (the final warming). It shows how this winter compares to historical data.
The last 8 ECMWF forecast runs in one chart, covering the past three and a half days, with the latest in bold red and older runs in lighter colors. If the newer runs keep moving in the same direction, for example each one showing a stronger weakening, the forecast trend is becoming more reliable. Big jumps between runs mean high uncertainty.
The last 8 GFS forecast runs in one chart, with the latest in bold red. The GFS runs four times a day, so these cover the past two days. Runs that agree with each other give more confidence, while runs jumping up and down mean the forecast is still uncertain. Comparing this chart with the ECMWF trend shows whether both models are moving the same way.
Each gray line is one member of the GEFS ensemble, the United States GEFS ensemble model forecast, running about 5 weeks ahead. The black line is the ensemble mean, and the blue shading shows the usual range for each date. The more members that drop toward or below zero, the higher the chance of a Polar Vortex disruption and potentially a Sudden Stratospheric Warming in the coming weeks. Note that the GEFS tends to keep the vortex too strong at longer lead times, so a weakening may turn out stronger than shown.
These charts show the atmosphere over the Arctic from the lower atmosphere up to about 48 km or 30 miles (1 hPa), with time running from left to right. Everything left of the red dashed line is the GFS analysis of the past weeks, everything right of it is the 16-day GFS forecast. The pressure scale on the left and the height scale on the right show how high each layer is.
The average west-to-east wind at 60°N at every height, in m/s. Dark red means strong westerly winds, the jet that forms the edge of the Polar Vortex. The winds are strongest near the top of the stratosphere and weaken toward the ground. Blue would mean the winds have reversed to easterly, which happens during a Sudden Stratospheric Warming, usually first at the top and then working down.
The wind compared to normal (1990–2020), in m/s. Blue means weaker than normal, red stronger. Blue areas spreading down from the top show a weakening Polar Vortex working its way down toward the lower atmosphere, which can take one to several weeks. A strong, long-lasting red signal means a stable Polar Vortex that keeps the cold air locked in the Arctic.
Polar cap (60–90°N) average temperature compared to normal. Strong red areas appearing at the top of the chart mean the stratosphere is warming quickly, as in a Sudden Stratospheric Warming, when parts of the polar stratosphere can warm by 30 to 50 °C (54 to 90 °F) within a few days. Blue means a colder than normal and usually stronger vortex.
The same temperature anomaly, scaled by how unusual it is for this time of year, in standard deviations (σ). This makes different heights and seasons easier to compare. Values above +2 or below −2 occur only a few percent of the time, so they mark truly unusual events.
Polar cap (60–90°N) heights compared to normal, in meters, from the surface up to 48 km (30 miles). Orange and red mean higher heights and a weaker vortex, blue lower heights and a stronger vortex. When the red moves down from the top toward the surface, it often brings a negative Arctic Oscillation (AO), a weaker and wavier jet stream, and a higher risk of cold outbreaks into the mid-latitudes in the following weeks.
The famous “dripping paint” chart. The same height anomaly, scaled by how unusual it is (standard deviations). This view became widely known from research on how stratospheric anomalies descend into the lower atmosphere (Baldwin and Dunkerton, 2001). Watch whether anomalies above +1 or below −1 reach the surface: red favors a negative AO and colder spells, while blue favors a positive AO, with milder and stormier westerly flow.
Click the chart to open it full size in a new tab.
All charts load in full resolution, so you can pinch to zoom in on the details. Press and hold a chart to save it or open it on its own.
Latest Polar Vortex Status and Updates (October 22, 2026)
Recent forecasts are indicating an unusually early Polar Vortex disruption event. Below is the Polar Vortex wind forecast, which we use to estimate its strength. A stronger Polar Vortex creates a stronger polar jet in the stratosphere, so this image shows whether the vortex is weakening or strengthening.
As the multi-model forecast shows, all major sources agree the Polar Vortex will weaken toward early November. The long-term mean line shows it should increase in strength, but instead we see weakening. It even drops below the historical low (red dashed line) for this time of year, going record weak for early November (since 1958).
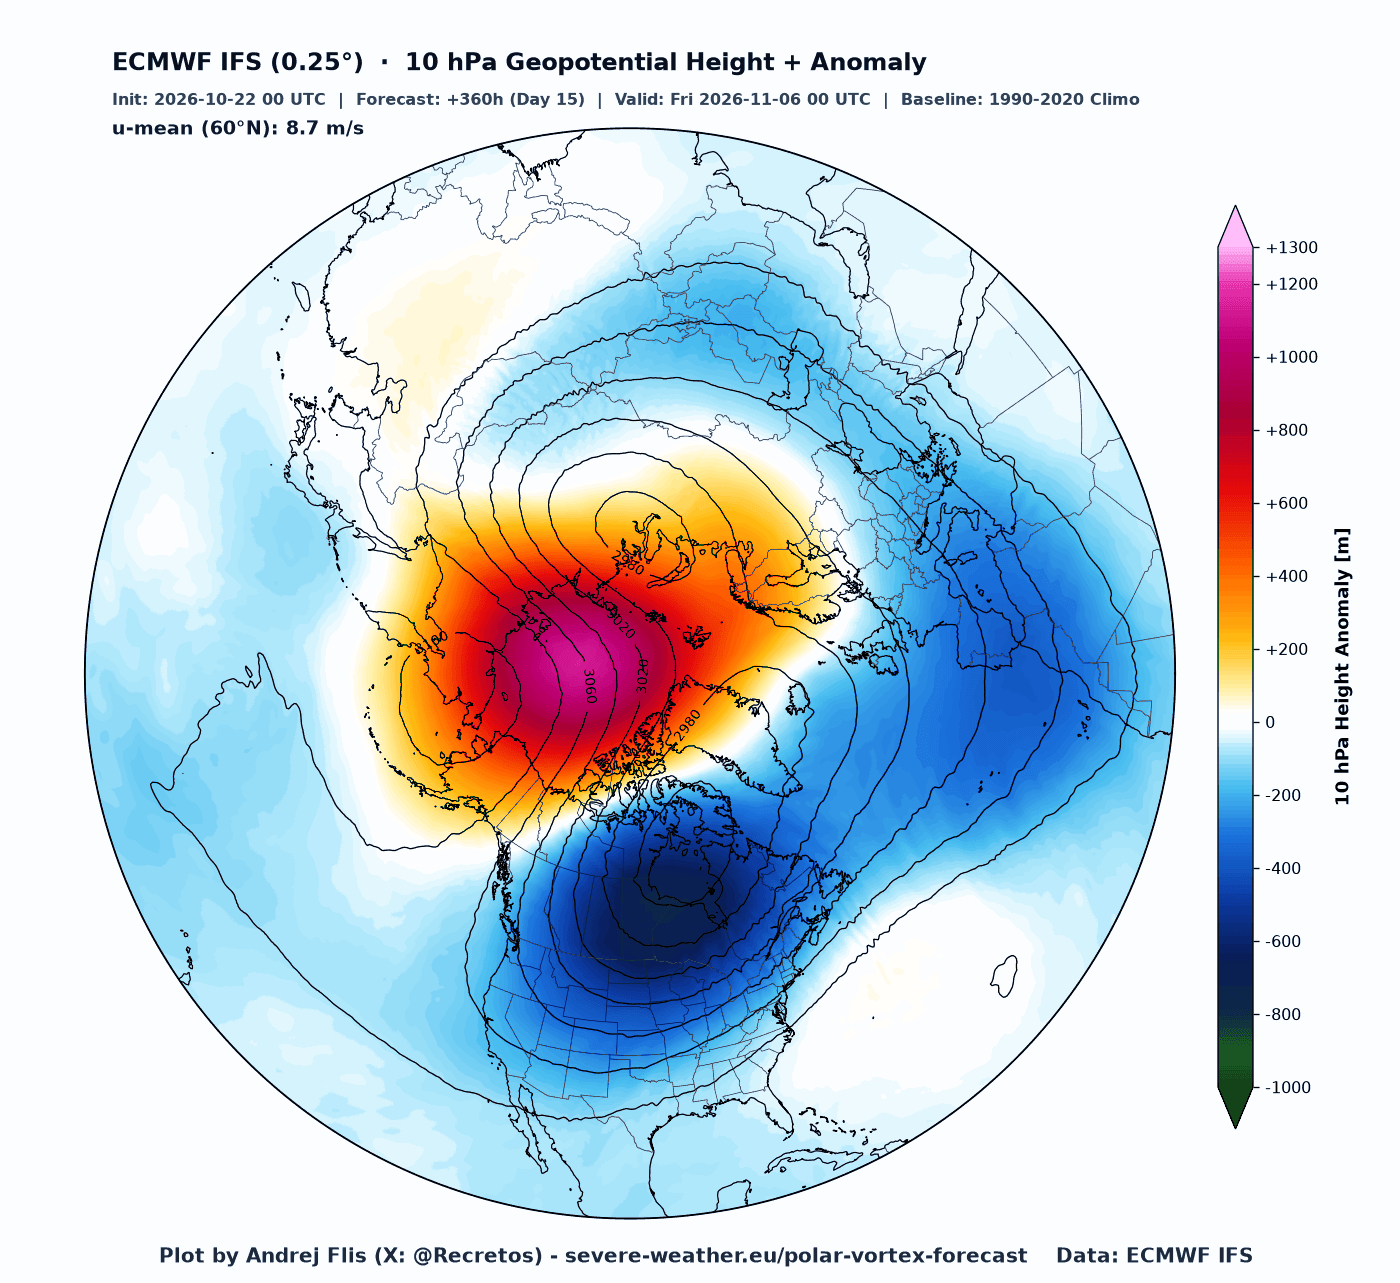
Below is the map that shows the actual shape of the Polar Vortex, and the geopotential height (pressure) anomaly at the 10mb level (30 km / 19 miles). A healthy Polar Vortex is nicely circular, but here you can see it is oval-shaped and trying to split into two cores, due to a high-pressure wave anomaly pushing into the Polar Vortex.
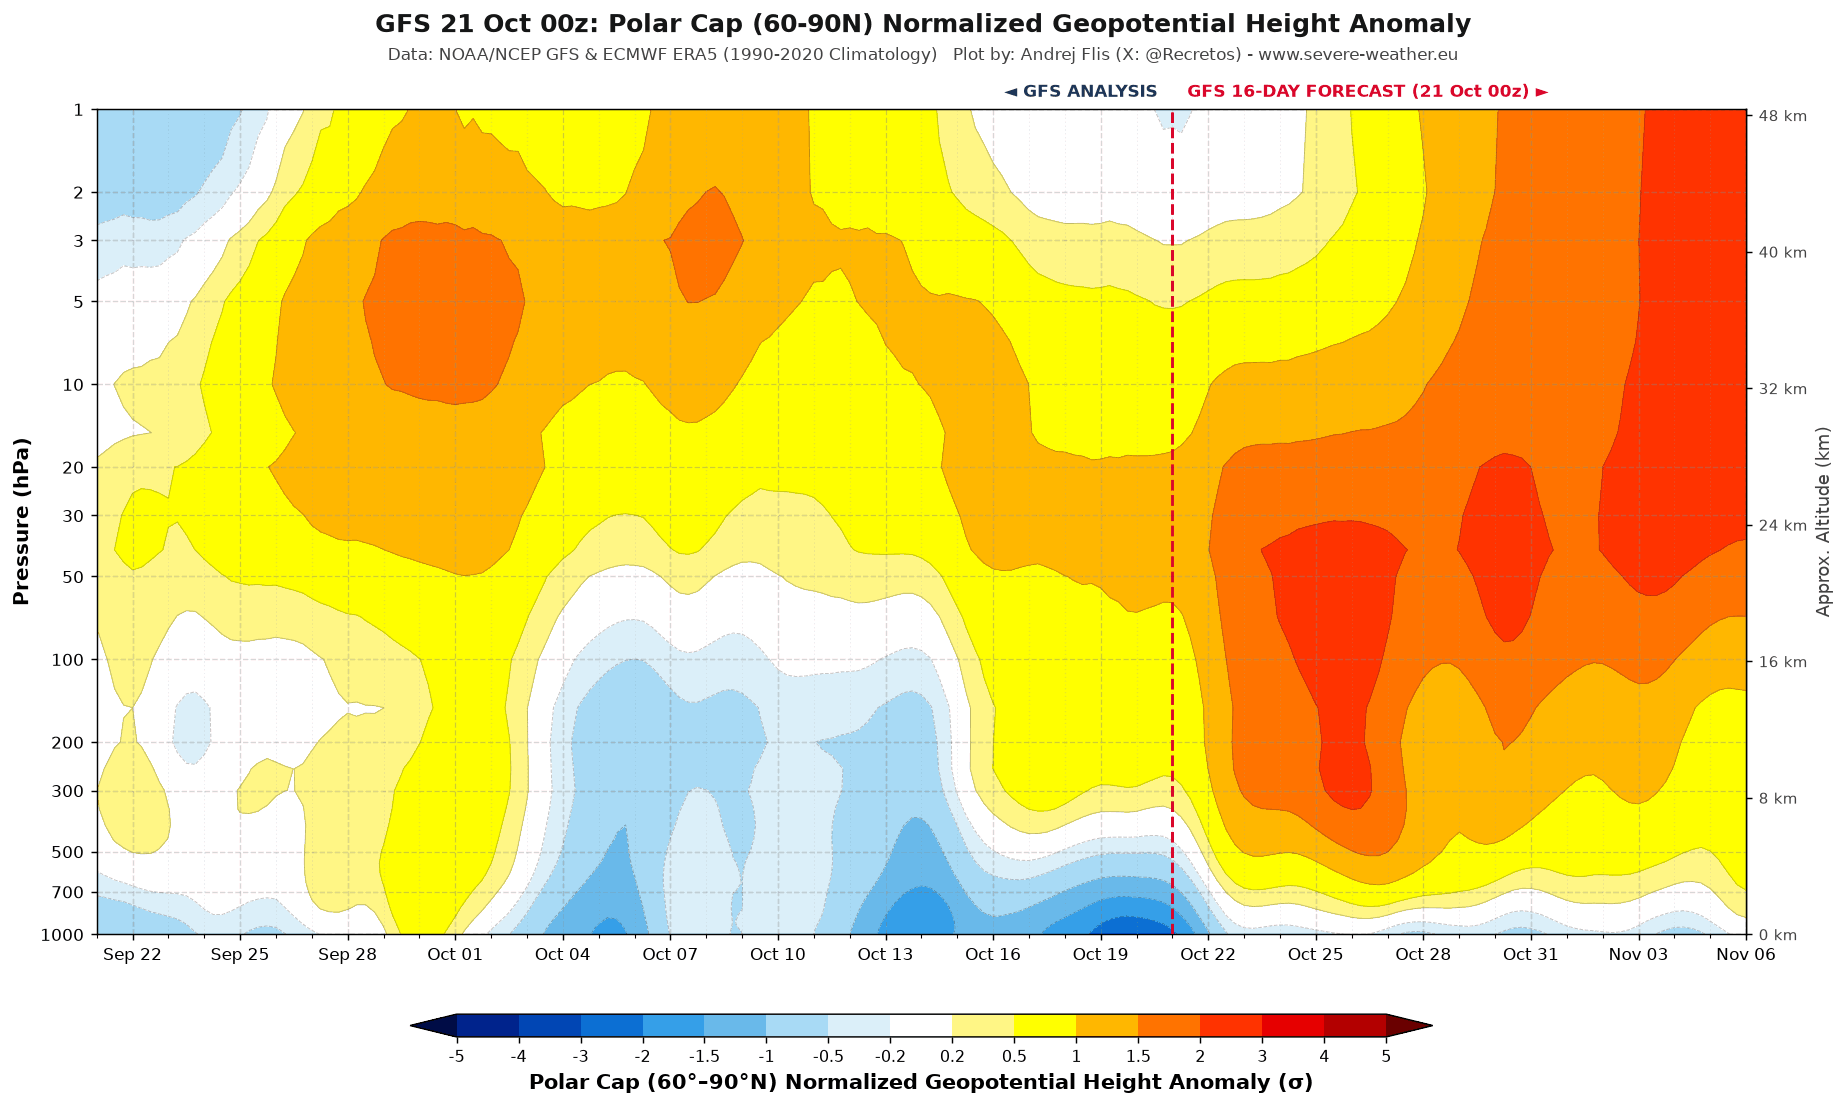
We can use the vertical view for the pressure anomaly, where you can clearly see in the forecast that the high-pressure anomaly starts lower down and rises over time. This is an upward, or bottom-up, event in which the Polar Vortex gets disrupted from below.
I produced a 3D video animation that shows the latest Polar Vortex data in 3D, revealing the full evolution during this upward disruption. You can see how the structure gets deformed and broken apart in the core, also giving a proper visual presentation of what the Polar Vortex looks like.
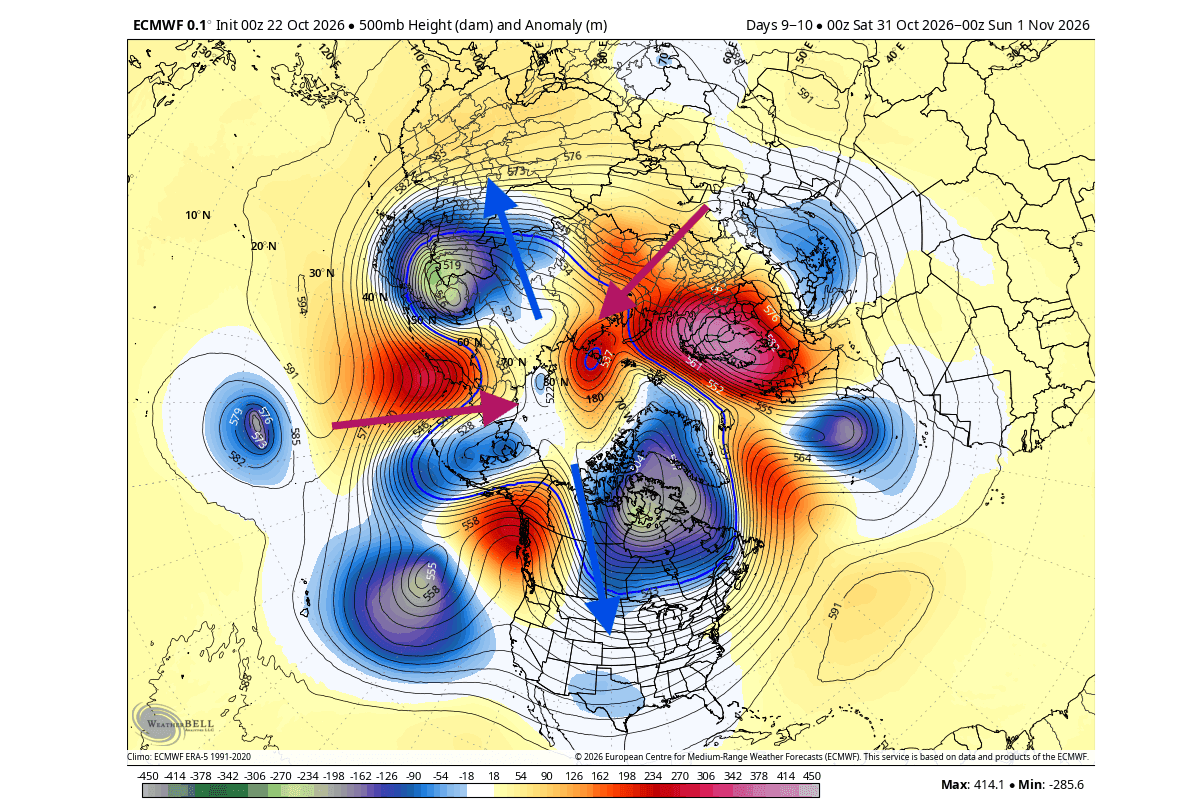
In the ECMWF forecast below, you can see the pressure pattern in the lower levels, linked with this event. What stands out are the double lower cold cores of the Polar Vortex, also split apart by two strong high-pressure ridges, with a larger one heading into North America. This is the pattern that pushes upward into the stratosphere. Image by WxBell
The airmass temperature forecast below shows, as an example, what it means to have a Polar Vortex core over North America. It increases the chance for a cool wave in Fall, as it tries to enable a more northerly flow in the process.
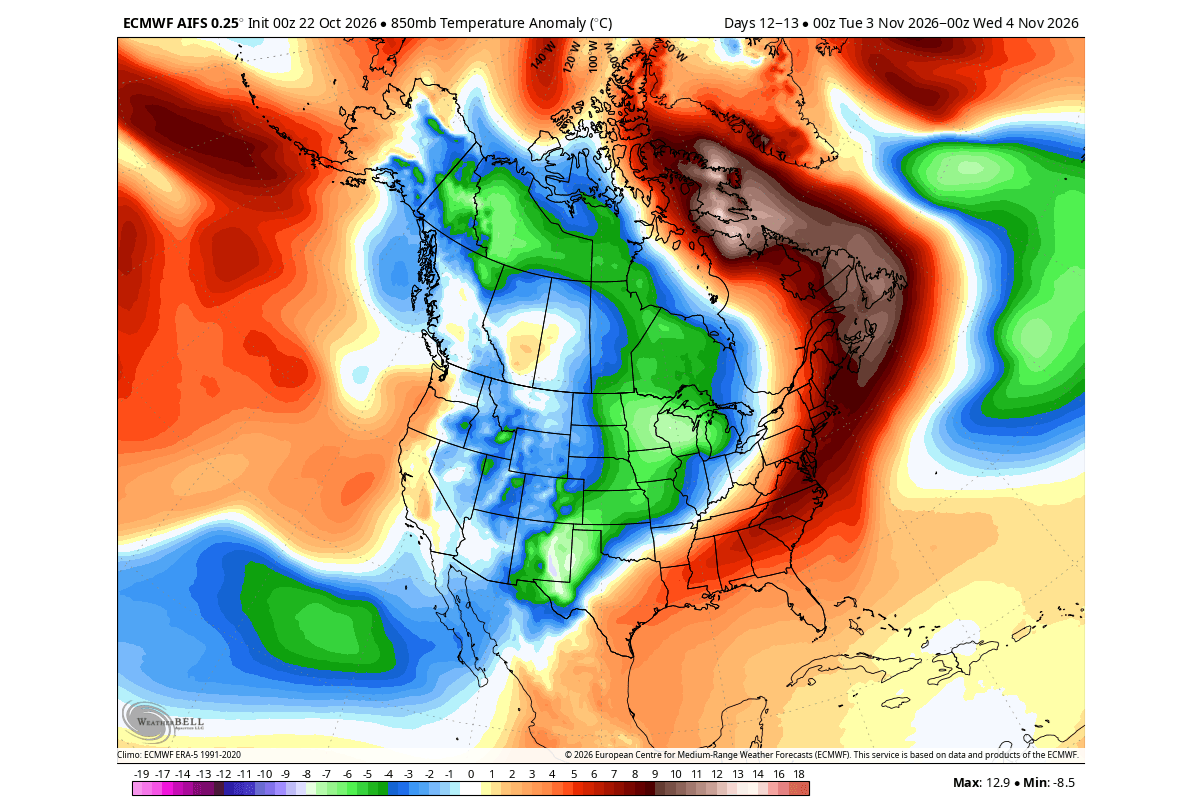
If this happened in mid-winter, a disruption like this could release much colder air into the United States, Canada, and Europe. But in late October, the cold air source is still limited. A strong Polar Vortex disruption in mid-winter can significantly change winter potential, and we are now seeing interesting signals for 2026/2027.
Winter 2026/2027 Polar Vortex Long-Range Outlook (October Data)
A weak or disrupted Polar Vortex can increase the potential for colder winter patterns across parts of the mid-latitudes, although it does not guarantee cold or snow in any specific region. The most dramatic disruption is a Sudden Stratospheric Warming (SSW), when powerful atmospheric waves rapidly weaken the Polar Vortex by increasing temperatures and can even reverse its stratospheric flow.
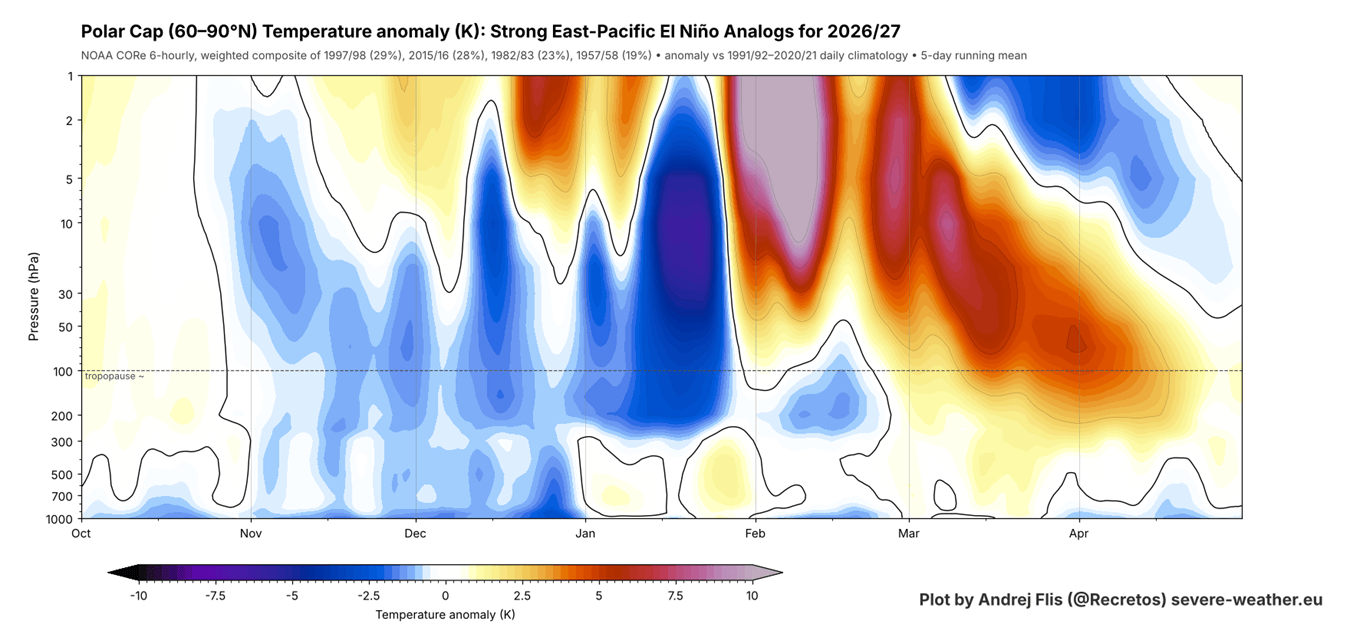
The 2026/2027 winter season will be under a major influence from a Super El Niño in the Pacific. I created an image from past data that shows the combined stratospheric seasonal profile in the 4 closest seasons to 2026 in terms of the state of the atmosphere and the oceans: 2015/16, 1997/98, 1982/83, 1957/58.
What you can see below is the atmosphere from the surface up to about 50 km (31 miles), revealing the tendency for a stronger Polar Vortex in Fall and early Winter. But into February, it shows a strong Stratospheric Warming signal. So, a stronger Polar Vortex early, but with a mid-to-late winter disruption following behind.
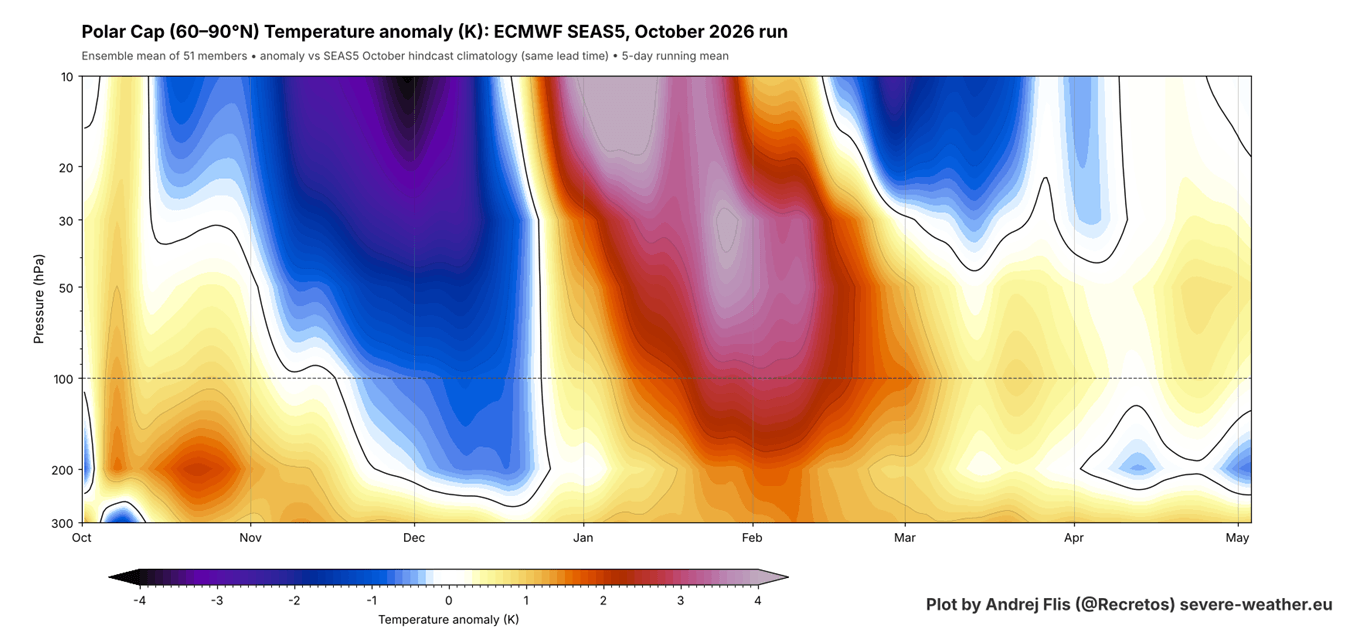
Now, if we look at the ECMWF seasonal forecast for 2026/2027, we can see a similar evolution as in the past analysis above: no early weakening, and then a Stratospheric Warming trend later in the season, arriving about a month earlier than in the analysis.
We see this same signal in the latest ECMWF seasonal forecast for Polar Vortex strength, measured by winds high in the stratosphere. The black line is the main forecast average, and the red line is the model’s long-term normal (hindcast). This forecast shows a proper wind deceleration with a strong below-normal wind signal indicating a weaker Polar Vortex in mid and late winter.
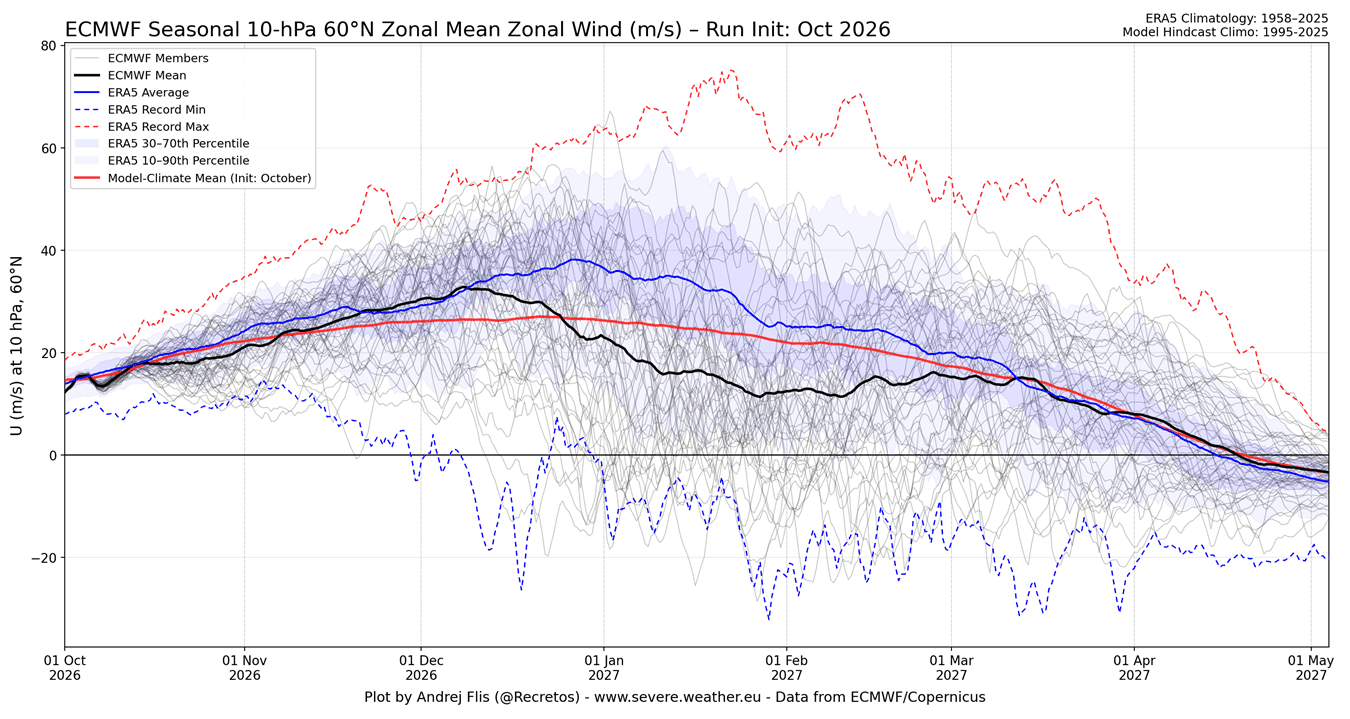
The forecast keeps the Polar Vortex strength above-normal into mid-December. But from late December, the average drops well below normal, and many members show the winds reversing completely. That is the sign of a Sudden Stratospheric Warming, a sudden collapse of the Polar Vortex. This fits well with a strong El Niño, which tends to weaken the Polar Vortex in the second half of winter.
Below is also a long-range forecast for the whole season, but this time for pressure. It shows the air pressure anomalies over the Arctic, from the stratosphere at the top down to the surface at the bottom. Warm colors mean higher pressure and a weaker Polar Vortex, indicated in mid-to-late winter.
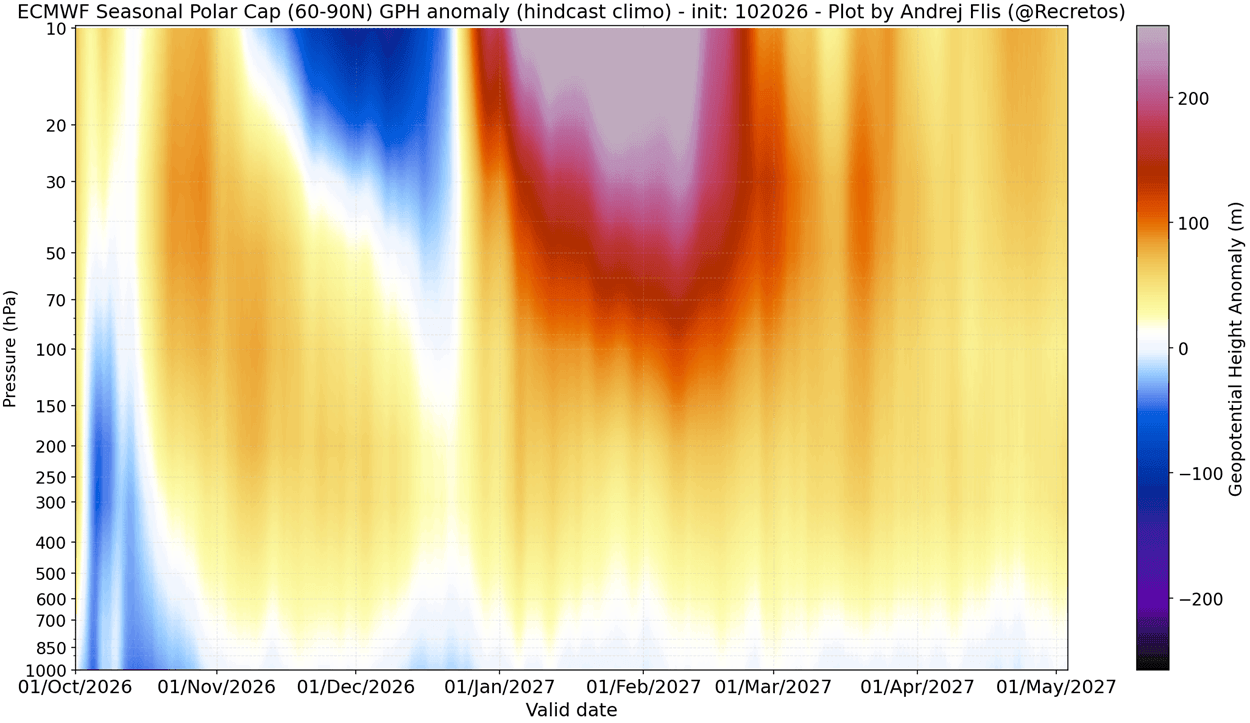
Combining all the different angles into one view, such an anomaly can mean a proper stratospheric warming event or a large Polar Vortex disruption event. But what does a stratospheric warming event mean for winter weather?
How a Sudden Stratospheric Warming Changes Winter Weather
Below is an example of the mid-stratosphere pressure anomaly for the early March 2026 Stratospheric Warming event. It shows an impressive high-pressure anomaly that broke apart the Polar Vortex into two separate cores, with a high-pressure (and temperature) wave over the polar stratosphere.
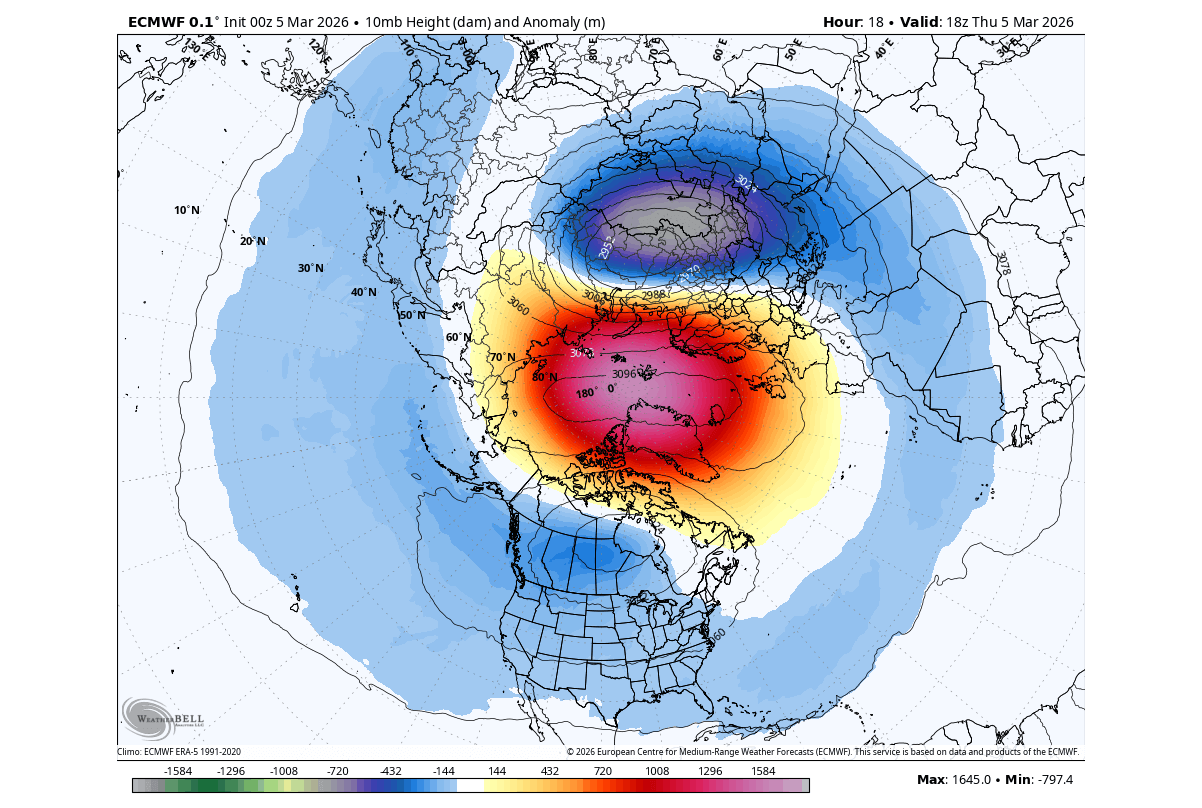
This is a less common but powerful Polar Vortex split event type, which usually has a stronger or faster downward impact on the lower levels. The limiting issue here is that the event unfolded in March, which can usually limit the amount of cold air it can release. But this is a great example of a proper Sudden Stratospheric Warming (SSW) event.
Below is another example, but for a displacement event in February 2023. You can see a large warming wave in the mid-stratosphere, spread over the polar regions, along with a stratospheric high (H) covering the North Pacific and western Arctic. This high-pressure wave has displaced the Polar Vortex (L) southward and reversed the stratospheric winds.
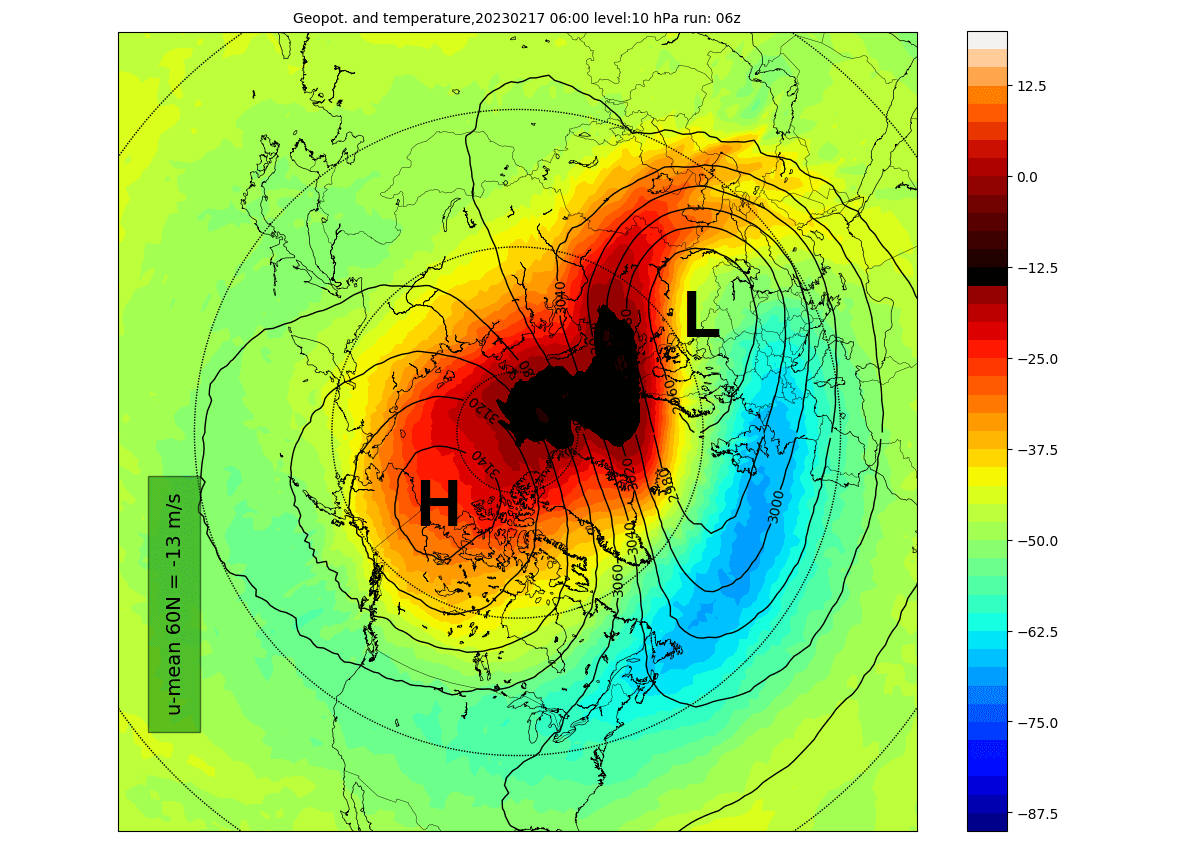
Displacement SSW events can have a slower or less immediate surface impact, while split events often produce an earlier and sometimes more persistent impact. In reality, an SSW response can vary greatly from event to event, depending on existing weather patterns. But how does an SSW event work?
The image shows pressure anomalies across the atmosphere before/after an SSW event, with 0 being the peak day of the event, or the start of wind reversal. You can see how the main event in the stratosphere sends a high-pressure wave downwards, impacting the surface with some delay, usually in the 1-4 week timeframe. Image by NOAA CSL.
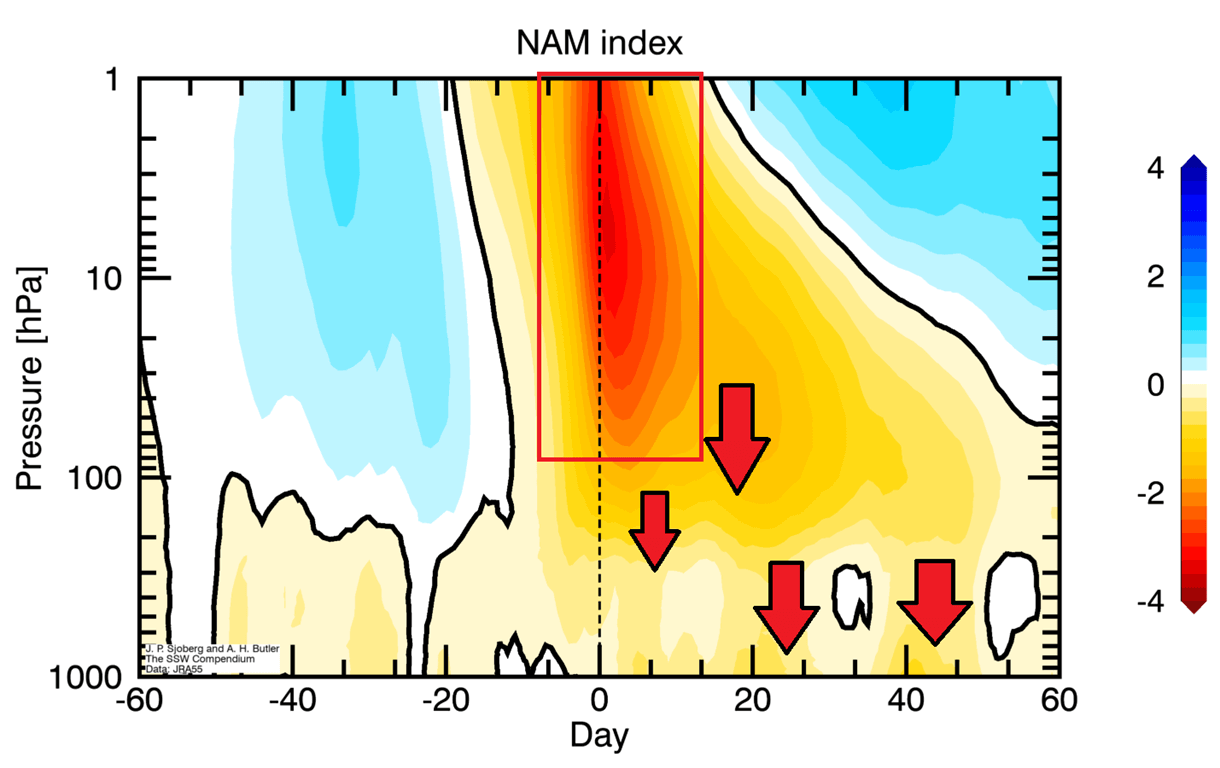
When the Polar Vortex weakens, the cold air it normally keeps in the Arctic can break out and spill south into North America and Europe. We track the weather patterns using a simple index called the Arctic Oscillation (AO). When it’s positive, the cold stays locked in the Arctic, and winters tend to be milder. When the AO turns negative, which is often after a Polar Vortex disruption, cold outbreaks into the mid-latitudes become much more likely.
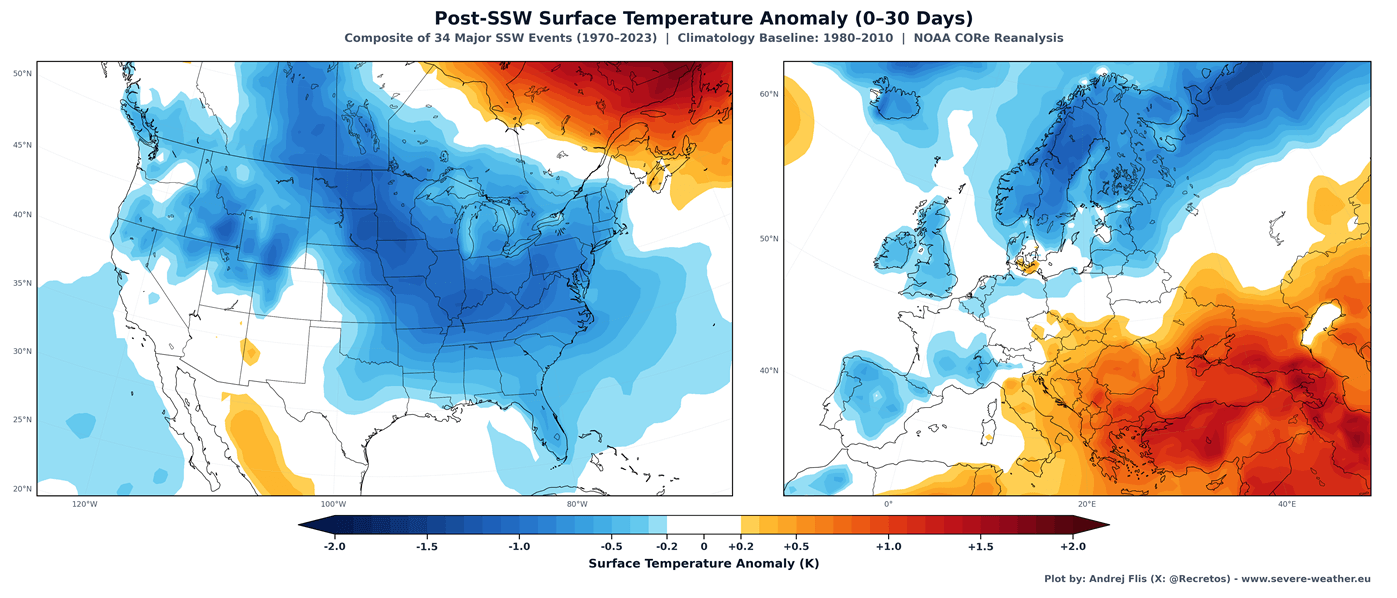
Below, you can see the average temperature 0-30 days after a full Polar Vortex collapse, based on combined data from 34 major SSW events. This shows that most of the United States and northern and central Europe are typically colder than normal after a proper Stratospheric Warming event.
Since we are in a Super El Niño season, below is an example of such a disruption in mid-January 2016, during the last Super El Niño winter. You can see the stretched Polar Vortex with split cores in the lower levels. Pushed into mid-latitudes, these cores brought a cold outbreak to the United States, Canada, and Europe.
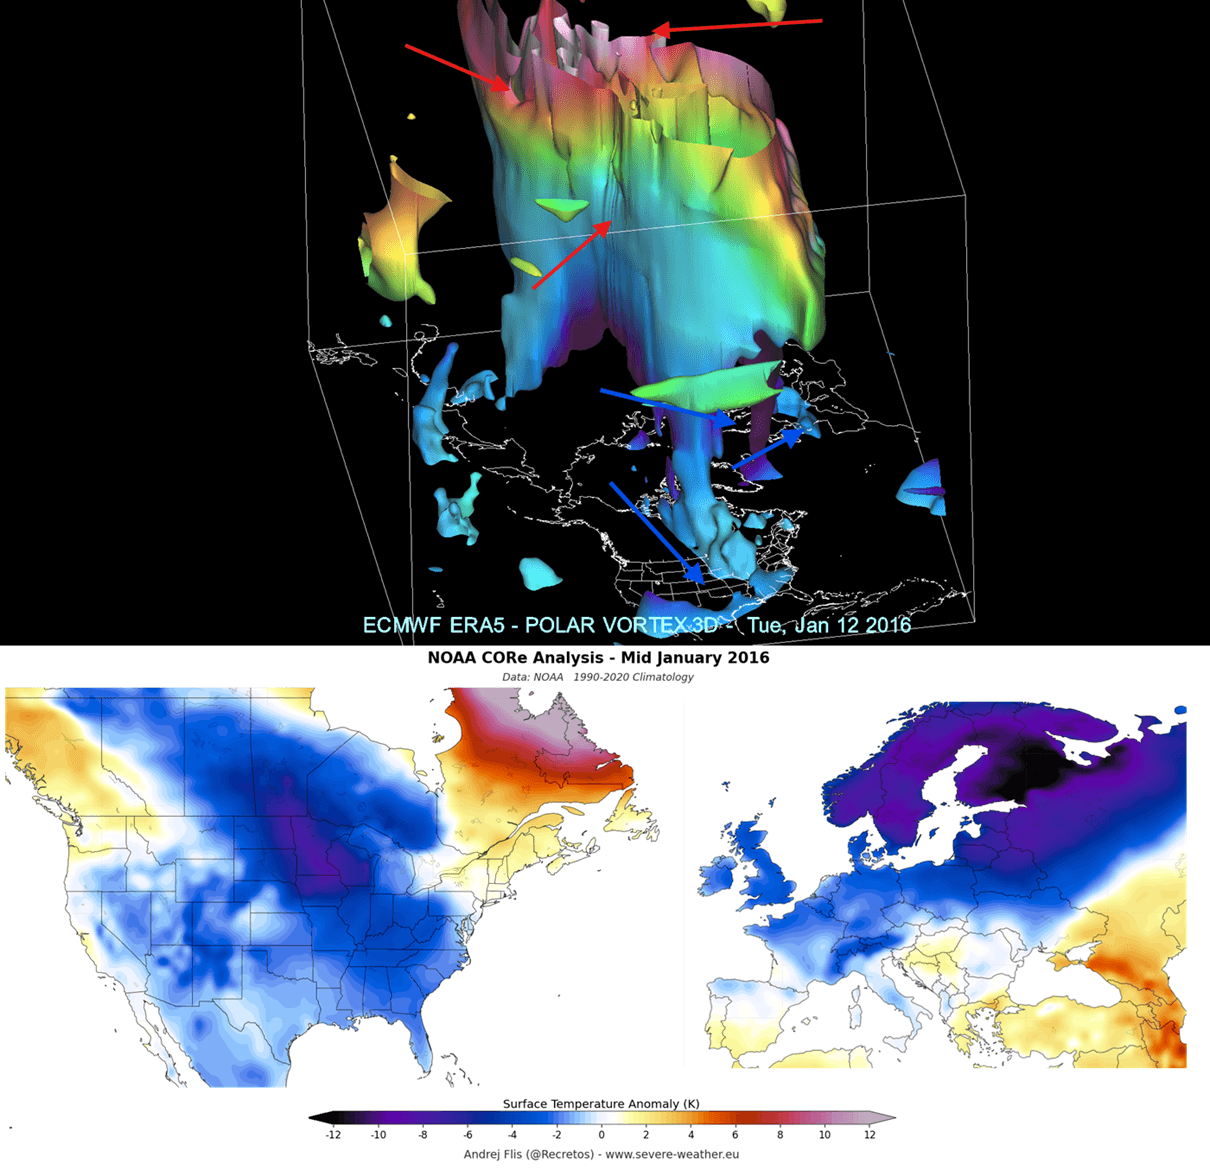
This shows the power that a Polar Vortex has in rapidly changing the course of the winter season across the whole Northern Hemisphere.
Polar Vortex FAQ
What is the Polar Vortex?
The Polar Vortex is a large area of low pressure, very cold air, and strong westerly winds over the polar regions. Its strongest part sits in the stratosphere, between about 15 and 50 km (9 and 31 miles) altitude. It is strongest in mid-winter and breaks down in spring as stratospheric temperatures rise. You can follow its current shape and strength in the Polar Vortex Explorer above.
Does a weak Polar Vortex mean a cold winter?
Not directly, but it can greatly raise the odds. A weak or disrupted Polar Vortex often leads to a disrupted lower-level circulation, a wavier jet stream, and more frequent cold outbreaks across the United States, Canada, and Europe. Where the cold air actually ends up depends on how the Polar Vortex is displaced or split, so not every region usually turns cold.
What is a Sudden Stratospheric Warming?
A Sudden Stratospheric Warming (SSW) is a rapid warming of the polar stratosphere, where parts of the polar stratosphere can warm by 30 to 50 °C (54 to 90 °F) within a few days, caused by large atmospheric waves breaking upward from below. A major SSW is officially defined by the winds at 60°N and 10 hPa reversing from westerly to easterly. You can track this index in the Vortex Strength tab of the explorer above.
How often do Sudden Stratospheric Warmings happen?
On average, about six major SSWs happen per decade, so roughly every other winter. But some winters have none, and some have two. Their effects on the weather at the surface usually appear one to four weeks later, and not every event reaches the surface. More on this in the SSW section above.
Why do ECMWF and GFS show different forecasts?
Each model uses its own physics, resolution, and starting data, so their forecasts drift apart with time, especially beyond about a week. The ECMWF is generally the more reliable model in the stratosphere, while the GFS can swing more from run to run. When both agree, confidence is higher. You can compare them side by side with the Compare option in the explorer.
How often are the charts on this page updated?
The forecast maps and charts update twice a day automatically, after each new ECMWF and GFS model run. The long-range outlook is updated once a month, and I also add my latest thoughts whenever the models show something interesting. Bookmark this page to check the latest Polar Vortex forecast anytime.
Latest Polar Vortex Articles
![Can October Snow Predict Your Winter? I Tested a Famous Forecast Signal Across 47 Winters]()
Can October Snow Predict Your Winter? I Tested a Famous Forecast Signal Across 47 Winters
Every fall, the same question appears on weather forums and social media: Is snow spreading fast across Siberia? Many weather enthusiasts believe that a quick… Read more
![Winter 2026/2027 Forecast: New October Data Shows a Colder, Snowier U.S. Shift]()
Winter 2026/2027 Forecast: New October Data Shows a Colder, Snowier U.S. Shift
In February 1983, a blizzard buried Washington, Baltimore, and Philadelphia in up to two feet of snow. In January 2016, another historic blizzard shut down… Read more
![A New Polar Vortex Is Emerging Over the North Pole, With a Winter 2026/2027 Disruption Risk]()
A New Polar Vortex Is Emerging Over the North Pole, With a Winter 2026/2027 Disruption Risk
A new Polar Vortex is now forming over the North Pole, with rapid stratospheric cooling and a pressure drop already visible in the latest data.… Read more
![Winter 2026/2027 First Forecast: Super El Niño Drives a Major Weather Divide]()
Winter 2026/2027 First Forecast: Super El Niño Drives a Major Weather Divide
UPDATE OCTOBER 7th, 2026: October long-range data trends colder and snowier for the U.S. and milder for southern Canada and Europe Winter 2026/2027 is shaping… Read more
![Super El Niño Forecast Pushes Toward Record Strength as Winter 2026/2027 Signals Emerge]()
Super El Niño Forecast Pushes Toward Record Strength as Winter 2026/2027 Signals Emerge
UPDATE August 12th, 2026: Super El Niño Keeps Growing as New Forecasts Reach Record Territory Ahead of Winter 2026/2027 Latest data shows the 2026 El… Read more
![Polar Vortex Warning Signs Emerge for Winter 2026/2027 as Super El Niño Builds]()
Polar Vortex Warning Signs Emerge for Winter 2026/2027 as Super El Niño Builds
UPDATE September 16th, 2026: A New Polar Vortex is Now Emerging, with a Mid-Winter Disruption Forecast for 2026/2027 Early signs are emerging for a potentially… Read more