The earliest Sudden Stratospheric Warming on record is now confirmed. The winds around the stratospheric Polar Vortex reversed on November 10th, about two and a half weeks earlier than in any winter in almost 70 years, and forecasts now show the disruption working its way down toward the lower levels.
That puts the first possible impact window around Thanksgiving, and some forecast runs already show cold air spilling into the United States at that time. But a single run two weeks out is a scenario, not a forecast. Below, I look at how the disruption moves down through the atmosphere, what similar events can do to the weather over the United States, Canada, and Europe in model simulations, and how to read these cold forecasts without being misled.
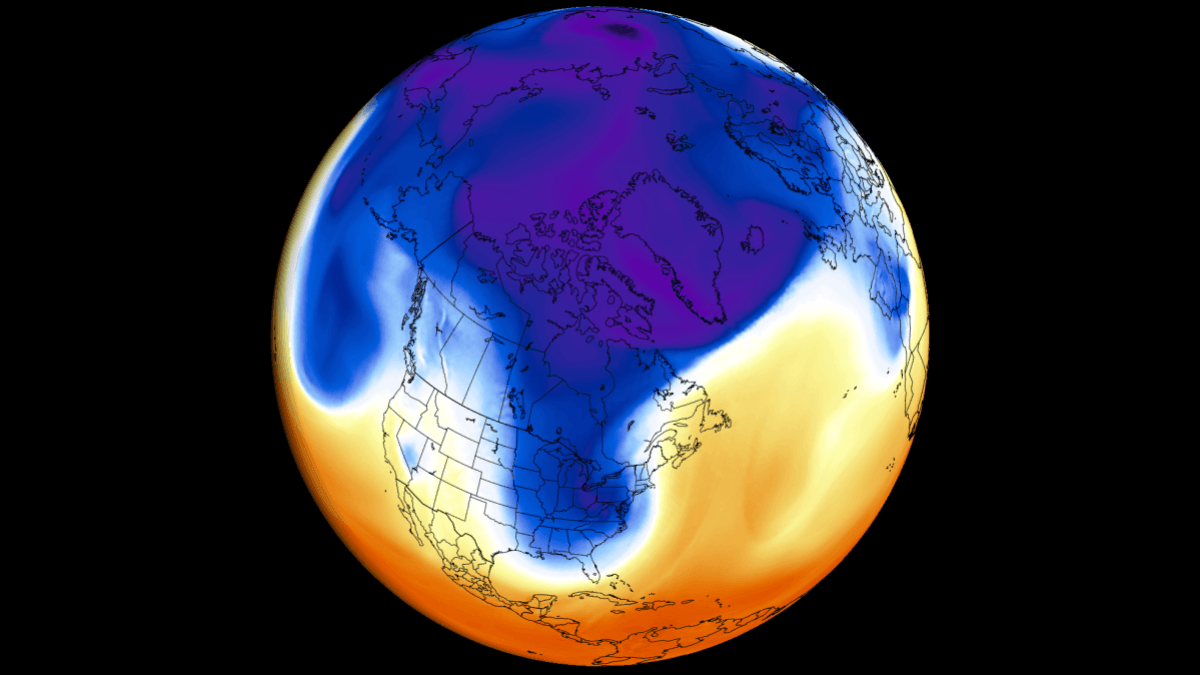
A Record-Early Stratospheric Warming Is Now Confirmed
The Polar Vortex is a broad winter circulation over the Northern (and Southern) Hemispheres. The easiest way to visualize it is as a spinning wall over the polar regions, rising from the surface into the stratosphere (over 50 km/31 miles high) and trapping the cold polar air inside.
This whole winter circulation is divided into two layers: the stratosphere (at higher altitudes) and the troposphere (at lower altitudes). A strong, stable Polar Vortex acts like a barrier, locking the coldest air over the North Pole and creating milder conditions for the United States and Europe, but it can be disrupted and release that cold.
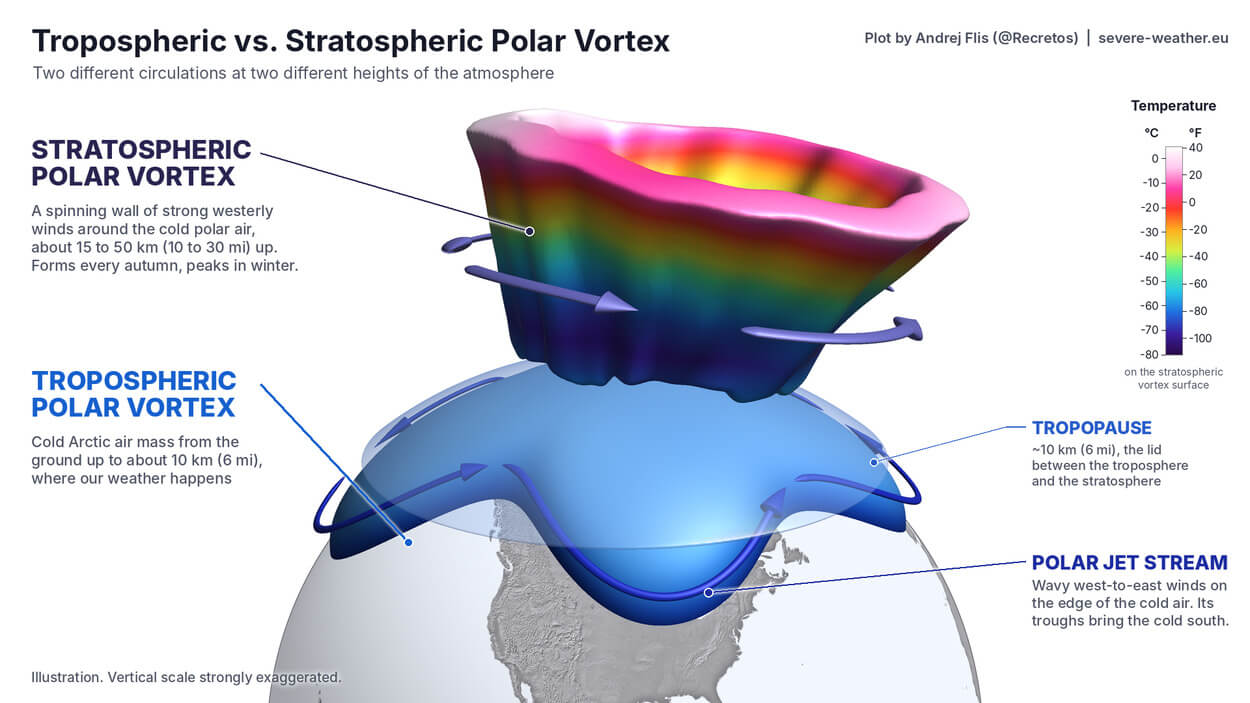
The main disruption usually arises from a rise in pressure and temperature in the stratosphere, known as a Sudden Stratospheric Warming (SSW) event, or from other dynamics that can originate from the lower levels.
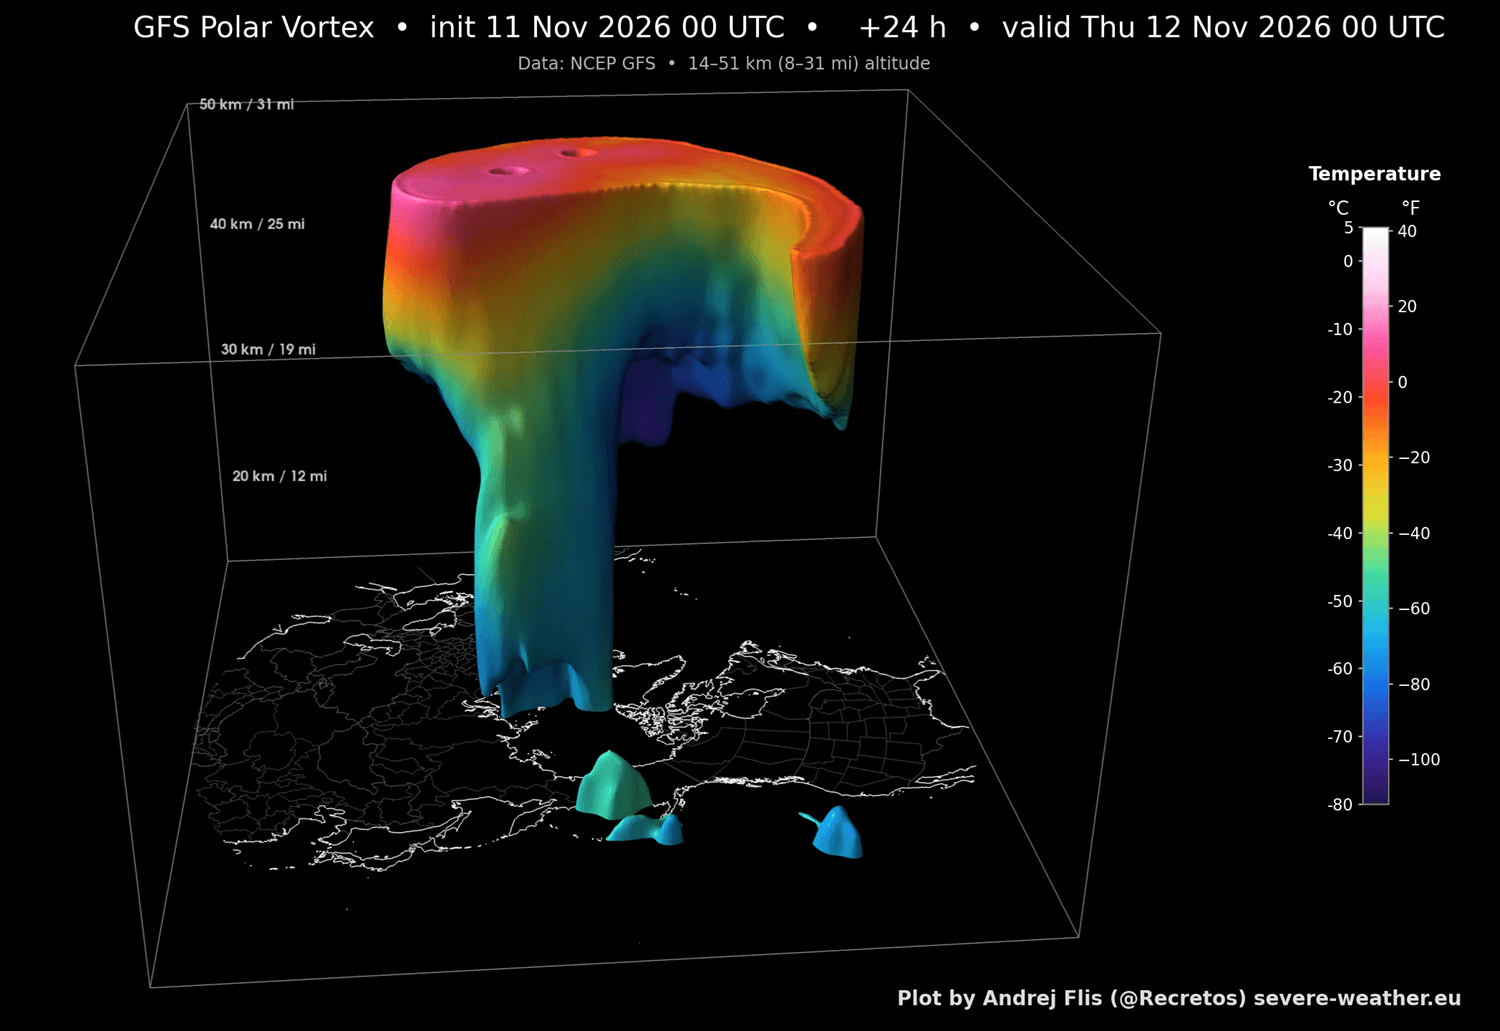
I produced a current 3D view of the Polar Vortex, where you can clearly see its structure. Unlike the example image above, this Polar Vortex is highly disrupted because we are currently in the middle of a record-early Stratospheric Warming event, which is deforming its structure.
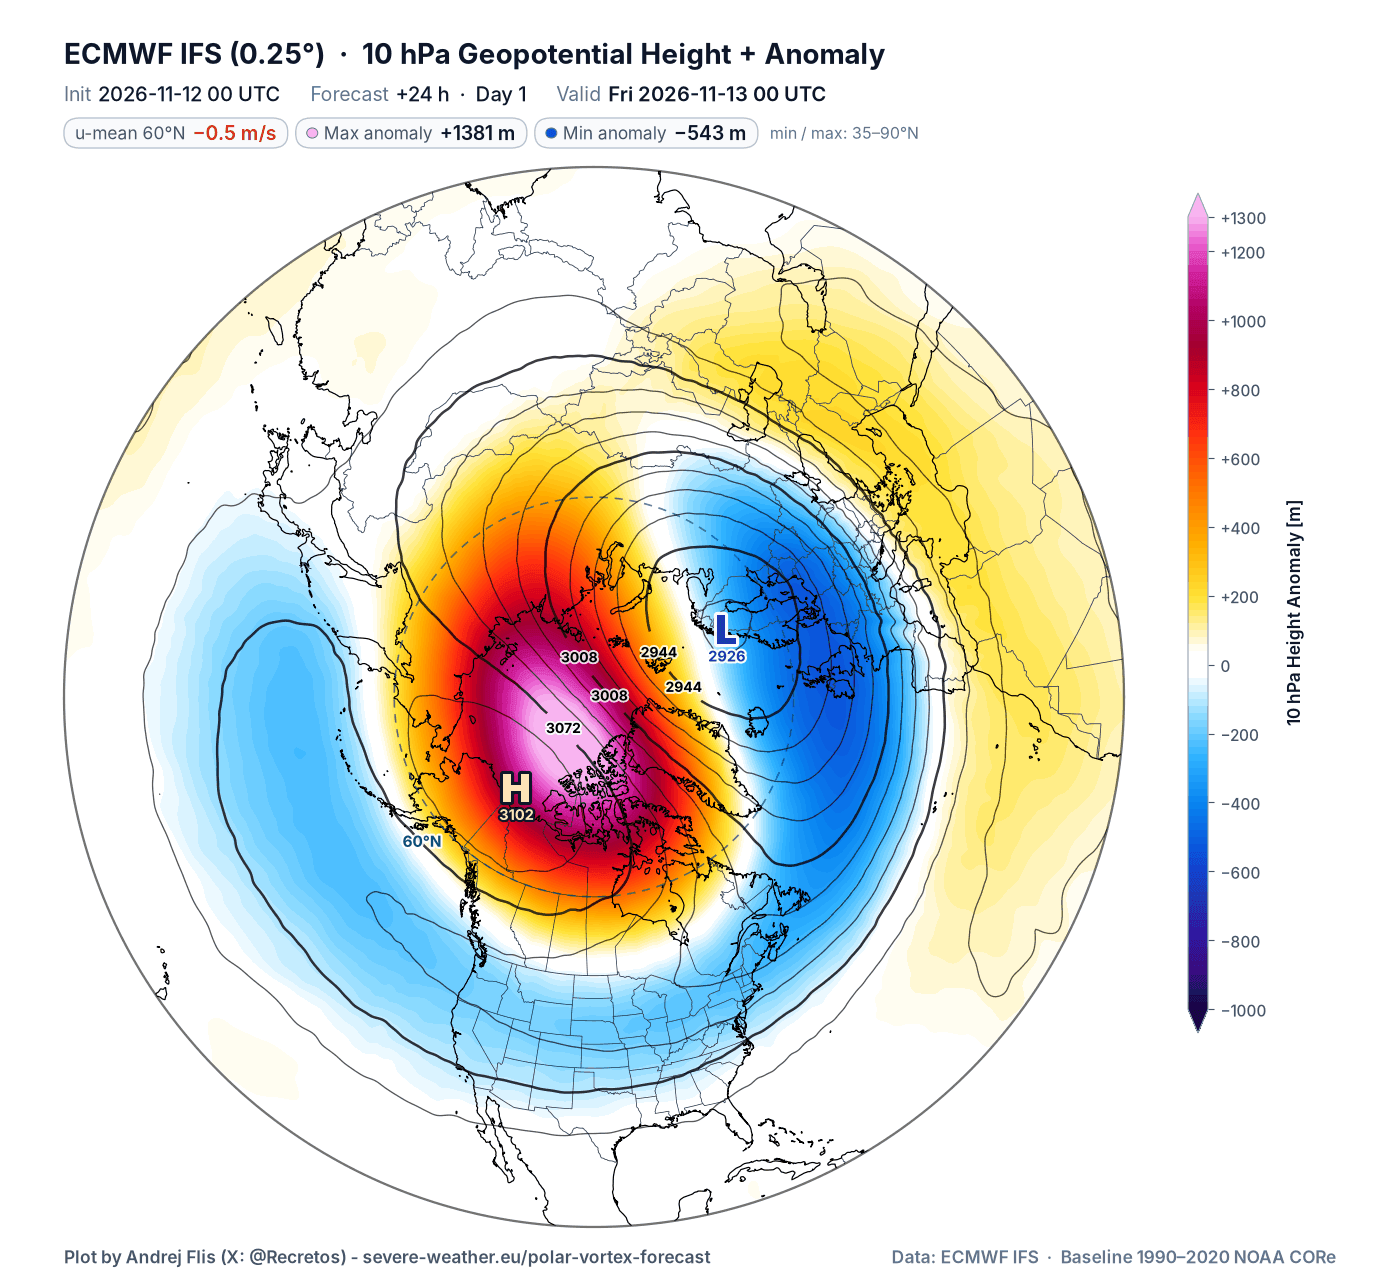
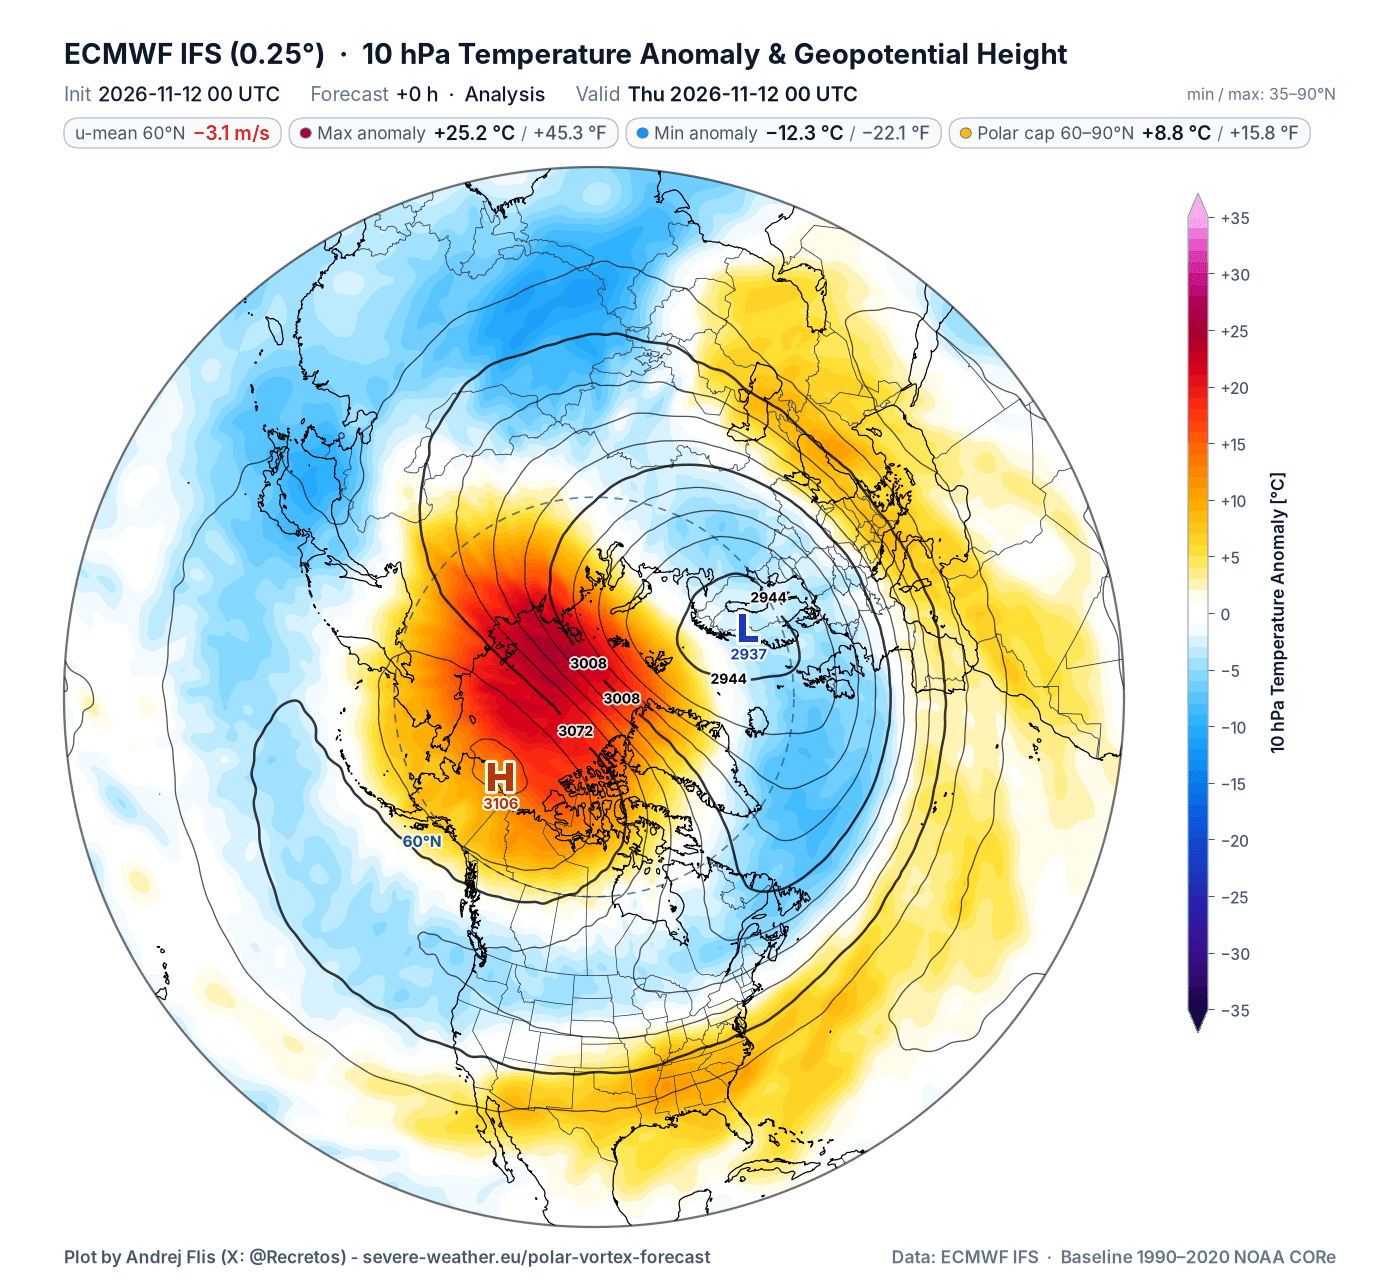
Below is the forecast image for the 10mb level (30 km/19 miles), which shows the Polar Vortex disruption and the pressure wave displacing it from the pole. This also shows a confirmed wind reversal, driven by the strong high-pressure anomaly, marked as the Stratospheric Warming event.
Looking at the temperature anomalies at the same level, you can see the temperatures in the stratosphere currently rising over +25°C (45°F) above normal for this time of year. A combined warming and pressure wave is what deals the main damage to the Polar Vortex, breaking down its circulation.
We usually monitor the overall progress and strength of the Polar Vortex by just looking at its wind in the stratosphere. A strong positive (westerly) wind indicates stable conditions or a strong Polar Vortex, but negative (easterly) winds indicate a complete reversal and a breakdown of the Polar Vortex.
Below is the latest analysis and forecast of the mid-stratospheric winds around the Polar Vortex. It shows a strong slowdown, which first reached near 0 around November 6th. But a proper reversal followed on November 10th, counting as an official Sudden Stratospheric Warming event (SSW). All three ensemble forecasts now show a rapid recovery, but enough damage was done for potential weather impacts.
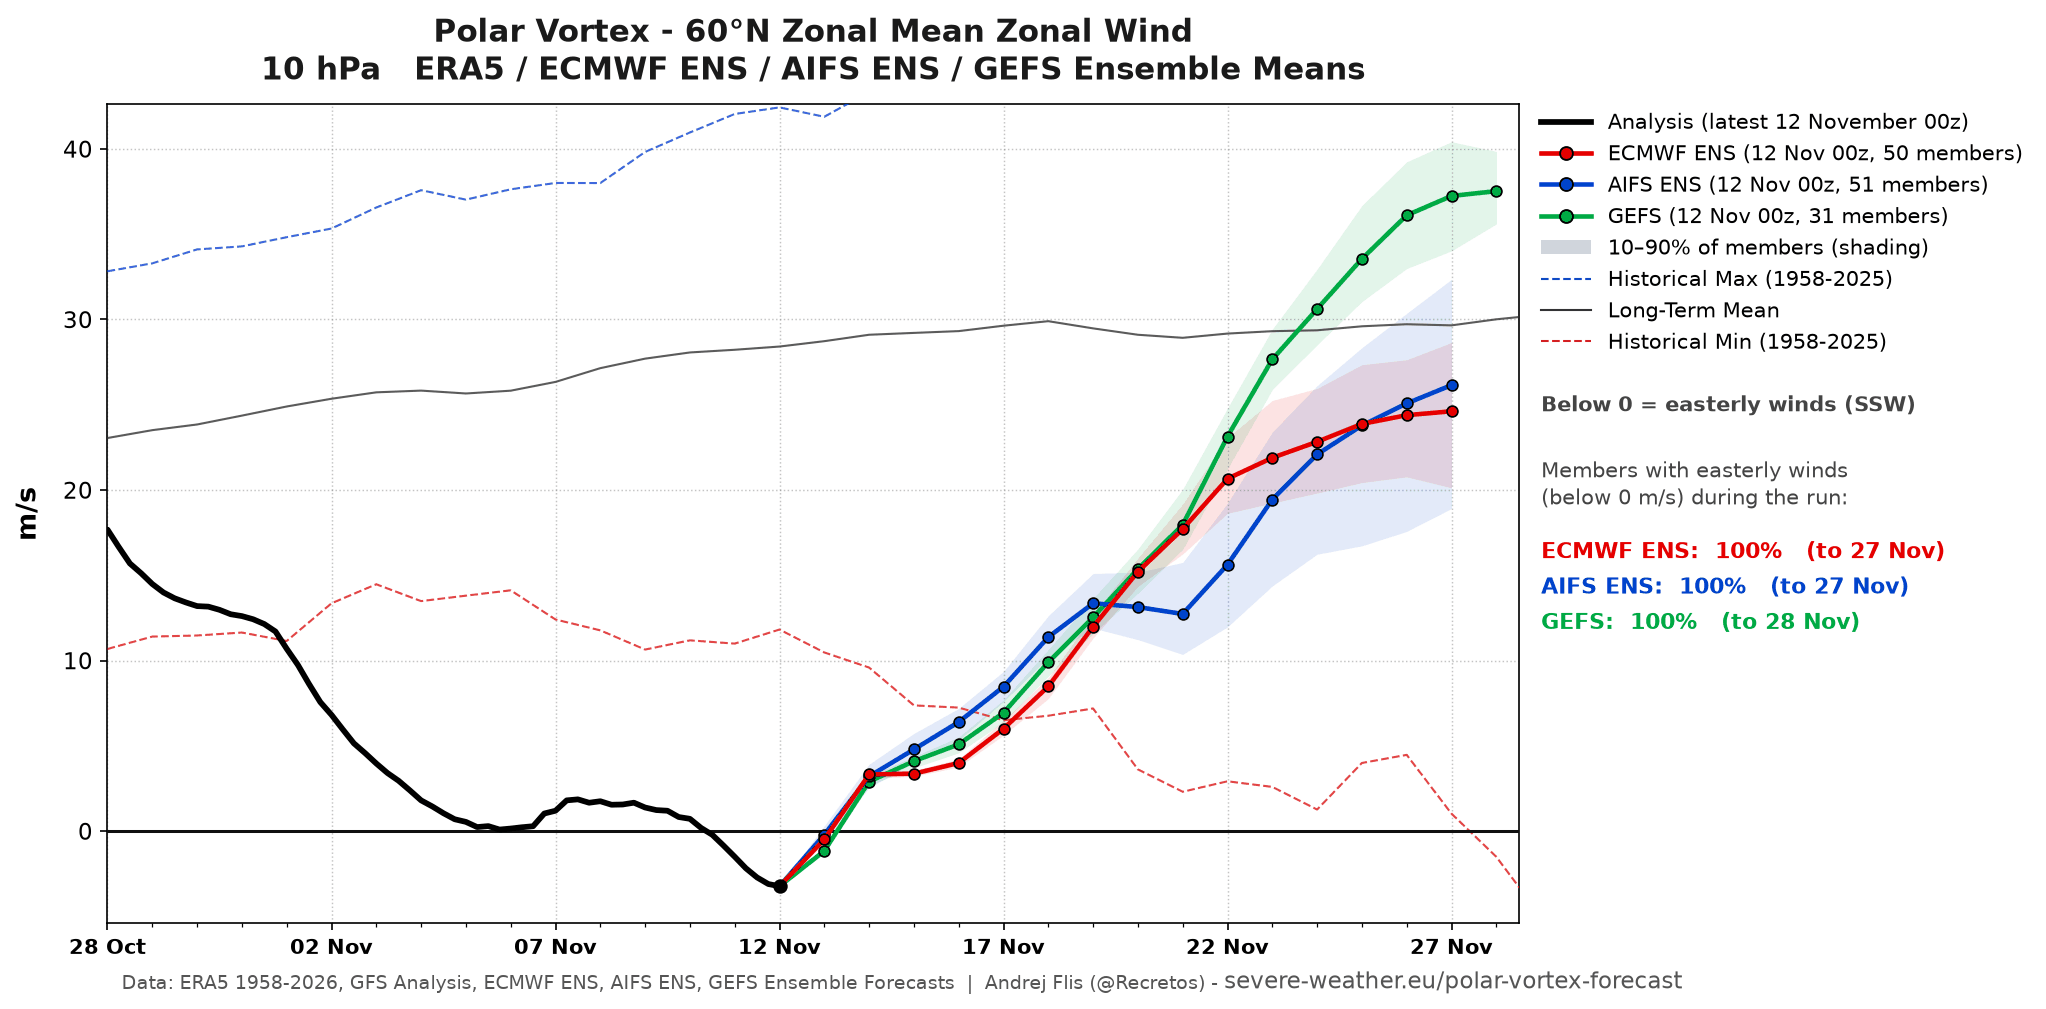
All ensemble members confirm a wind reversal, the earliest on record by about two and a half weeks. What makes this SSW event very unusual is its early timing and a full reversal well before any past event, as seen in the image below that compares to past SSW events.
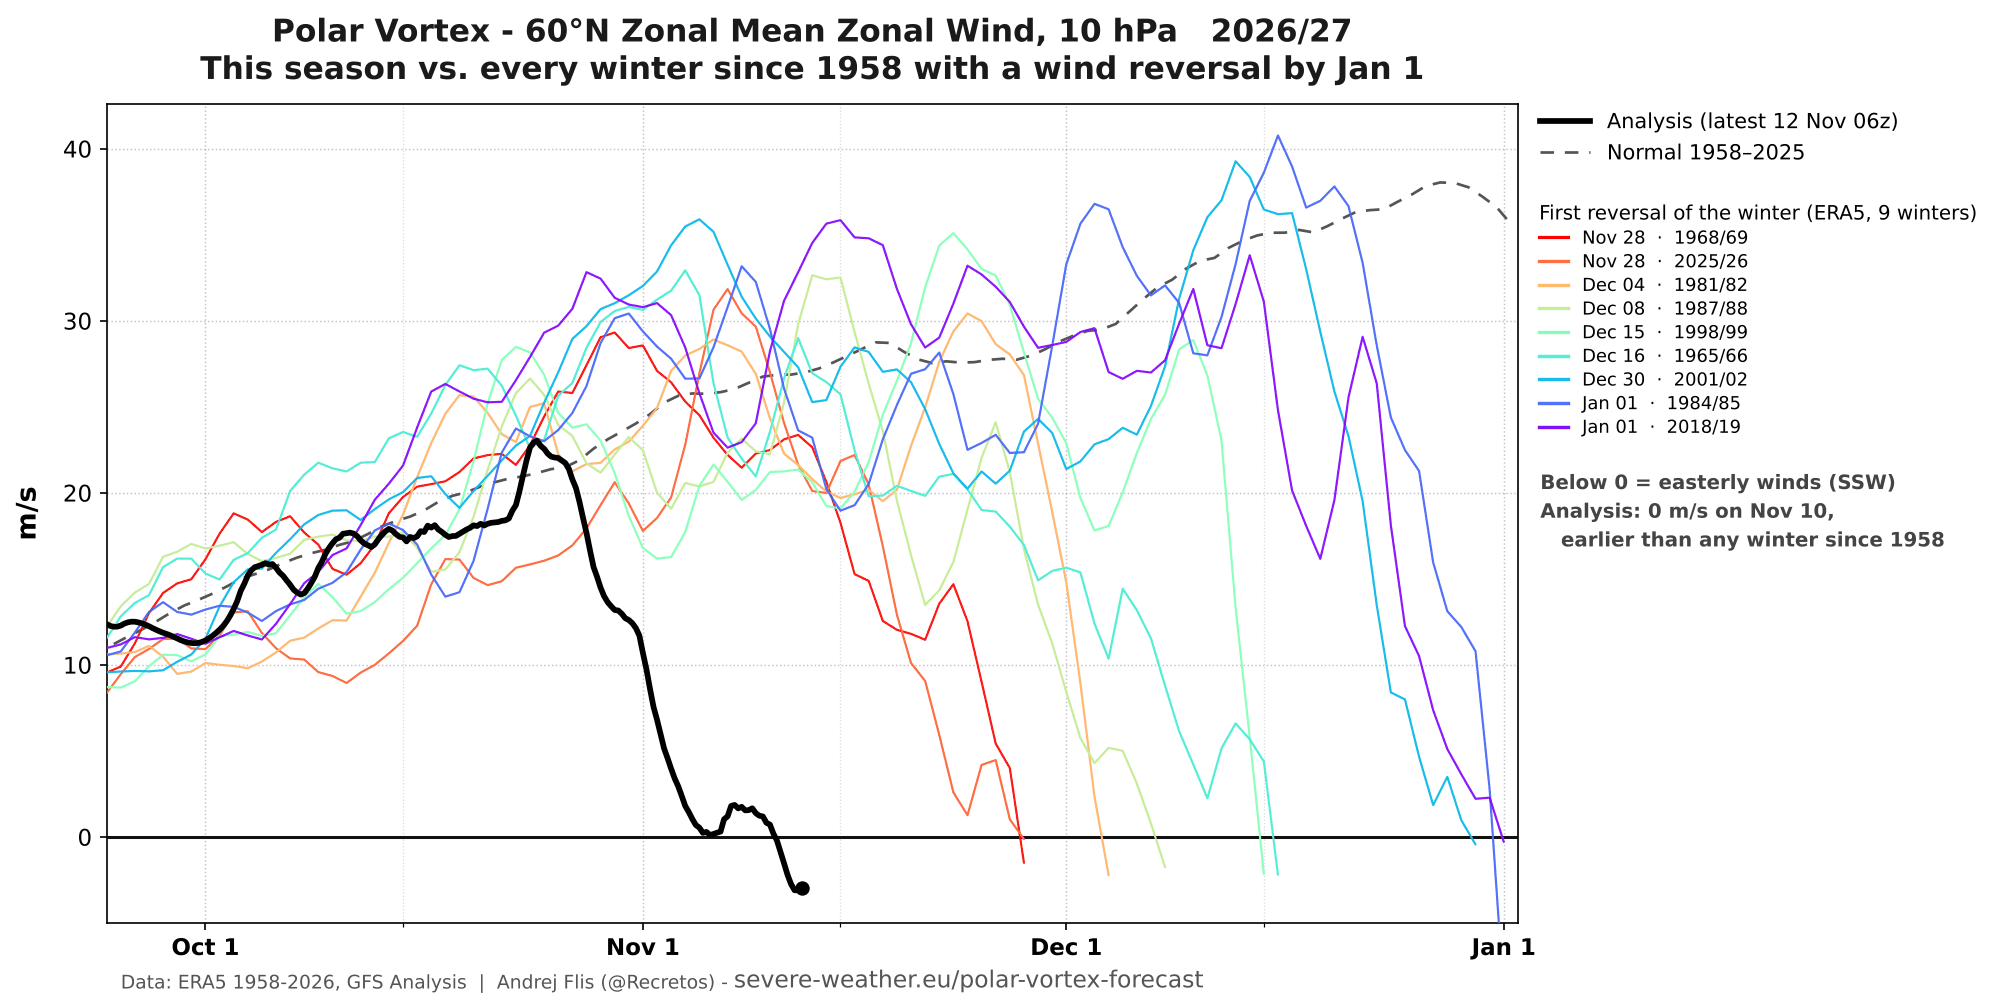
Overall, we are observing a proper disruption and slowdown of the stratospheric Polar Vortex, the earliest such event on record. This raises the main question: how will this impact our daily weather?
From the Stratosphere Down: Tracking the Impact Wave
A disruption of this magnitude reaches across a deeper layer of the stratosphere, also touching into the lower levels. But usually, we are looking at some delay of 1-3 weeks.
Based on climate simulation data, I created a plot showing the pressure anomaly progression for November SSW events in the same global setup as in 2026/2027 (El Niño and west QBO). You can see the calculated (or simulated) first lower-level contact is around day 15 after the wind reversal, and another one around day 30.
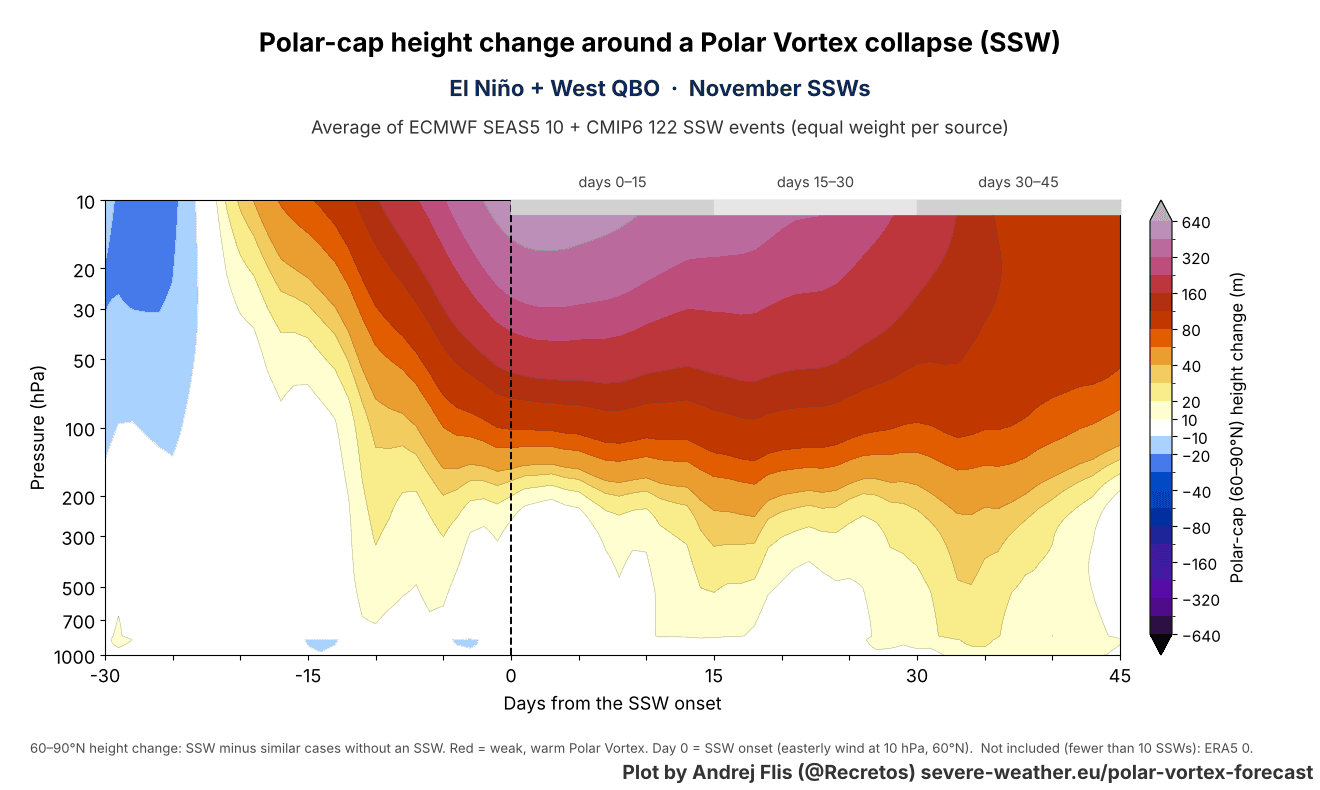
This shows a stratospheric pressure anomaly and Polar Vortex disruption reaching across different levels of the atmosphere over the polar regions (60-90N).
I produced a high-resolution 3D video below, which shows an ideal case of how a Stratospheric Warming event works. You can see the 3D Polar Vortex structure during a major Sudden Stratospheric Warming (SSW) event in mid-winter, and the typical weather result, bringing cold air to the central and eastern United States and parts of Europe.
Not every mid-winter SSW event works in this exact way, but this is a very simple demonstration of how the activity high above us can significantly impact our weather.
Now, if we look at the actual vertical pressure anomaly forecast, you can see the Stratospheric Warming anomaly currently in the stratosphere (10-100 hPa level). But more importantly, we can see the progression downwards, towards the end of the forecast period, connecting lower levels to the stratosphere, also called “coupling”.
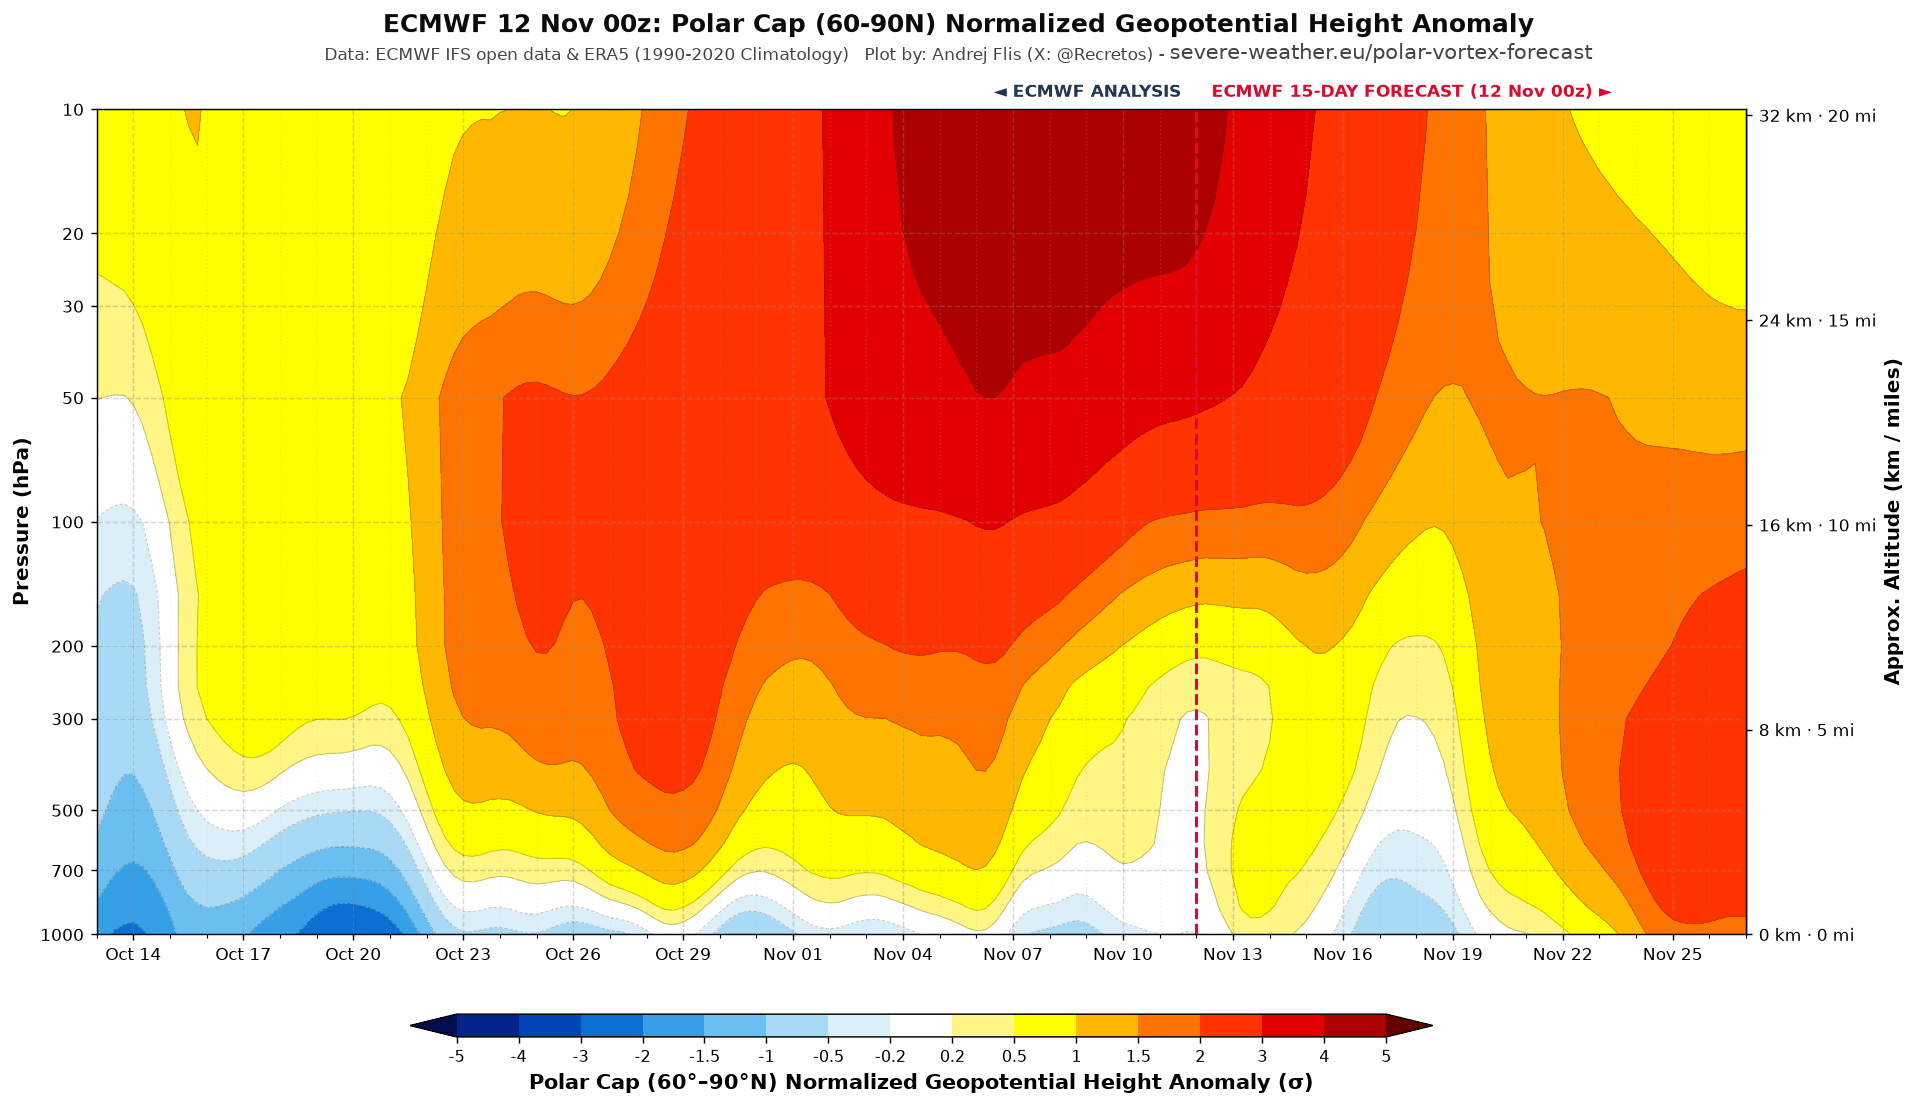
This does not mean that all the high-pressure anomalies in the lower levels are coming from the stratosphere. It shows that the SSW event was finally able to connect its pressure impact wave to the lower levels, almost exactly in the 15-day window, as the simulation above showed.
I also produced a special Polar Vortex coupling index, which tracks the downward connections from the stratosphere to the lower levels. Negative values mean a high-pressure connection (disrupted Polar Vortex), and positive values mean a stronger Polar Vortex, more likely to trap the cold air.
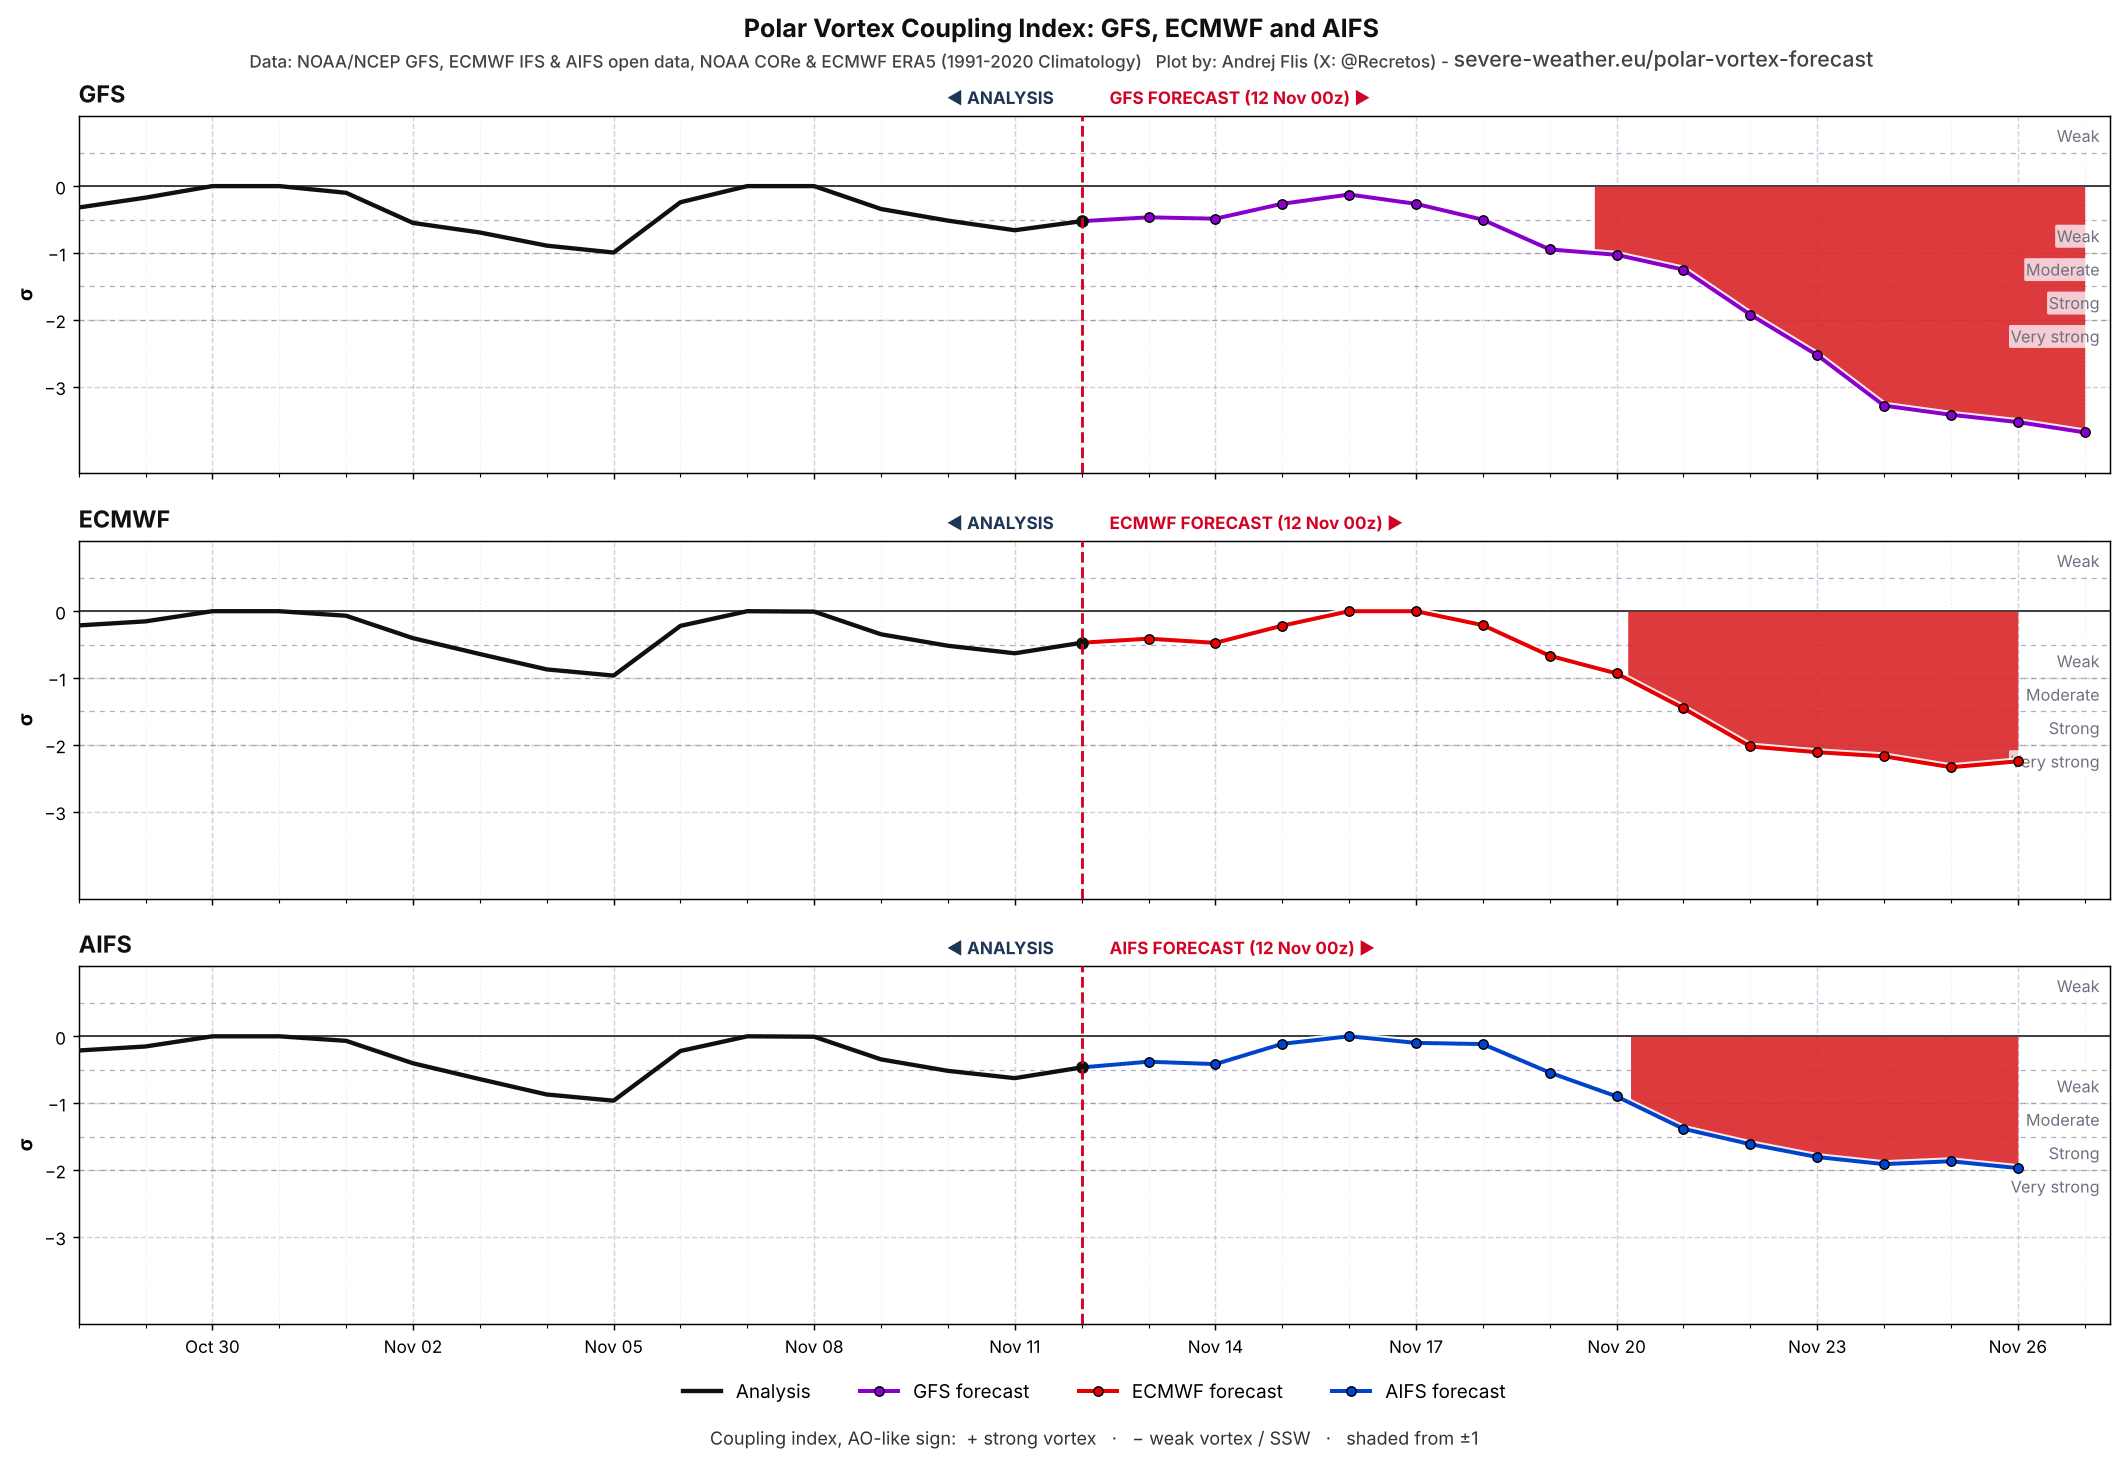
You can see that all three main forecast systems show a strong negative index, meaning they all see some type of high-pressure impact wave from the stratosphere.
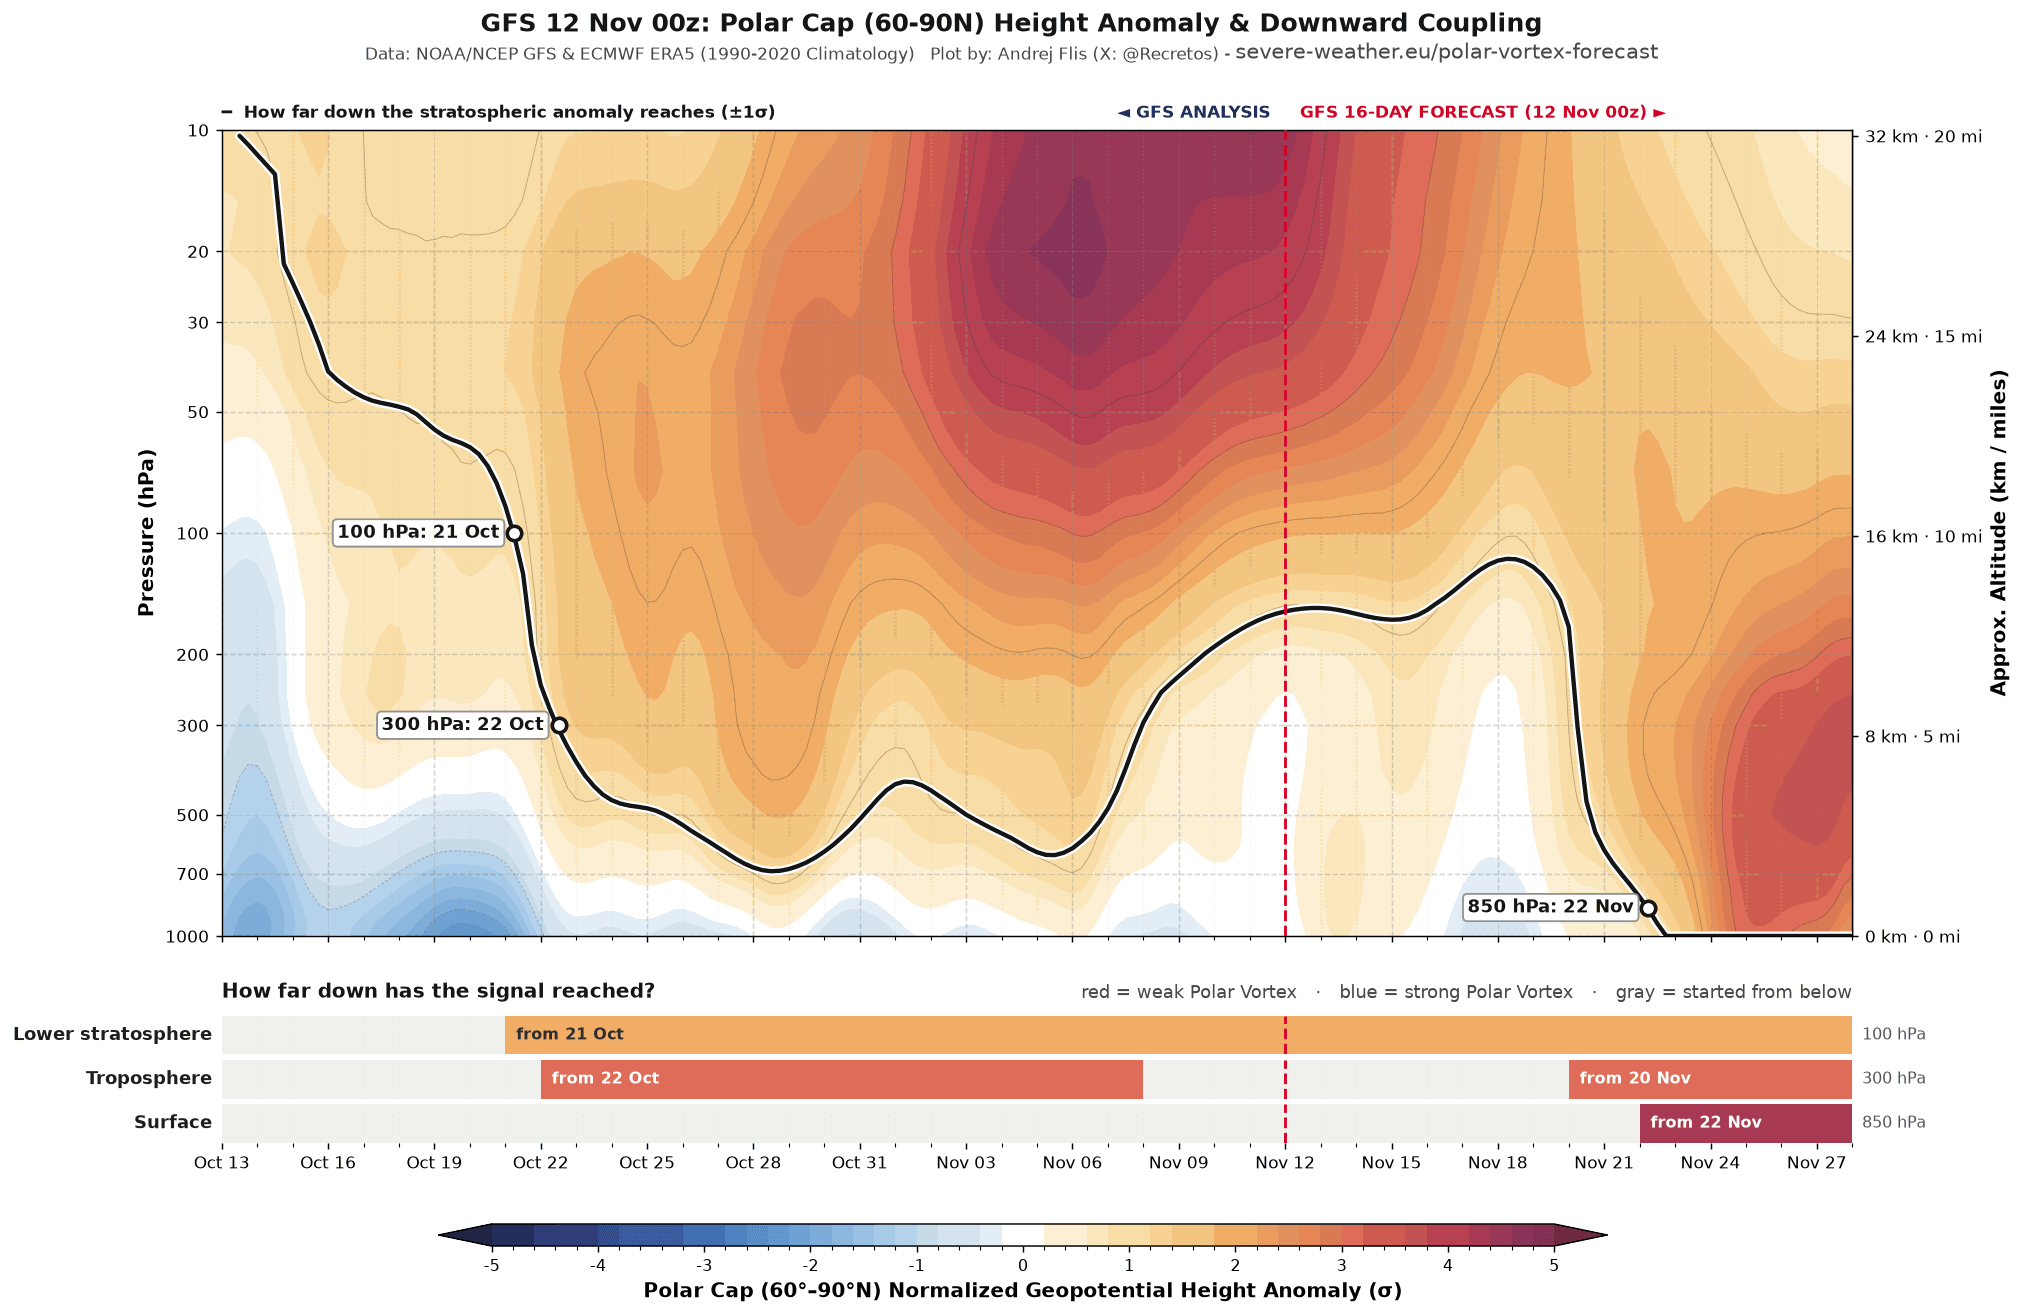
I also have a modified vertical plot that helps me track the pressure waves and coupling. And in the recent forecast, it shows a visible downward link, first reaching the surface around November 22nd.
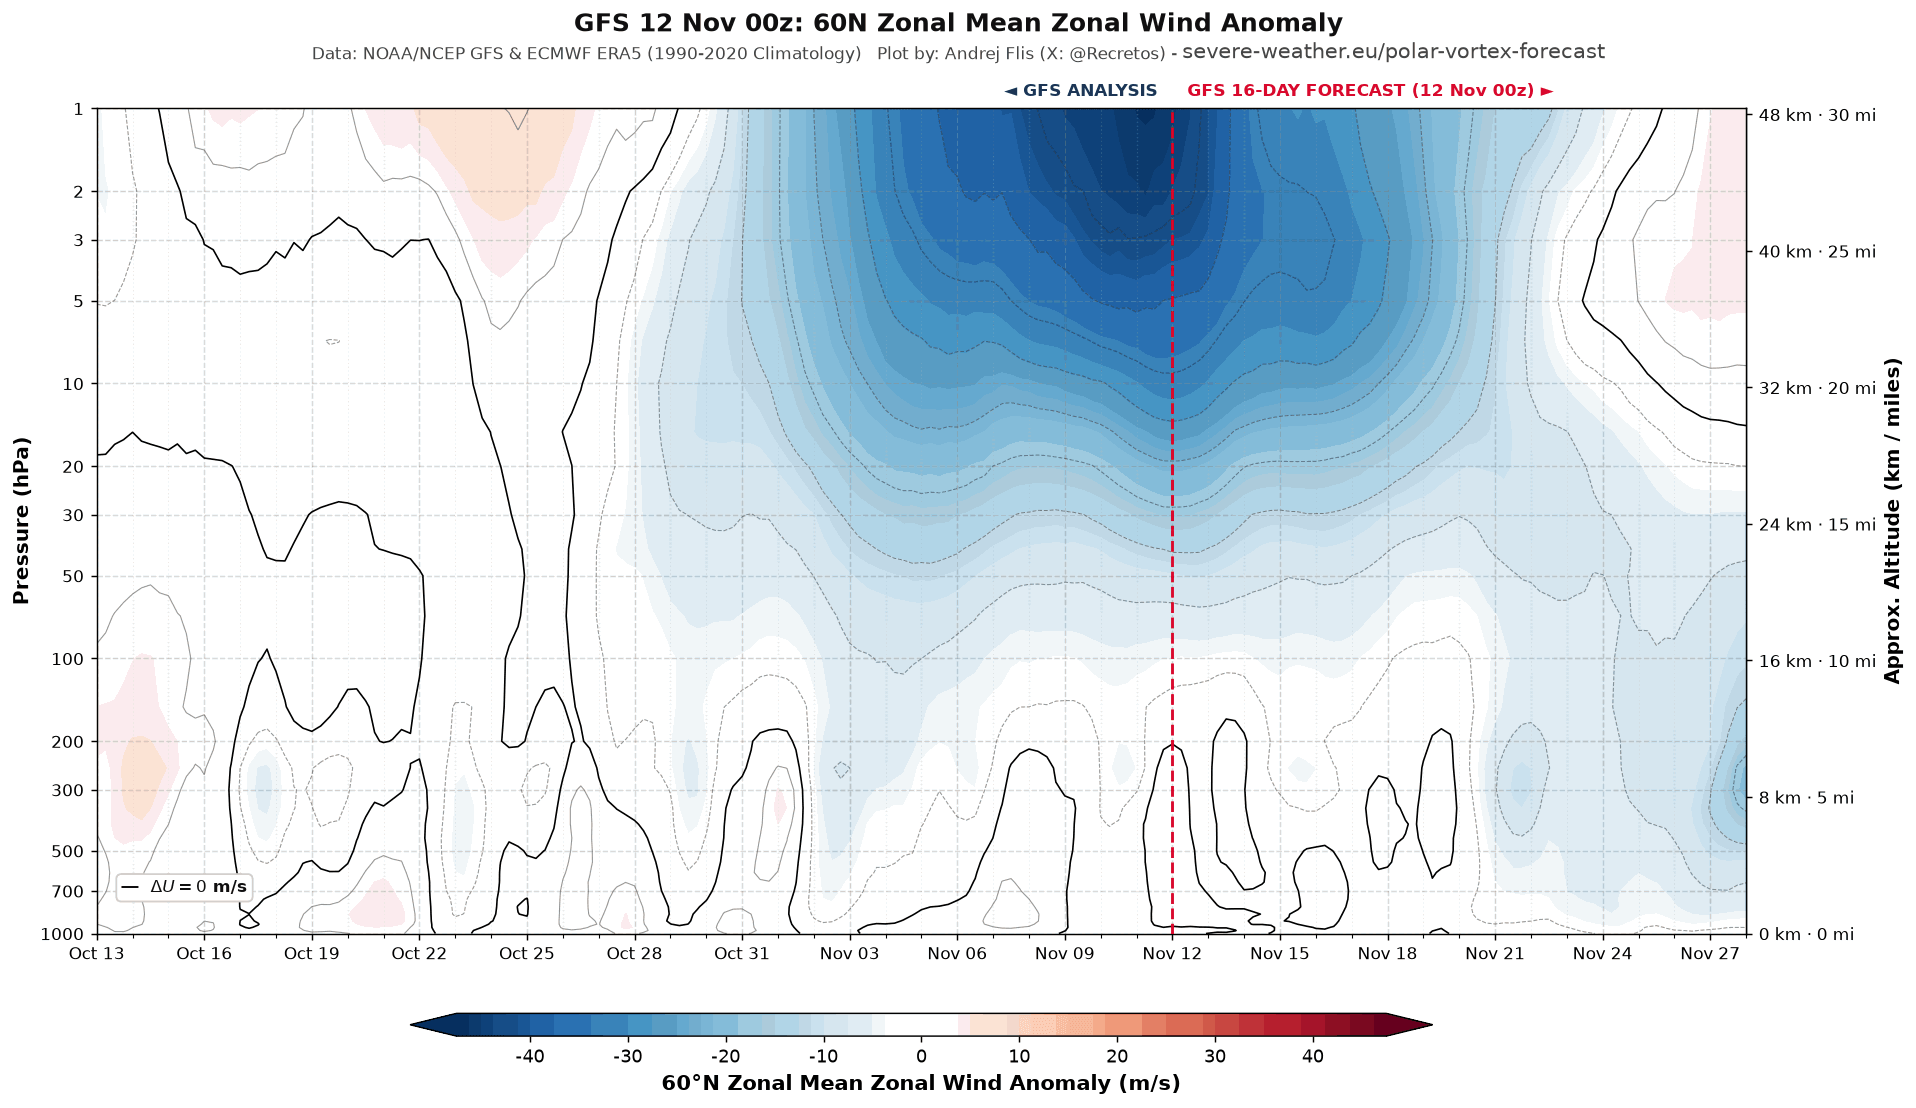
We can also look at the wind anomalies, not just pressure. And what this tells us is that there is a visible deceleration of the Polar Vortex circulation that also transfers downward. This is the first stage that we need if we want to destabilize the circulation and break down those walls that are trapping the cold air in the Arctic.
At this point, we are only tracking the 10-15 day range for potential stratospheric impact waves moving downward toward the lower levels, and the signal is getting clearer. But what does this “stratospheric impact wave” actually mean in terms of weather?
Weather Impacts for the United States, Canada, and Europe
With an ongoing Super El Niño in the Pacific, and various other global anomalies, there is no observed November SSW event in a similar global setup. For this reason, I searched thousands of simulated winters from global climate models to find such events and what happened in those cases to the weather below.
I decided to look at the 15-30 day window after the SSW event, which is the usual suggested impact period for this specific event type. Looking at the pressure anomalies first, we can see a low-pressure area over the east-central United States and over Europe. The main impact zone is high pressure over northern Canada and the Canadian Arctic, extending toward Greenland.
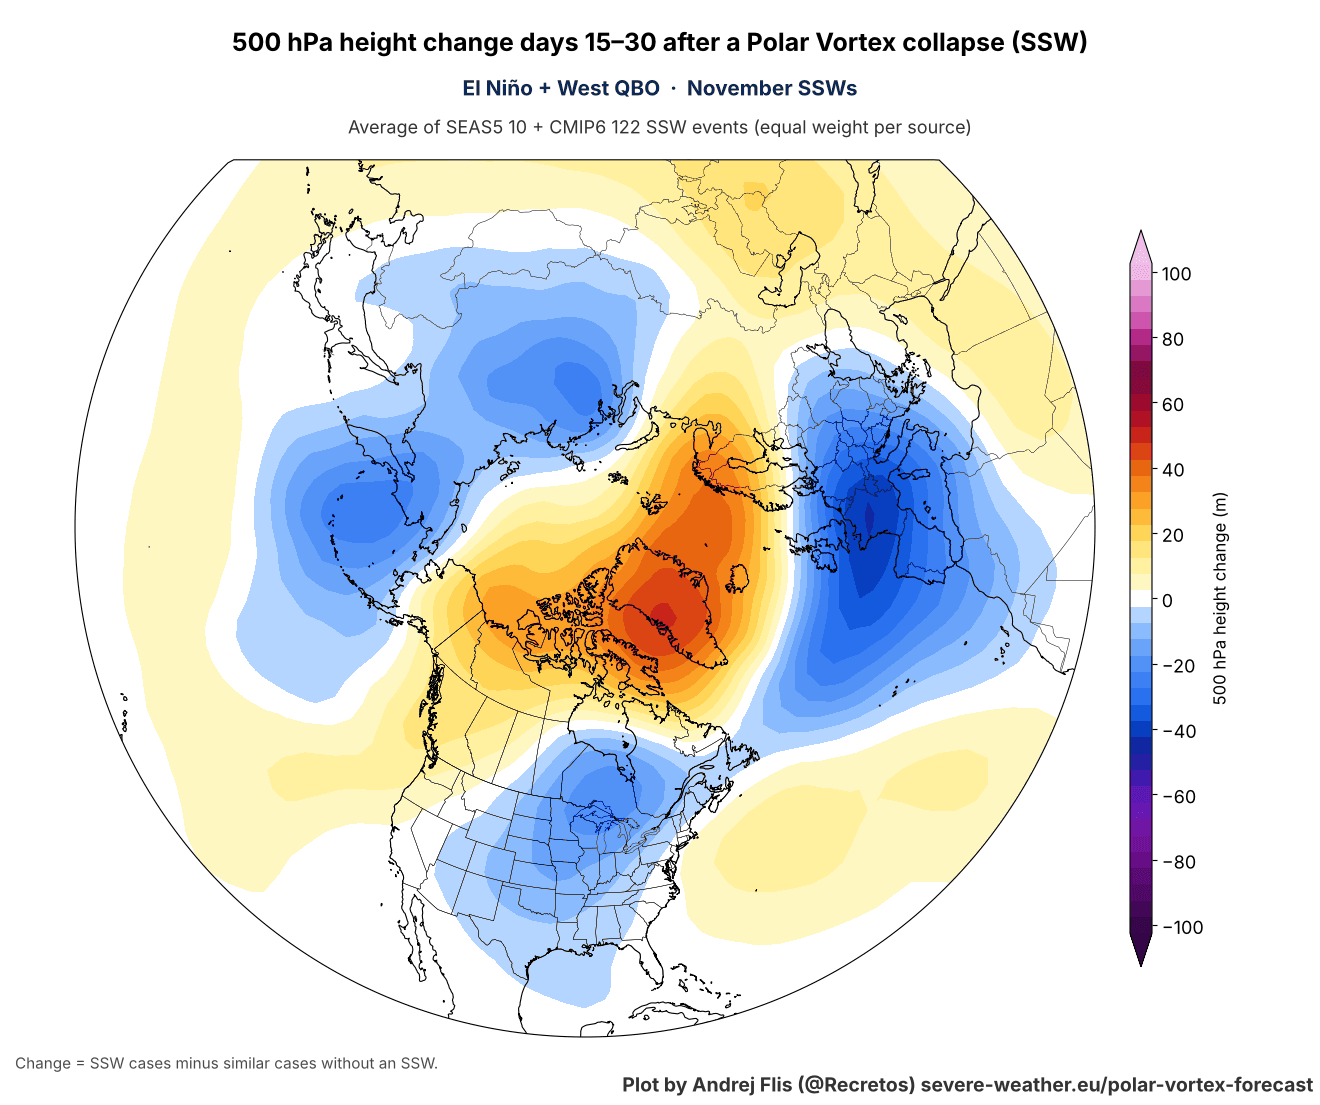
Keep in mind that this data shows the weather signal from the SSW event, or rather what it is trying to do to the weather patterns, compared to the same atmosphere with no SSW event.
This pressure placement creates a colder air corridor into the United States from Canada. As the data shows, the usual cold air spill is over southern Canada, into the northern and central United States, and then across the Midwest and into the eastern United States.
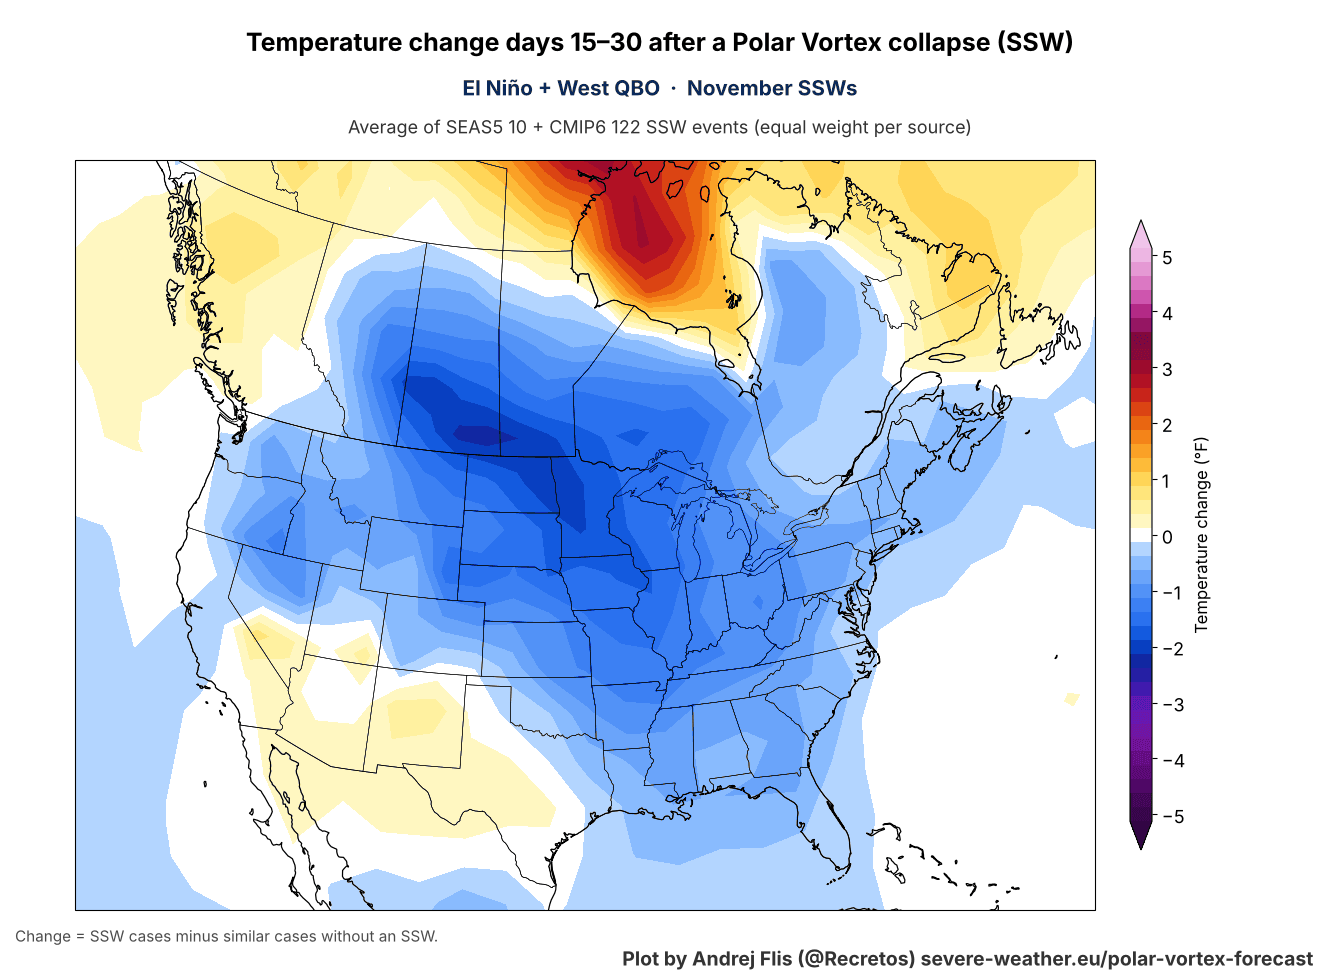
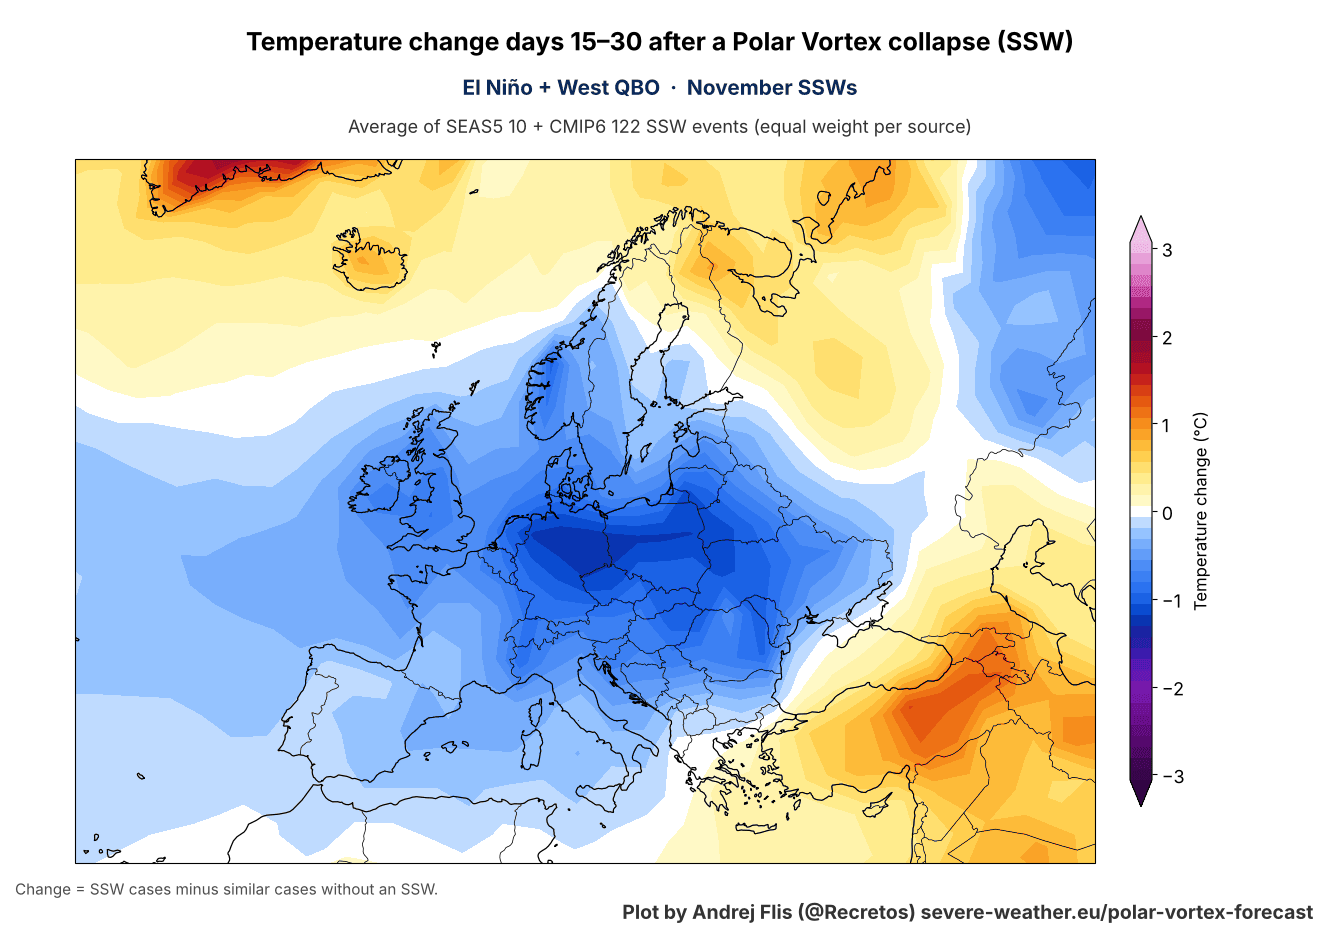
Over Europe, we can see the same response, with below-normal temperatures across much of the continent, except in the far southeast and northeast. This comes with a more northerly flow due to a pressure difference with a northern blocking high and a low-pressure area over Europe.
The snowfall signal is just for basic guidance, but it does follow the cold air. We can see increased snowfall tendency in the 15-30 day post-SSW window across the northern and northeastern U.S., the Midwest, and eastern Canada. Europe also shows increased snowfall over the central and southeastern parts, with less over the north.
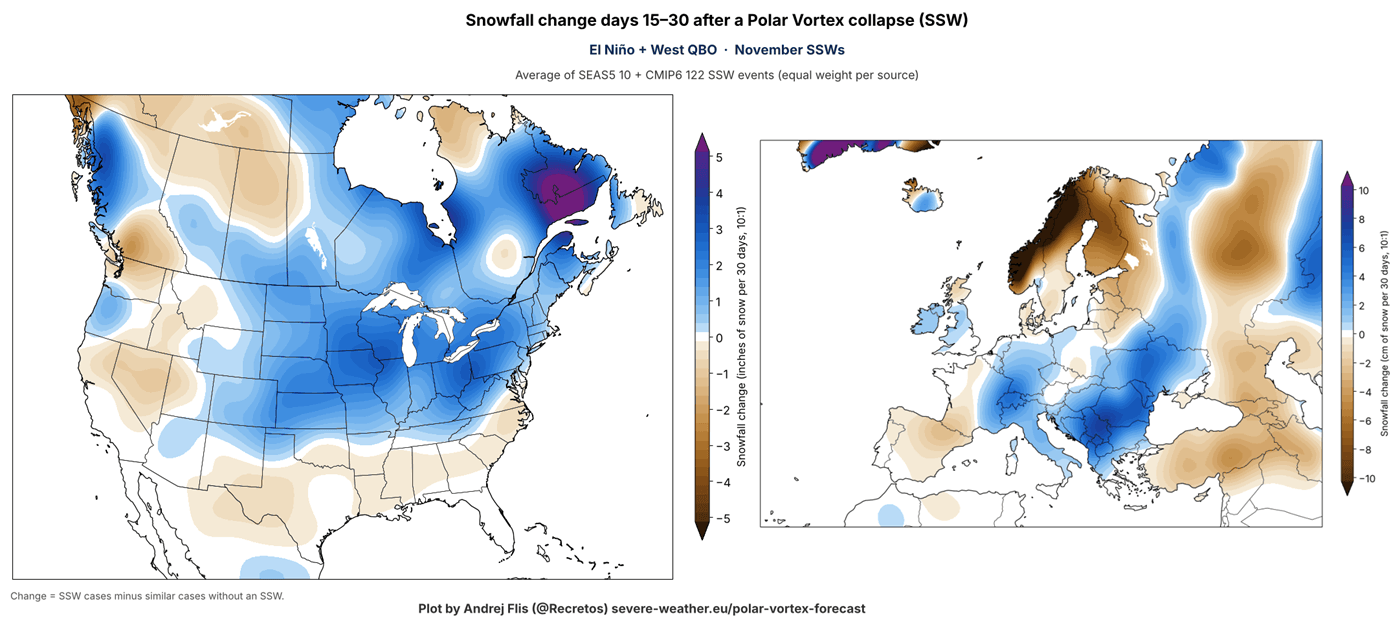
Again, these anomalies show what the SSW impact wave is trying to do with the atmosphere. The actual weather outcome still depends on the existing weather patterns and how strong the actual “coupling” is.
Thanksgiving Forecast Runs: How to Read the Cold Scenarios
As we get to actual forecast data, we hit the usual caveats for temperature or snowfall maps at the 10-15 day range. There is still instability at this range, especially with a potential stratospheric warming impact dropping down from above.
So for now, until this comes into a closer range, we use these forecasts only as examples of potential scenarios that could happen. These forecasts provide valuable data on various kinds of scenarios that can evolve from the stratospheric impacts.
All the examples below are single forecast runs for November 25-27, around Thanksgiving, which is days 15-17 after the wind reversal. I show them to explain what to look for, not as a forecast for the holiday. The pressure anomaly in the AIFS run is actually similar to the simulated pattern I showed above.
You can see a high-pressure zone rising over Alaska and into the Polar regions, and a ridge rising towards Greenland. At the same time, this brings a low-pressure response over the United States and across Europe.
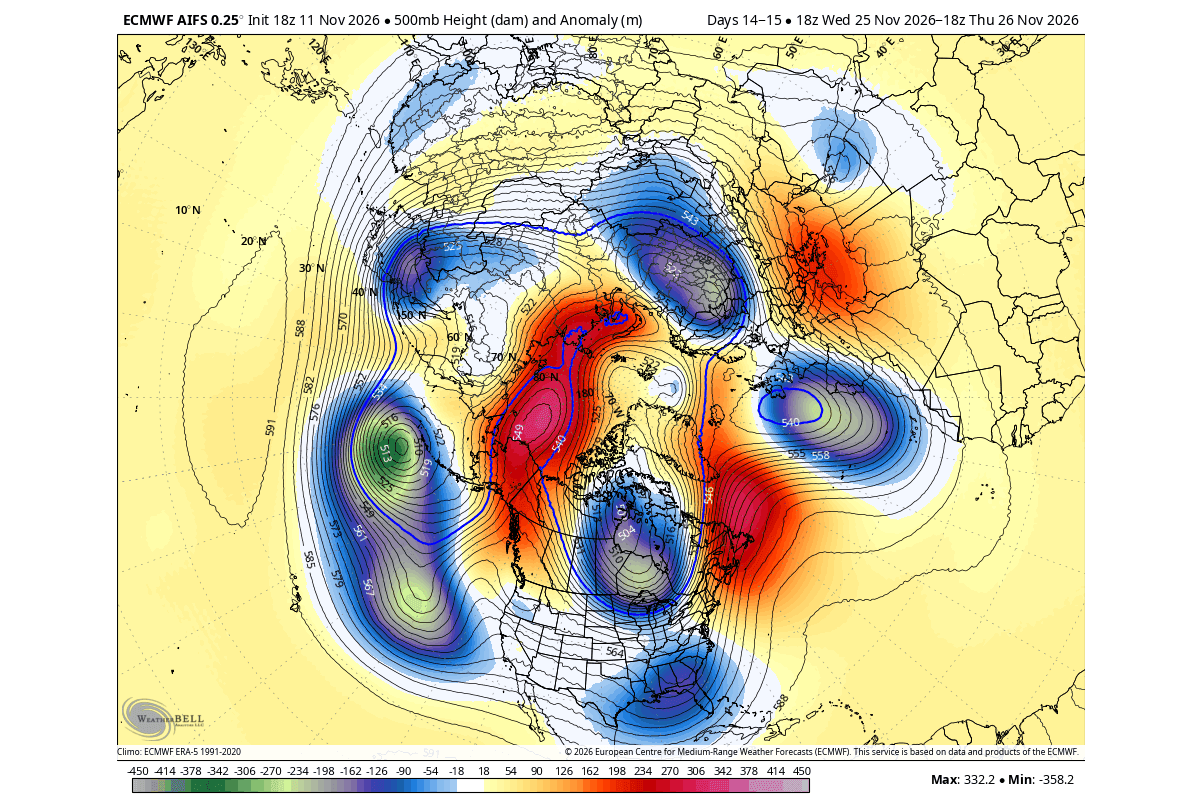
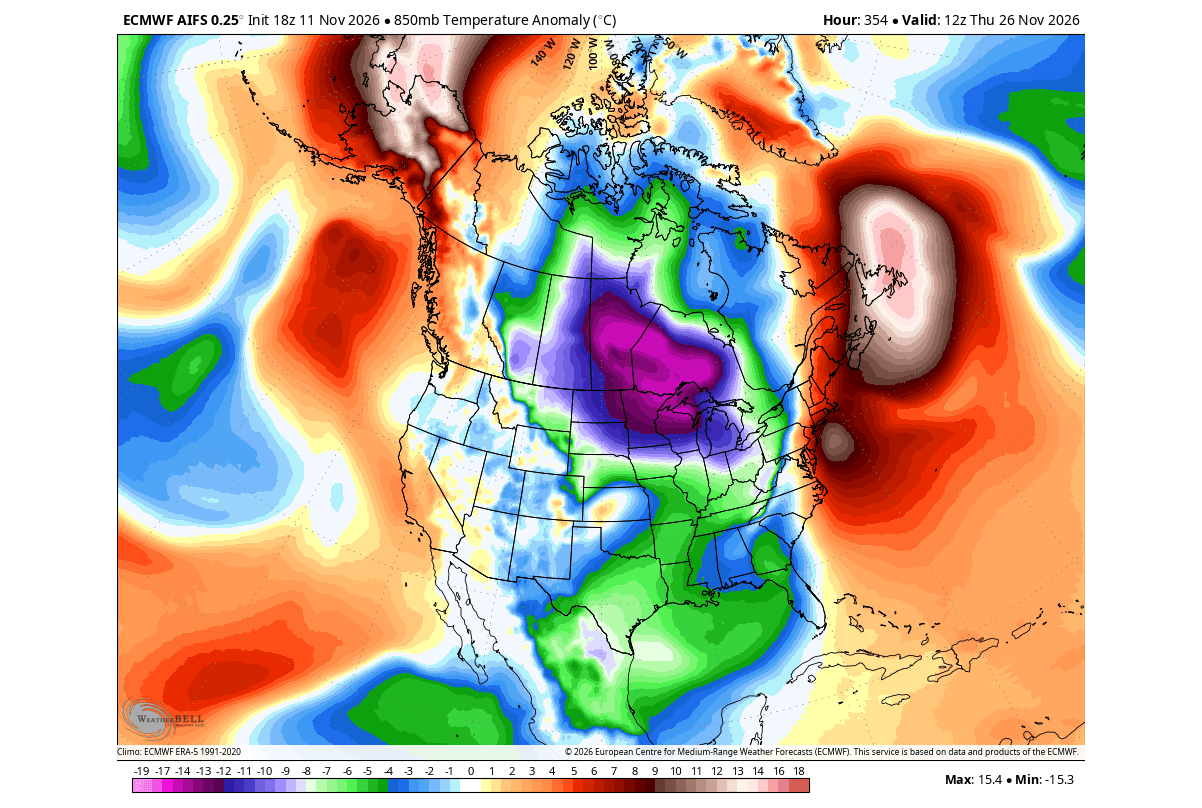
Now, this is not the very latest forecast, and it doesn’t need to be in this range. We are looking at various forecasts and what their solutions and scenarios are. Some are cold, some are warm, but we are in the stage of observing, trying to see which scenario the SSW favors.
The temperature anomalies from such a pattern are, as expected, colder over the northern and eastern half of the United States and southern Canada. This run was a great example of the same response we saw above in the simulated examples.
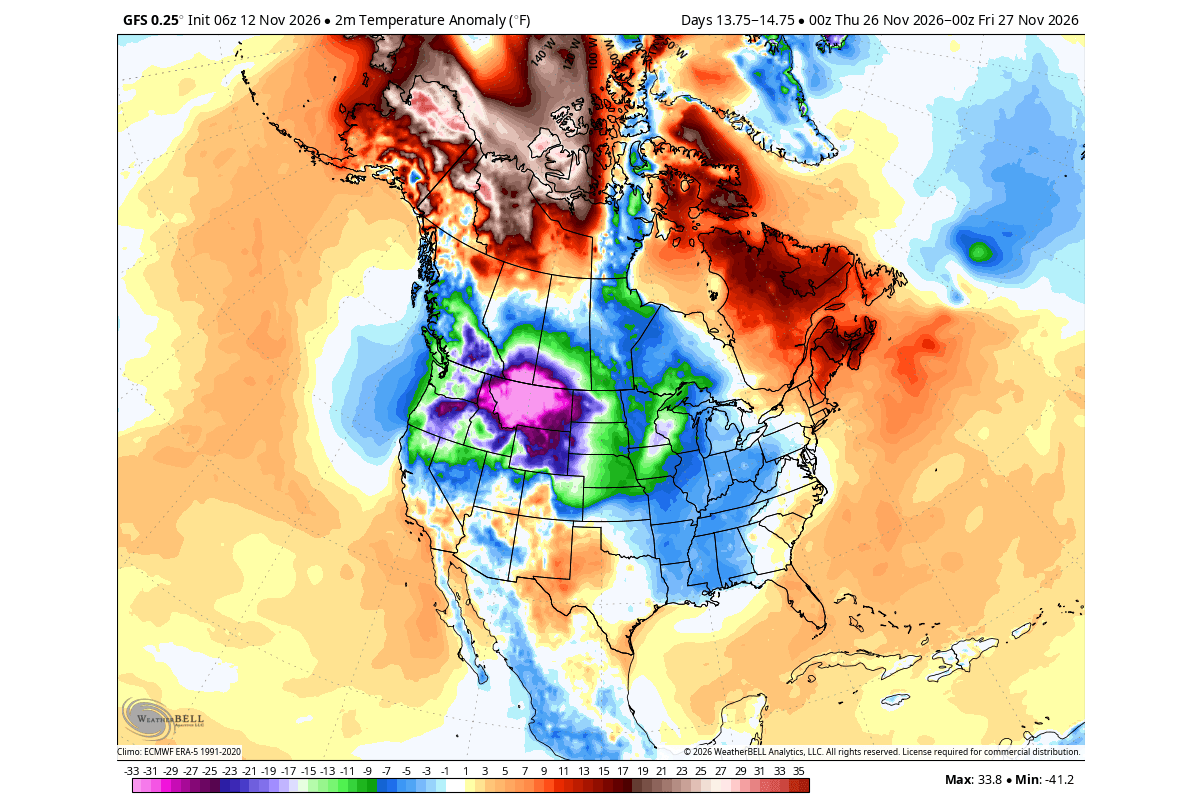
Another cold airmass scenario was seen in the GFS model. It is not directly usable as a forecast at this range, but it provides a great insight into the physics behind the SSW impacts, and reveals possible pathways for spreading cold air into the northern United States and the Midwest.
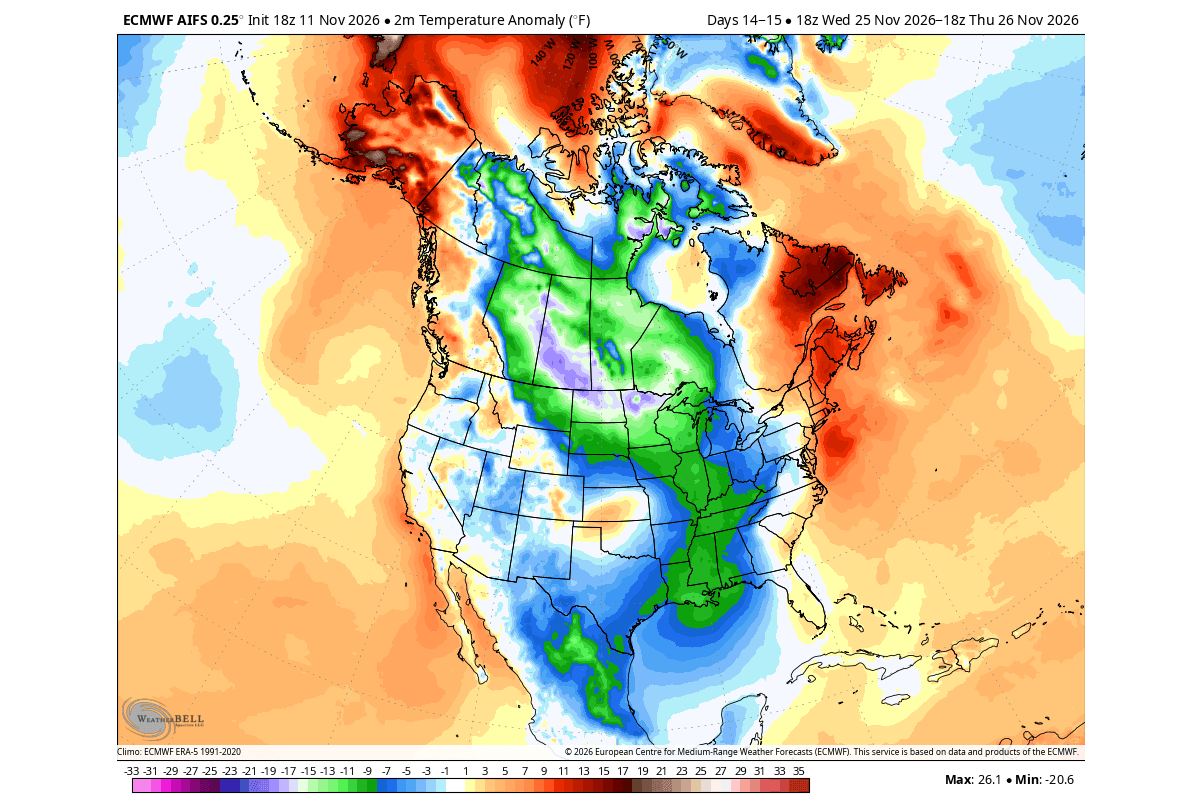
Below is the same AIFS run again, this time for the surface level. It is a “textbook example” of what we would usually expect from such an SSW event in November: a cold air corridor from Canada down into the United States.
Europe is showing slightly different signals, with no forecast really showing a significant temperature drop, which is normal, since we first need a good cold air source. But some scenarios did look like the simulated SSW response, with below-normal temperatures across the western and central parts.
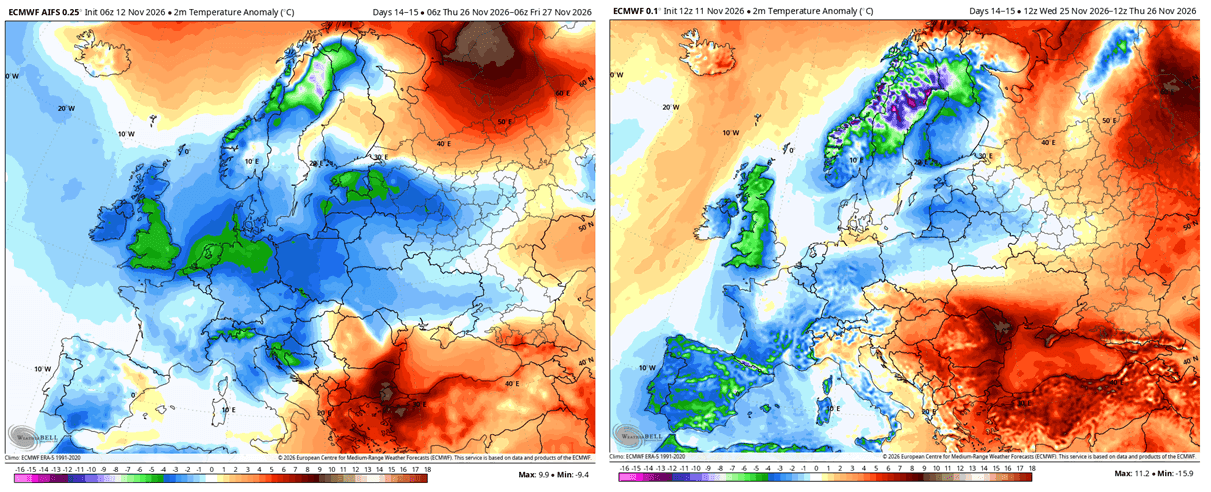
Here we also have to consider the impact of one of the strongest Super El Niño events in the tropical Pacific, which will play a role in the final result. For now, we monitor its development and medium-range trends.
Overall, we are in for a period of uncertainty, where a 10-15 day forecast can shift from cold to warm from one run to the next. But for now, we need forecast consistency, so we are not yet at a point where the outcome is certain, not even close. I will do more updates as the trend starts to settle.
All our custom Polar Vortex graphics can be found live on the Polar Vortex Forecast hub page.
Scientific Studies Used in this Article
- Polar Vortex and North American Cold Outbreaks: Cold-Air Outbreaks in the Continental US: Connections with Stratospheric Variations – Agel et al. (2025).
- Polar Vortex Displacement and Splitting: The Influence of Stratospheric Vortex Displacements and Splits on Surface Climate – Mitchell et al. (2013).
Most charts and analyses in this article are my own, based on ECMWF, ERA5 reanalysis, NOAA/NCEP GFS and CORe data, and CMIP6 climate model data. Some forecast images are from WeatherBell (used under a commercial license).
Don’t miss: New Winter 2026/2027 Forecast: A Snowier Shift and a Mid-Winter Polar Vortex Signal
We will keep you updated on the global weather pattern development, so bookmark our page. Also, if you have seen this article in the Google App (Discover) feed, click the like (♥) or the star button there to see more of our forecasts and our latest articles on weather and nature in general.