The Polar Vortex is heading toward a record early disruption. The latest forecasts show stratospheric winds collapsing toward a full reversal in early November, splitting the Polar Vortex into two separate cores. If the reversal happens, it will be the earliest Sudden Stratospheric Warming on record, by at least three weeks.
An event this early is uncharted territory. With a Super El Niño already shaping the weather pattern, the impacts are harder to track than in mid-winter. But forecasts already show the first indirect links to the split cores, with cooler trends developing over parts of Europe and the eastern United States in coming weeks.
In this article, I look at the developing Polar Vortex split and the Stratospheric Warming, how deep it reaches through the atmosphere, and what it could mean for the weather in the mid-range. I also look at why the long-range data points to an even stronger disruption in mid-winter 2026/2027.
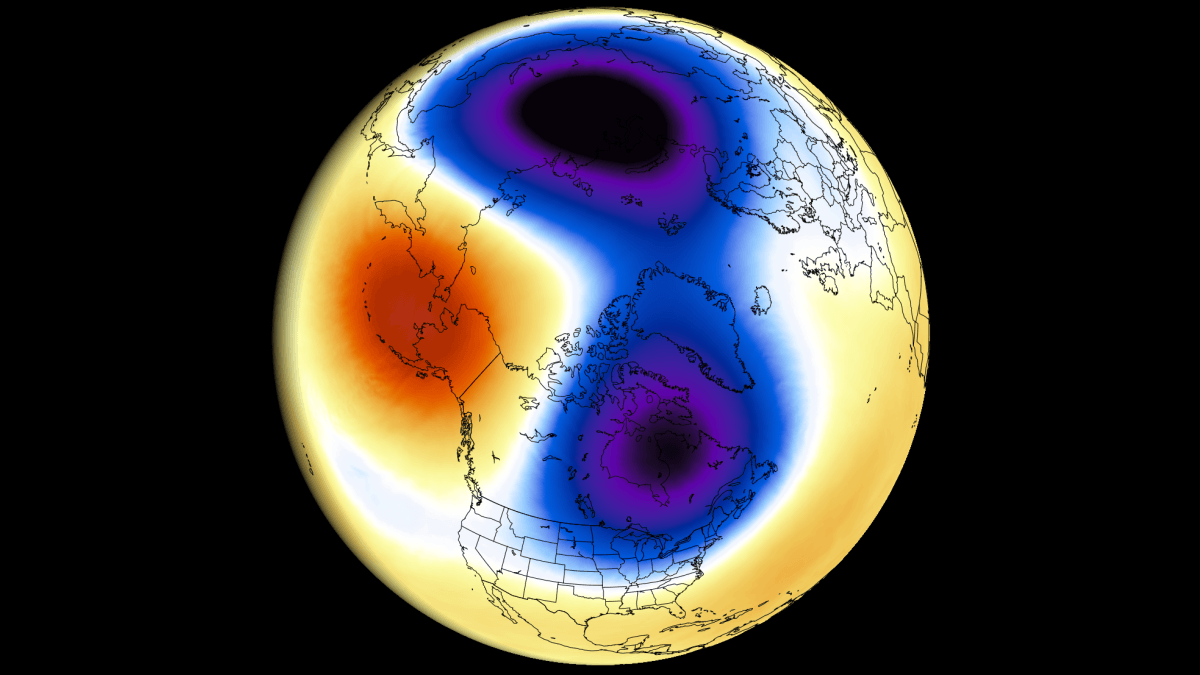
Polar Vortex: The High-Altitude Winter Engine
The Polar Vortex is a broad winter circulation over the northern (and southern) hemispheres. You can imagine the Polar Vortex as a spinning wall over the polar regions, rising from the surface into the stratosphere (over 50 km/31 miles high), trapping the cold polar air inside.
The Polar Vortex is divided into two layers: the stratosphere (at higher altitudes) and the troposphere (at lower altitudes). These two layers are connected but can often behave differently. A strong, stable Polar Vortex acts like a barrier, locking the coldest air into the North Pole, creating milder conditions for the United States and Europe. Image: NOAA
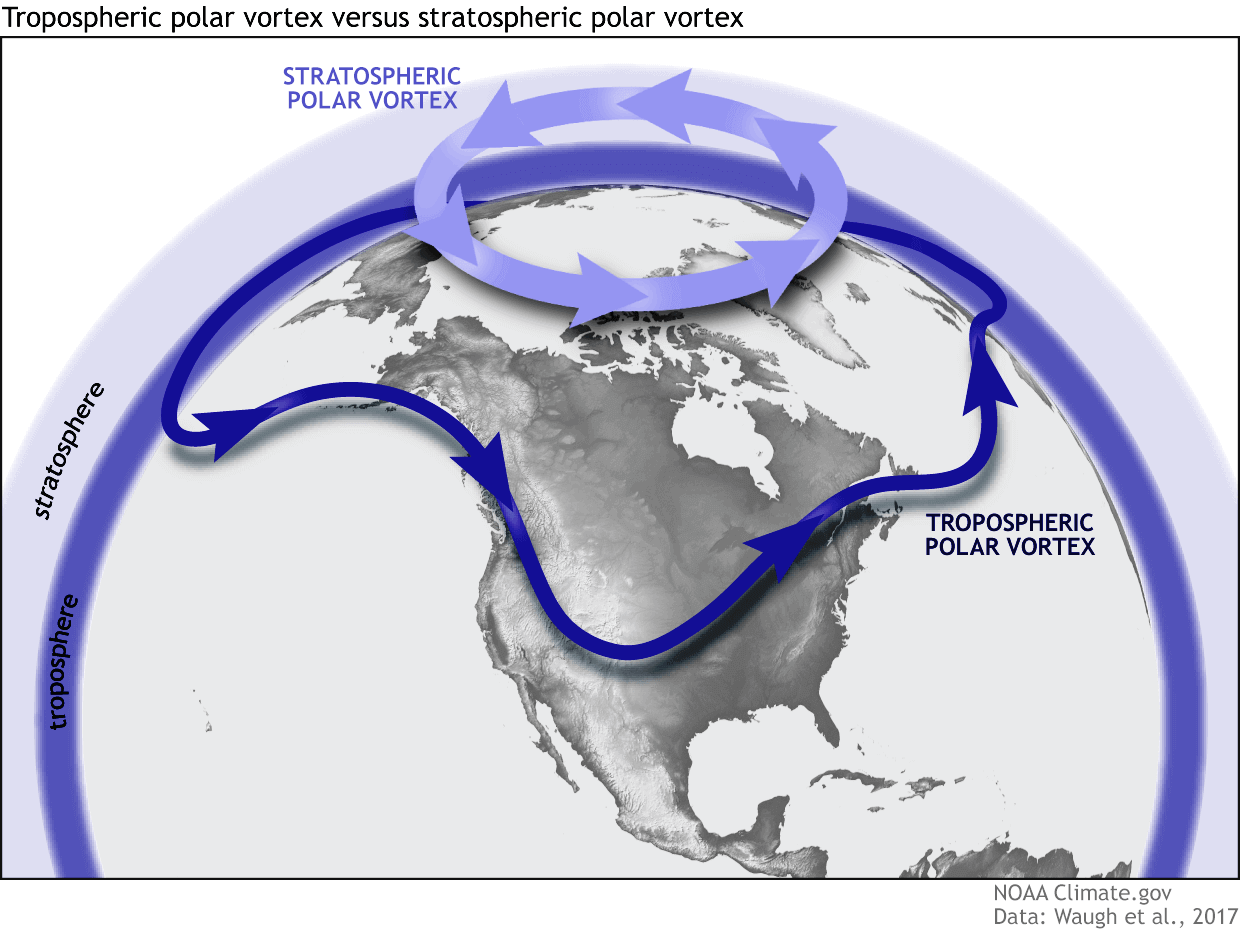
When the Polar Vortex is disrupted or “collapses,” this polar barrier breaks, allowing cold Arctic air to spill southward into the mid-latitudes. But this early in the season, the Polar Vortex is still building up for winter, so a disruption now behaves differently than in mid-winter. Below is an example from NOAA of how a disrupted Polar Vortex releases cold polar air into the United States or Europe in winter.
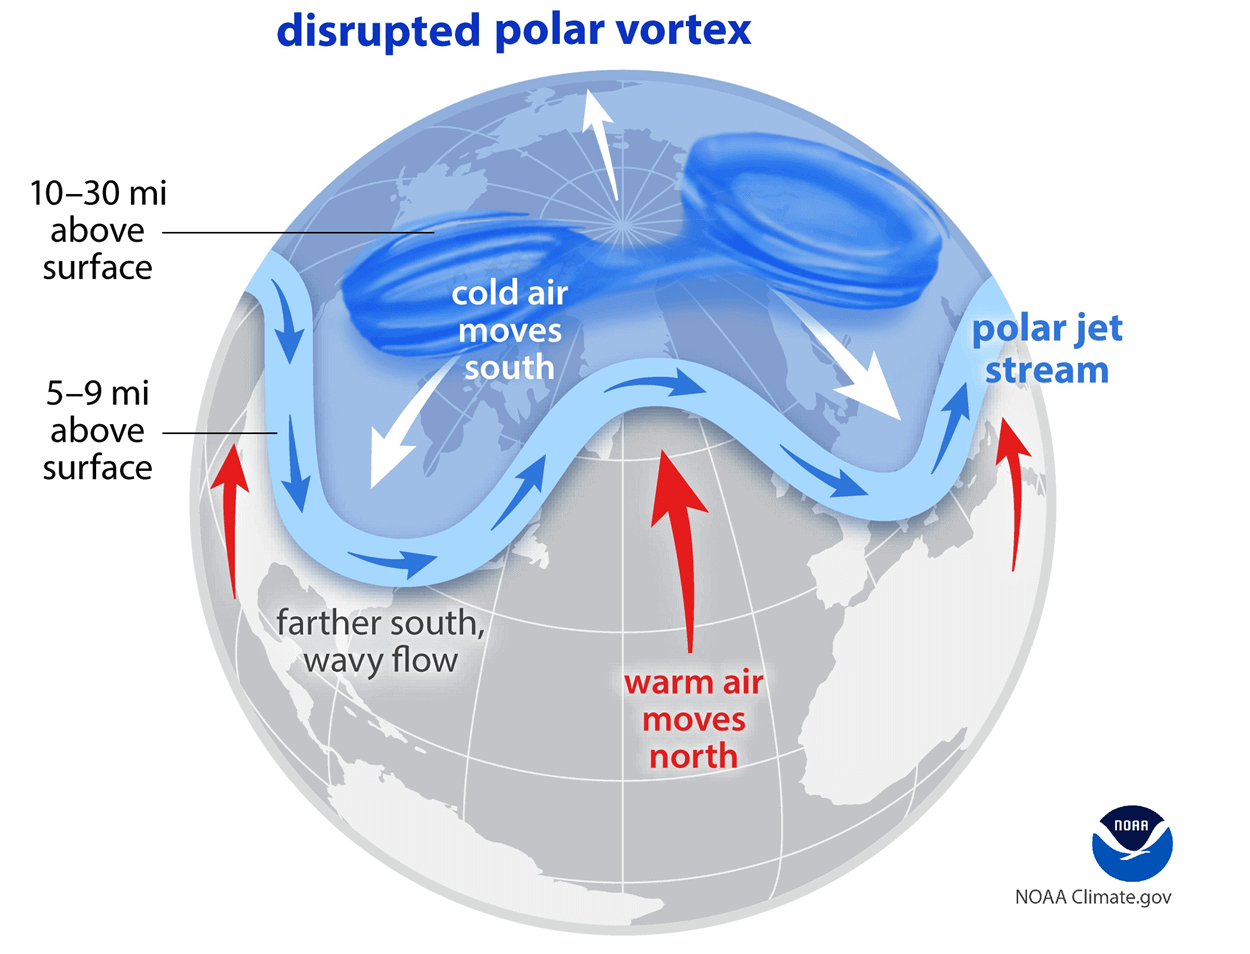
If you like cold winter weather across the United States, Canada, or Europe, this weak/disrupted Polar Vortex is exactly what you want to see in winter. But a disrupted Polar Vortex does not guarantee cold in every single area of the mid-latitudes, especially well ahead of the season as we see now with the upcoming early November event.
The disruption usually arises from a rise in stratospheric pressure and temperature, known as a Sudden Stratospheric Warming (SSW) event, or from other dynamics that can originate from the lower levels.
The current Polar Vortex disruption is aiming for a major category, as forecasts show it could produce a proper wind reversal and a split of the Polar Vortex core in the stratosphere.
Polar Vortex Split: A Record Event for This Time of Year
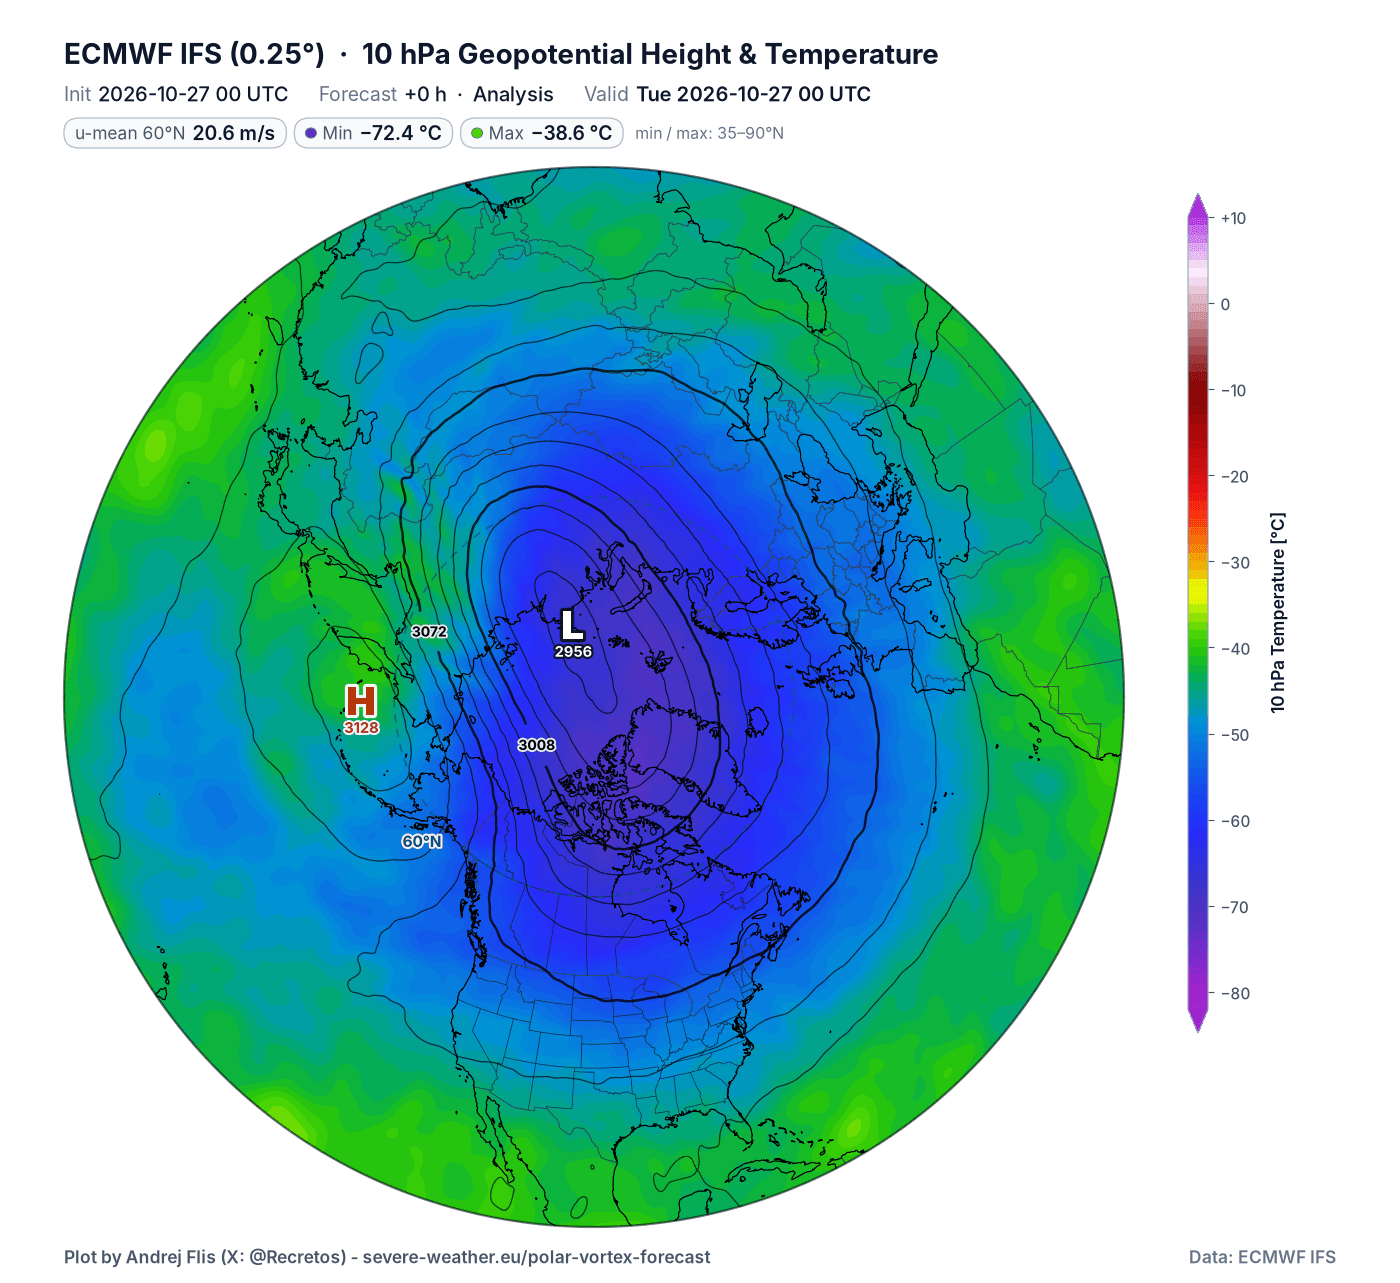
Below is the latest analysis for the mid-stratosphere at the 10mb level (30 km/19 miles). The Polar Vortex is currently visible as a single large circular area, with its low-pressure center and a clear cold core. We currently see only the first sign of a stratospheric high-pressure area building over the North Pacific.
The most common way we monitor the Polar Vortex is by looking at wind speeds around the polar circle. A strong positive (westerly) wind indicates stable conditions or a strong Polar Vortex, but weak or even negative (easterly) winds indicate a complete reversal and a breakdown of the Polar Vortex.
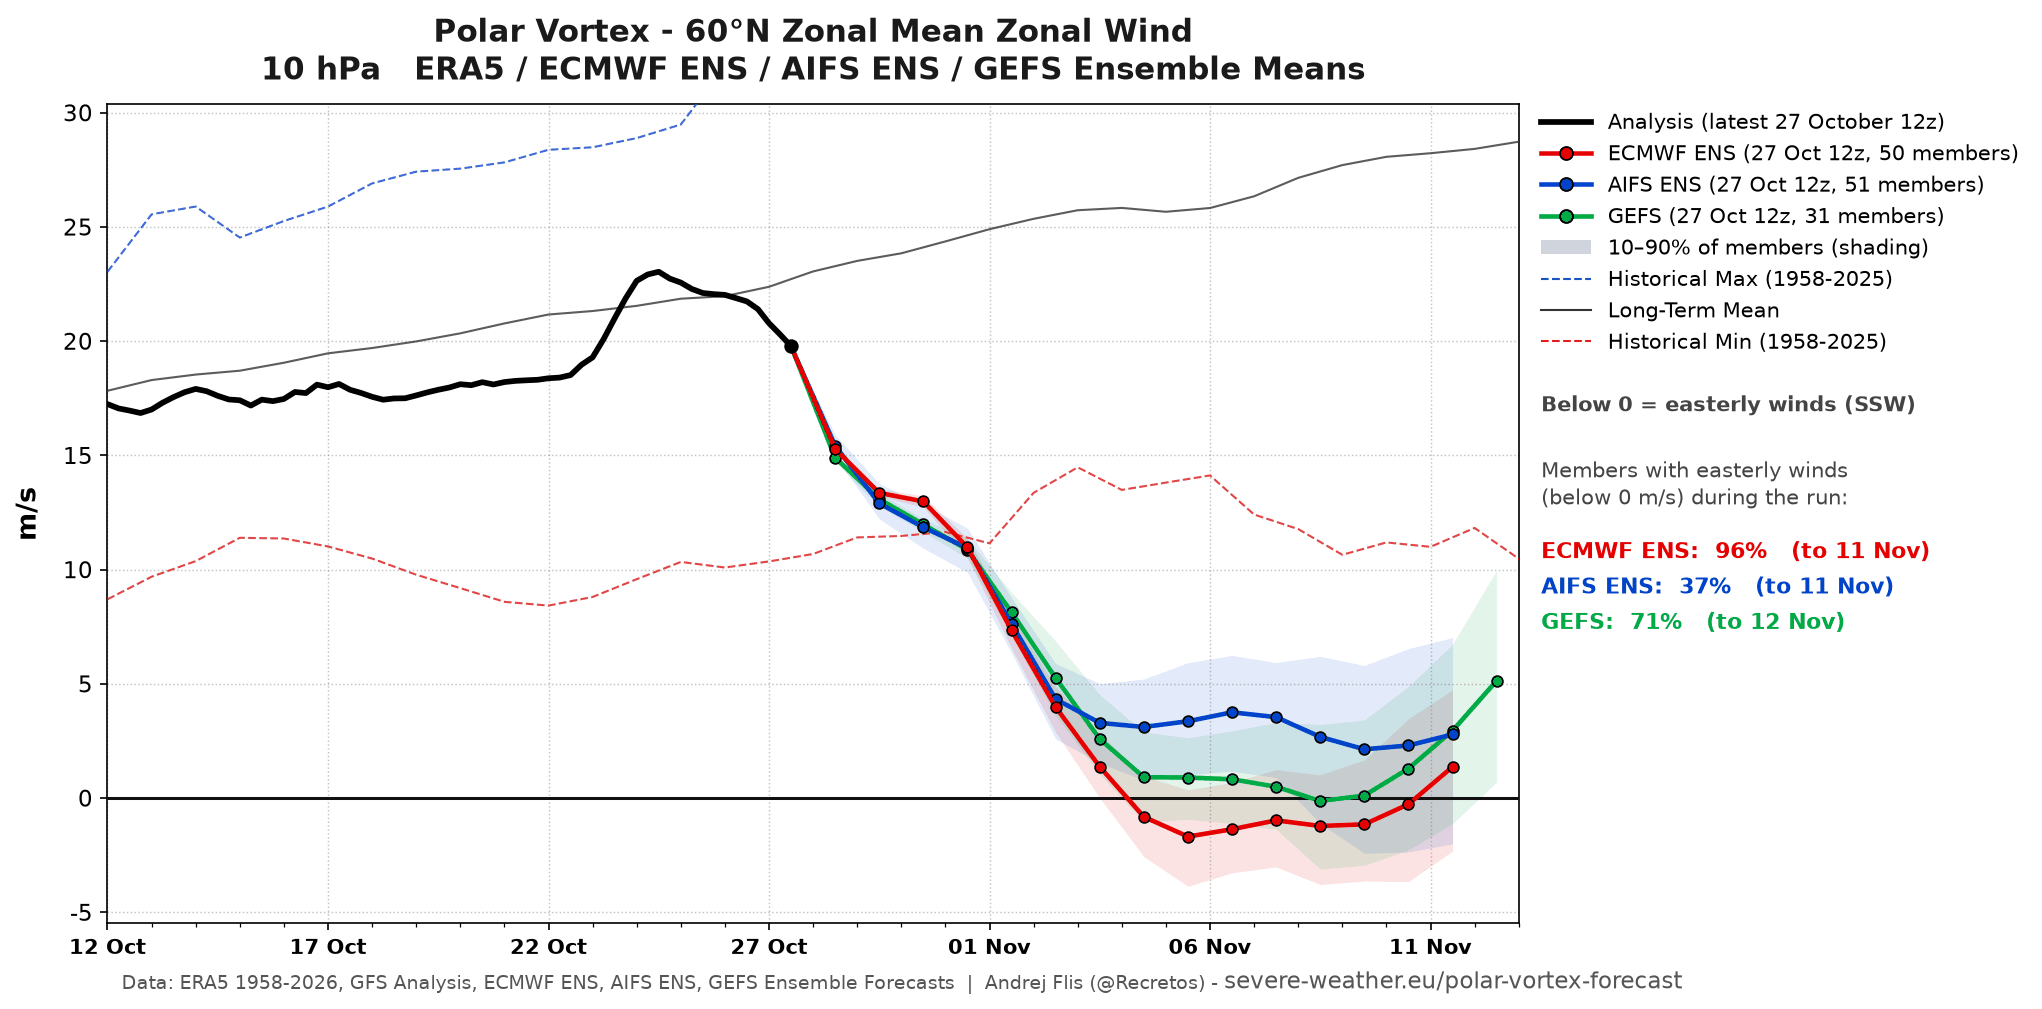
Below is the latest analysis and forecast of the mid-stratospheric winds around the Polar Vortex. It shows the various model data. We can see the two main models, ECMWF and GFS, show a reversal or a near reversal. The GEFS extended range model is also nearing a reversal, but also showing a rapid recovery period after.
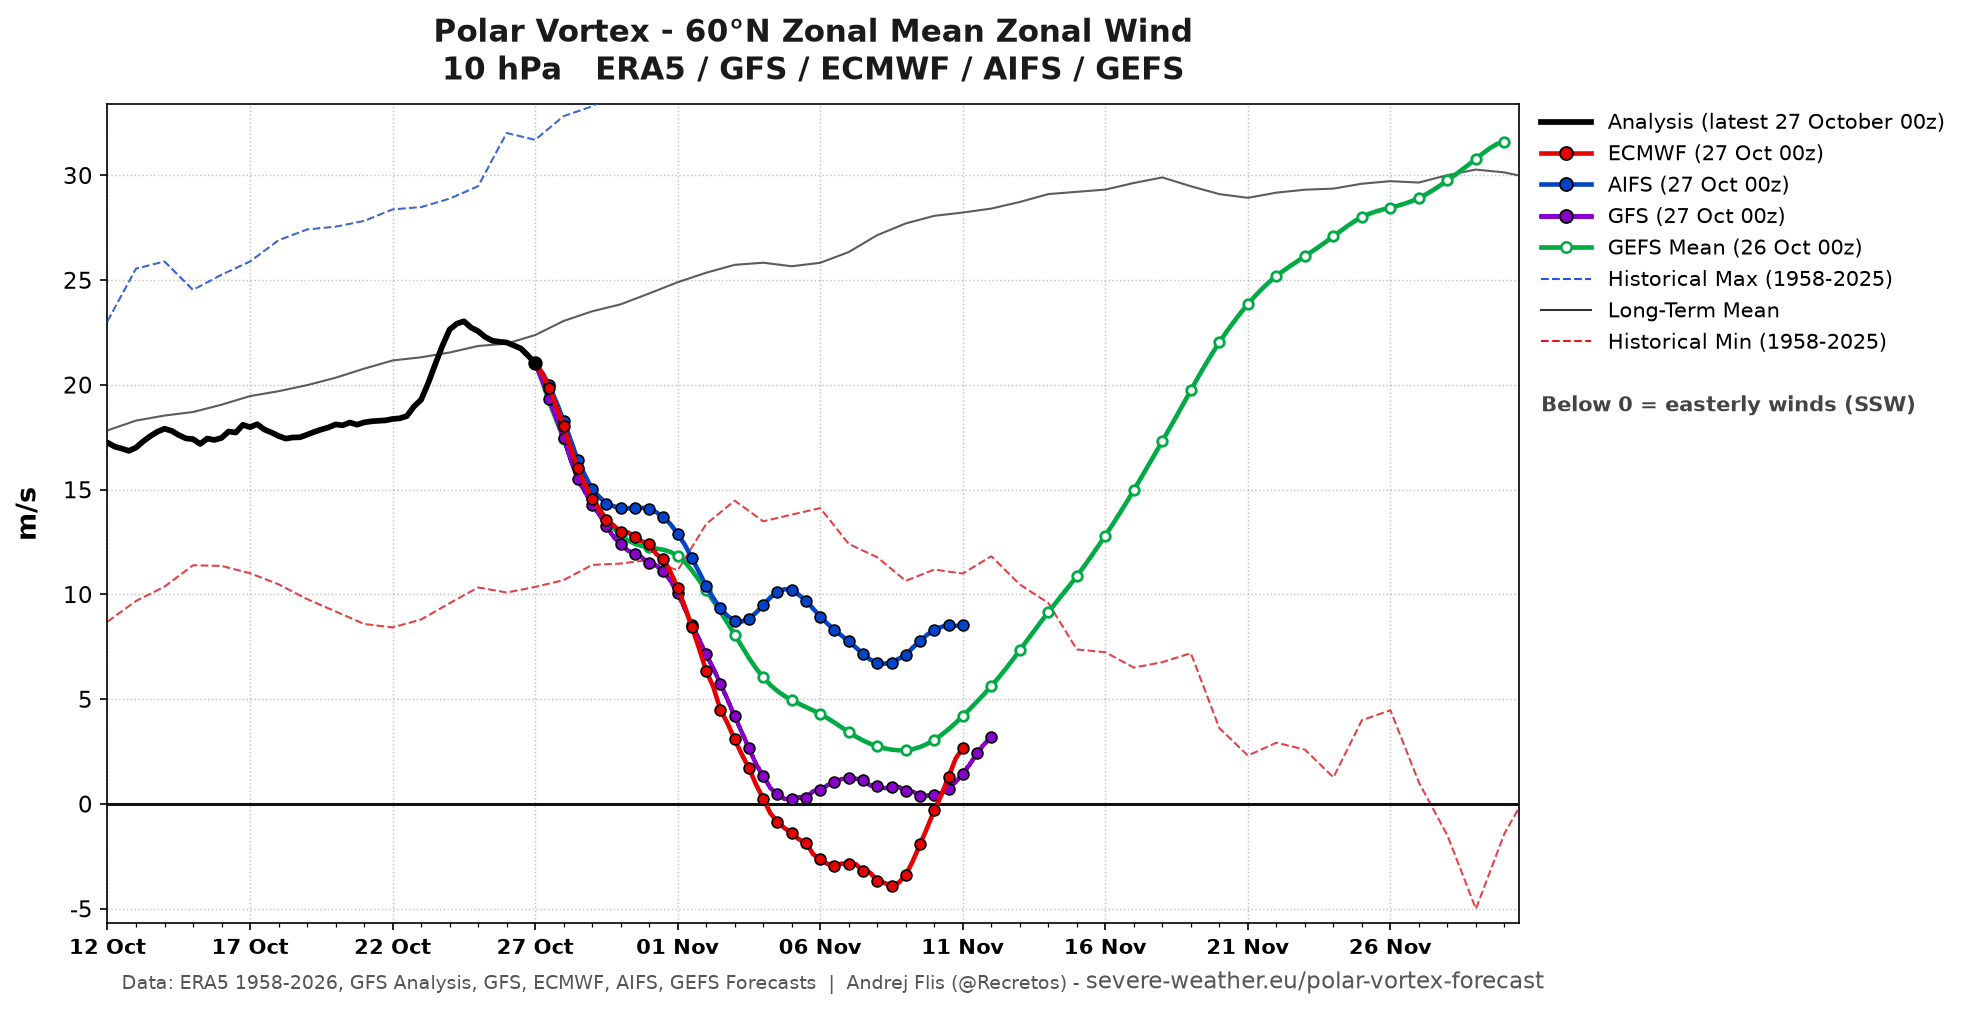
Overall, we can see a rapid and significant disruption and slowdown of the stratospheric Polar Vortex. The dashed red line is the historical minimum wind speed, and the latest forecasts all drop below that. This indicates we are dealing with a record Polar Vortex disruption for this time of year, with a stratospheric warming event.
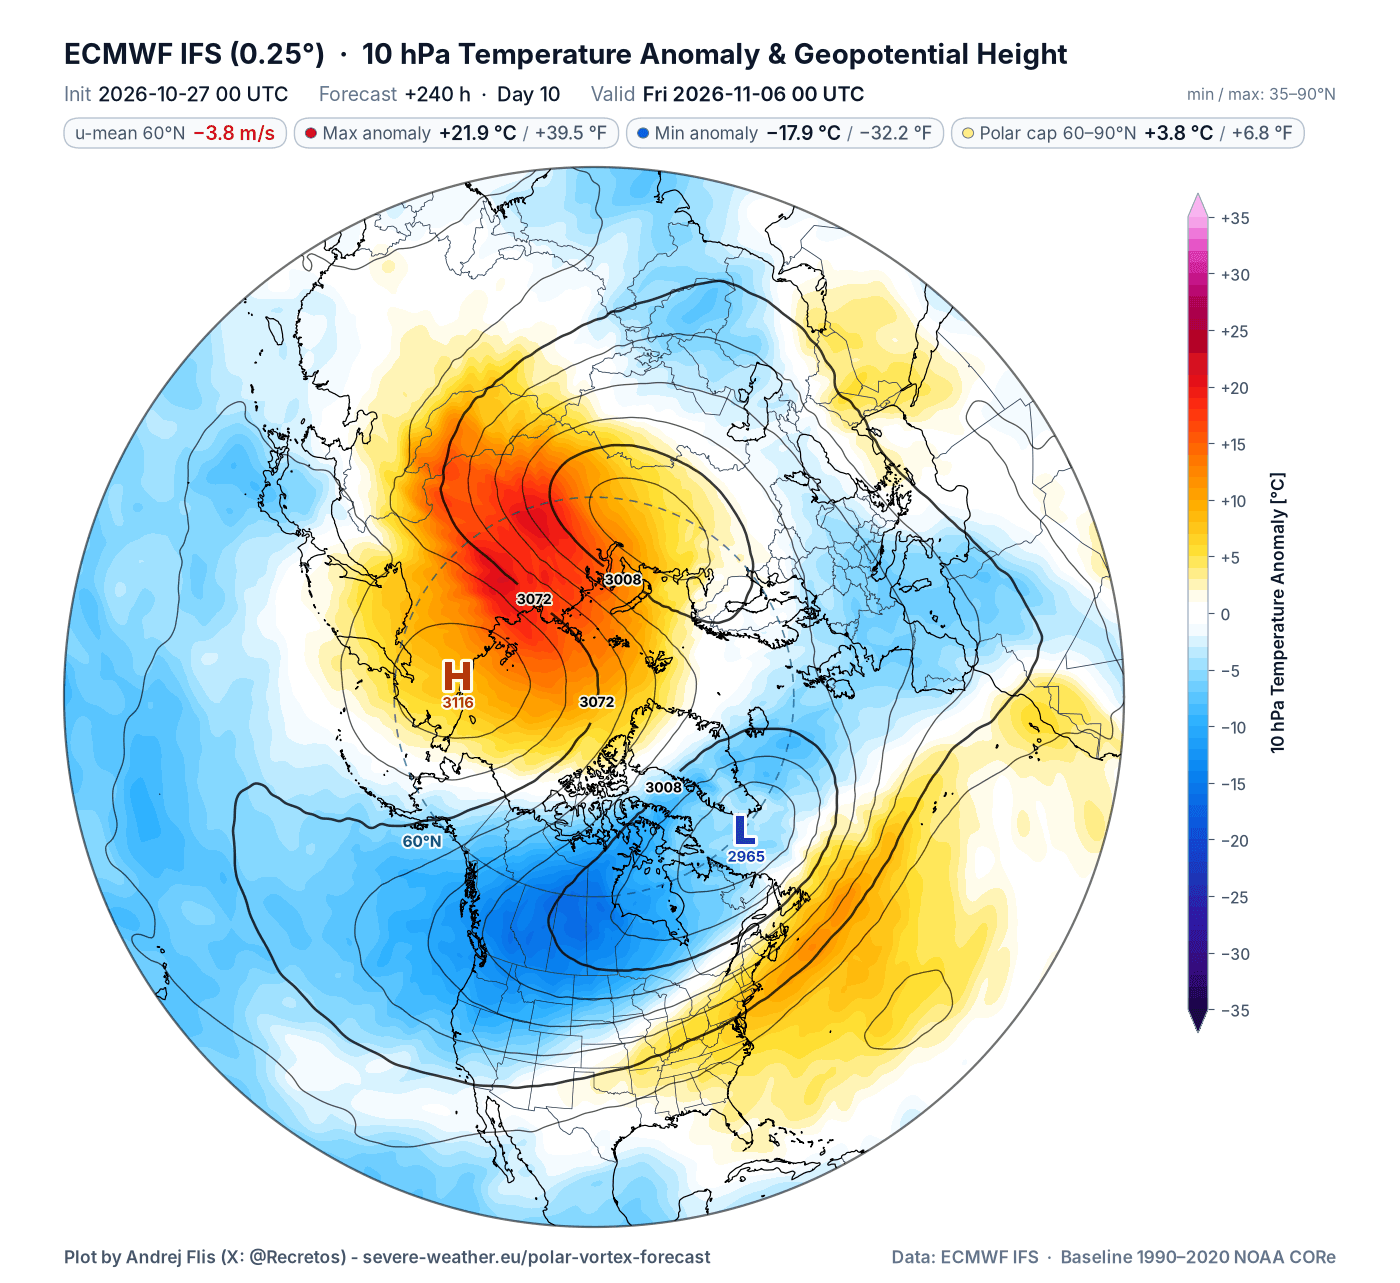
The stratospheric warming anomaly is visible below on the ECMWF forecast for day 10, where you can now see a split of the Polar Vortex into two cores, but still keeping the outer shell linked. This image also shows the temperature compared to normal, and as you can see, the stratospheric temperature wave will push temperatures almost 22°C (40°F) above normal at this level.
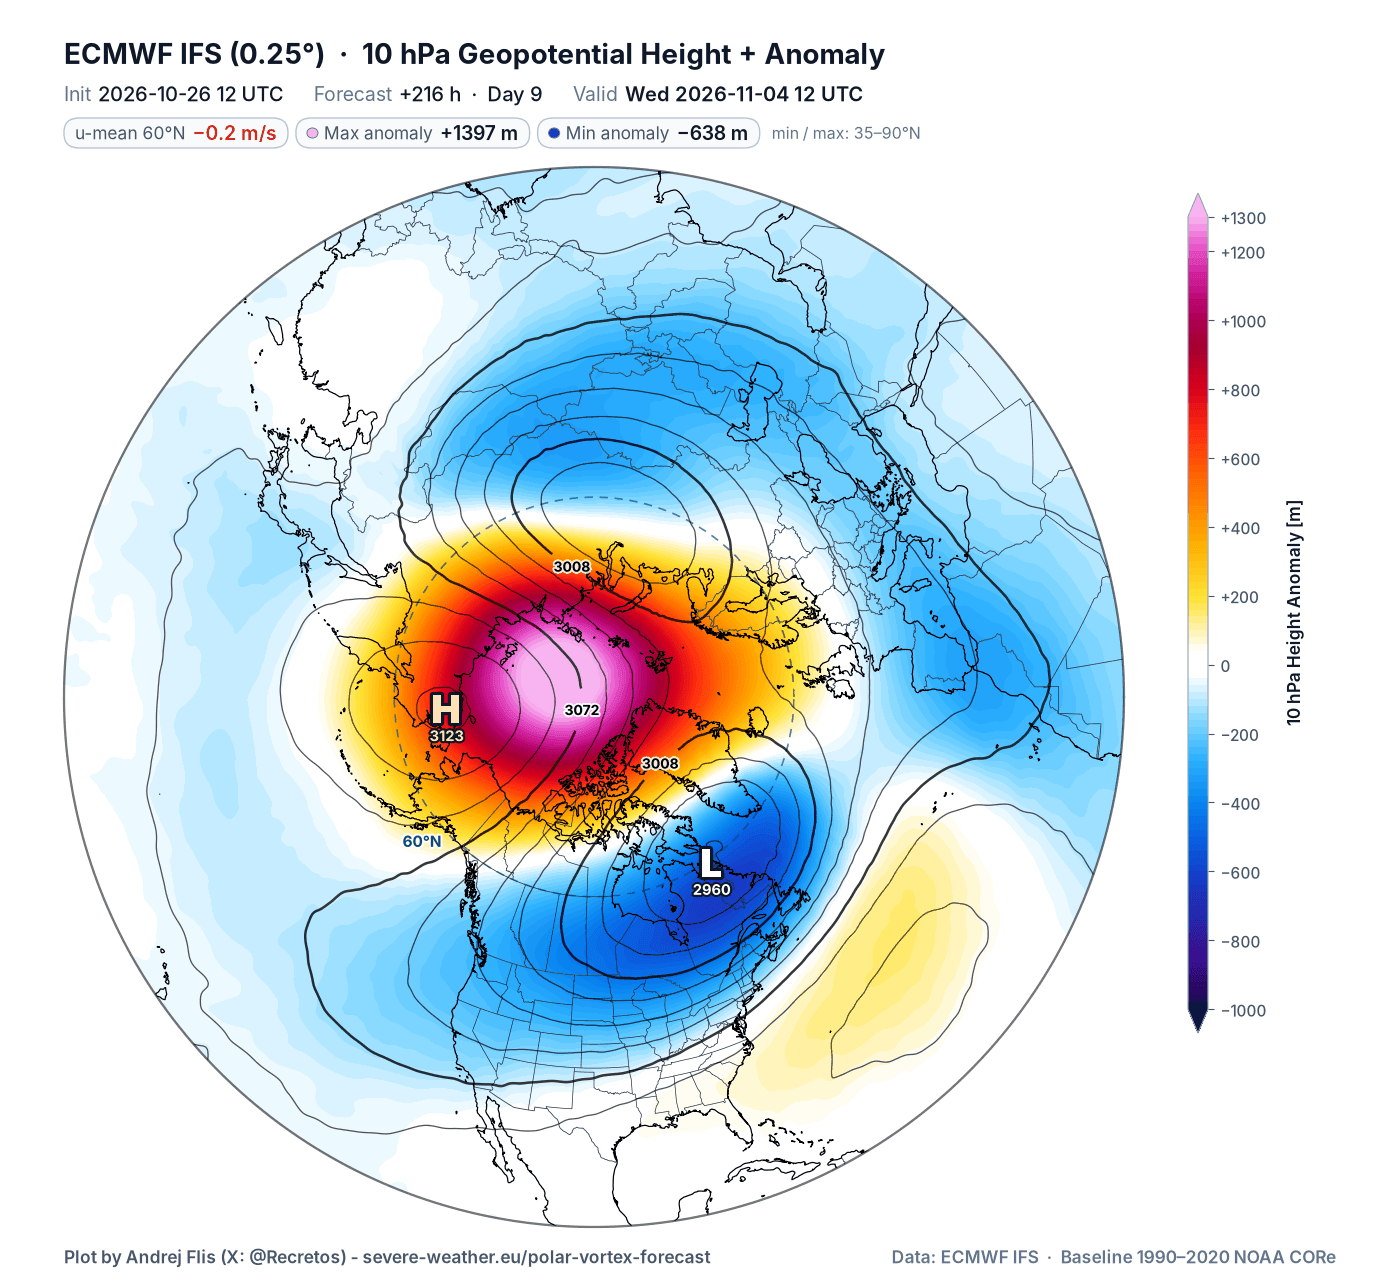
Also, looking at the pressure anomaly in the mid-stratosphere for the same period, it reveals an impressive high-pressure anomaly area at the 10 mb level, breaking the Polar Vortex into two separate cores we saw above. This high-pressure anomaly, along with the two displaced cores, causes the wind reversal as an anticyclone spins clockwise, creating easterly (negative) zonal winds.
This strong split dynamic is also nicely seen in the Polar Vortex 3D forecast below, which I made from the model data and shows the 14-51 km (8-31 miles) depth. The stratospheric high-pressure area has separated the Polar Vortex core, which is what we saw in the forecast maps above, but this gives us a direct visual perspective.
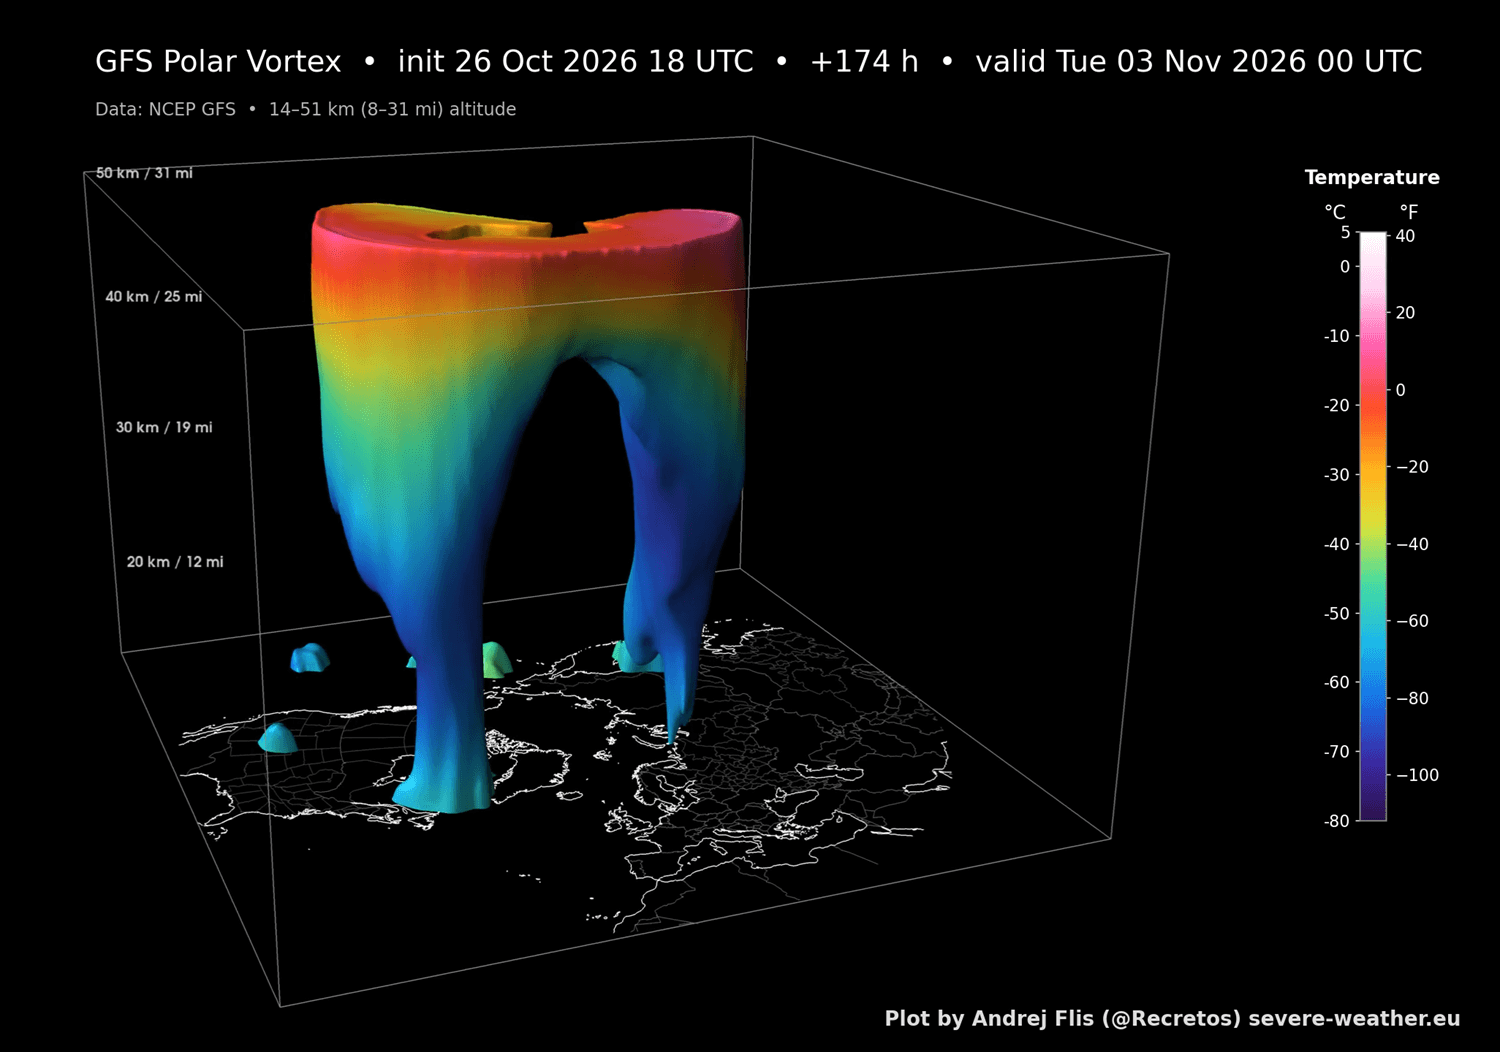
Below is also the full-resolution video for the full 3D Polar Vortex forecast, which properly shows the Polar Vortex dynamics. It is also a great example of how the split of the Polar Vortex looks in nature and how the whole structure behaves in such an event.
As a better confirmation of the event, we can also look at the ensemble forecast support. Currently, the latest data shows that all 3 main ensemble predictions are running near a wind reversal and an official SSW event. The ECM-ENS model already shows a reversal with a 96% chance, while the other two models sit on the edge of flow reversal, with a 71% chance for the GEFS and 37% for the AIFS ensembles.
If we were at the peak of Winter, the impact of such a core split could be fantastic for winter fans. But as we are still in mid-Fall, the rules of the game are somewhat different, including tracking down any potential weather impacts.
How Deep the Polar Vortex Split Reaches
This split is strong enough to reach across a deeper layer of the stratosphere, also visible in the mid-low stratosphere at 50mb (20km / 12miles) level. You can see the two clear Polar Vortex cores, split apart by a strong high-pressure anomaly of the stratospheric warming event.
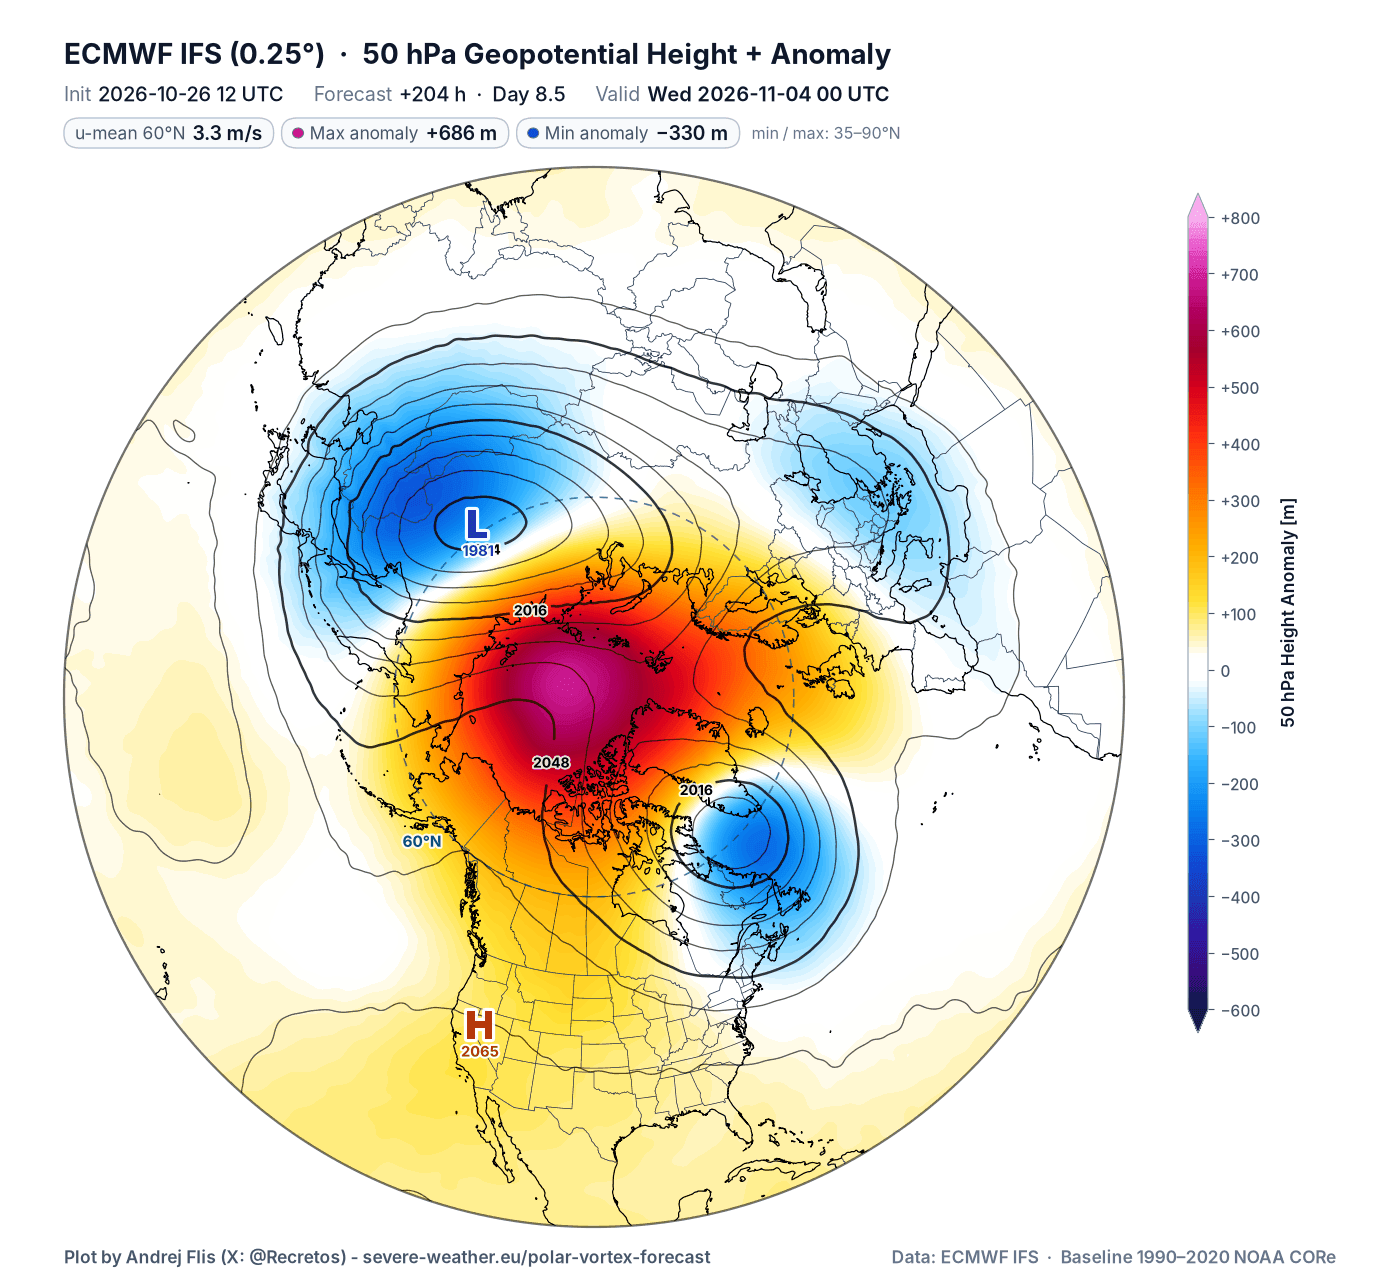
This does show a stratospheric anomaly and Polar Vortex disruption reaching across different levels of the atmosphere. But we need a different set of maps to see just how deep it runs across the atmosphere.
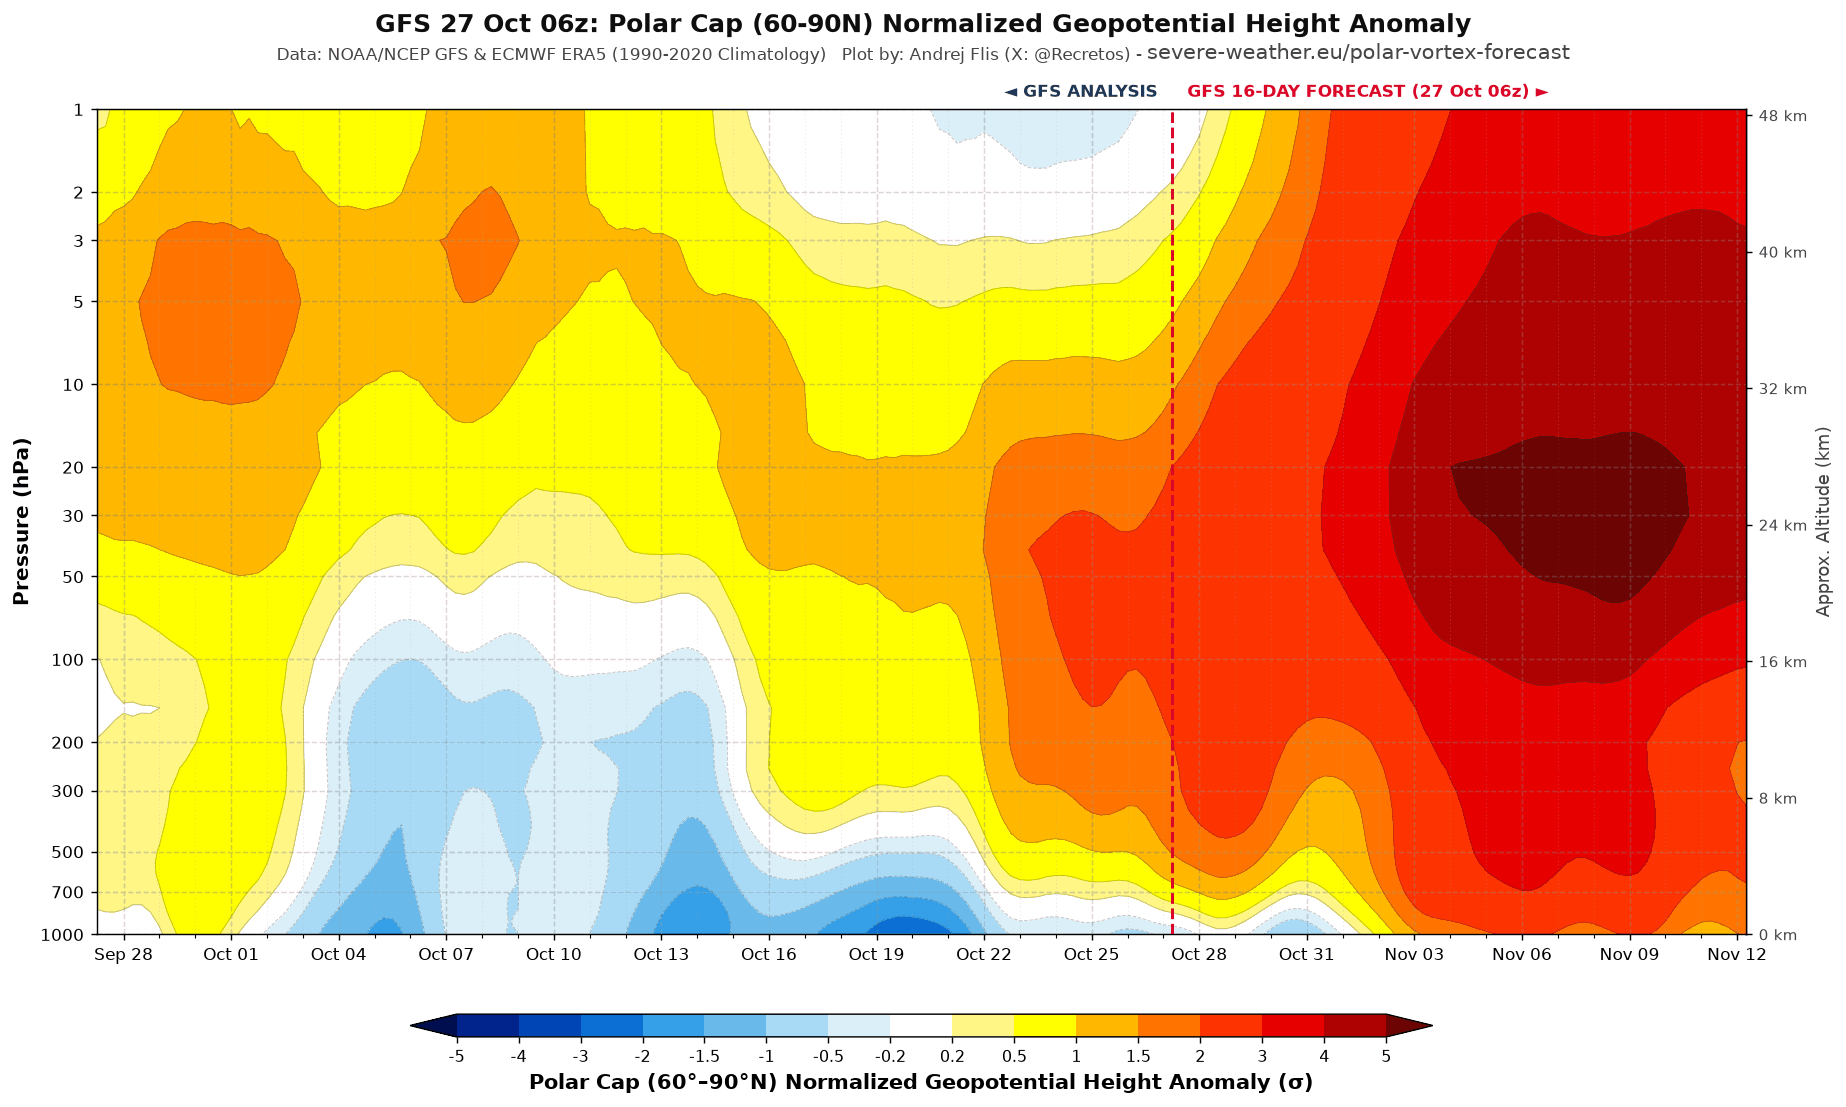
We can also look at the vertical view for the pressure anomaly, showing the lower half of the whole atmosphere. Here you can clearly see in the forecast part that the high-pressure anomaly starts lower in the lower and middle levels and rises over time and also drops down at the same time. This really shows an unprecedented pressure anomaly in the atmosphere for this time of year.
Most of the SSW events occur in January and February. I decided to look at the first SSW of each season (some seasons had two) and when it occurred. As you can see in the image below, a reversal in the current event is centered around Nov 4th, and would break the record for the earliest SSW on date by at least 3 weeks (Nov 28th). This makes the event unique, but also creates trouble when searching for impacts.
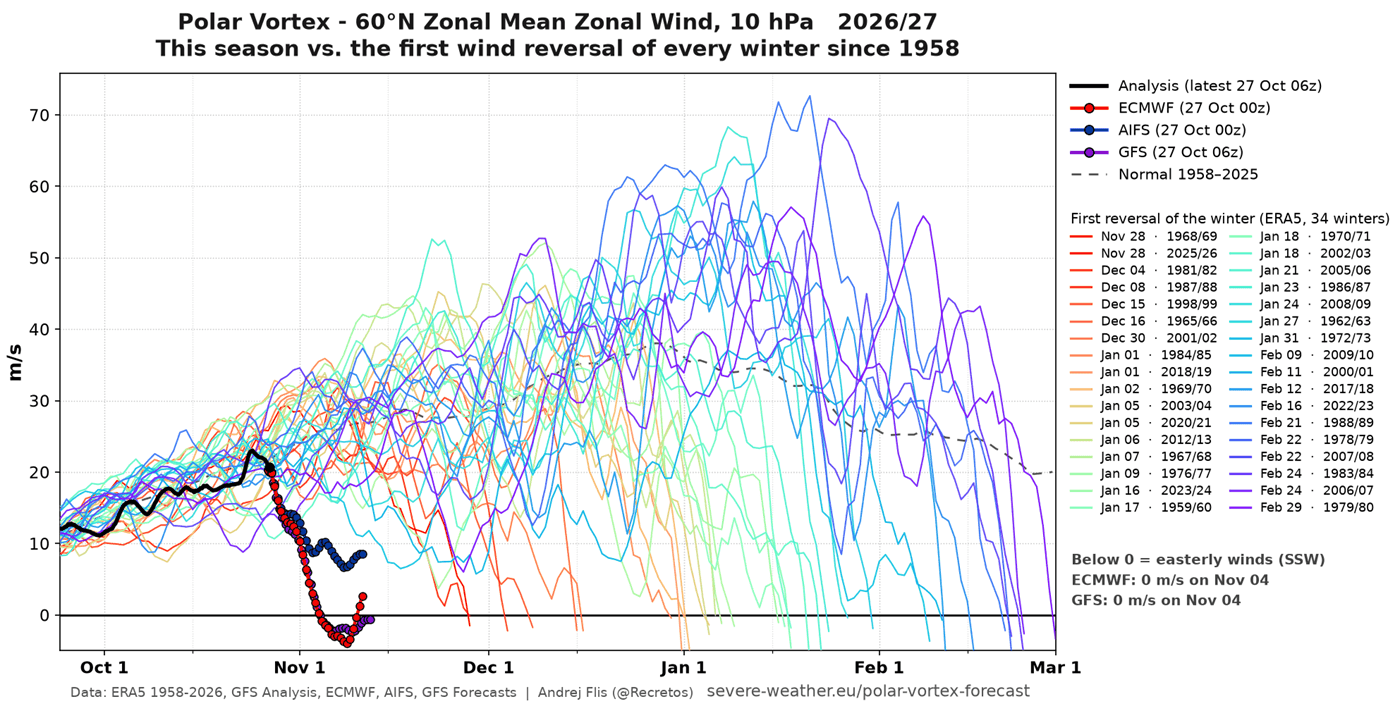
We’ve never seen anything like this so early in the season. And a mid-Fall atmosphere is slightly different from mid-Winter, making the impact less predictable and possibly less impactful. Not to mention, there is a Super El Niño knocking at the door for North America, loading its own strong atmospheric forcing.
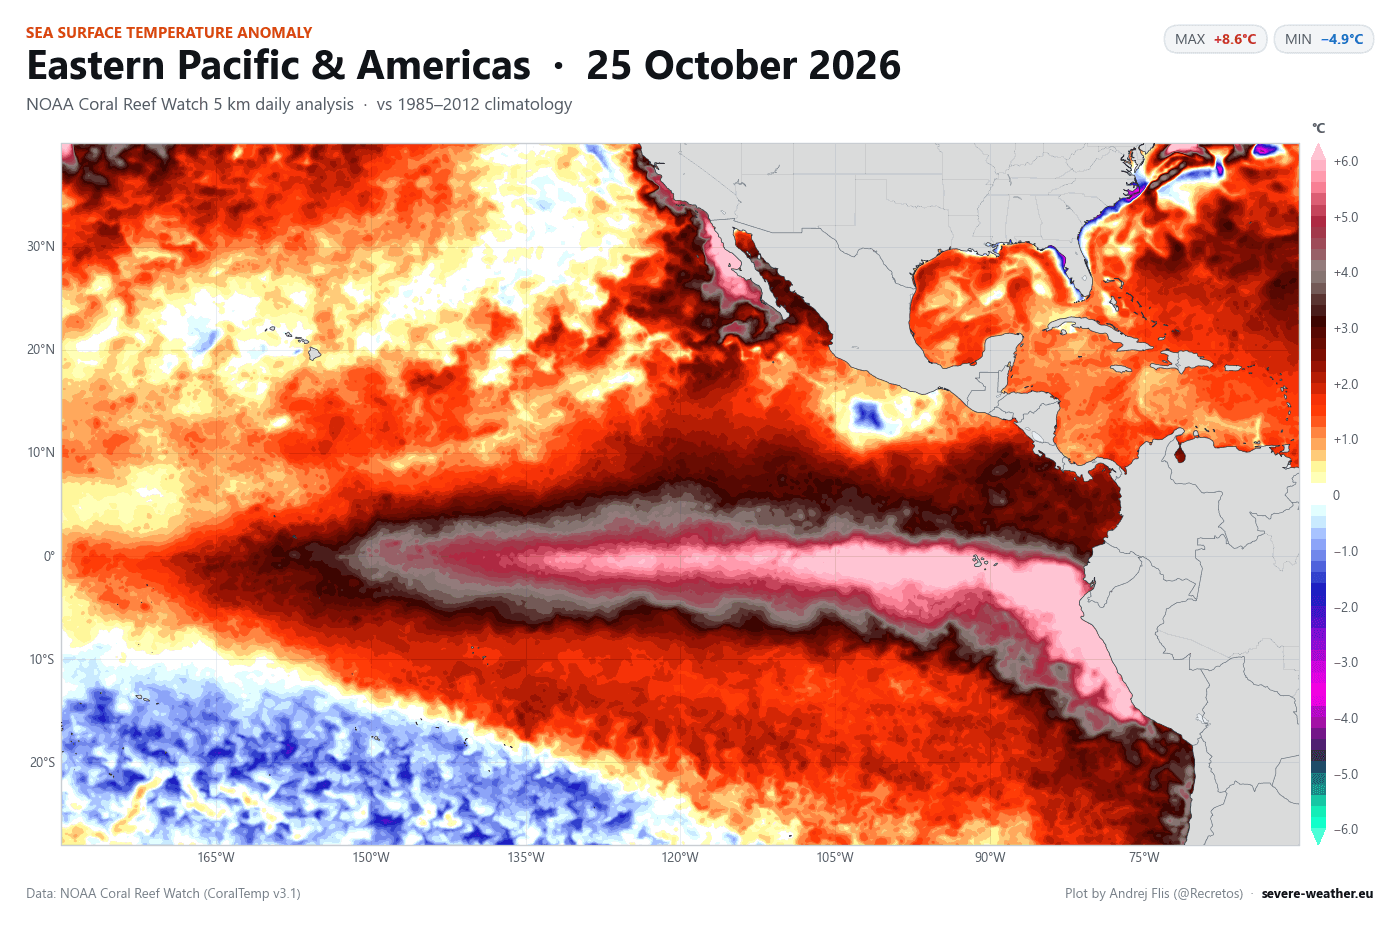
Below is the latest Super El Niño event, which I produced from NOAA CRW data. It shows a significant event, with peak anomalies in the eastern regions of the Pacific exceeding +8°C (+14.4°F) above normal. An atmospheric impact from such an anomaly is too great to ignore in a Polar Vortex disruption event.
This is an important factor over North America, as while a moderate event produces a mild wave pattern, a Super El Niño usually triggers a far more aggressive shift in the jet stream. The transition from a Moderate to an Extreme El Niño leads to a deeper Pacific trough and a stronger Canadian ridge. The image is from a recent study (linked below).
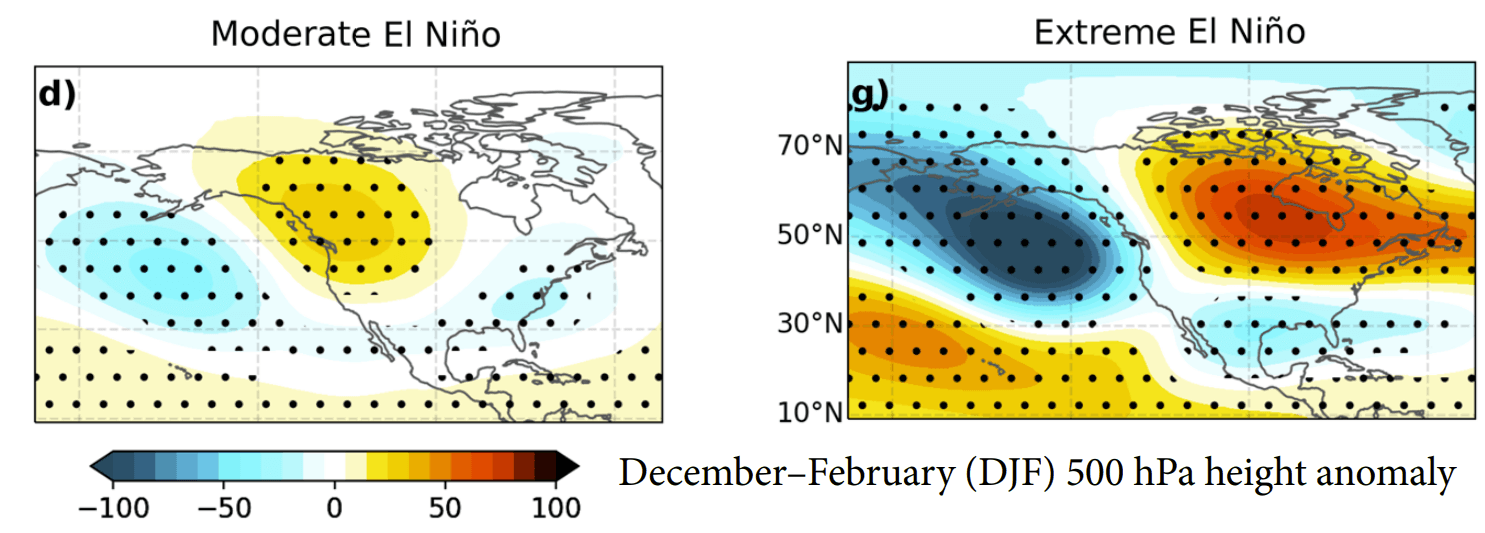
For this reason, we have to consider the atmospheric forcing of the Super El Niño, and also the early nature of the Stratospheric Warming event, as we look for potential impacts on weather.
Tracking Early Weather Impacts for the United States, Canada, and Europe
An SSW event usually operates on a delayed timer, as impact from the stratosphere needs some time to filter downwards. If we were in mid-winter with no Super El Niño, we would have a field day finding all the atmospheric anomalies in daily weather, which can also be at a 1-4 week delay.
But with an SSW event so early in the season with an underdeveloped Polar Vortex and a Super El Niño forcing, I needed some custom plots to find any direct weather connections. For now, I will focus on the more directly connected patterns and will look into delayed responses in future updates as data becomes clearer.
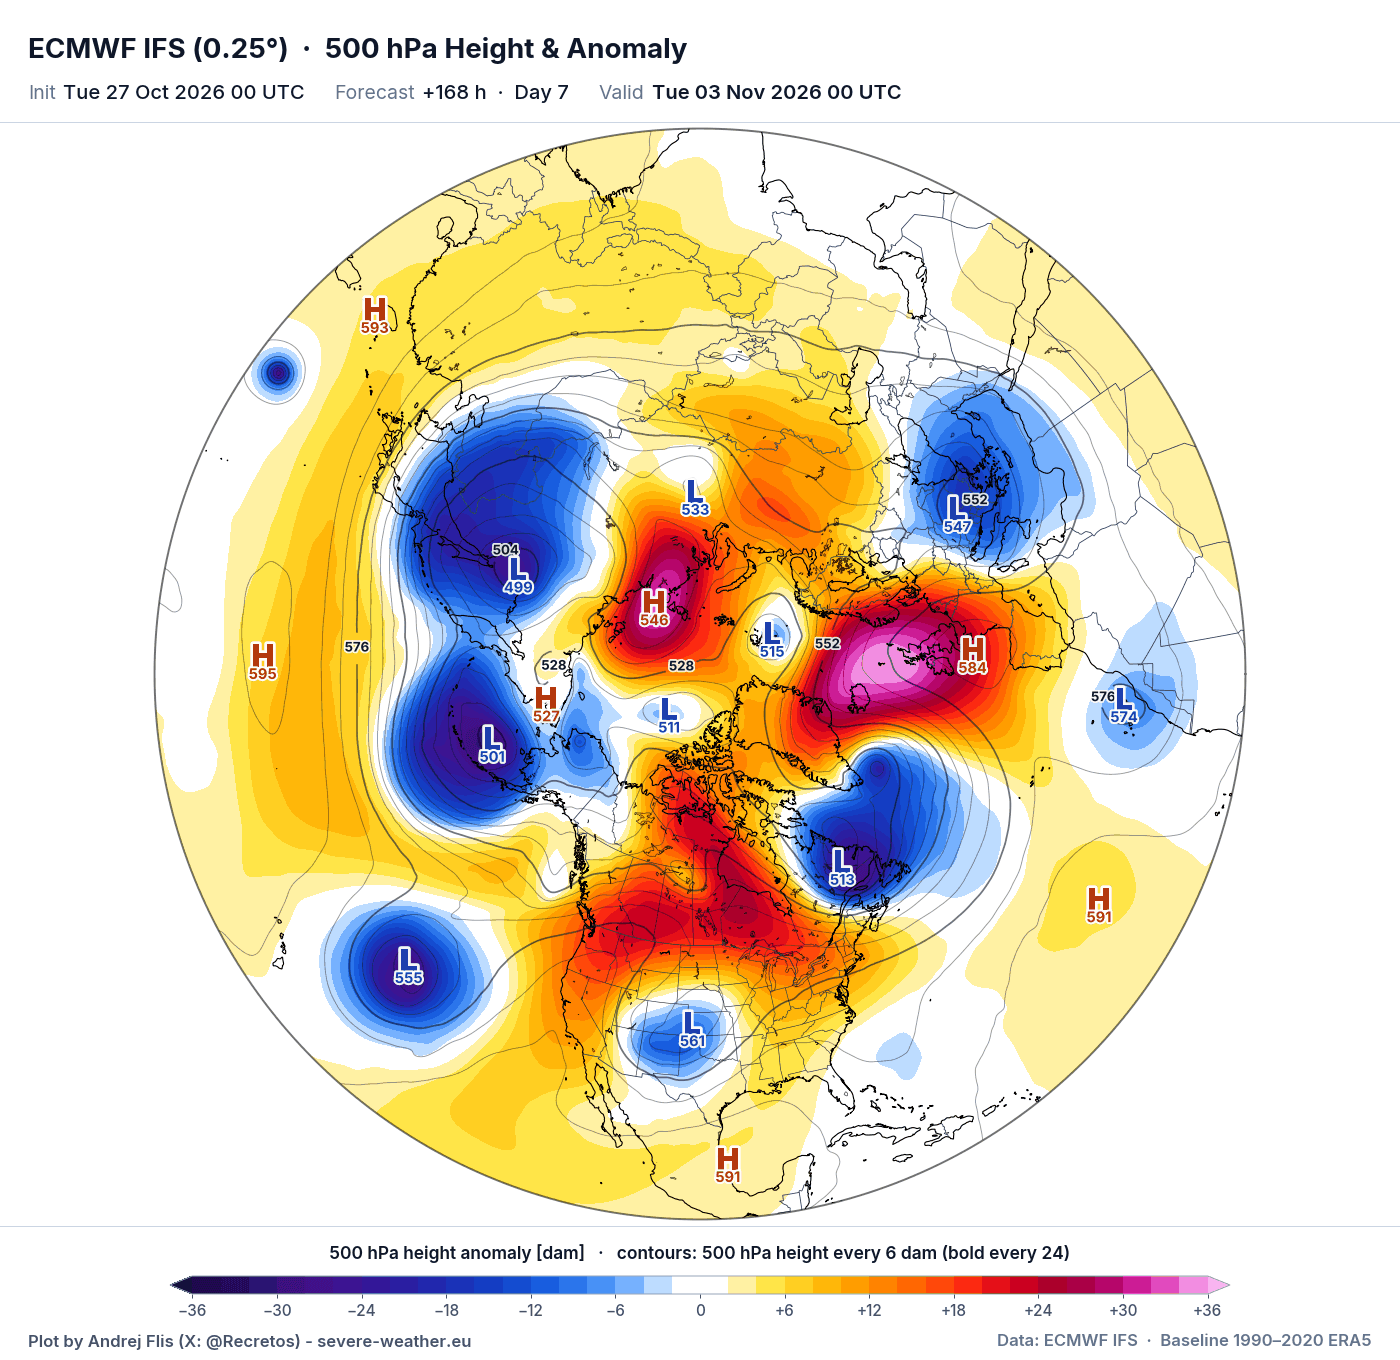
Around day 7, the Polar Vortex is going to be split in the core area, with the stratospheric winds in freefall. I created a special plot that finds the connection between the low-pressure areas across various levels of the atmosphere. Seen below, it shows the day 7 forecast, with the blue areas being the direct lower-level connection to the split cores in the stratosphere.
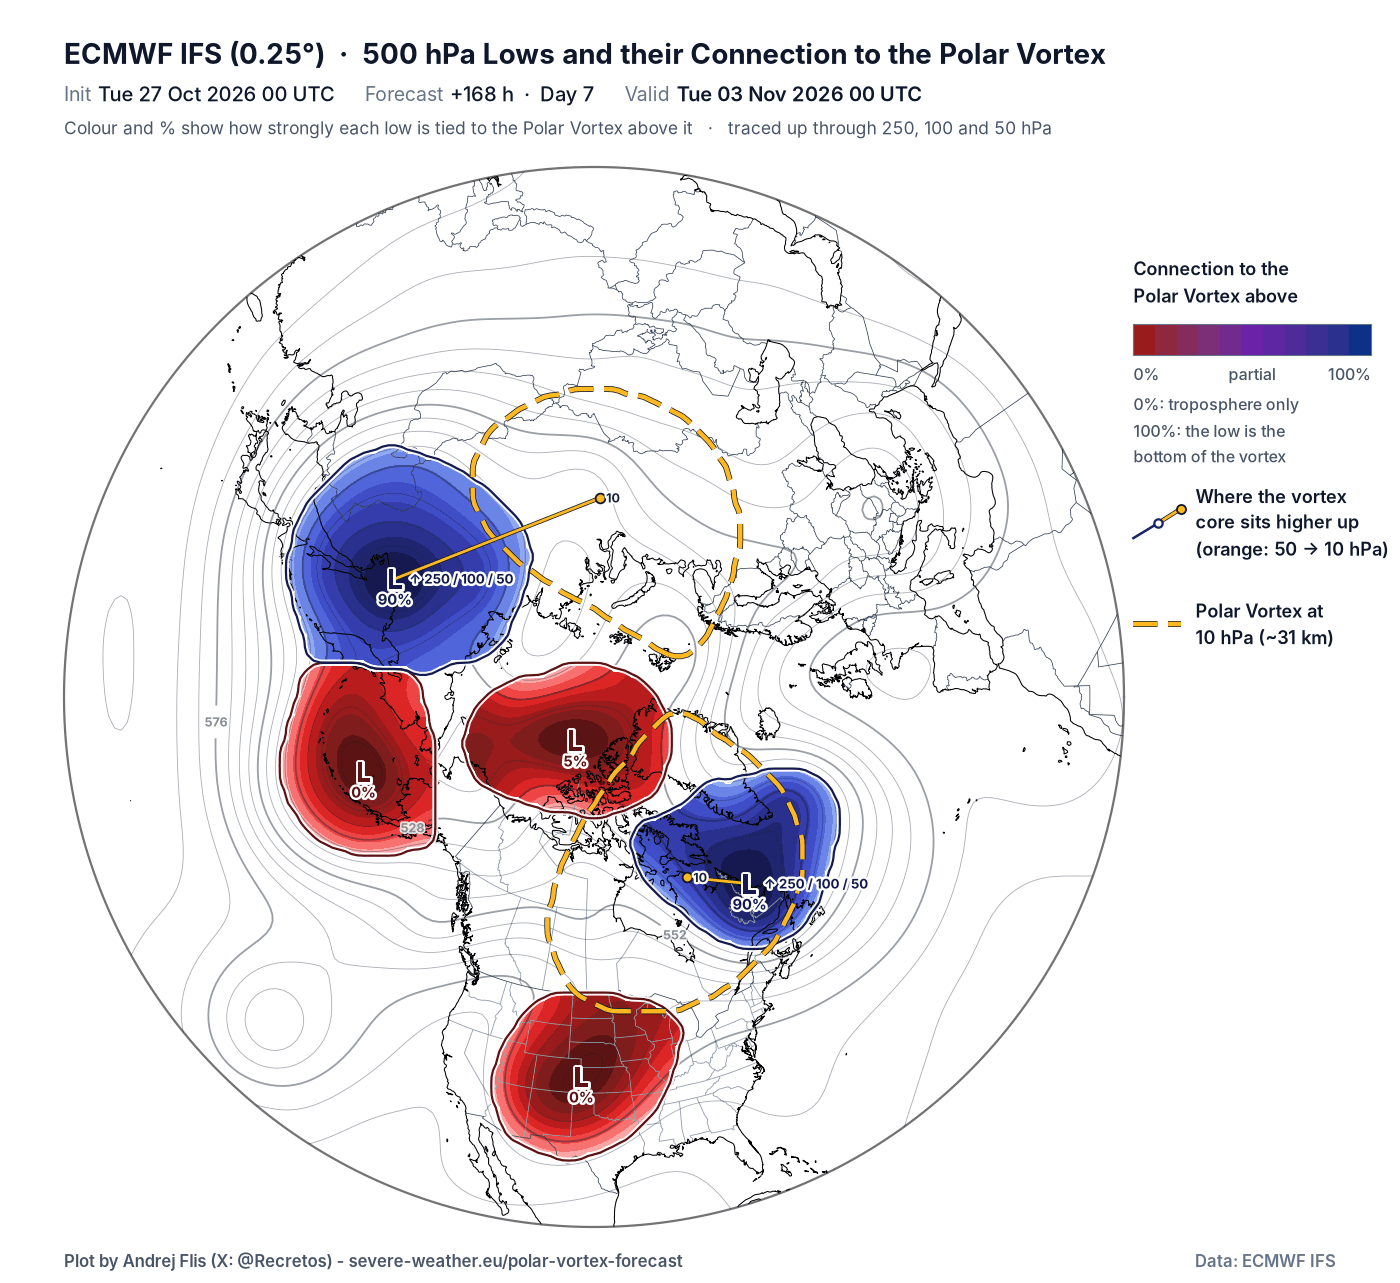
We can see this in the normal pressure anomaly forecast as a low-pressure zone over eastern Canada, and another one over East Asia and parts of the North Pacific. The rest of the low-pressure areas do not show a clear connection with the Polar Vortex cores above.
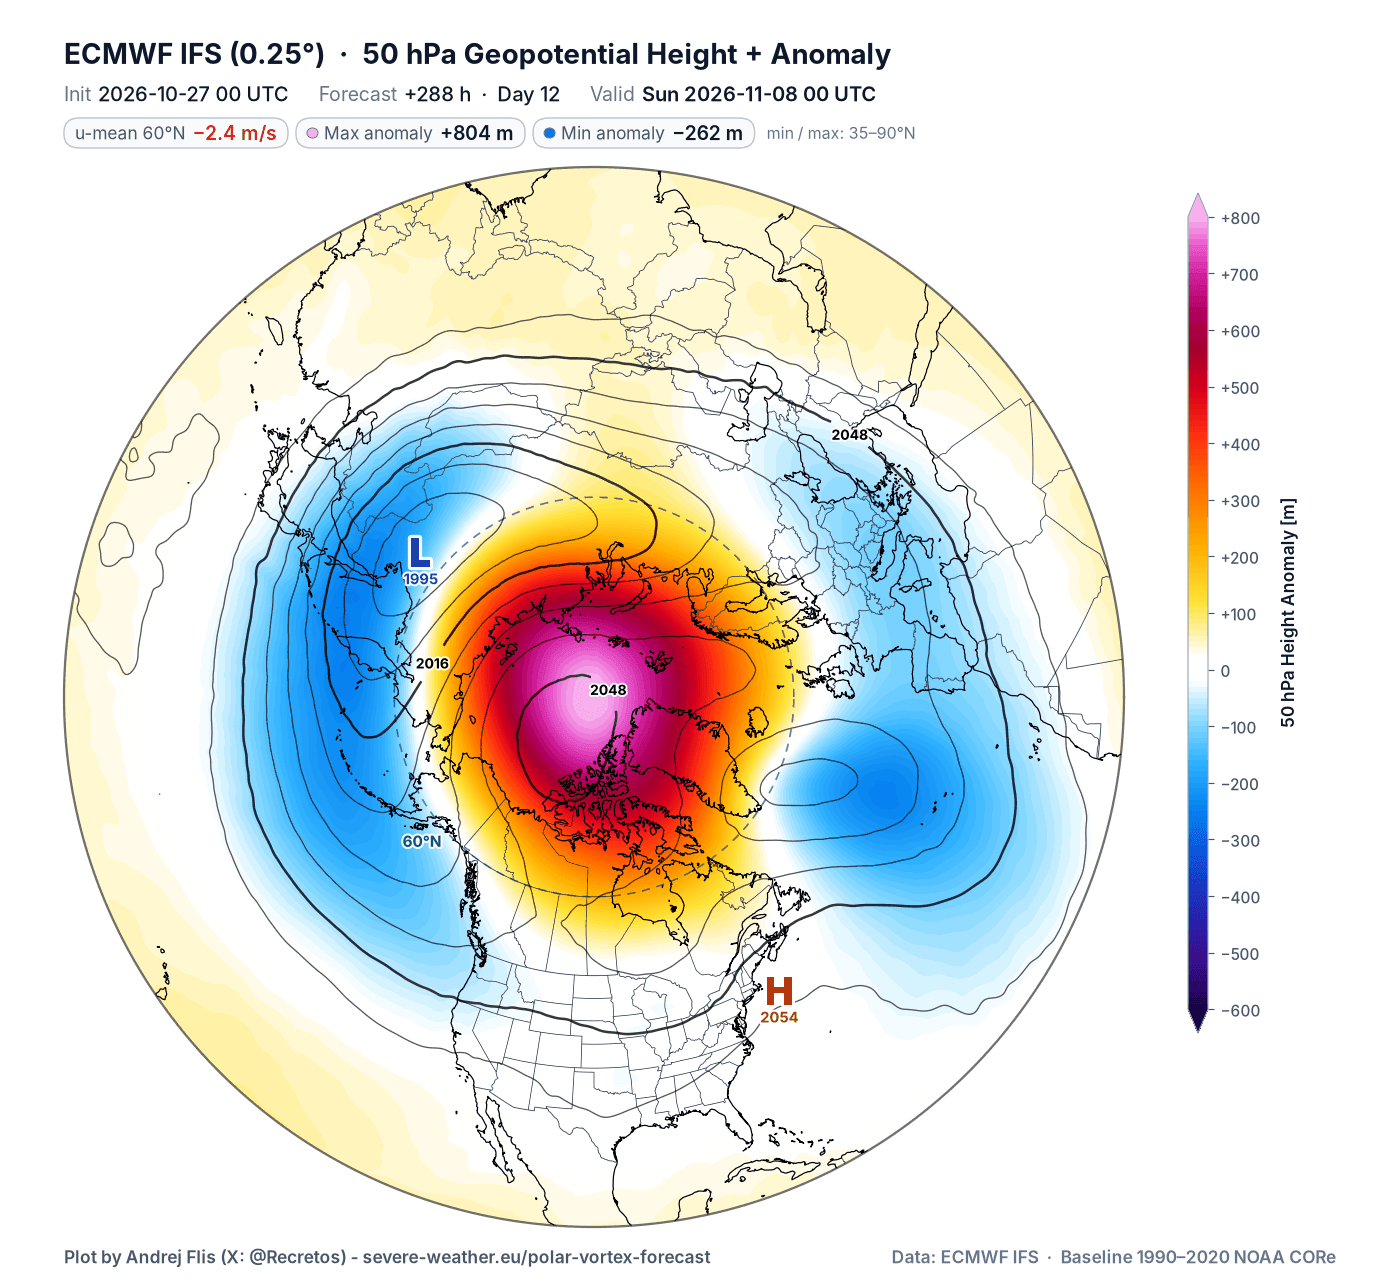
At day 12, we get a bit of a different picture. Looking at the mid-low stratosphere, we see the wind reversal now reaching down to this level. There are two main Polar Vortex cores, over Siberia and the Atlantic, with the polar region taken over by the high-pressure anomaly.
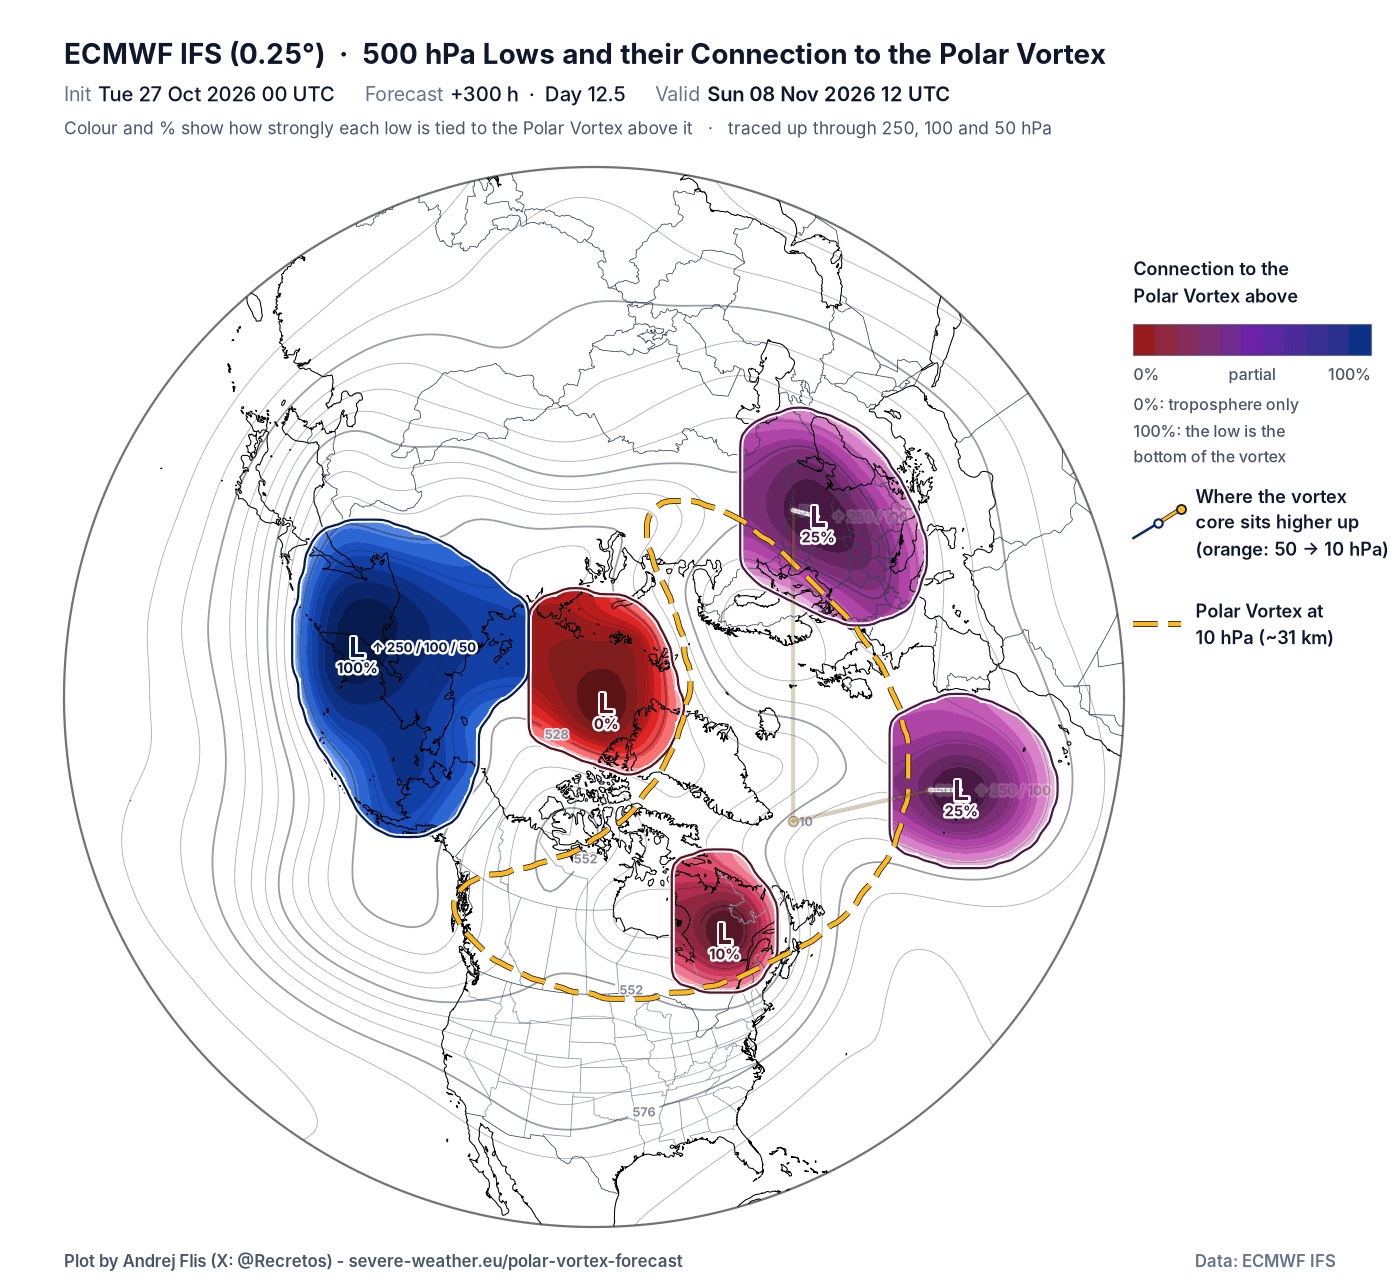
In the connection map, we can see the connections above over East Asia again, which is the core you saw in the image above. But there are also two low-cores with partial connection over Europe and the Atlantic, and a weaker one over eastern Canada.
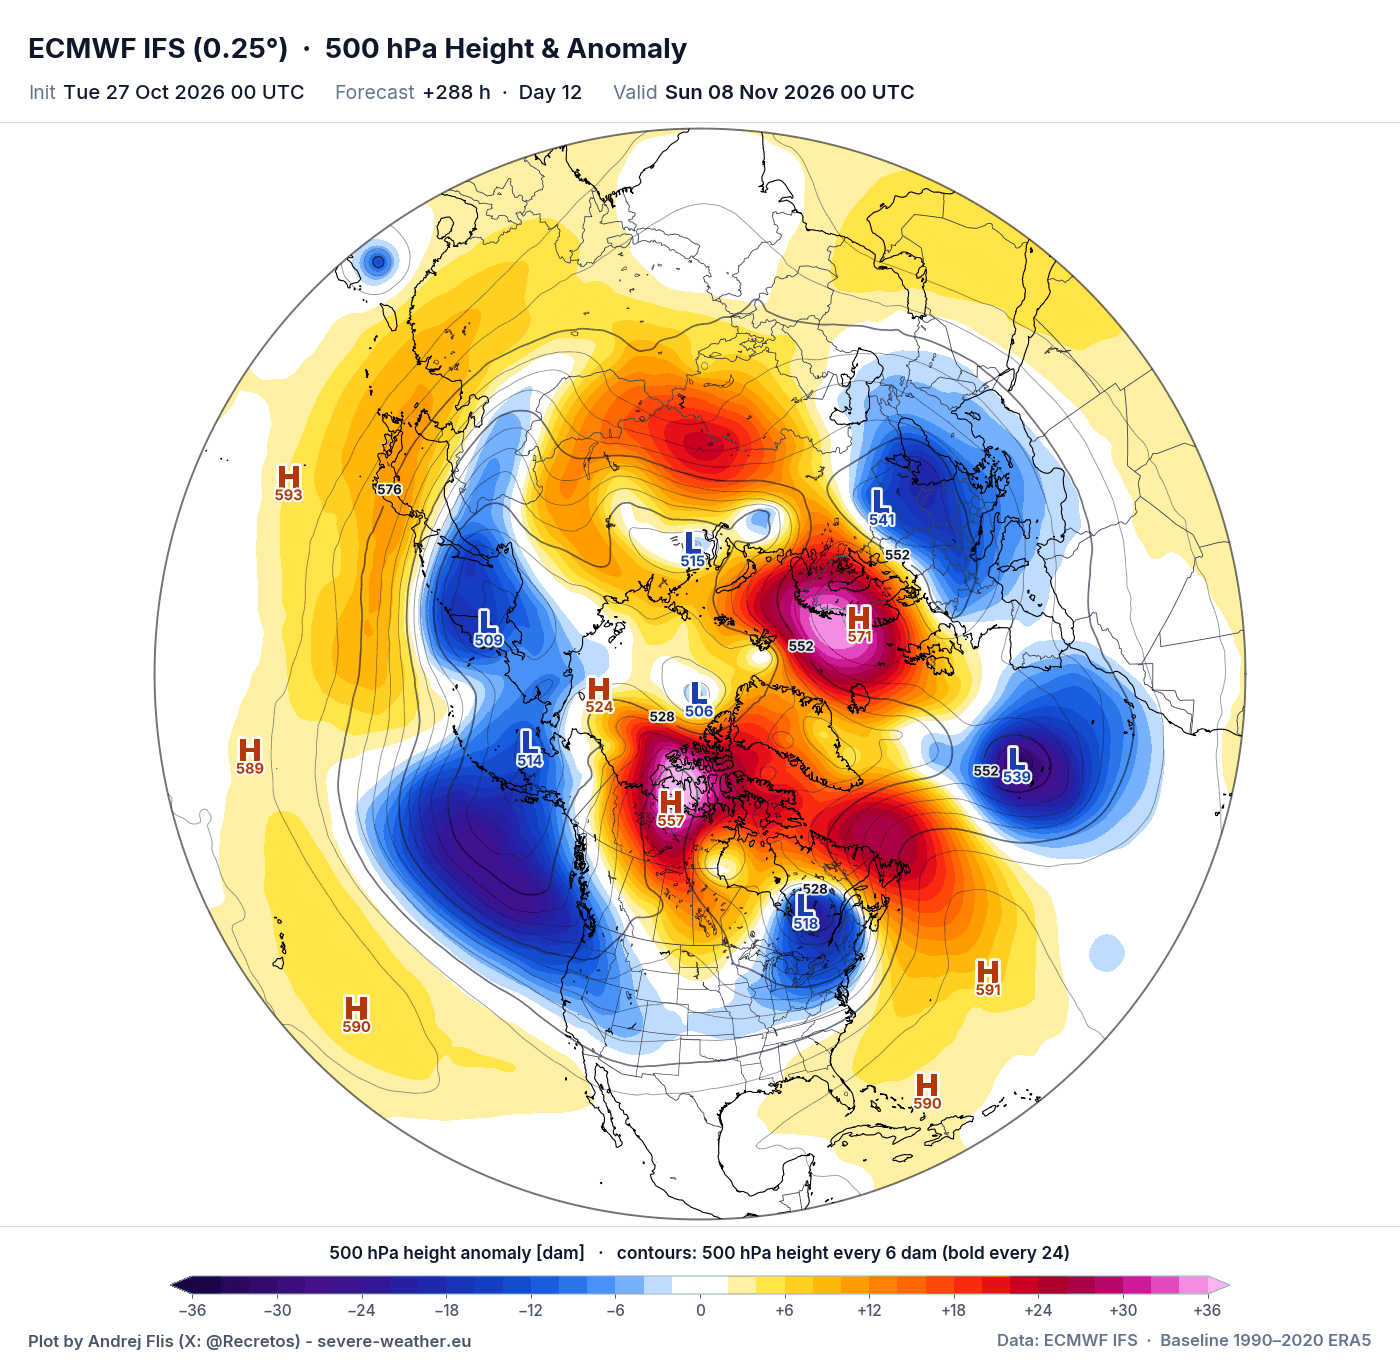
At the lower levels of the atmosphere, we can see these patterns actually reflected: a dominant high-pressure anomaly over the polar regions and fragmented low-pressure cores from the Pacific to the United States to Europe. If this were in January, we would be having a different talk right now in terms of cold impacts.
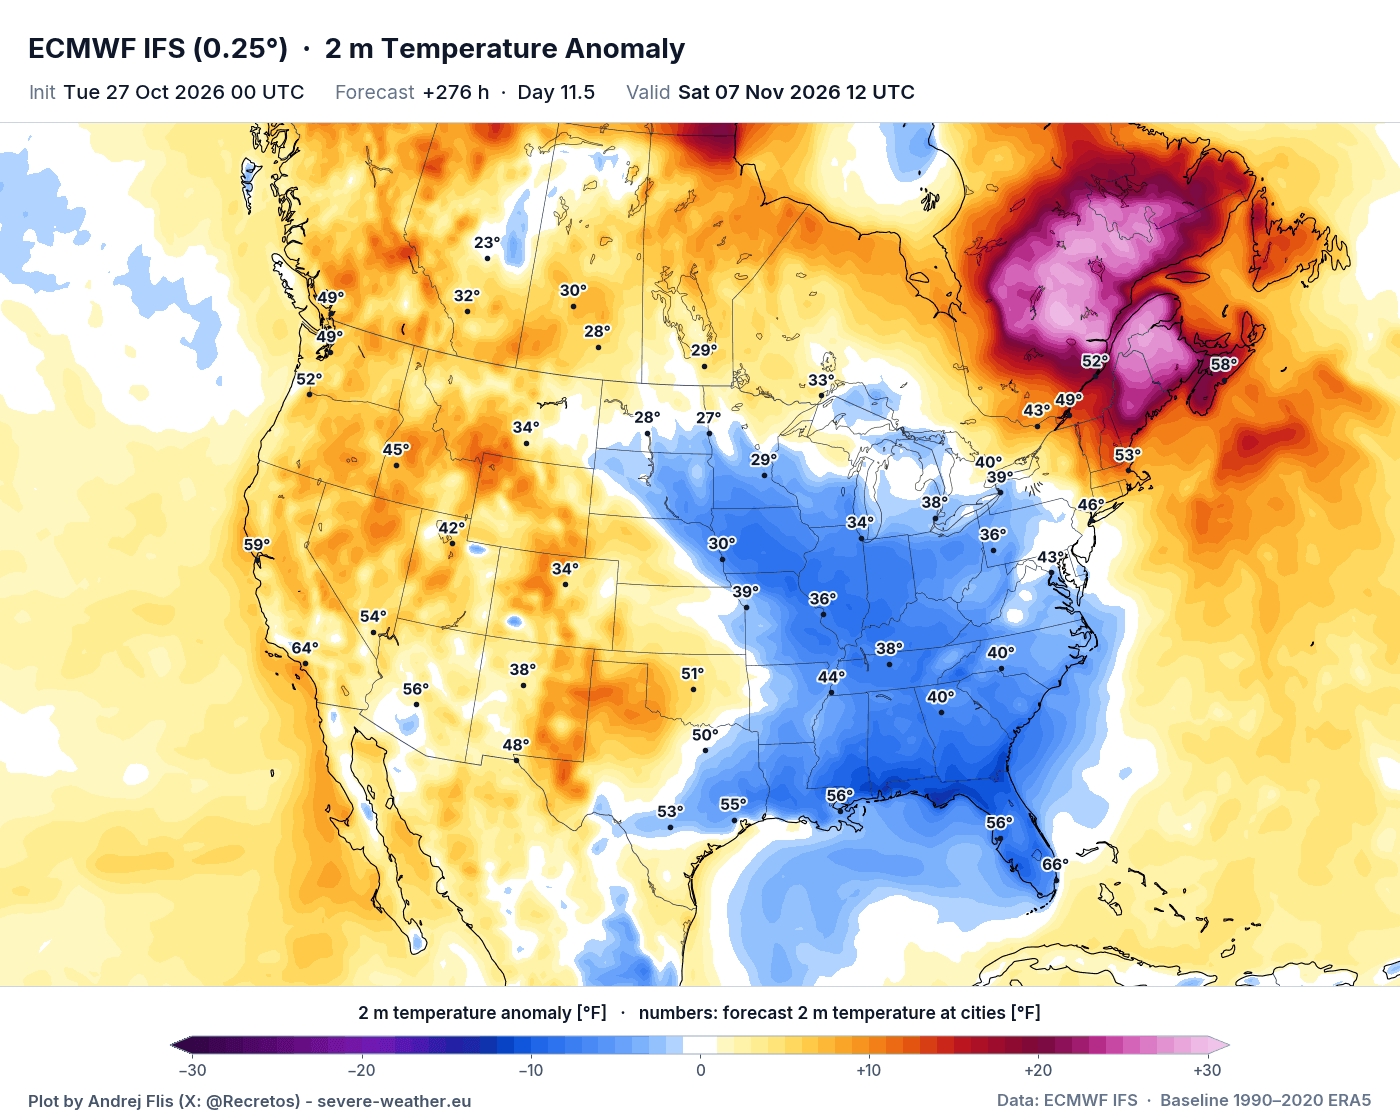
The temperature pattern at this time shows a cooling signal for the eastern half of the United States, in the presence of the low-pressure area over eastern Canada, also pulling warmth into eastern provinces. Here I have to add that this doesn’t really count as a Polar Vortex split impact, but as seen above, the stratospheric dynamics do play into the whole pattern picture and can disrupt the flow. These are just single run examples of a scenario, not fixed outcomes.
An even better example is perhaps over Europe, where we do see low-level connection to the disrupted Polar Vortex cores above. And the temperature forecast around day 12 is trending towards cooling and below-normal temperatures at the same time due to the low-core effect.
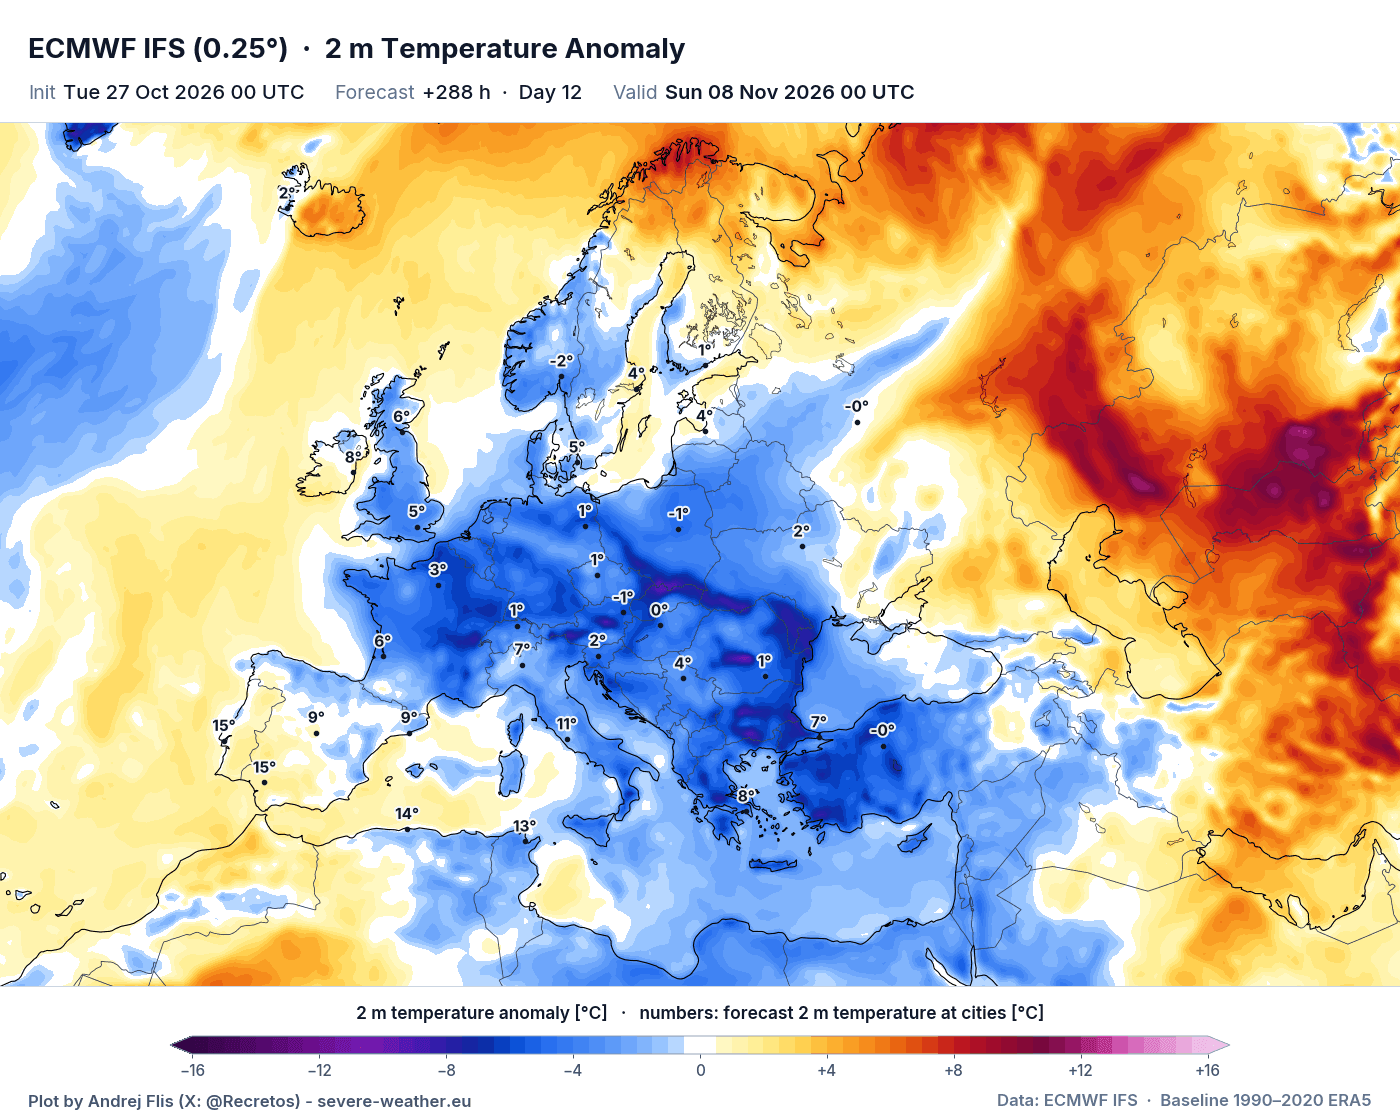
While we can’t call this the true direct Stratospheric Warming impacts, these could be classified as related impacts, and the pressure anomalies are disrupted across deep atmospheric layers. This is due to the Super El Niño, stratospheric dynamics, and other factors.
But looking at the latest available long-range data, there is a heavier round of stratospheric Polar Vortex distortions forecast for mid-winter, with potentially more pronounced effects.
A Stronger Polar Vortex Disruption Forecast for Mid-Winter 2026/2027
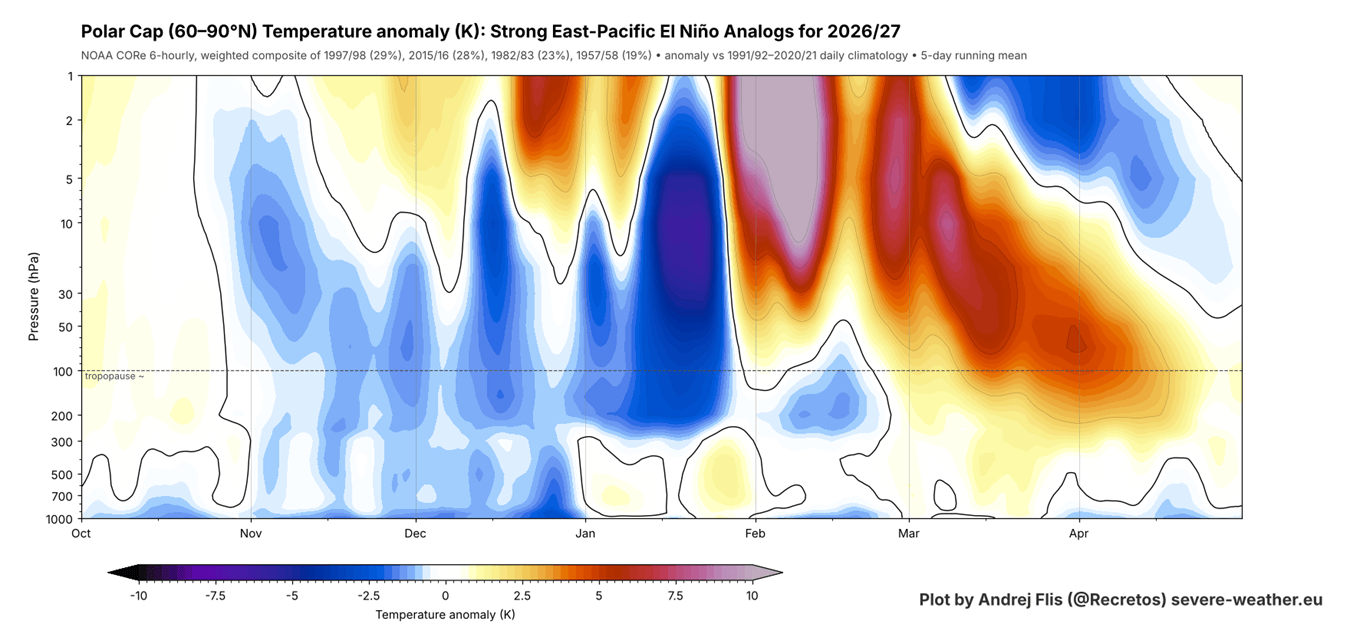
As we know, the 2026/2027 winter season will be under a major influence from a Super El Niño in the Pacific. I created an image from past data that shows the combined stratospheric seasonal profile in the 4 closest seasons to 2026 in terms of the state of the atmosphere and the oceans: 2015/16, 1997/98, 1982/83, 1957/58.
A strong El Niño deepens the low-pressure area over the North Pacific (the Aleutian Low), which sends more wave energy up into the stratosphere as the winter goes on. Over time, this weakens the Polar Vortex, usually in the second half of winter, setting up a new El Niño-forced disruption.
You can see this below, which shows the atmosphere from those 4 analog years, up to about 50 km (31 miles) high, revealing the tendency for a stronger Polar Vortex in Fall and early Winter. But into February, it shows a strong Stratospheric Warming signal. So, a stronger Polar Vortex early, but with a disruption trend for the second half of the season.
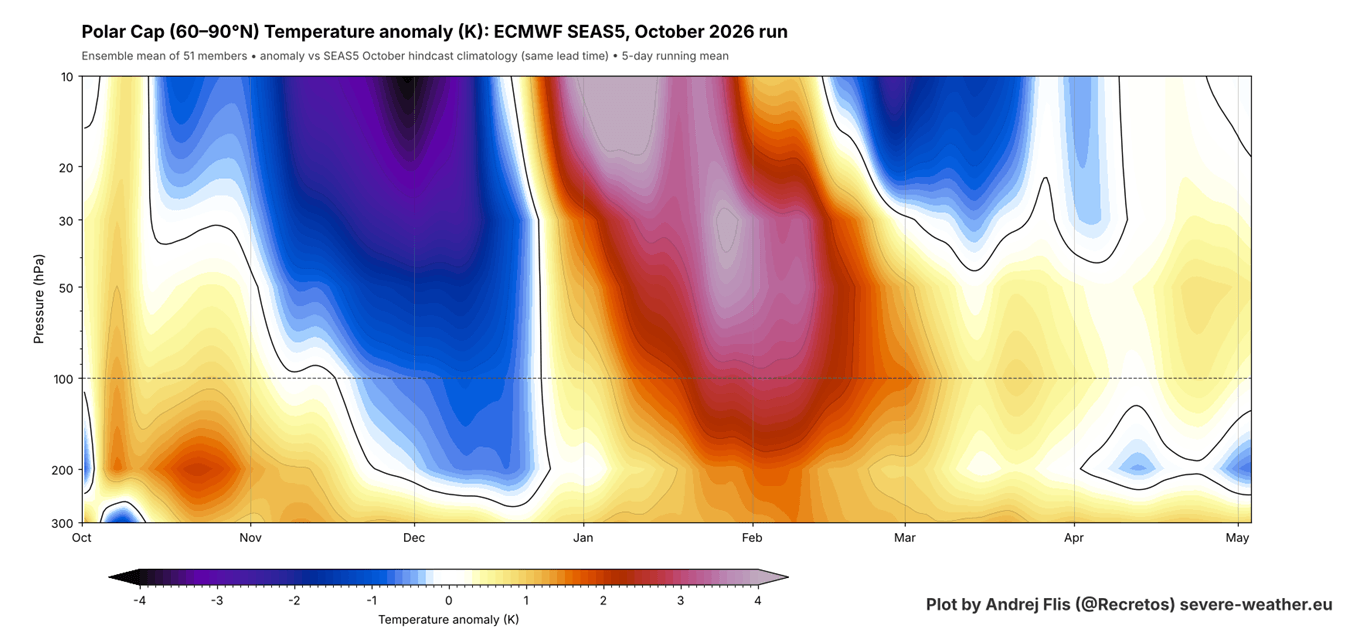
We know that the current Stratospheric Warming event is not normal for a Super El Niño. And the ECMWF seasonal forecast for 2026/2027 below shows a similar evolution as in the past analysis above: no early weakening, and then a Stratospheric Warming trend later in the season, arriving about a month earlier than in the analysis.
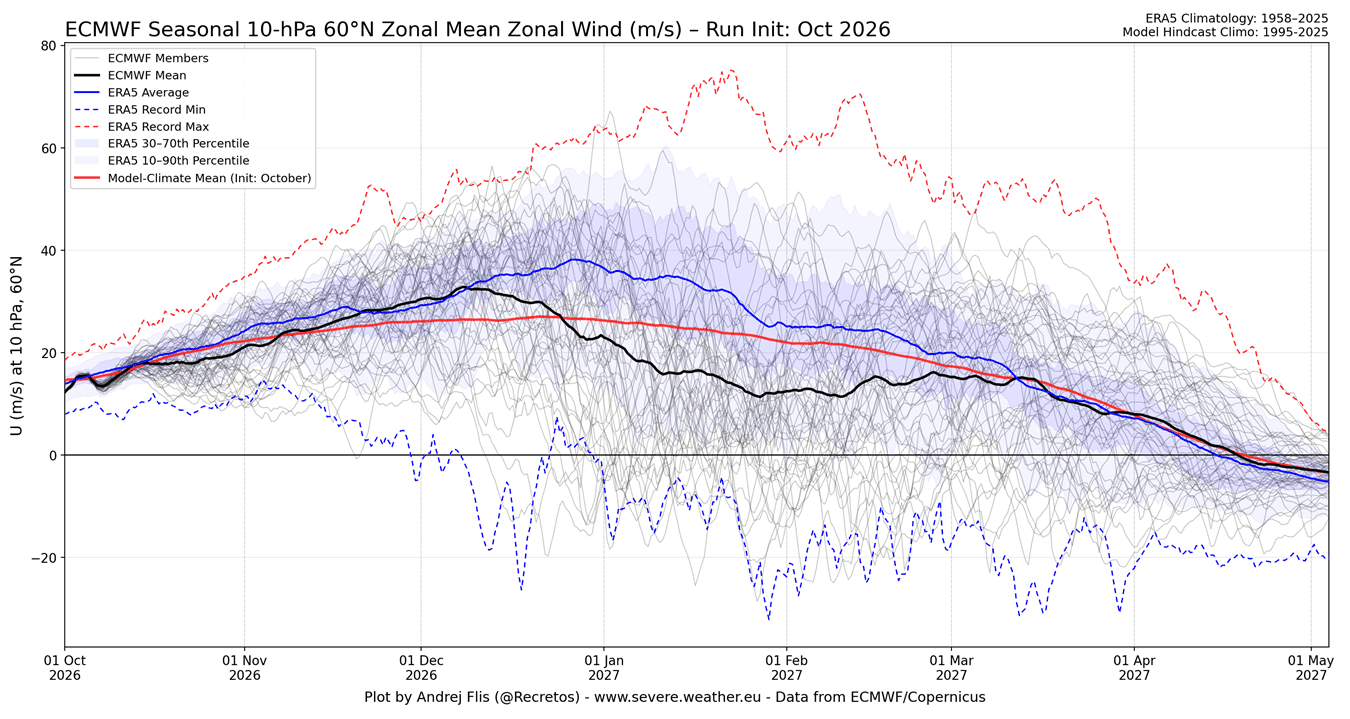
We see this same signal in the latest ECMWF seasonal forecast for Polar Vortex strength, measured by winds high in the stratosphere. The black line is the main forecast average, and the red line is the model’s long-term normal (hindcast). This forecast shows a proper wind deceleration with a strong below-normal wind signal indicating a weaker Polar Vortex in mid and late winter.
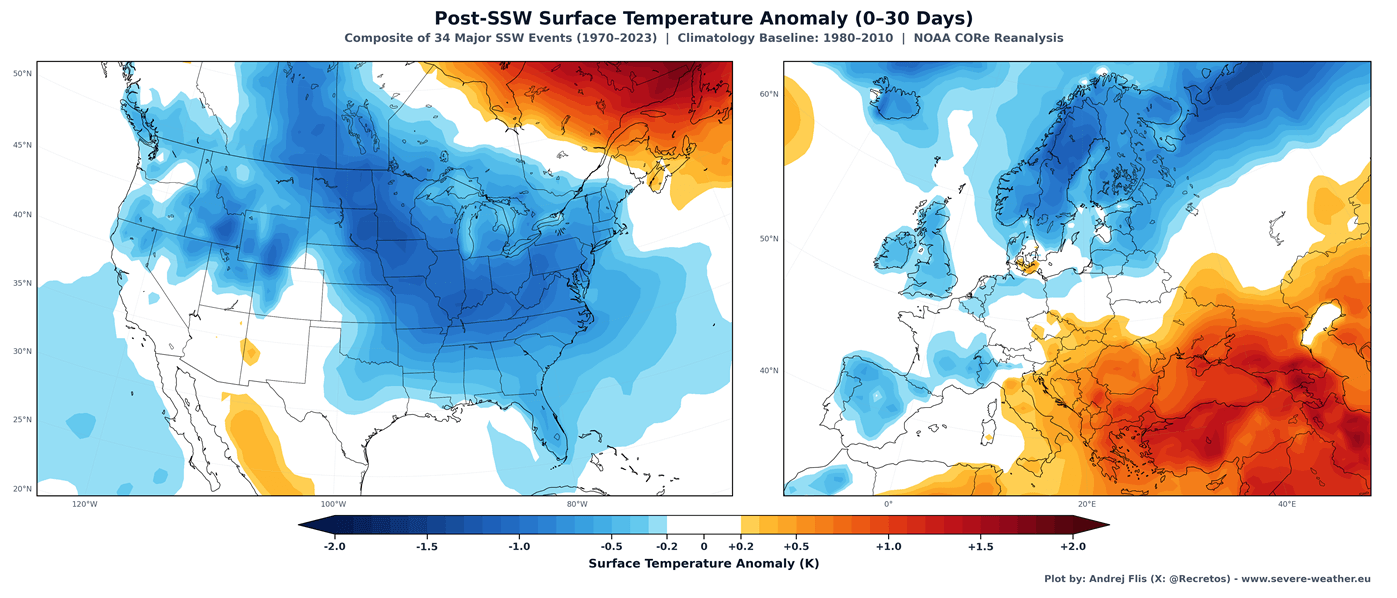
Below, you can see the average temperature 0-30 days after a full Polar Vortex collapse in mid-winter, based on combined data from 34 major SSW events. This shows that, on average, most of the United States and northern and central Europe are typically colder than normal after a proper Stratospheric Warming event at the right time.
Below is an example of such a disruption in a Super El Niño season, featuring mid-January 2016, during the last Super El Niño winter. You can see the stretched Polar Vortex with split cores in the lower levels. Pushed into mid-latitudes, these cores brought a cold outbreak to the United States, Canada, and Europe.
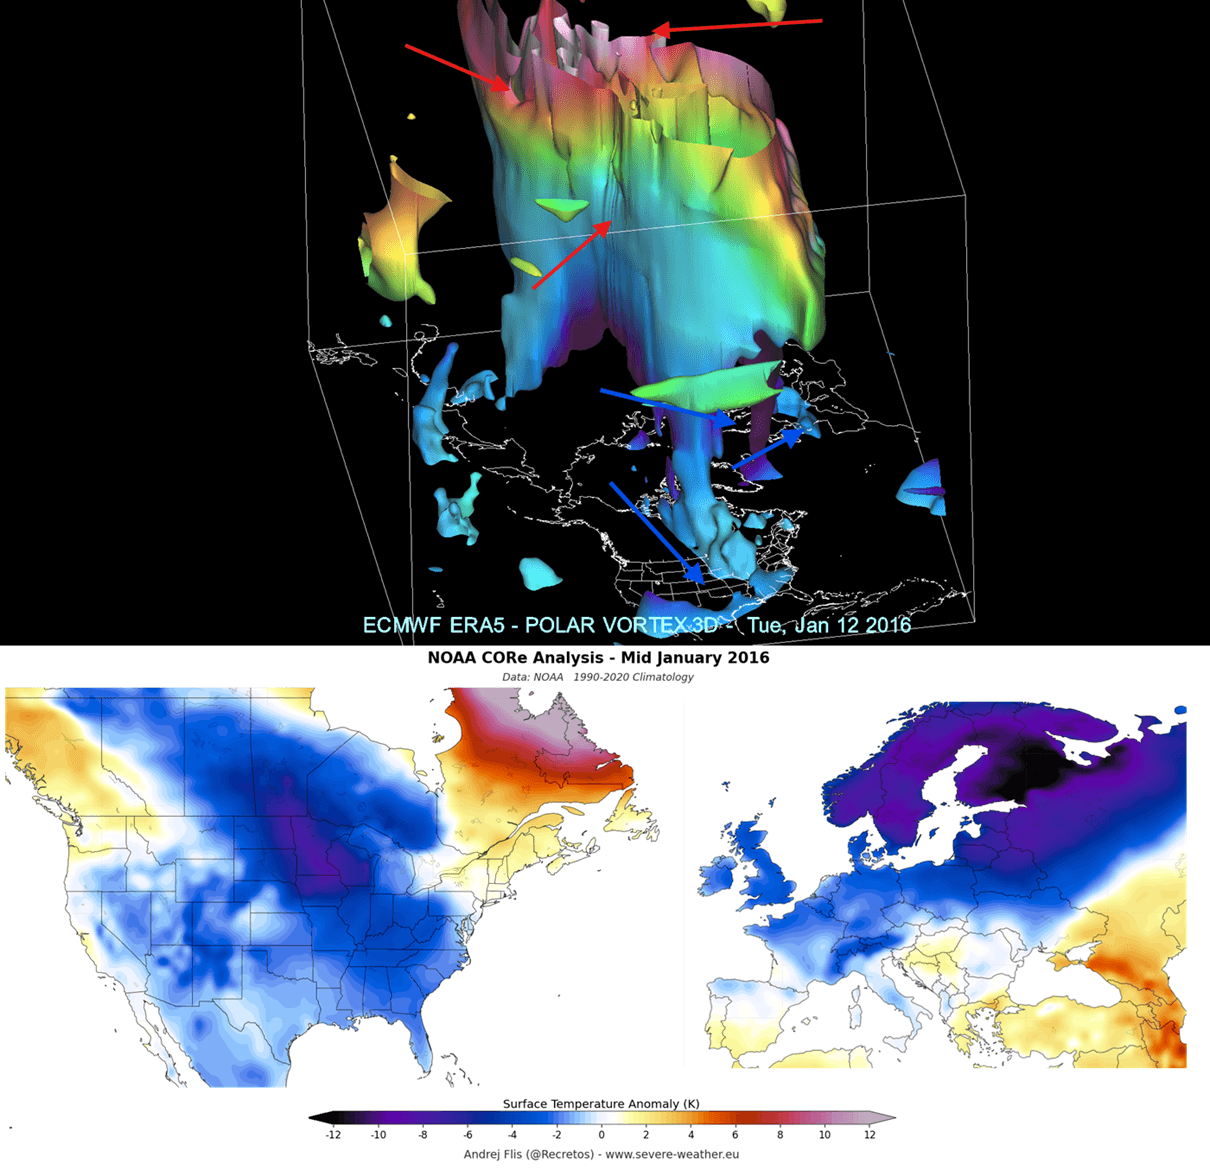
This shows the power that a Polar Vortex has in rapidly changing the course of the winter season across the whole Northern Hemisphere.
All our custom Polar Vortex graphics can be found live on the Polar Vortex Forecast hub page.
Scientific Research Used in this Article
- Extreme El Niño Teleconnections: A Distinct and Reproducible Teleconnection Pattern over North America during Extreme El Niño Events – Beniche et al. (2024).
We will keep you updated on the global weather pattern development, so bookmark our page. Also, if you have seen this article in the Google App (Discover) feed, click the like (♥) or the star button there to see more of our forecasts and our latest articles on weather and nature in general.