The Super El Niño in the Pacific keeps strengthening, forecast to slowly peak around late December, on track to become the strongest El Niño in over 70 years. Its impact is now clearly visible in the atmosphere, with a reshaped circulation that is starting to drive the weather patterns over North America.
November forecasts already look similar to past strong El Niño events over North America. But Europe is starting the month with a pattern completely opposite to what we saw in past El Niño Novembers.
In this article, I break down the latest El Niño data and the November forecast for the United States, Canada, and Europe, from early to late November. Then we look at how the seasonal models see the El Niño pattern carrying into Winter 2026/2027, with a southern storm track and colder conditions spreading across the southern and central United States.
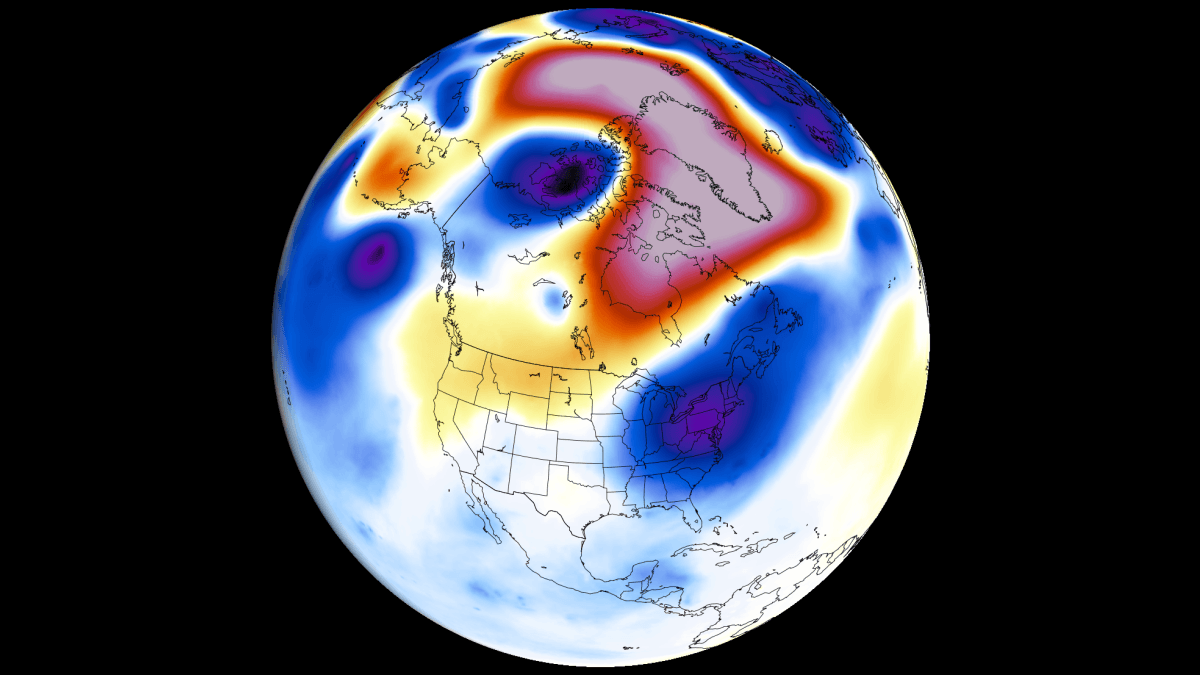
Super El Niño Is Already Reshaping the Tropical Atmosphere
The biggest weather driver in 2026/2027 will be the Super El Niño event, growing since spring. This is a warm temperature anomaly in the equatorial Pacific Ocean, creating major changes in global pressure and wind patterns.
The image below shows the usual changes an El Niño makes to the upward and downward atmospheric motion in the tropical regions, called a Walker Cell. It is especially sensitive to strong ENSO events. You can also see how atmospheric motion changes during a moderate versus a strong El Niño event, which impacts the global weather system through a strong atmospheric bridge.
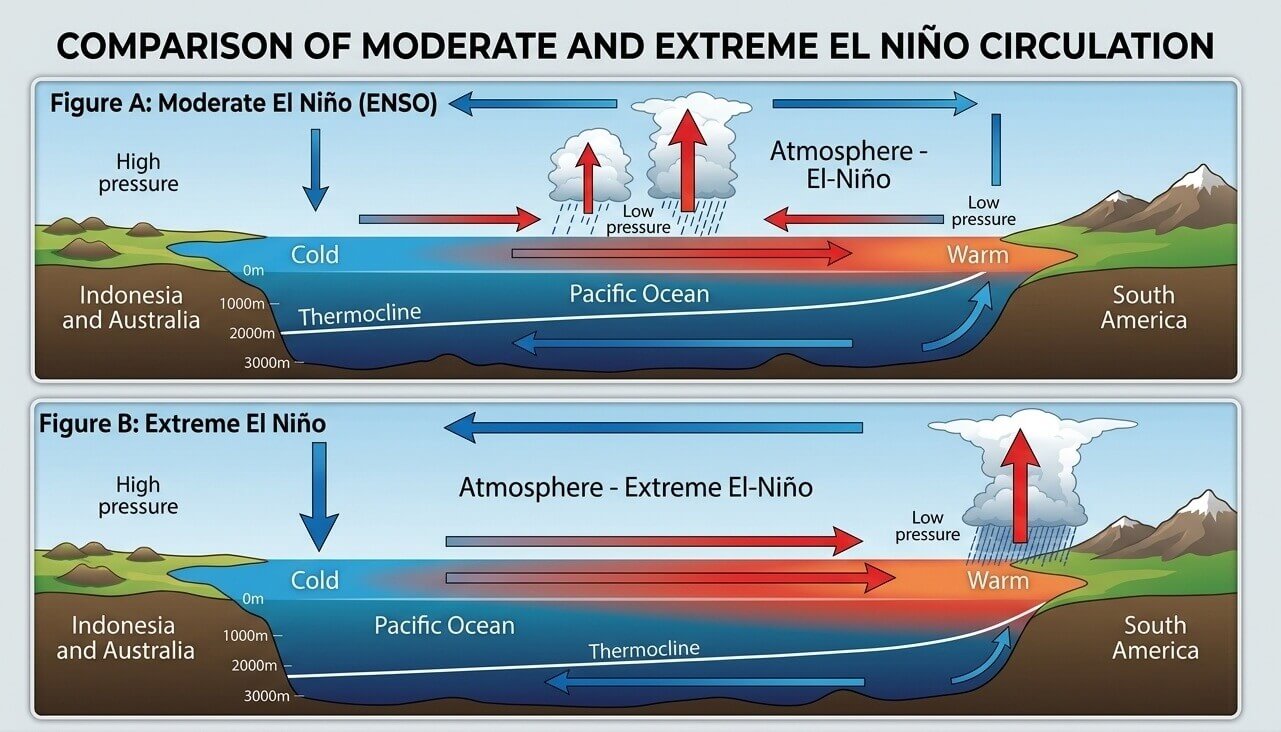
A strong or extreme El Niño causes a pressure drop in the central and eastern tropical Pacific and a high-pressure zone over the western Pacific. This strongly impacts tropical rainfall and pressure patterns, which then filter into the mid-latitudes and the global weather system.
You can actually see this in the analysis below, which shows this change in the atmospheric flow for the last 15 days. It shows strong rising air motion in the central and eastern Pacific (blue) over the El Niño area. A strong sinking motion (red) was detected in the Maritime area, showing a highly modified Walker Cell and a clear Super El Niño-related atmospheric signal.
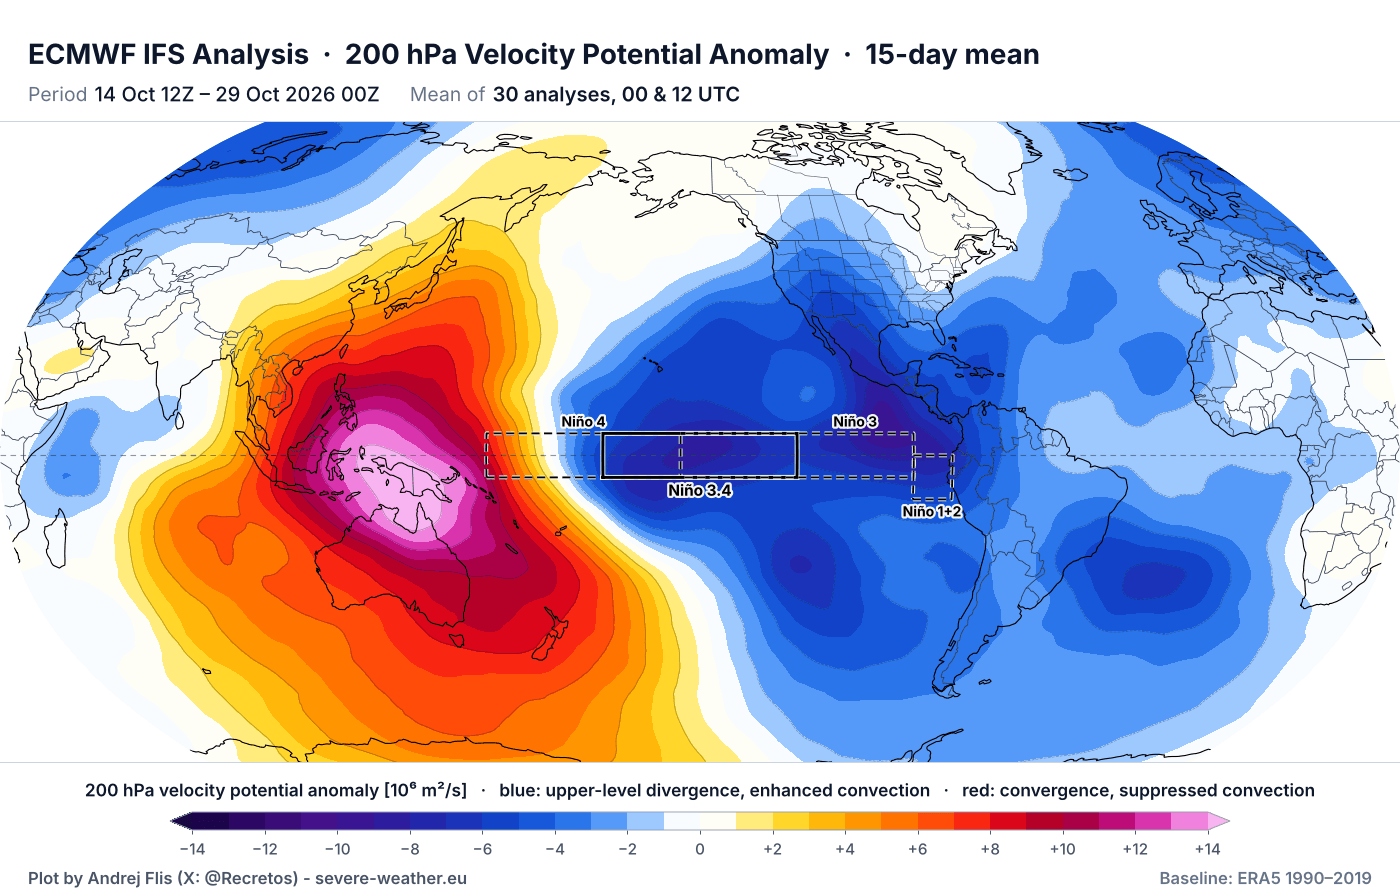
Overall, this confirms a strong Super El Niño signature in the atmosphere, set up for the 2026/2027 season. It is also clearly visible in the daily weather patterns, and getting stronger toward Winter, as you will see in the November forecast.
Below, you can see the latest Super El Niño event analysis, produced from NOAA CRW data. It shows a significant ongoing event in the tropical Pacific, with peak anomalies exceeding +8°C (+14.4°F) above normal. This is a strongly east-based El Niño event, meaning the peak anomalies are further east than usual.
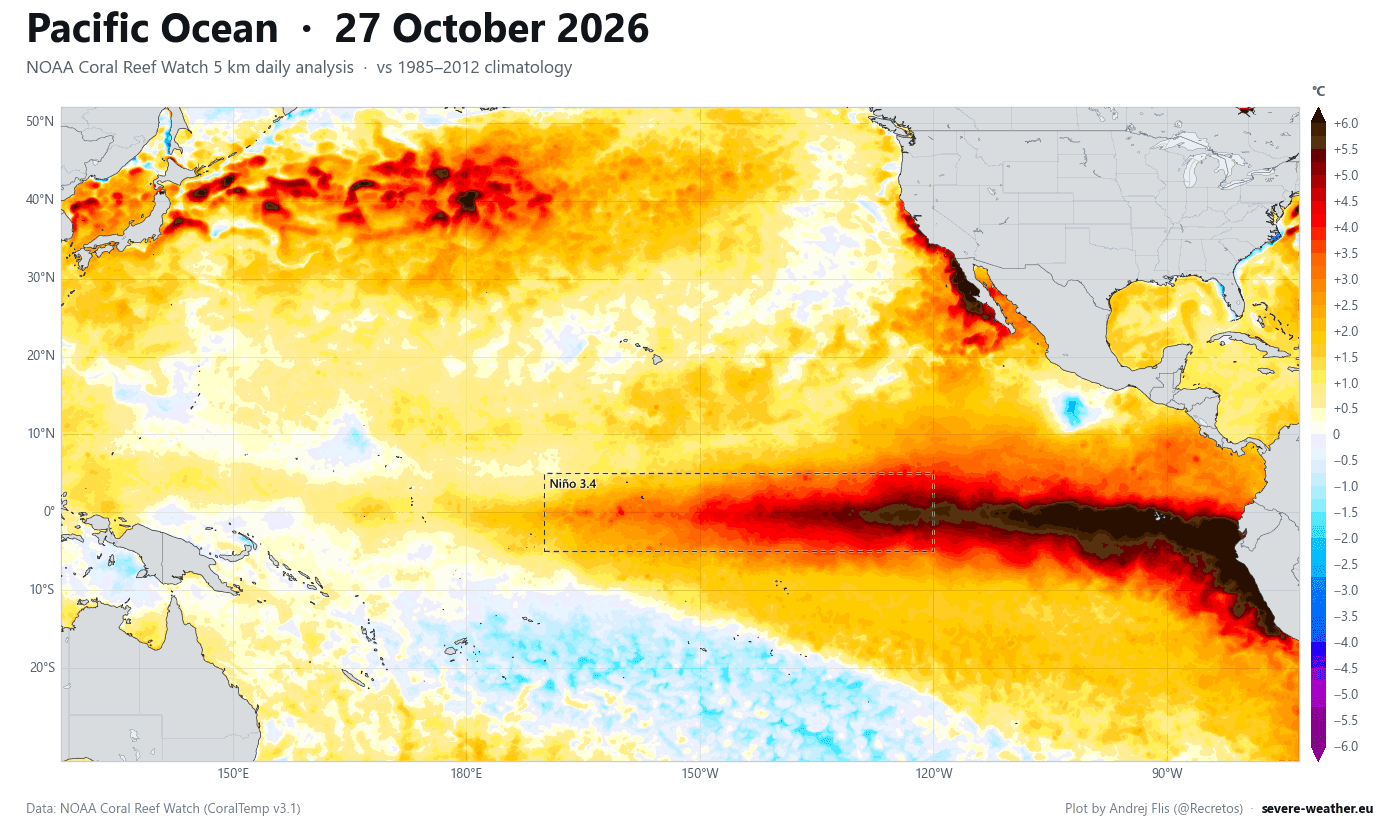
A Super El Niño event leads to more extreme weather shifts, amplifying seasonal changes with high-impact weather events, and significantly altering the location and strength of pressure systems. This is already being observed in the current weather patterns.
At this point, I also have to mention the ongoing Polar Vortex disruption in the stratosphere, with a Stratospheric Warming event. The forecast shows a flow reversal in the stratosphere, which usually impacts the weather below, but this season, the situation is a bit unusual with the strong Super El Niño influence.
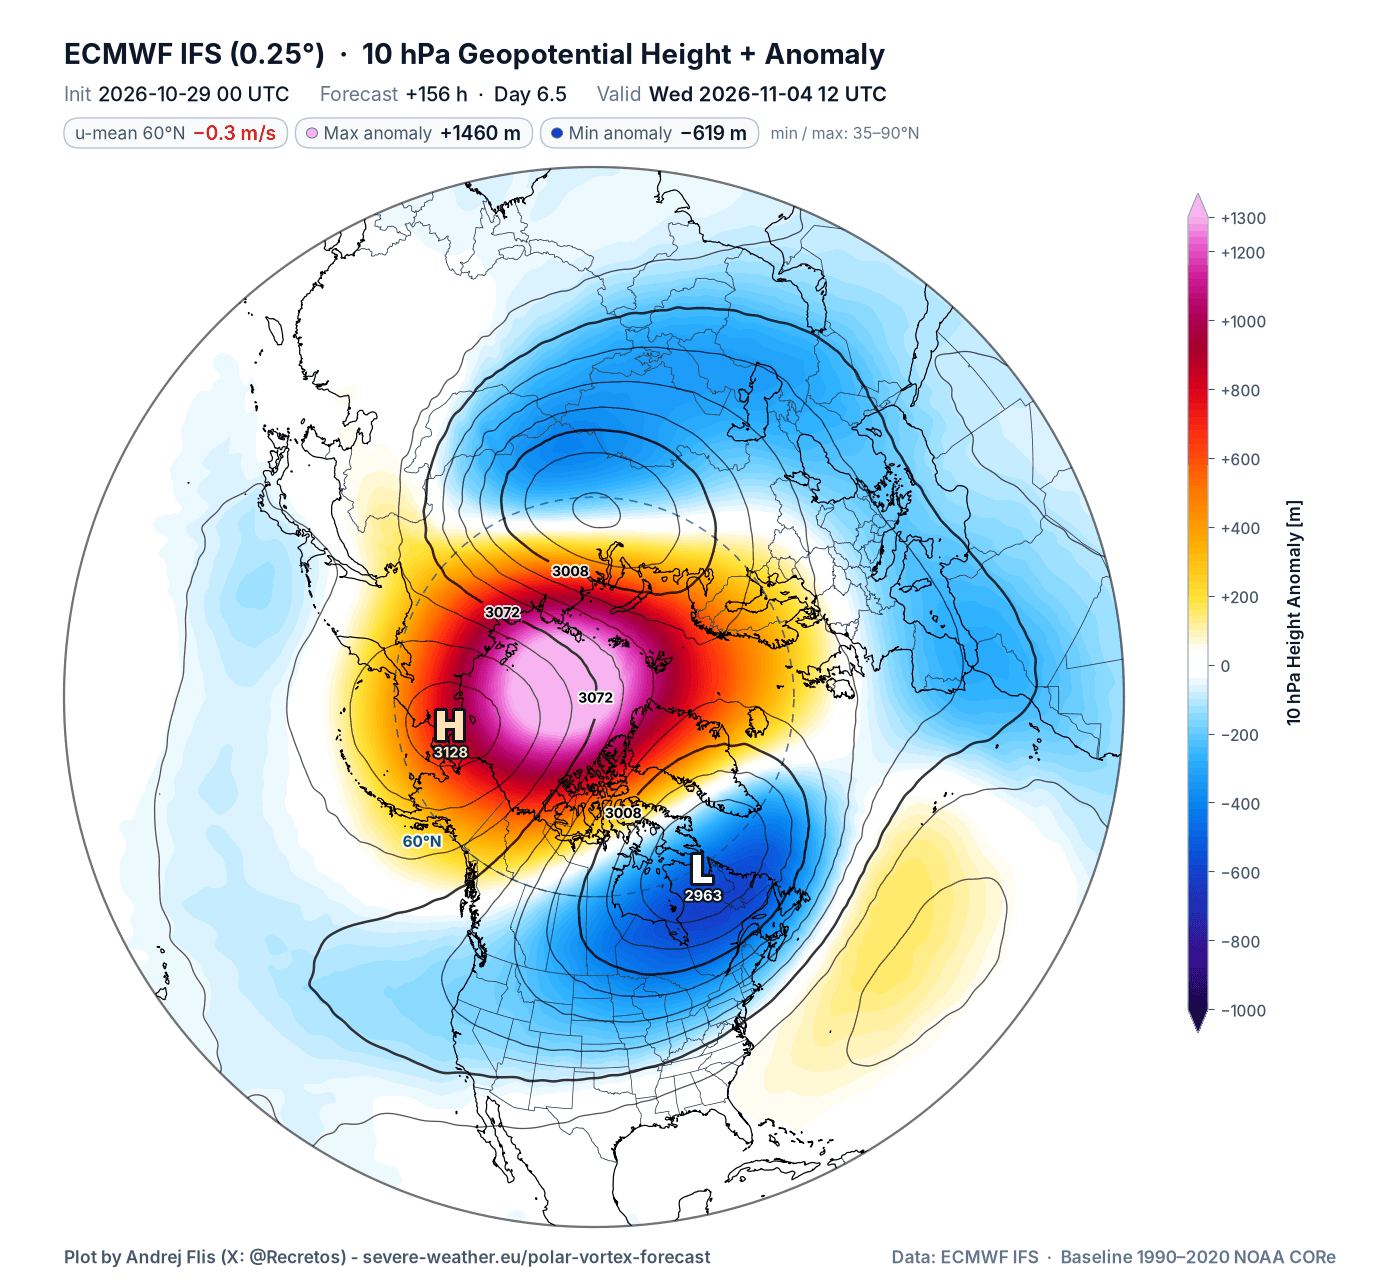
These events can have a delayed impact downward, sometimes up to 3 weeks or more. For that reason, I will write separate updates on this event and its impacts. And in this article, we will look at the weather development as a whole, with all the signals included and what stands out.
Atmospheric Bridge: November Global Circulation Under El Niño Control
Going back to the main driver of the 2026/2027 season, this El Niño is like the overall conductor of the global weather patterns. While there are other events like the stratospheric disruptions, the main flow of the season will be driven by the Super El Niño.
The forecast below shows an El Niño event at extreme levels, strongly exceeding the Super El Niño threshold (+2 degrees) and reaching into the +3 range. This has an immediate impact on weather patterns, and it also shows the event projected as the strongest El Niño in over 70 years, based on the ERA-5 data records.
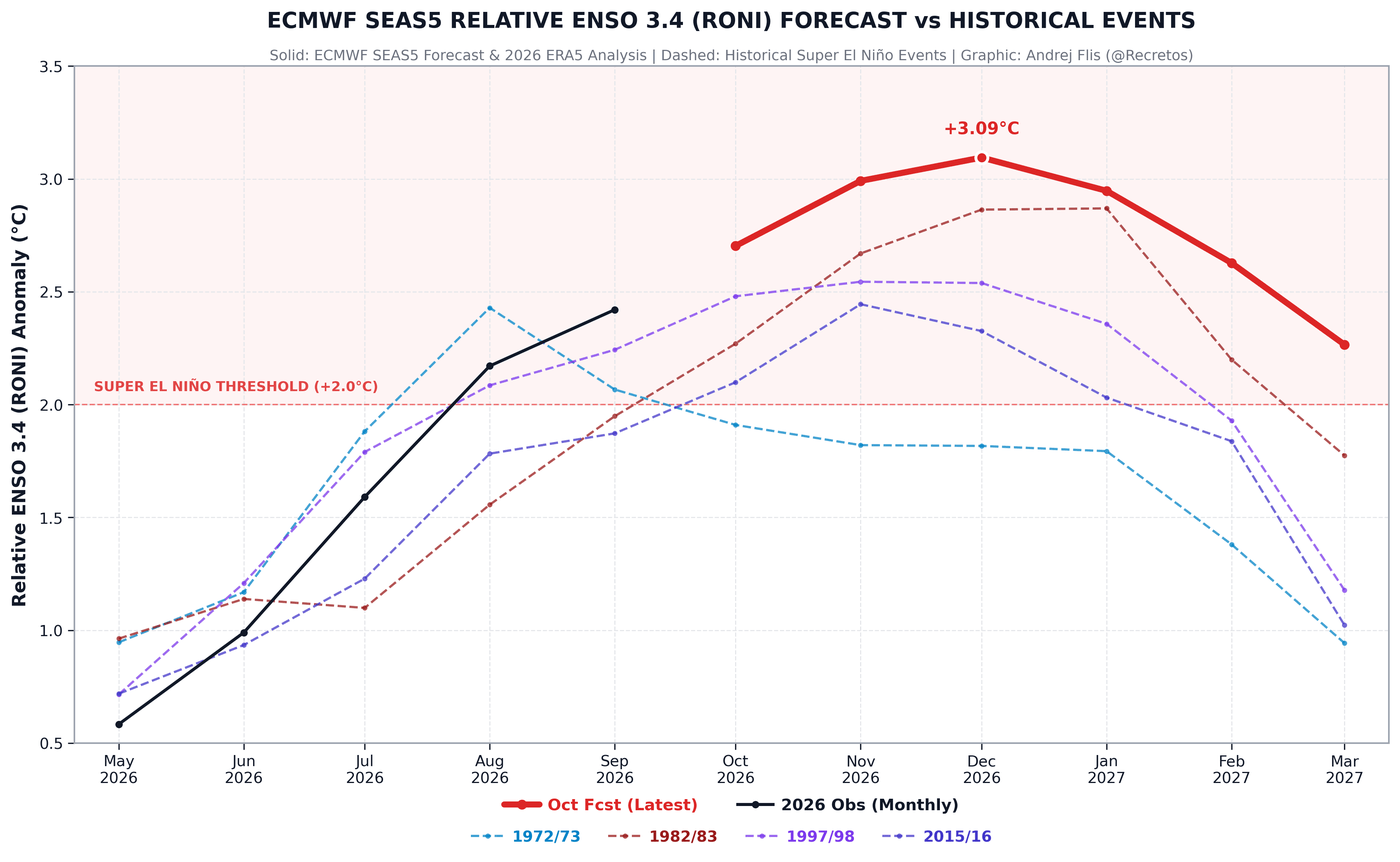
The whole progress of this event shows a story of rapid strengthening. And this is easy to see if we look at the progress of ocean anomalies over the past weeks, shown in the video below. It reveals a rapid onset of strong warm anomalies, which usually also means a rapid influence on the atmosphere.
We can already see the atmospheric signature of the Super El Niño in the atmospheric flow, as shown in the previous segment. Below is the ECMWF forecast trend for atmospheric motion into mid-November. You can see a large, persistent area of rising air over the El Niño region in the central and eastern Pacific, and sinking air over the Maritime area, a typical Super El Niño atmospheric circulation.
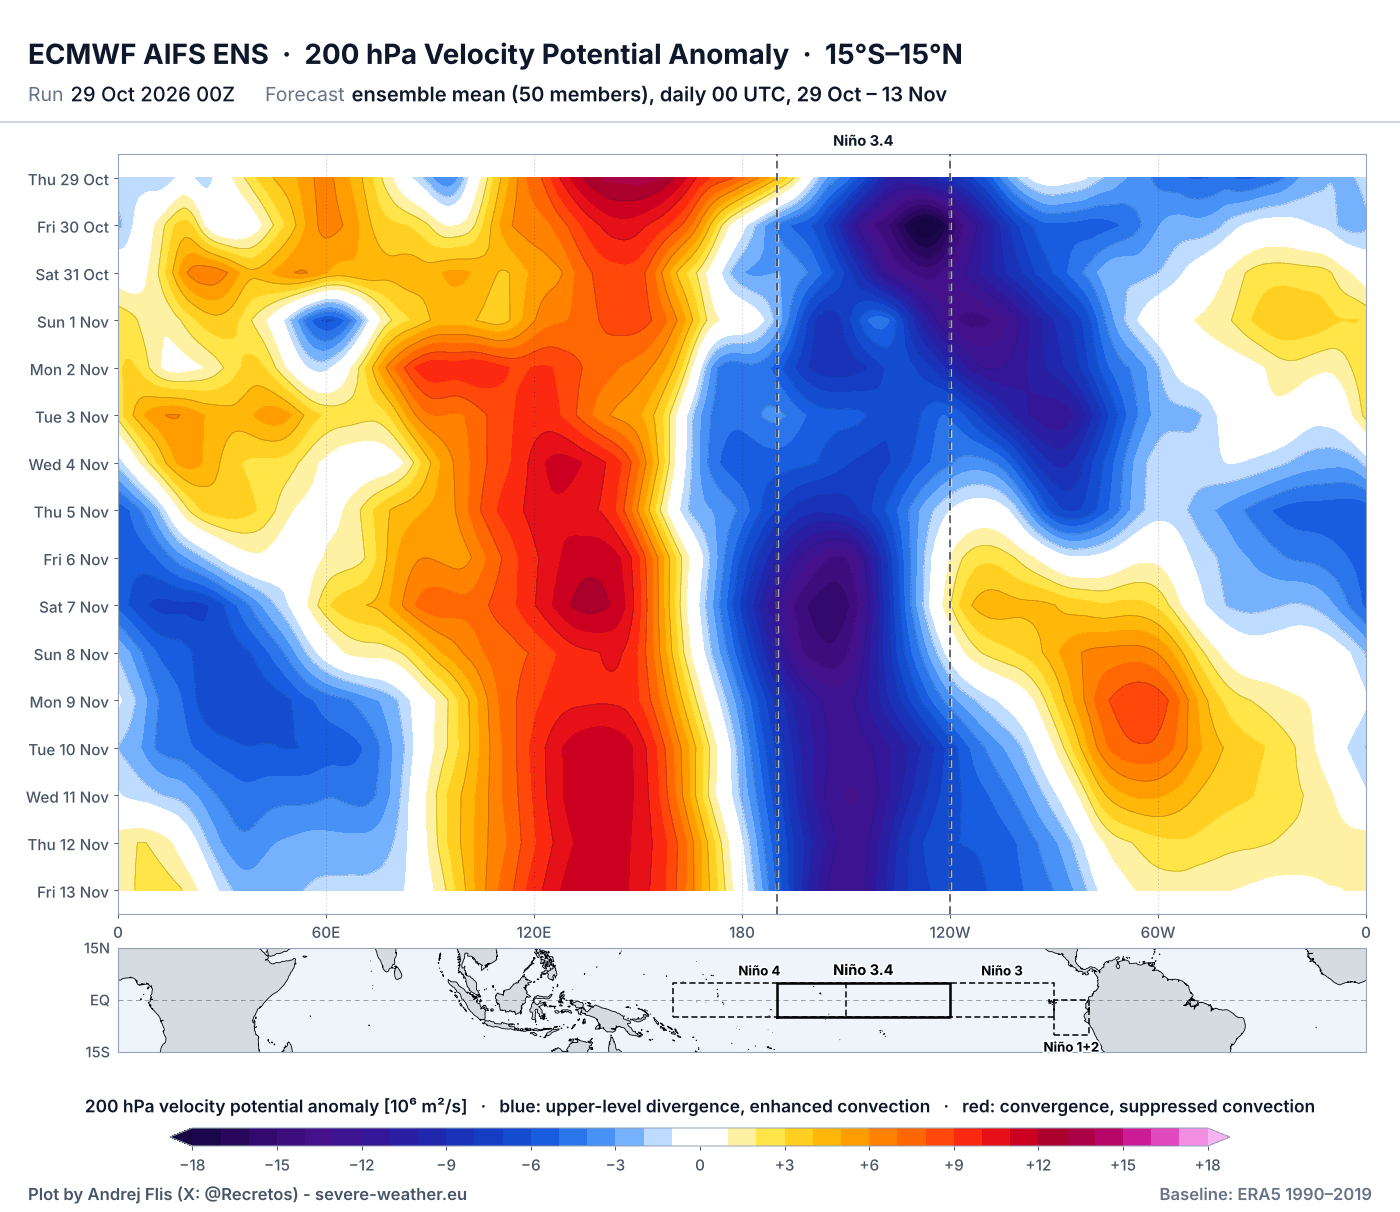
Given the forecast pattern and its stability, this atmospheric flow is forced and locked in place by the unusually strong El Niño anomaly in the Pacific. Scientists call this an atmospheric standing wave. It is an almost stationary area of rising air and low pressure over the tropical Pacific and the ENSO region, forced by a Super El Niño event.
This gives high confidence in visible weather pattern impacts over November 2026. And given the proximity of the El Niño to North America, that is where the bulk of the impact will be felt first in the Northern Hemisphere.
Below is the November pressure-pattern signal from past strong and super El Niño years, based on ERA5 data. We can see a building low-pressure area over the central and southern United States, driven by the powerful Pacific jet stream from the El Niño. This brings lower temperatures into the western and southern United States.
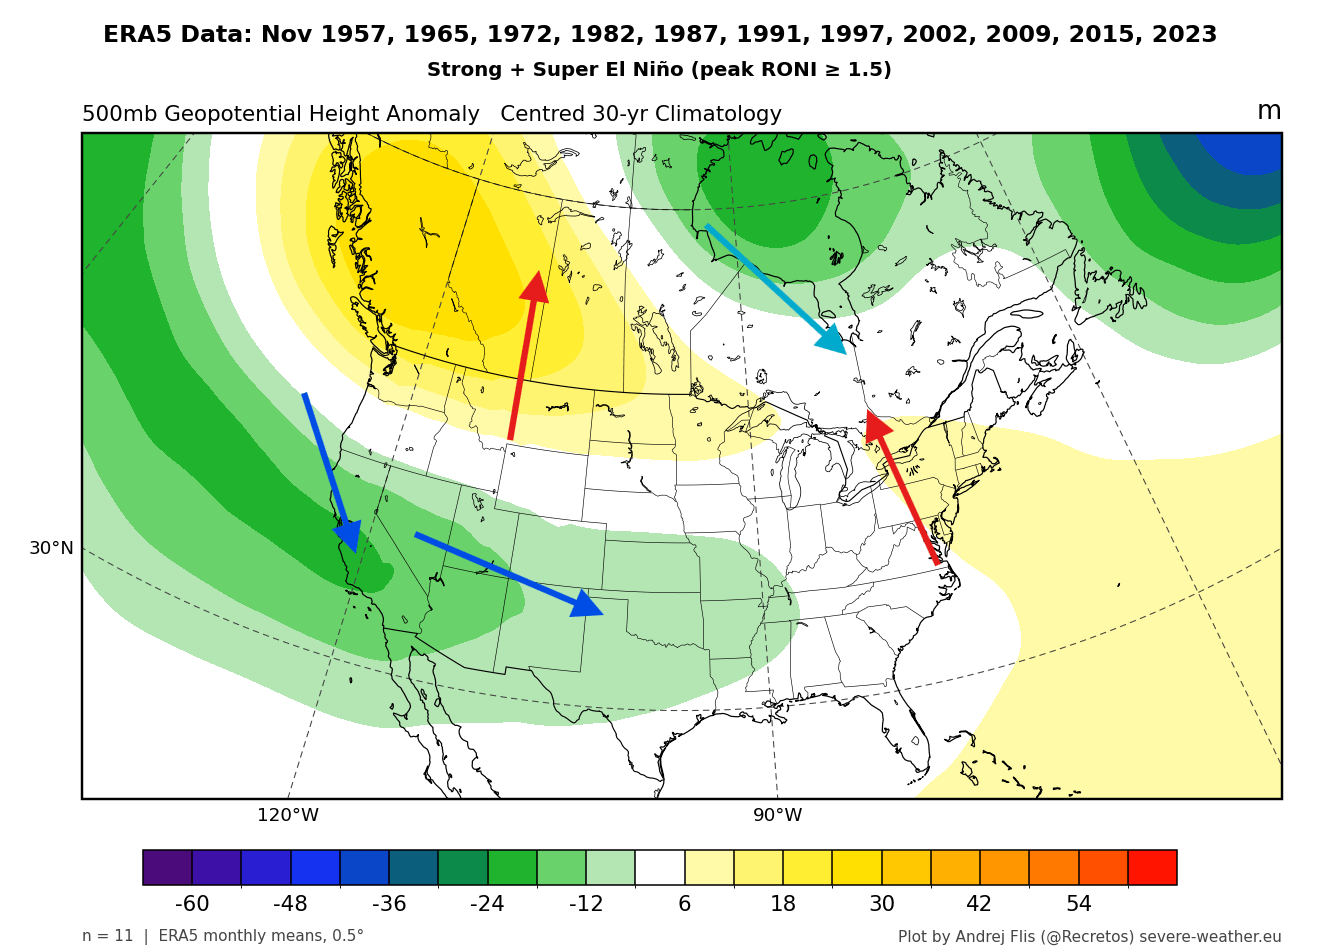
A high-pressure zone usually develops over western Canada, over the northern U.S. and into the northeast. This means a tendency for above-normal temperatures over these regions, in a more southerly or southwesterly flow.
Over Europe, we can see these years bringing a low-pressure trend into the North Atlantic, extending over the whole of northern Europe, and a ridge over the southern half. This brings warmer temperatures into the continent, except for the northwest, north, and the southeast.
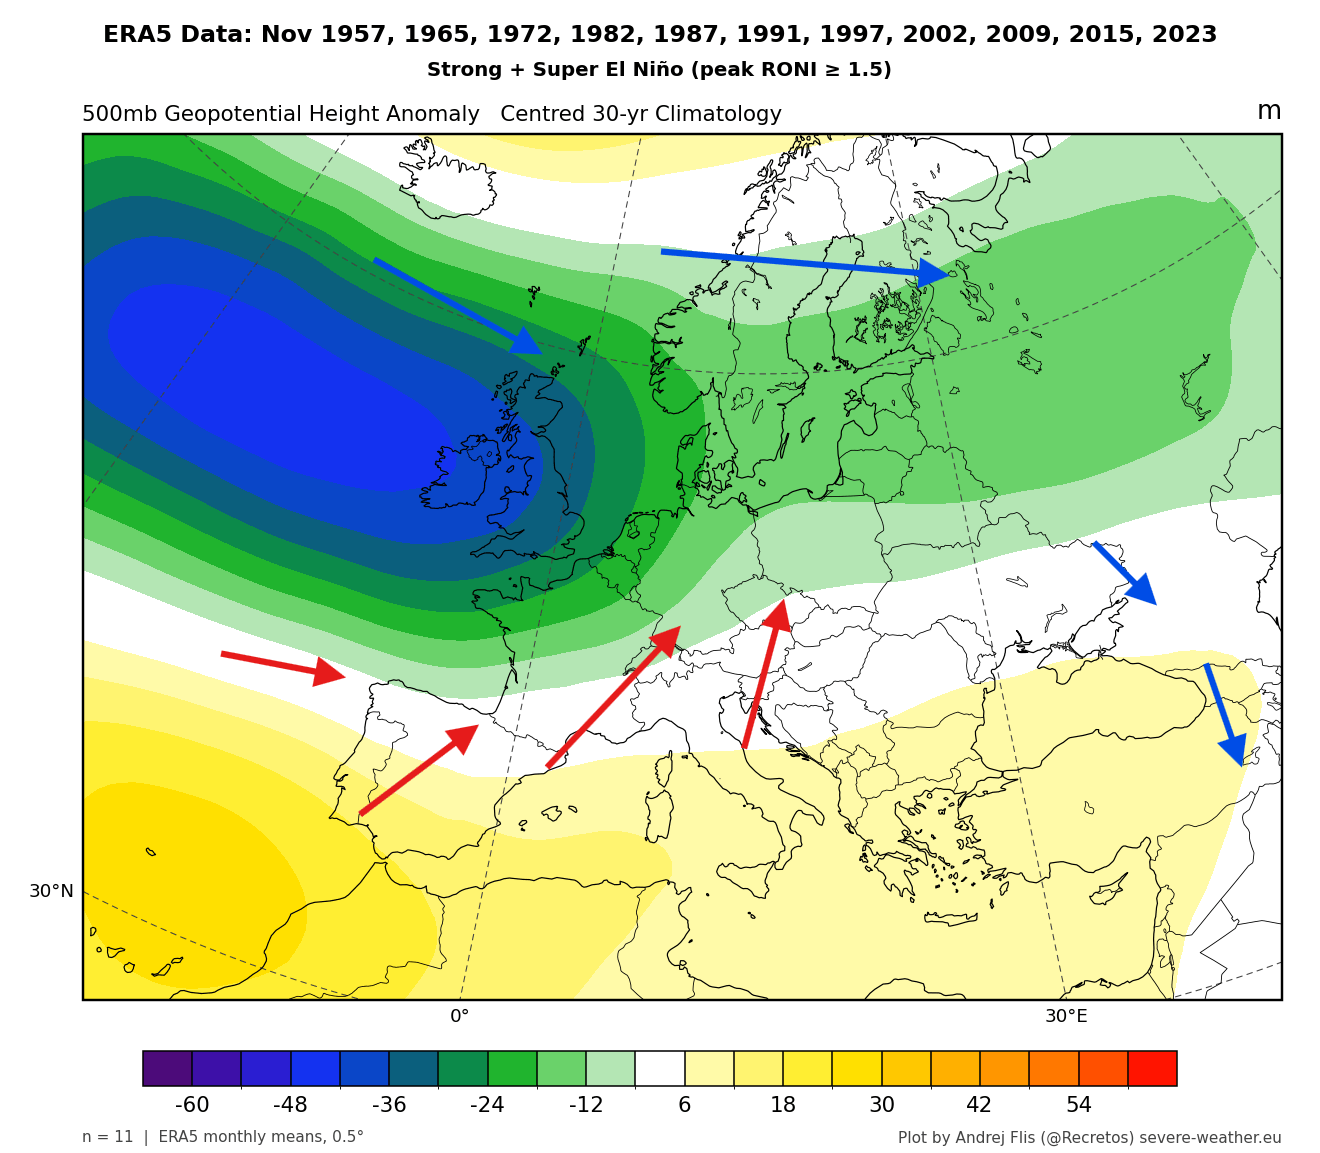
These are just the past November trends, based on strong or Super El Niño events, with differences between individual years. But the latest forecast trends are actually starting to pull in this direction toward winter, as the El Niño takes over the atmosphere into late Fall and early Winter.
Early November: Warm Start for North America, Blocking High Over Europe
Looking into the first third of November, you can see the pressure pattern forecast below. It shows a high-pressure anomaly over Canada and the northern United States, with a low-pressure zone over the North Pacific. This is a typical El Niño look, and it also amplifies the Pacific jet stream, with a hint of a low-pressure zone starting to build into the southern United States.
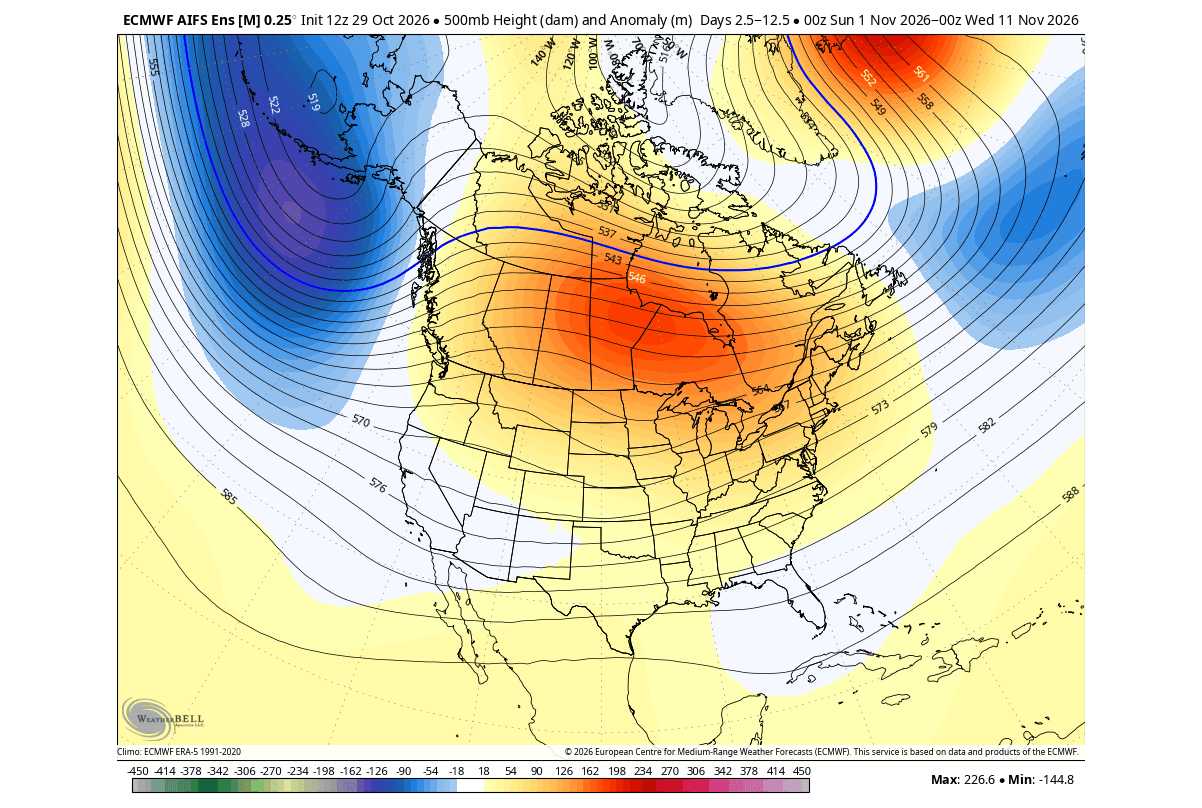
This closely matches the November pattern of past strong and Super El Niño events, as shown above. With an El Niño event for the record books and centered very far east, we expect to see a faster push of its typical weather forcing.
The surface temperature pattern for this period is also very revealing. Most of the United States and the southern half of Canada are running above normal. This is due to the build-up of a high-pressure anomaly and a strengthening Pacific jet stream, pulling warm and moist airmass into the continent on a westerly to southerly flow.
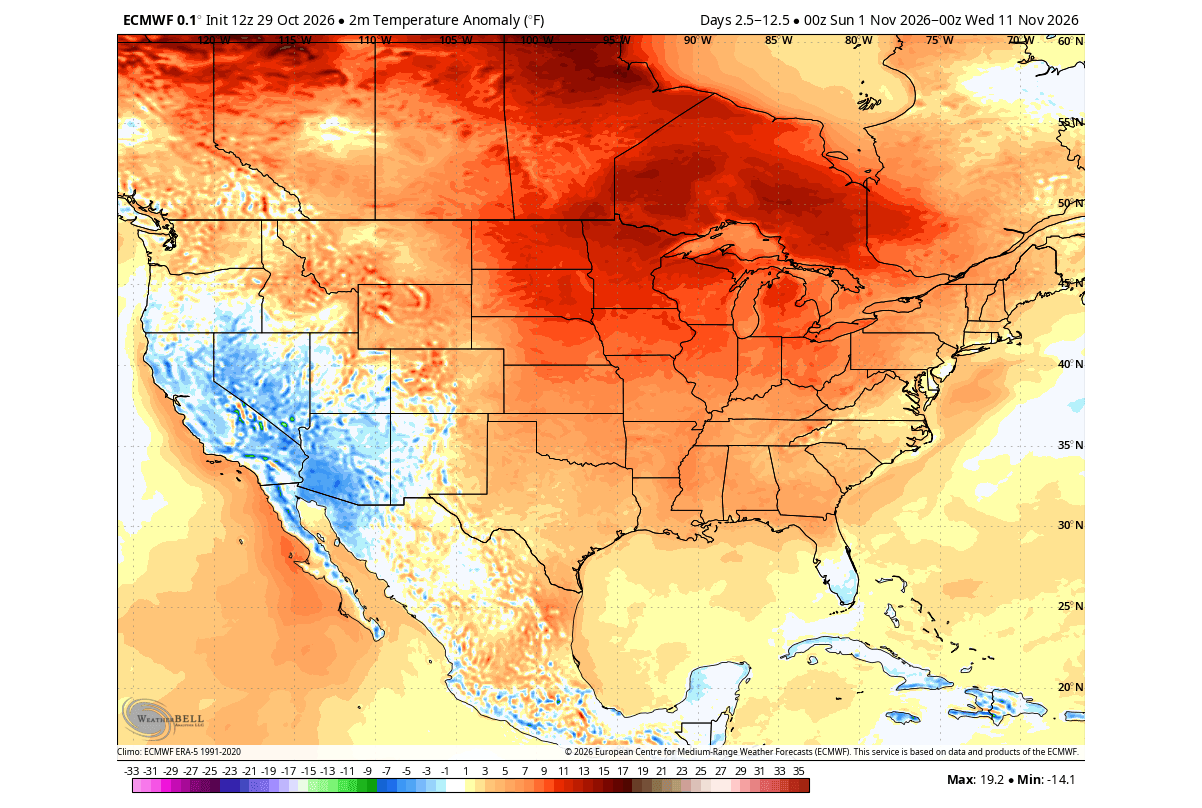
A lower pressure area will bring normal to below-normal temperatures across the southwest, with unsettled weather.
The precipitation anomaly forecast also shows more rainfall in the first third of November over much of the southern and north-central United States and far southern Canada. Especially over the southwest U.S., which is in the direct impact of the amplifying Pacific jet stream, and along the western coast of Canada and southern Alaska.
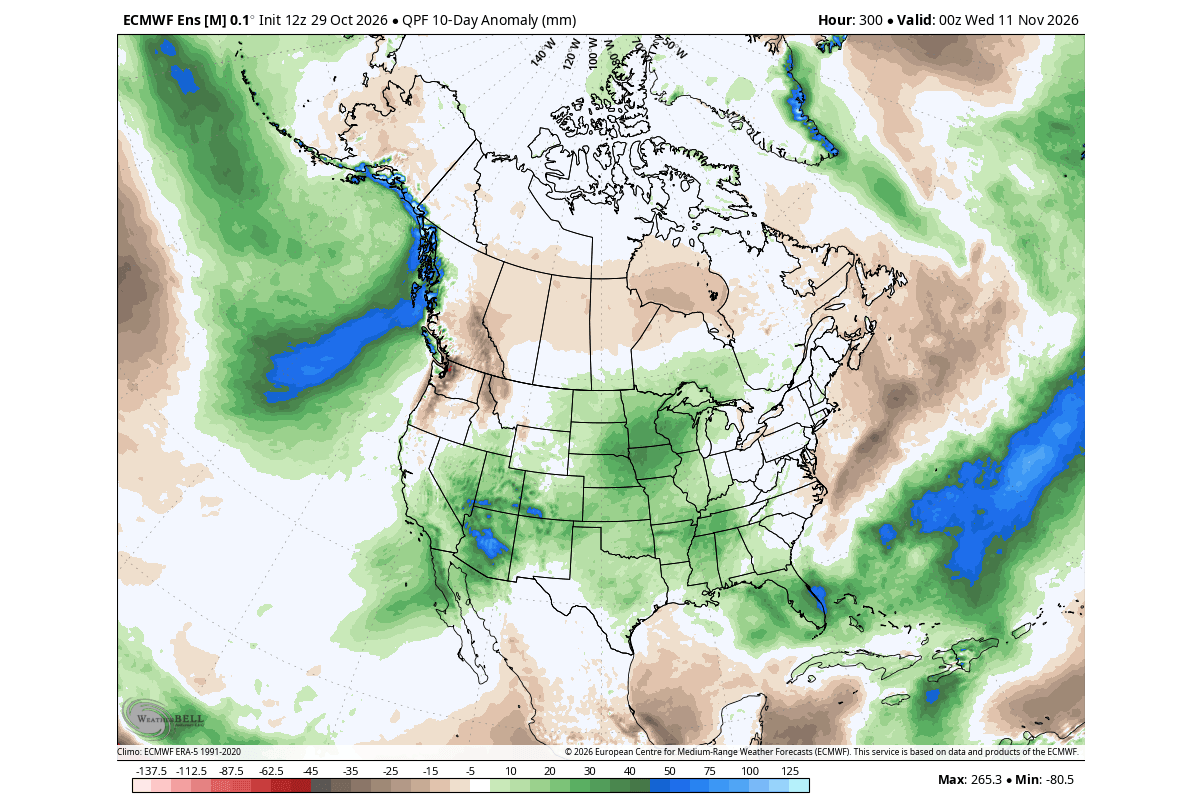
We can see less precipitation across the Pacific Northwest, west-central and eastern Canada.
But despite a very warm and wet look over the whole first third of November, there are some hidden details in that average. We can look at single-run forecasts to spot examples of potential weather scenarios that can still evolve in a dominant Super El Niño November.
Below is a single-run example of a local forecast idea for a colder-than-normal airmass over the Ohio Valley, the Mid-Atlantic, and the interior Northeast around November 7th. Here, the 850mb airmass temperatures run 8°C to 10°C (14°F to 18°F) below normal.
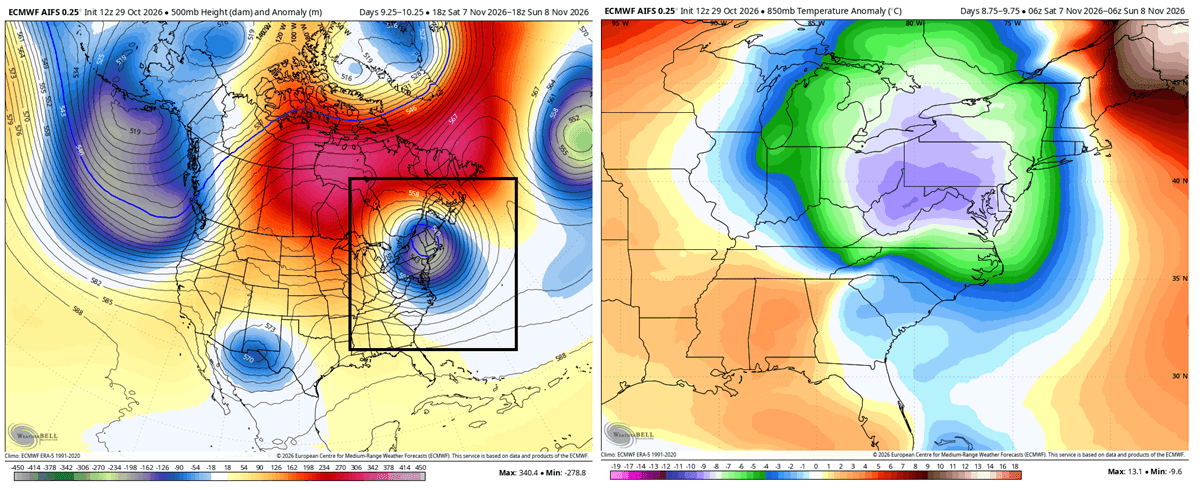
Colder-than-normal air also reaches westward into the eastern Midwest and Great Lakes (including Michigan, Indiana, and parts of Illinois and Wisconsin). The far Northeast and Atlantic Canada remain mild, as a strong Canadian blocking ridge keeps cold air from flowing into northern Maine and southeastern Canada.
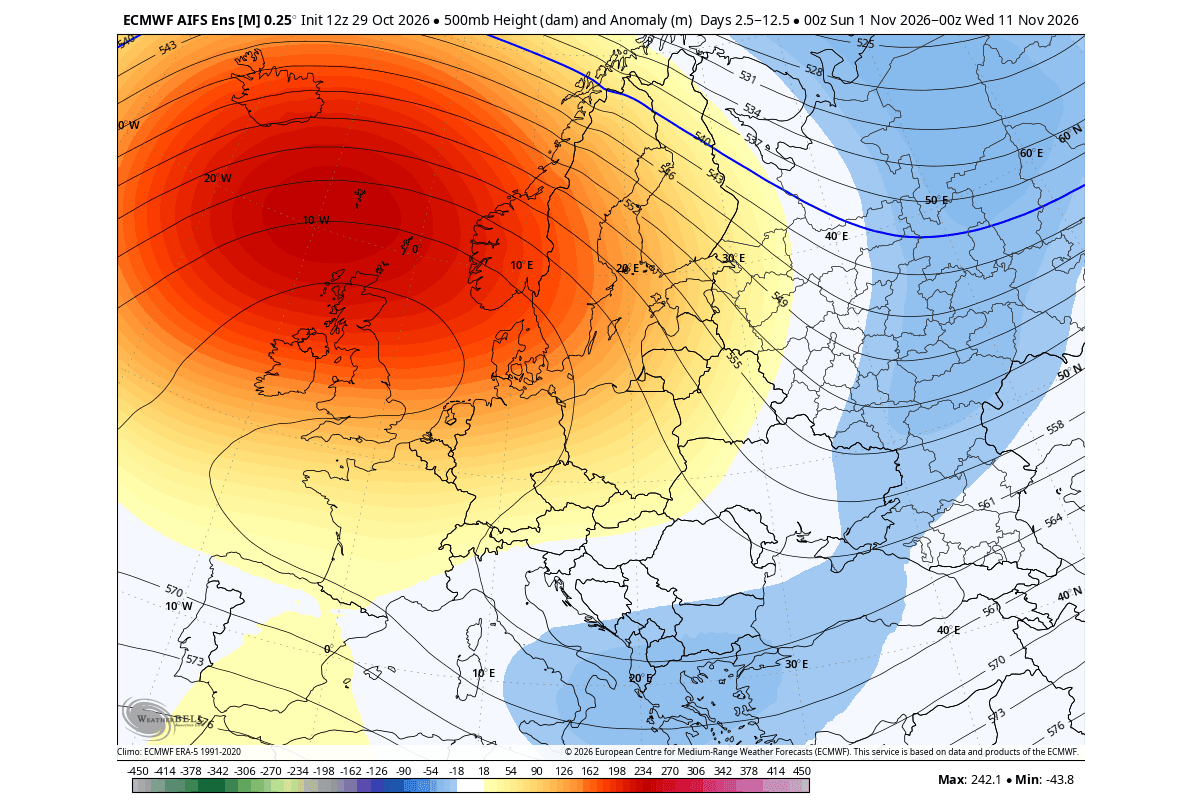
But over Europe, November is starting quite the opposite of what is typical for a Super El Niño November. Instead of a broad low-pressure area, we can see a strong blocking high over northwestern parts, forming a so-called omega block, with a low-pressure zone south and east.
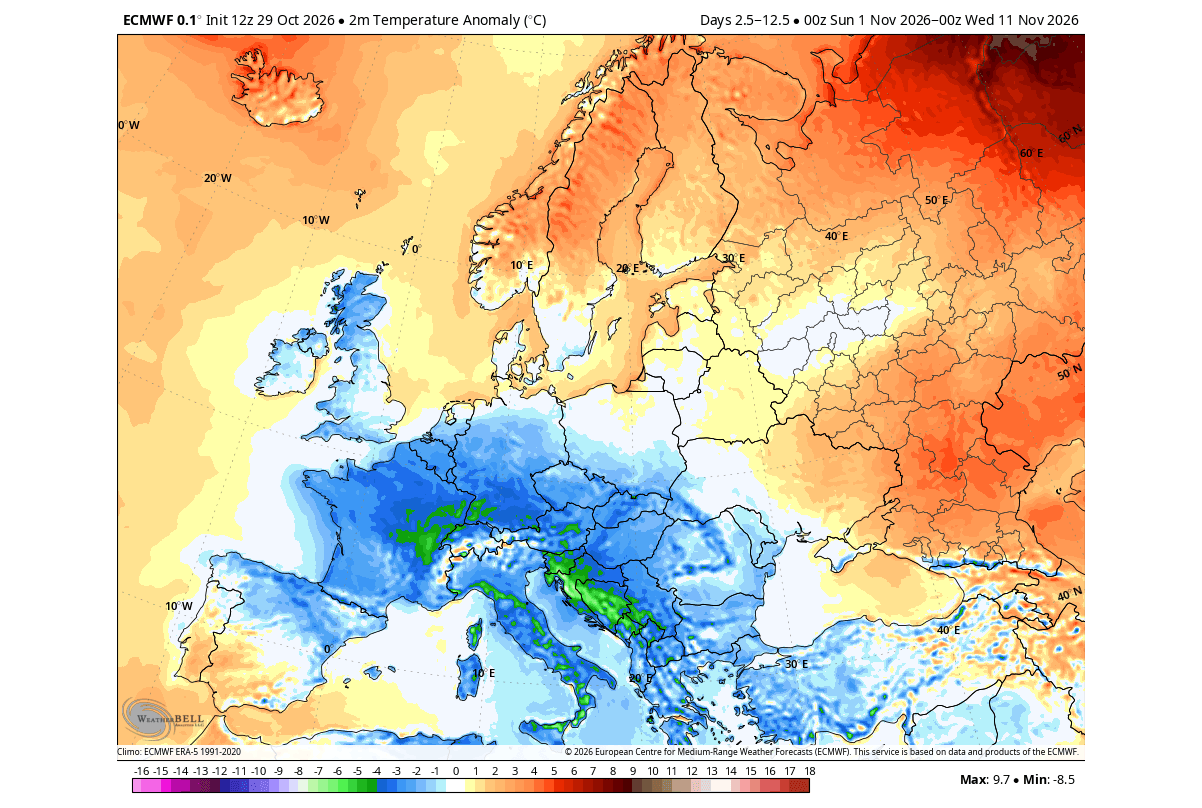
The temperature response follows the change to a more northerly to northeasterly flow. This brings below-normal temperatures into the northwestern, central, and southern parts in the first third of November.
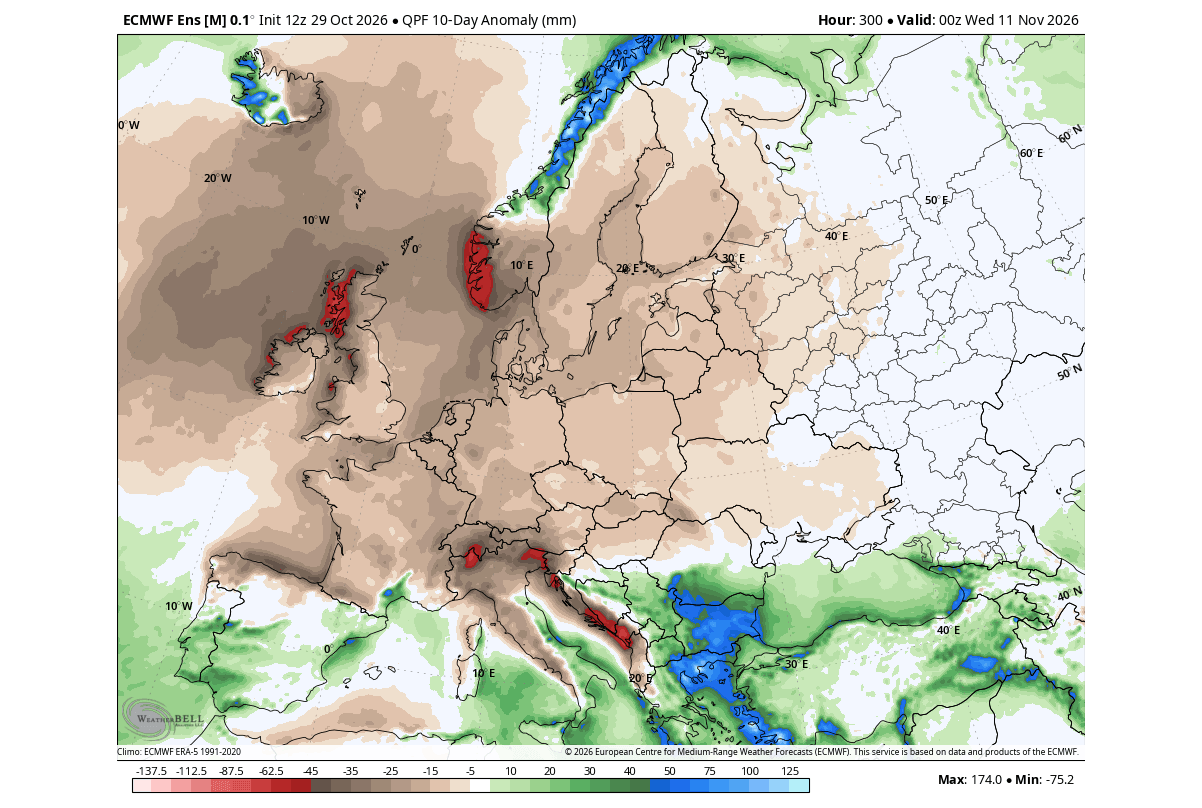
A high-pressure anomaly also means more stable air, with below-normal precipitation over a large part of the continent. More rainfall is forecast over the far south and southeast due to low-pressure areas in the region.
But as we head into mid-November, the El Niño impact is even more noticeable, starting to shift towards a pressure anomaly pattern that is more typical for the first half of winter.
Mid-November: A Strong El Niño Pattern Takes Shape Over North America
For this range, we are shifting to an extended range model. These models are good for spotting early development trends and can be more effective in seasons with a strong driver, like the Super El Niño in 2026/2027.
Below is the latest extended ensemble forecast trend for around mid-November. The pressure pattern below shows the more typical strong El Niño signature: a block over Canada, an El Niño low in the North Pacific, and a low-pressure trail across the southern and southeastern United States that extends into the Atlantic.
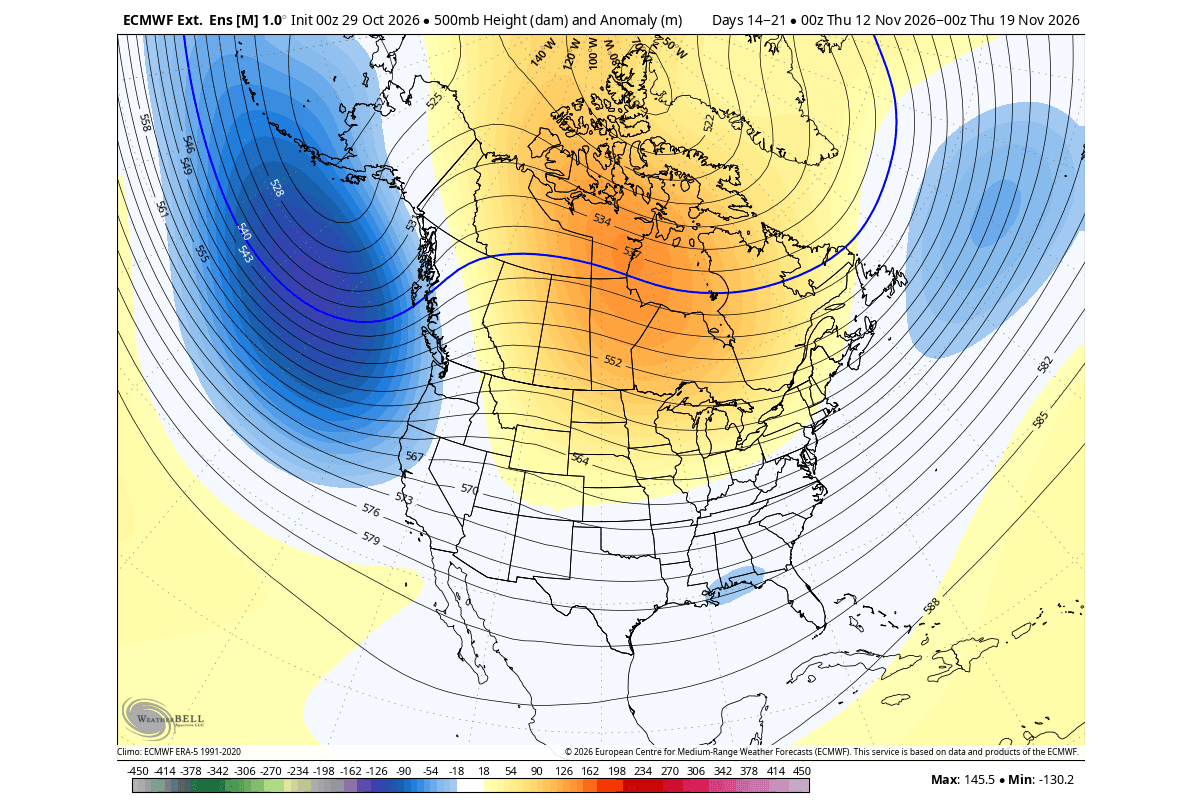
This is almost exactly the pattern we usually see in early to mid-winter in other El Niño seasons. But with the 2026 event being so strong and east-based, it is likely making a stronger push with its forcing over North America.
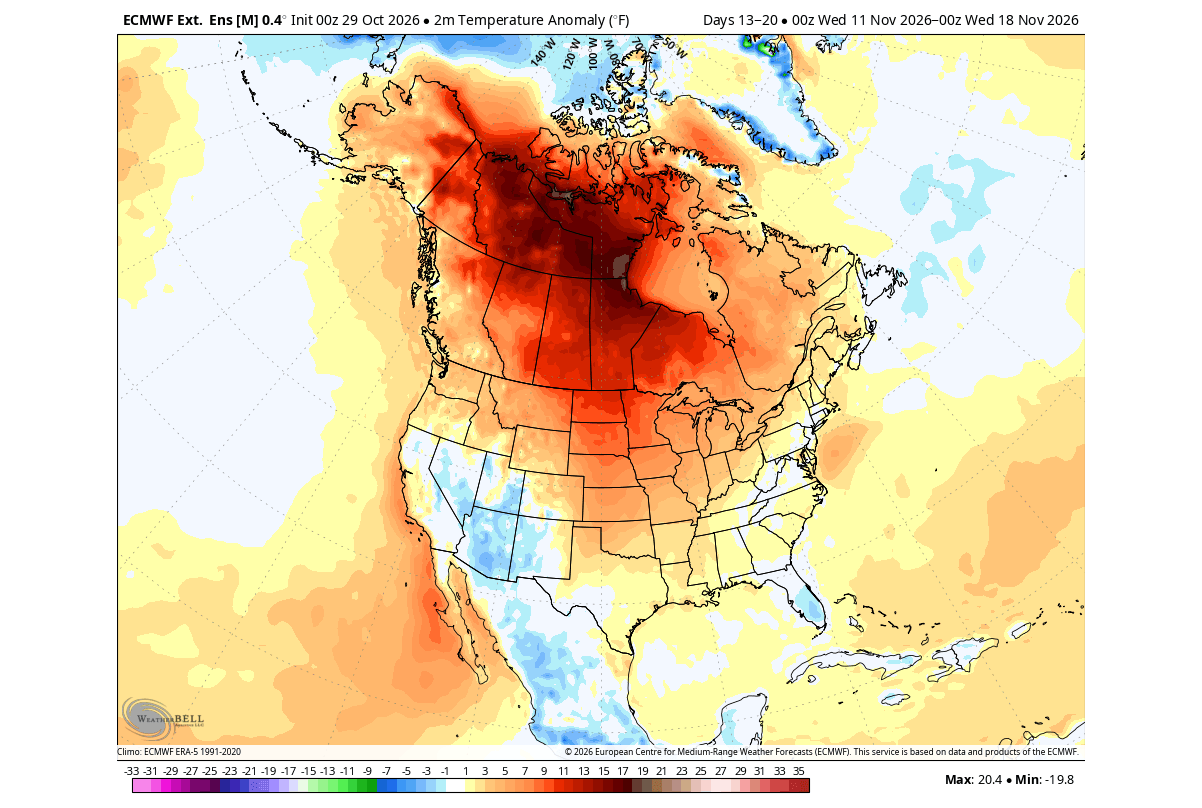
The temperature trend for mid-November shows a large above-normal anomaly over Canada and the north-central United States. This is a typical strong El Niño pattern, with the warmth rising to the north, and the Pacific jet stream bringing unsettled weather and lower temperatures into the southern United States.
The precipitation forecast for this period shows above-normal precipitation across the western United States and Florida. This is driven by an amplified westerly flow from the Pacific, which also brings a strong rainfall anomaly over California. Below-normal precipitation is found around the Great Lakes and eastern Canada.
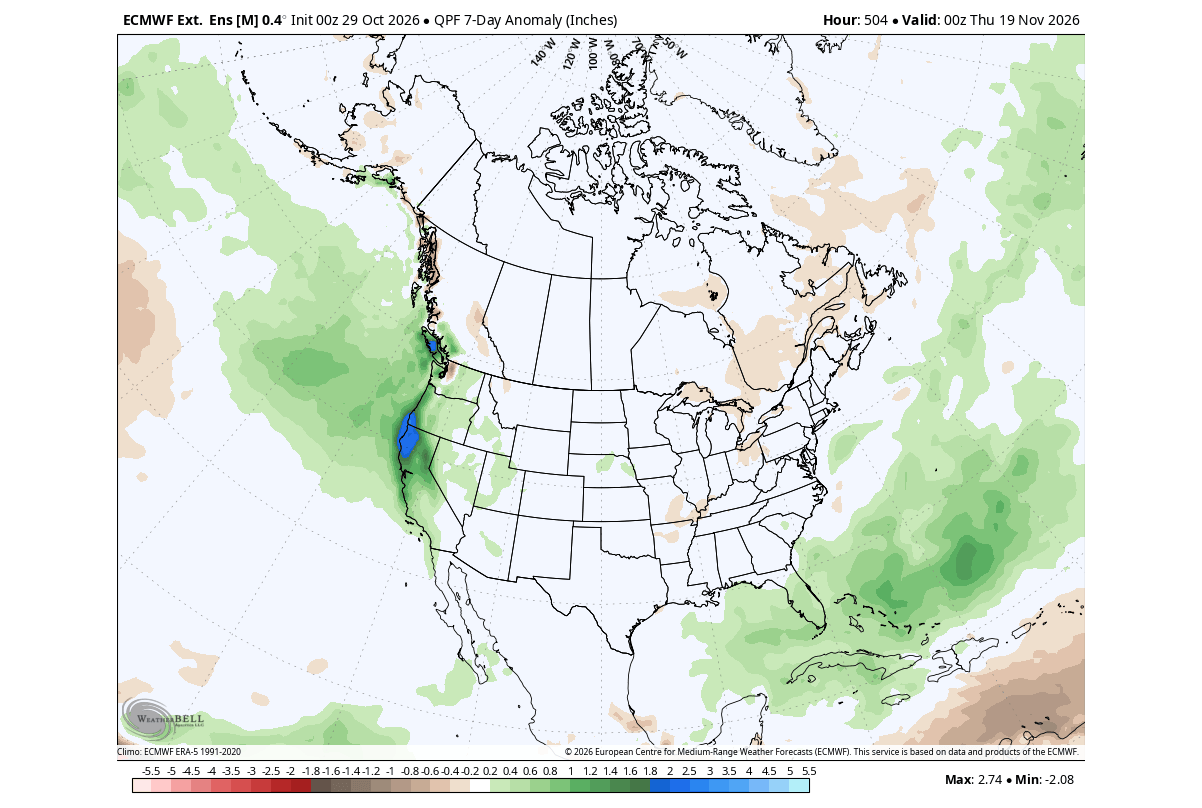
This is overall consistent with an El Niño signal in this case, amplified by the atmospheric standing wave in the Pacific.
Over Europe, we are slowly shifting away from a reversed pattern, into something more typical for an El Niño season, but not quite there yet. This is due to other sources adding their signal between the El Niño and Europe, for example, the Atlantic pressure pattern. A low-pressure signal is starting to appear in the Atlantic and northeastern parts, with a ridge in between.
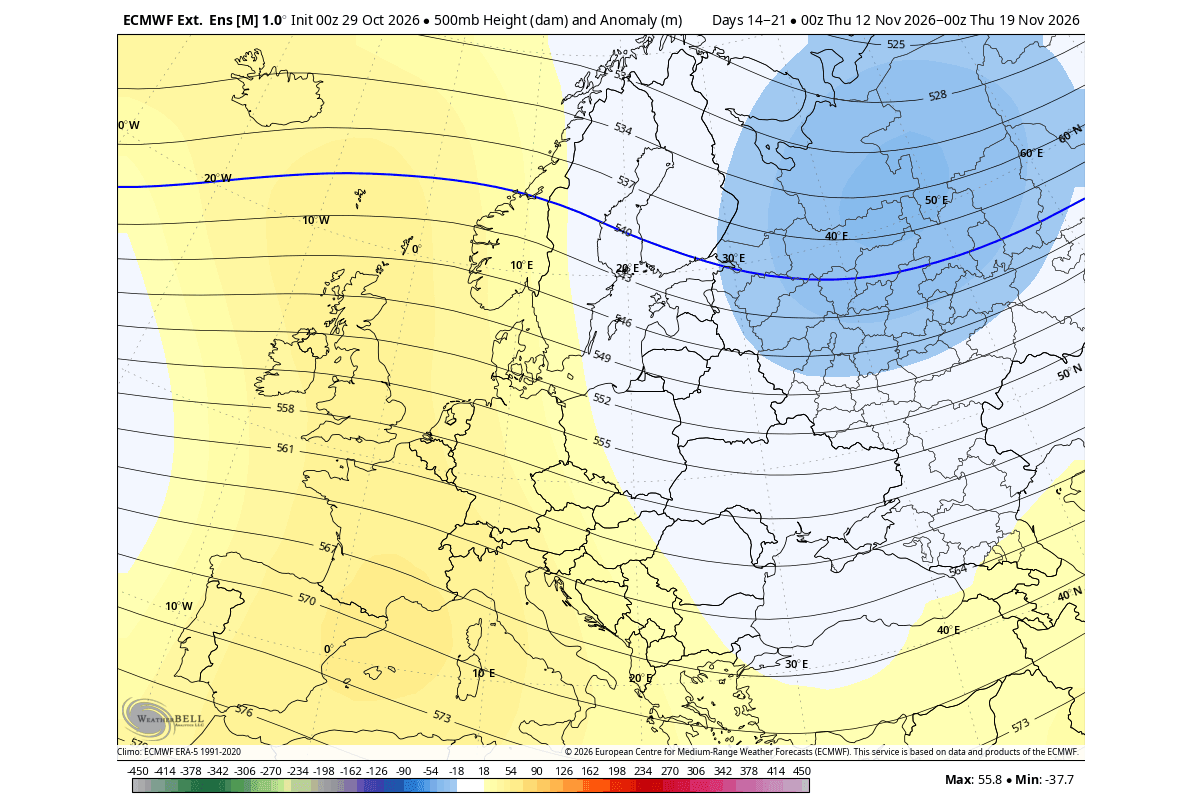
This is still not the amplified Atlantic low that the analysis of past November showed, but this is still just a current trend, not a fixed forecast. And an El Niño impact over Europe is quite less “fixed”.
The resulting temperature and precipitation anomalies in this period show a cooler, wetter trend in the southern and southeastern parts, driven by northerly flow from the low-pressure area. Other regions are borderline warmer than normal, with reduced rainfall in southern parts, and more precipitation over the north.
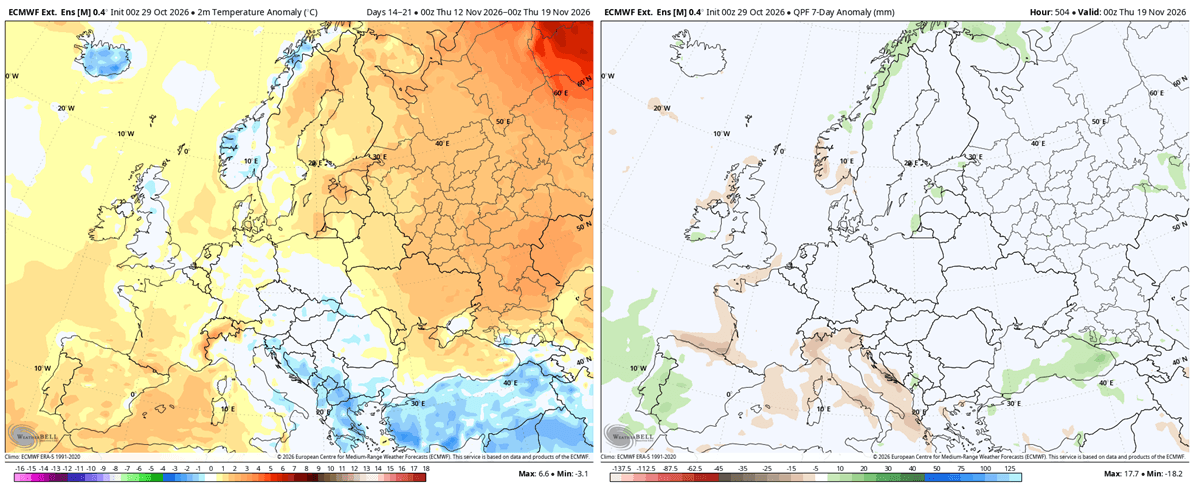
But as we head into the final third of November, we are basically already seeing the weather trend that is likely to dominate the first half of Winter, as the El Niño forcing is so strong.
Late November: The El Niño Pattern Settles In Before Winter
Over North America, we can now see a “full-grown” evolution of a strong El Niño pattern: a blocking high over Canada, a low-pressure system in the North Pacific, and a low-pressure zone across the southern and eastern United States. It kinda feels like we are on a repeat, but this just shows how strong the El Niño impact is.
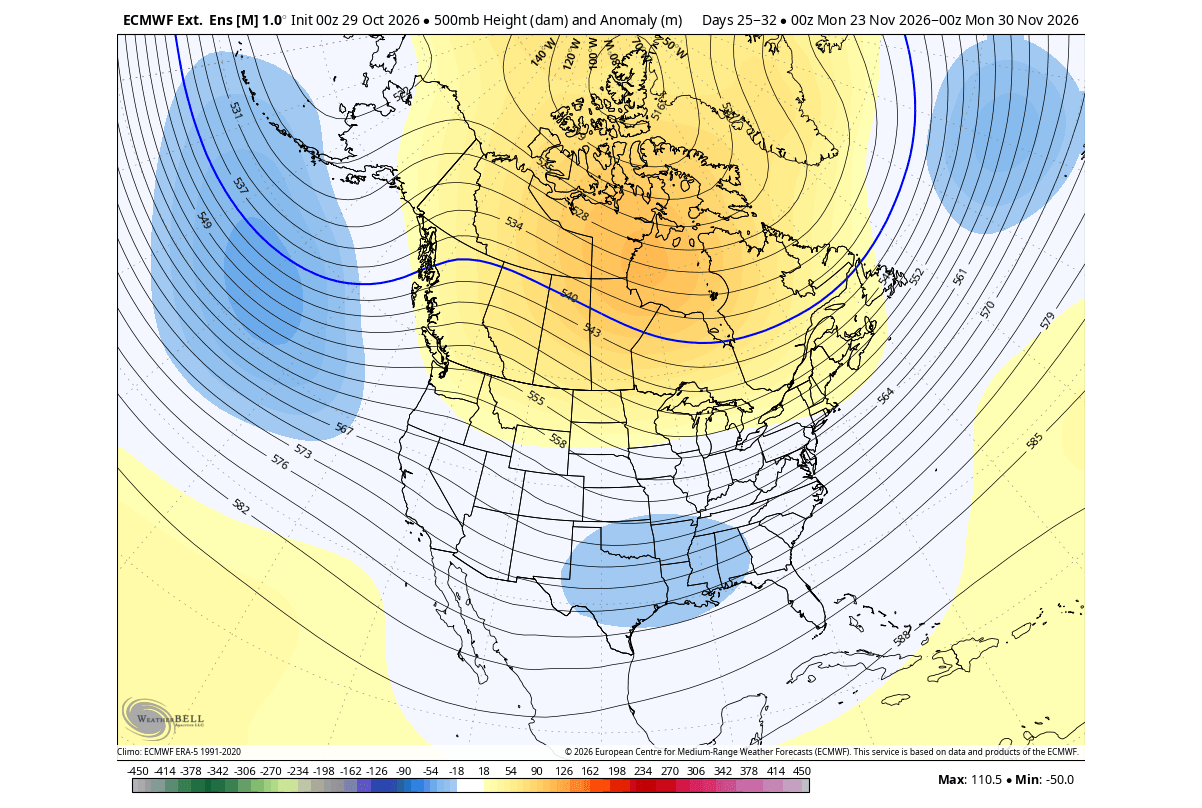
As we head deeper into late fall and toward the start of meteorological winter, the temperature anomalies are also starting to change. The image below shows the late-November airmass temperature forecast. We can see the large warm anomaly in the northern United States, and a below-normal zone over the south-central United States.
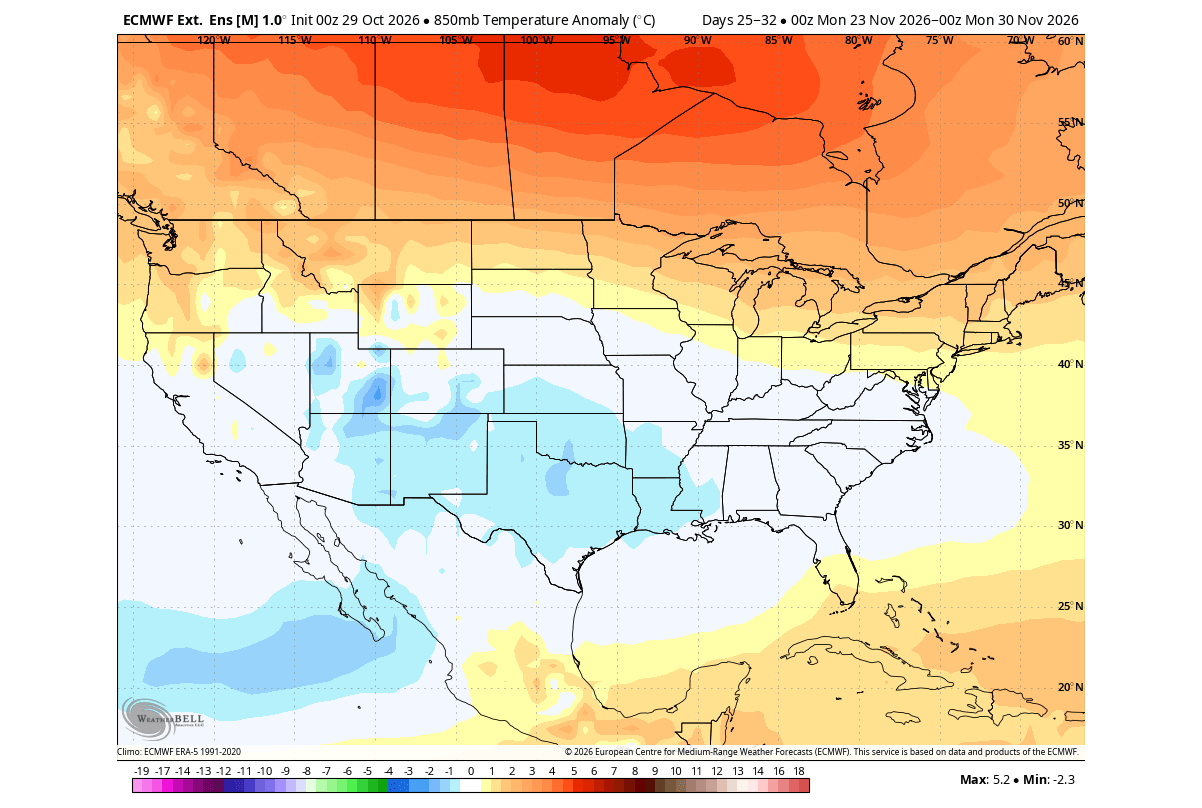
This cold anomaly area comes primarily due to a pressure drop over the southern U.S., causing unsettled weather with clouds and rain, dropping temperatures below normal. This is expected to last the duration of winter, with various intensities, and with some surprises possible.
The precipitation forecast shows increased rainfall across the southern and eastern United States under the low-pressure influence, also expanding to the northeast. California is also forecast to receive above-normal precipitation for the majority of the winter, as the El Niño forcing is expected to last at least until spring.
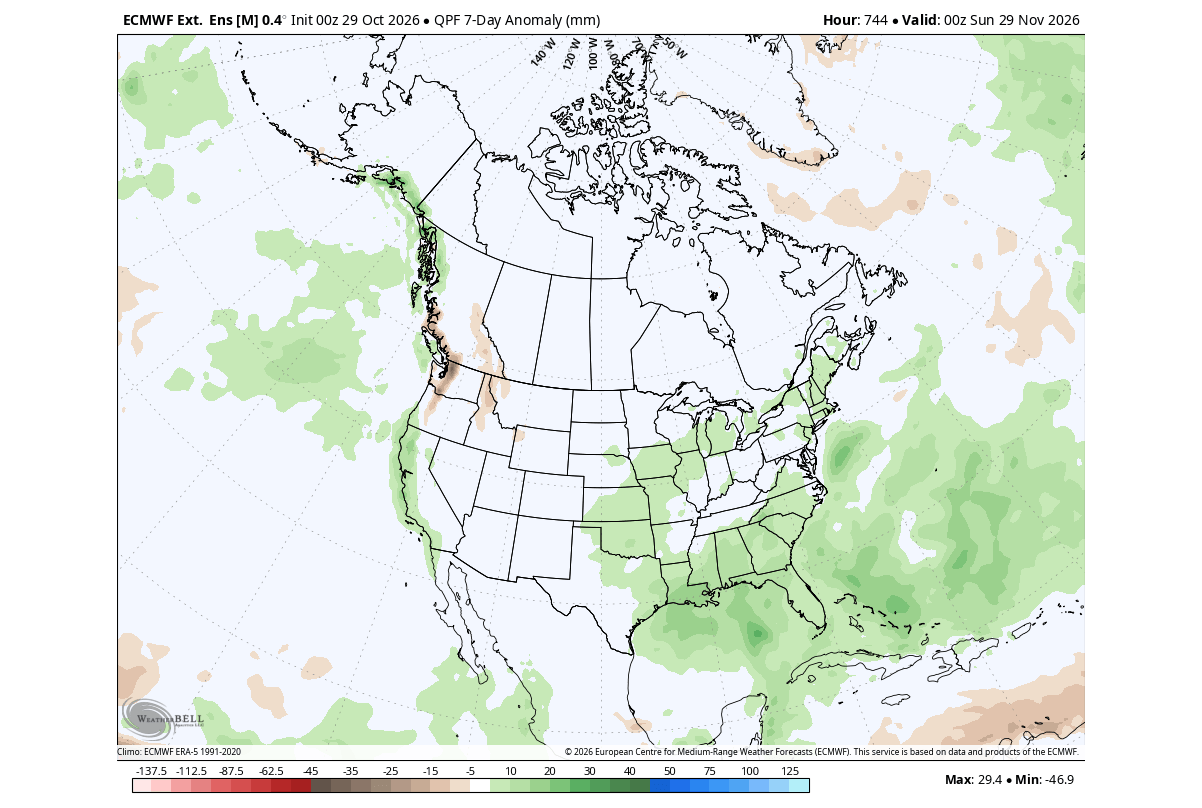
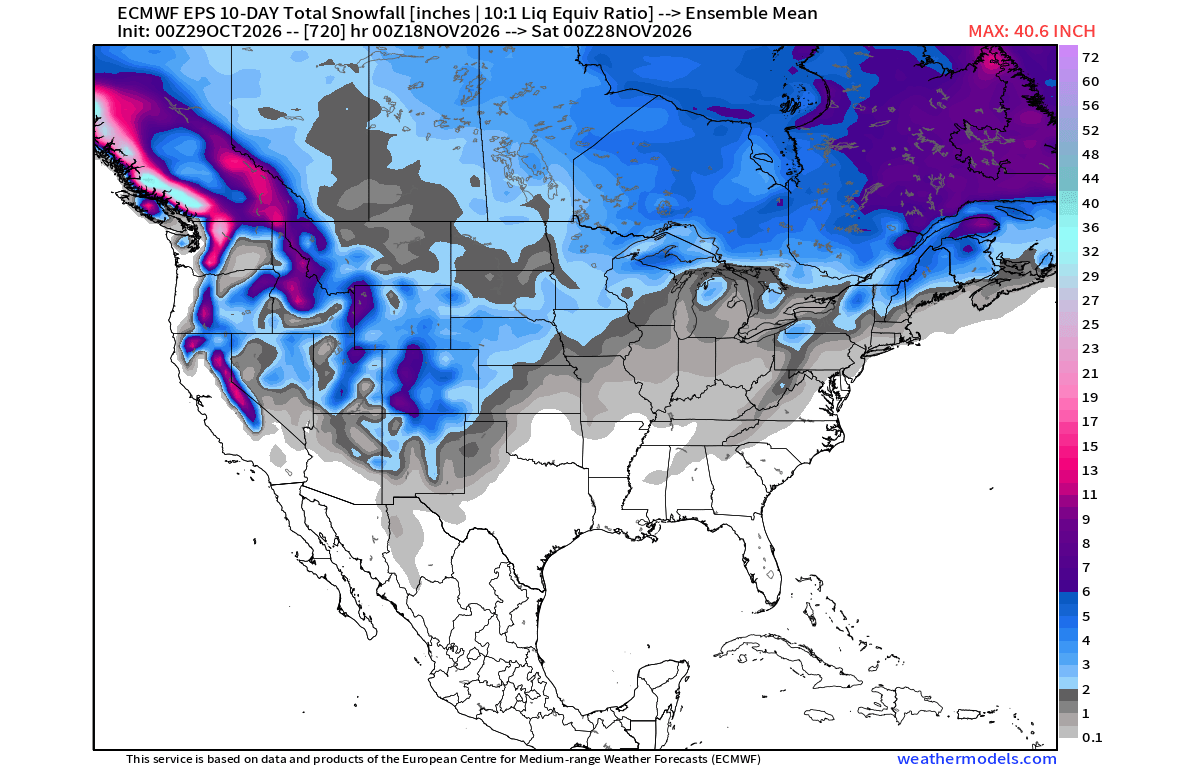
But as we head into late Fall, we can start looking at early snow arrivals. This is an extended-range forecast, so it shows the general snowfall trend, and not snow on the ground. But it does show snow building over the western mountains, the northern Plains, the Great Lakes, and Canada, so we are not heading into a no-snow season.
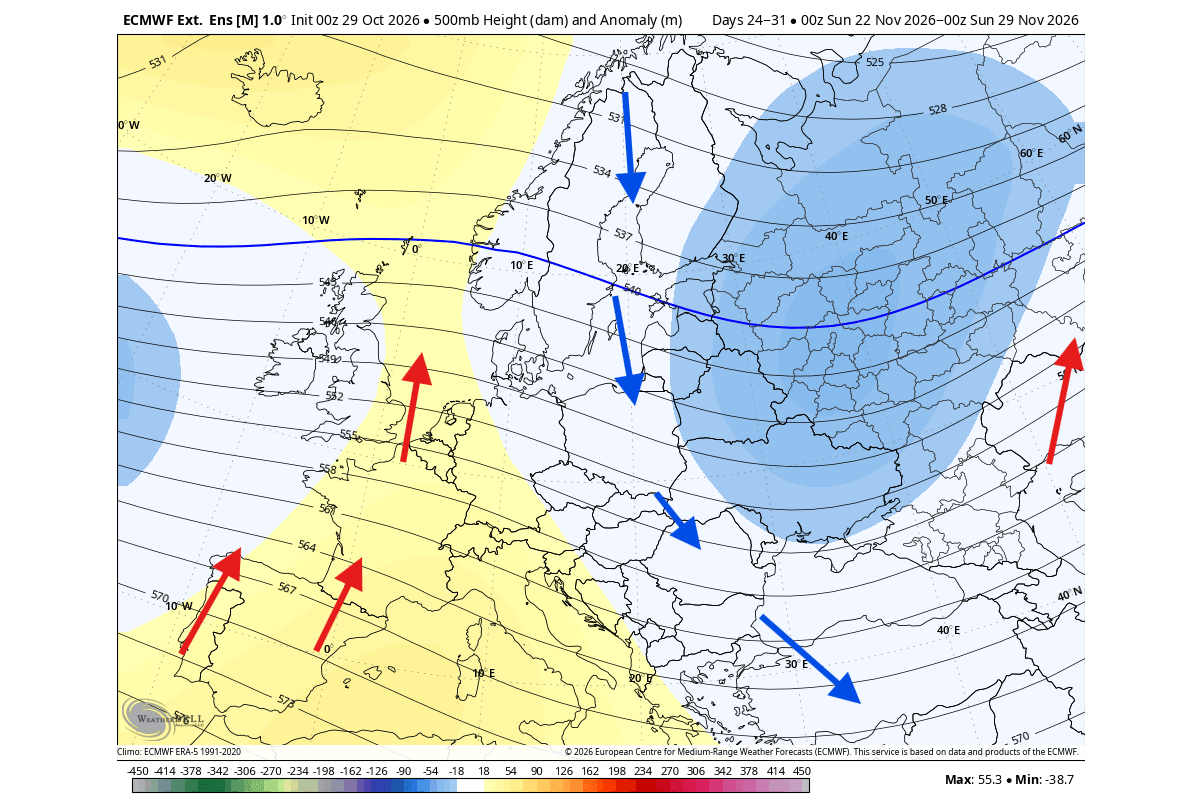
Europe is moving toward an El Niño pattern, but it isn’t there yet. We can still see a low-pressure zone over the northeast and east, creating a cooler northerly flow, while a warm southerly flow dominates the western half.
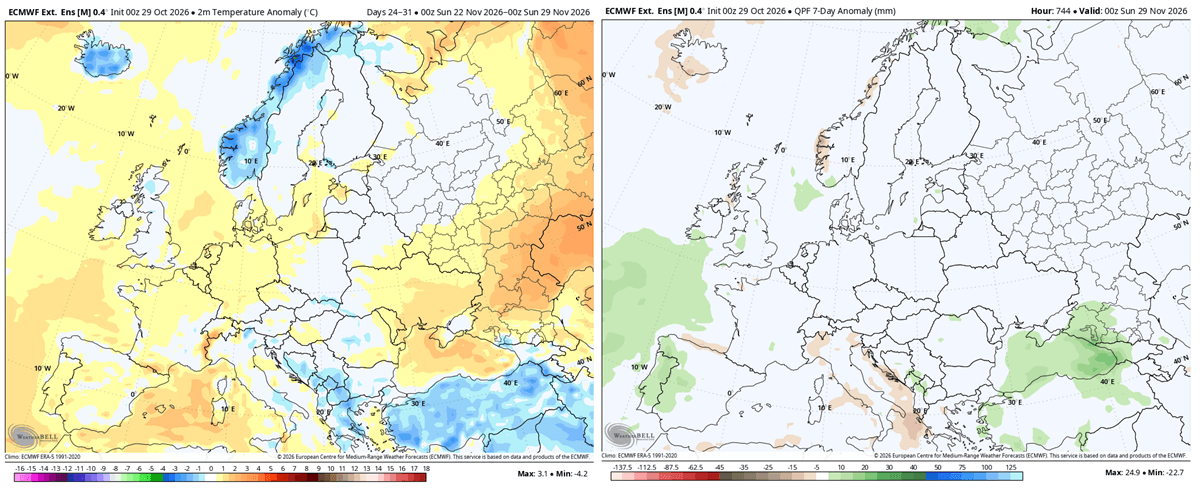
This is reflected in the temperature trend for late November: a cooler flow into the southeast and a warmer airmass rising over the west-central parts also bring increased precipitation into the northwest and southwest, due to increased moisture from the Atlantic.
But as El Niño keeps strengthening, we can see a steady, strong amplification of pressure anomalies across the Northern Hemisphere as we head into Winter 2026/2027.
Into Winter 2026/2027: A Stormy, Colder South and a Mild North
The Super El Niño forecast above showed that it’s expected to reach its peak around December. When an El Niño intensifies to extreme levels, its influence reaches high into the atmosphere, substantially influencing winter pressure patterns across the Pacific and North America.
The image below is from a study (linked below) that compared 500mb anomalies (5 km/3.1 miles) during Winter between moderate and extreme events, as we have now for 2026/2027. While a moderate event produces a mild wave pattern, an Extreme El Niño triggers a far more aggressive shift in the jet stream.
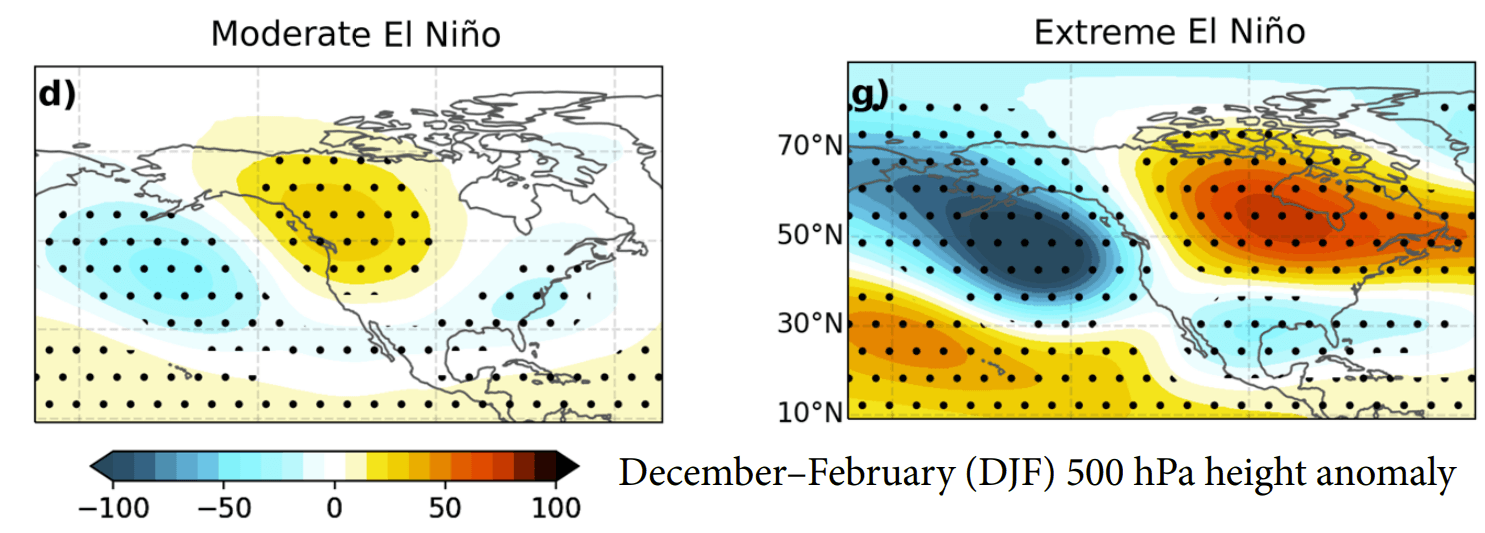
Simplified, an Extreme El Niño leads to a strong amplification of upper-level weather patterns. The deeper Pacific trough and powerful Canadian ridge form an atmospheric highway. This setup locks mild weather in the north while driving an active storm track across the southern United States.
The image below shows the December monthly forecast from the CFSv2 and ECMWF forecasts. Both are very close, which is rare to see in normal conditions. But with a strong El Niño forcing, the evolution of the pressure patterns just continues to amplify month to month, showing the amplified southern U.S. storm track in December.
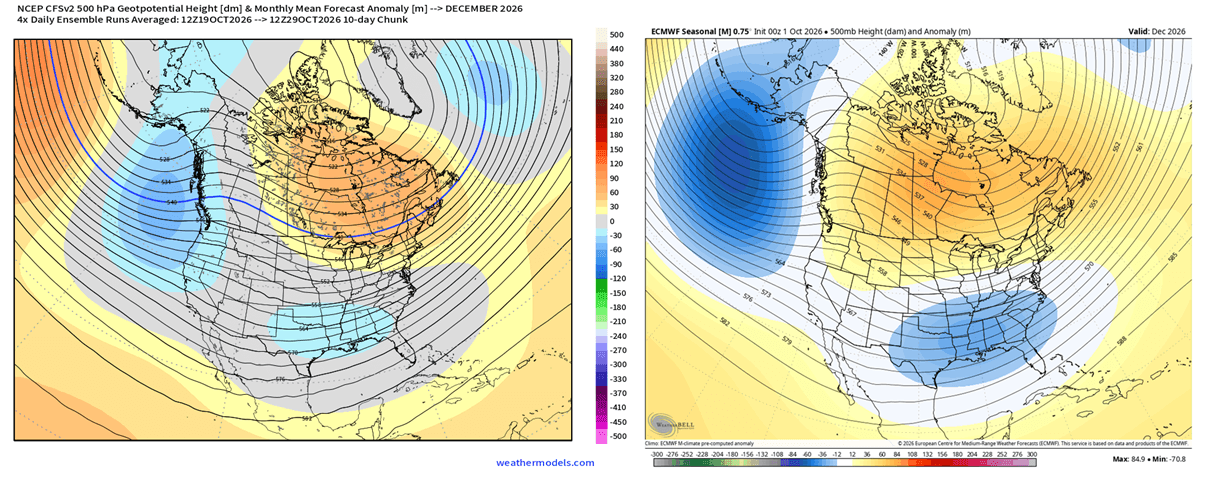
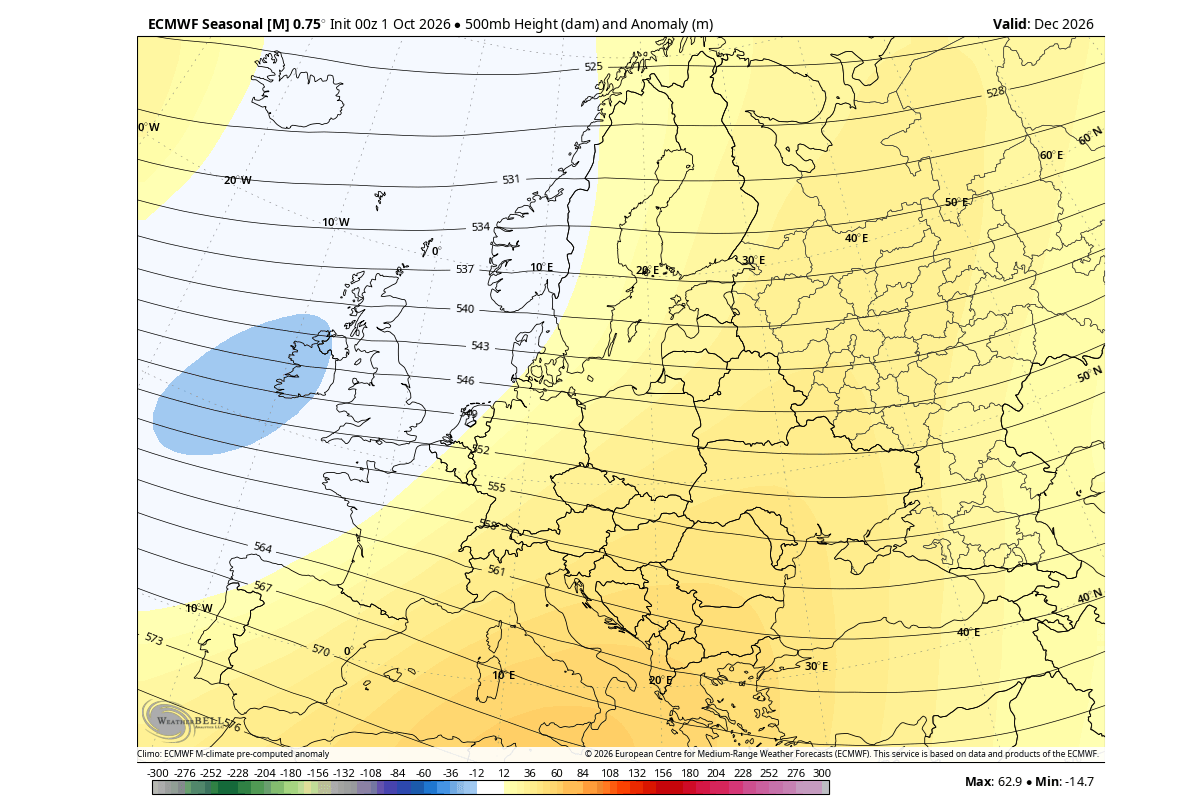
The December monthly mean pattern also shows a pressure anomaly closer to the past strong El Niño events. We see a low-pressure area developing in the Atlantic and northwestern Europe, creating a more westerly to southwesterly milder flow into the continent.
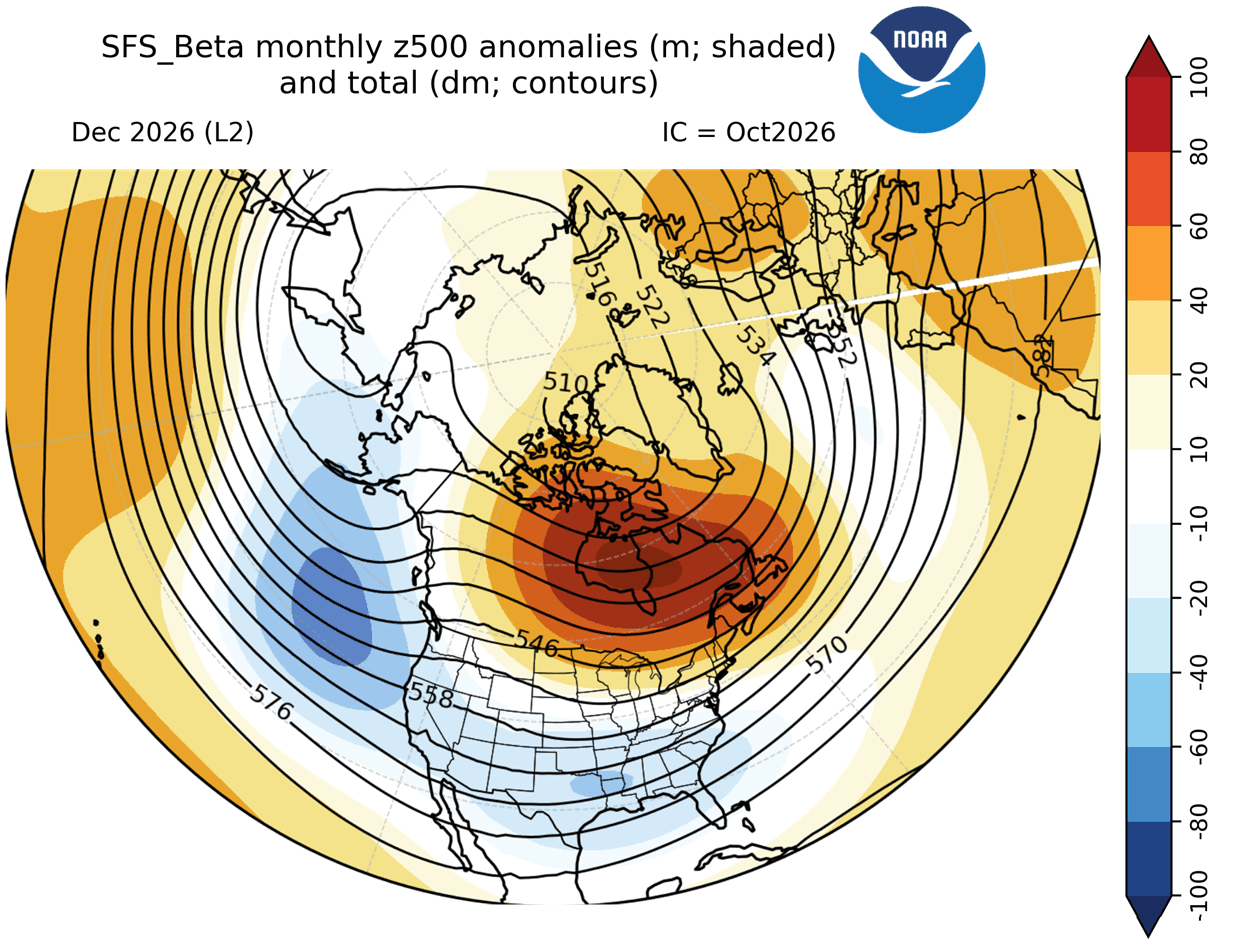
Even NOAA’s next-generation SFS model projects the same distinct split-flow atmospheric pattern across North America, and a low-pressure zone into the Atlantic. This setup powers the main jet stream across the southern half of the United States while holding higher pressure to the north. This same pattern really holds across most models, as the forcing is really strong.
A strong high-pressure block over Canada can suppress deep Arctic air flow. This usually reduces snowfall potential across the Northern Plains, upper Midwest, and Great Lakes. The active storm track is displaced southward, shifting winter storm and snowfall opportunities into the Central and Southern Plains and parts of the interior Mid-Atlantic.
The surface temperature anomaly forecast for January and February directly reflects this stronger southern storm track. You can see the temperature patterns evolve across the U.S. as El Niño influence reaches its mid-to-late winter peak, with a spreading anomaly of below-normal temperatures across the United States.
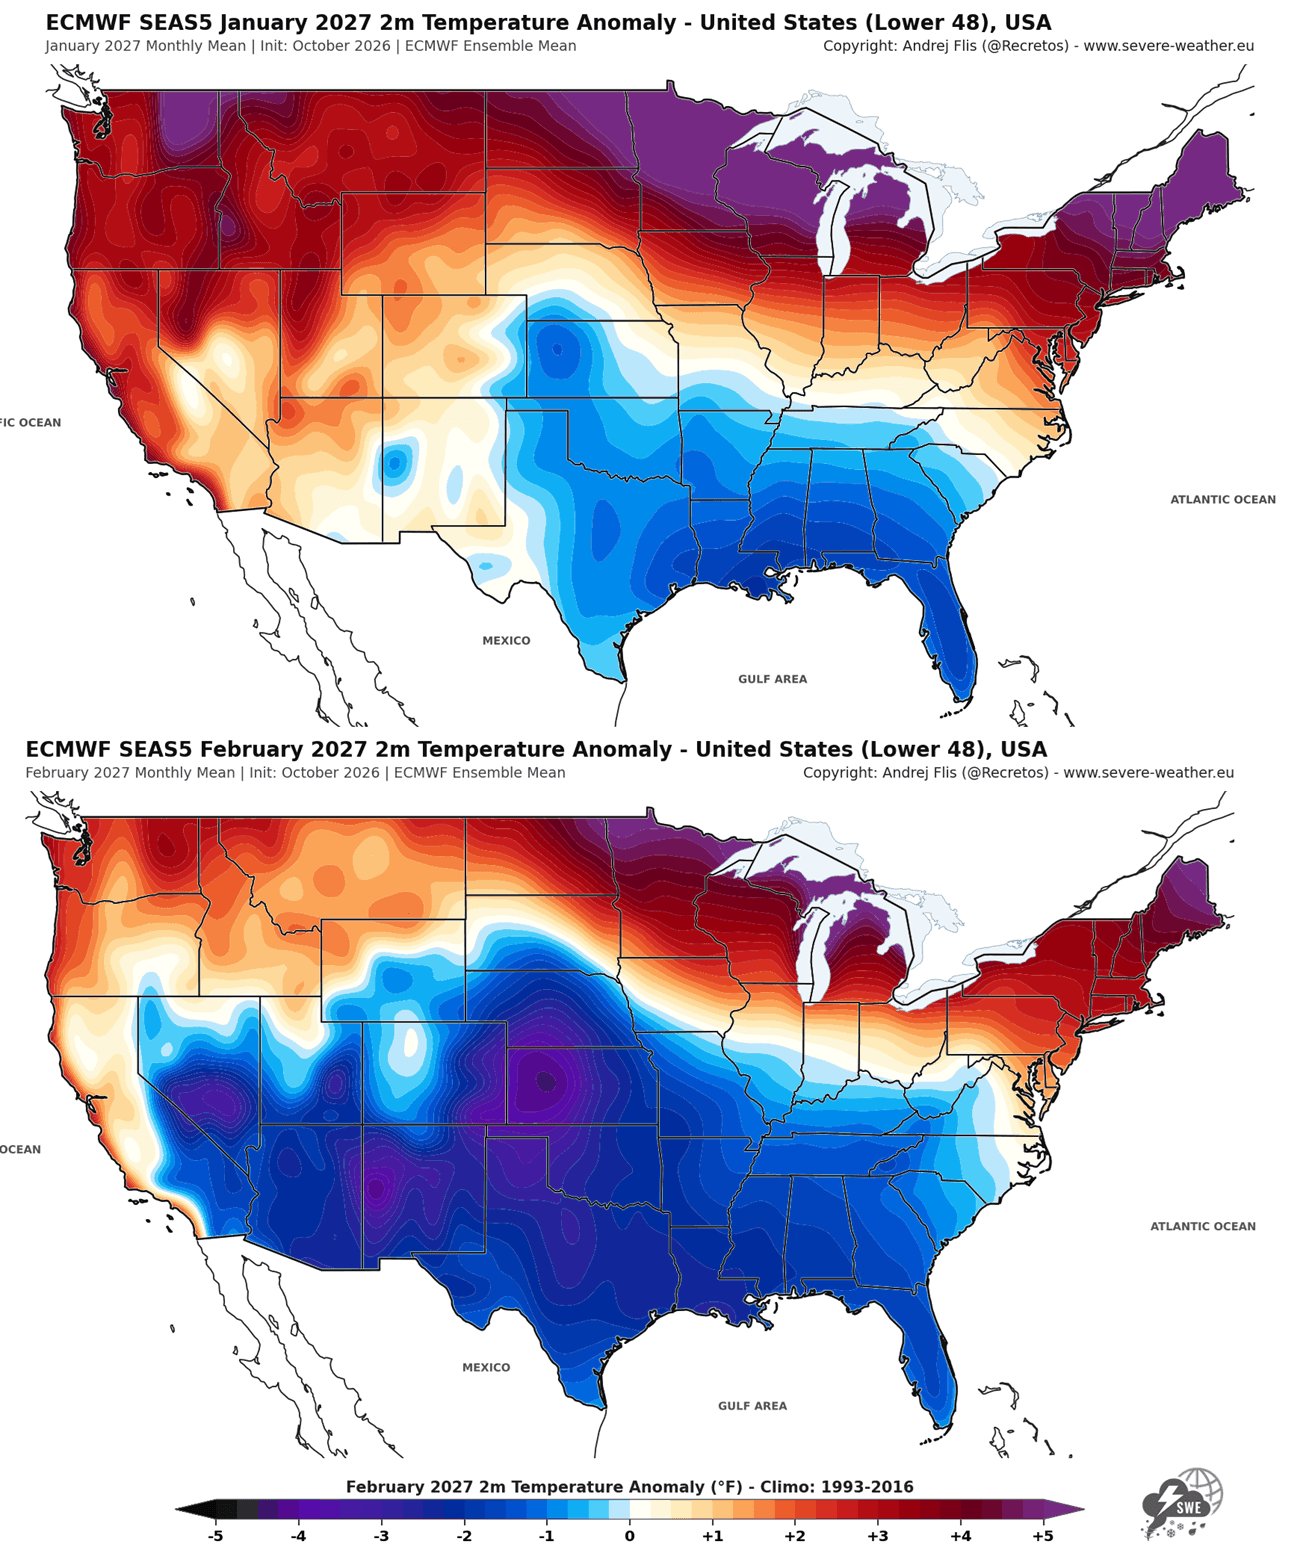
In January (top), a distinct cooling footprint establishes itself across the Southern Plains and Gulf Coast, contrasted by strong warm anomalies across the northern United States. By February (bottom), this cooling anomaly deepens and expands. A broad area of below-normal temperatures covers the Central, Southern, and Eastern United States as cold air intrusions can become more frequent.
We will monitor the developing situation weekly across the United States, Canada, and Europe, with new seasonal data available very soon.
Scientific Research Used in this Article
- Extreme El Niño Teleconnections: A Distinct and Reproducible Teleconnection Pattern over North America during Extreme El Niño Events – Beniche et al. (2024).
Forecast images in this article are from ECMWF, weathermodels.com, and WeatherBell (using a commercial license).
Early November Polar Vortex Disruption Forecast: Polar Vortex Split Forecast: The Earliest Stratospheric Warming on Record
We will keep you updated on the global weather pattern development, so bookmark our page. Also, if you have seen this article in the Google App (Discover) feed, click the like (♥) or the star button there to see more of our forecasts and our latest articles on weather and nature in general.