Latest data shows the 2026 El Niño is rapidly intensifying. Warm Pacific waters are expanding, and the new forecasts are pushing this event deeper into the Super El Niño category. Based on the latest data, this could be the strongest El Niño event in the historical record, with its atmospheric impacts already clearly visible.
Rising motion and lower pressure are becoming established over the central and eastern Pacific, showing that the global circulation is being shaped by the growing ocean anomaly. As this tropical forcing becomes stronger and more persistent, it will alter pressure systems, shift the jet stream, and build the seasonal patterns toward Winter.
In this article, we will look at the latest ocean and atmospheric signals behind the developing Super El Niño, how it compares with past major events, and how the atmosphere has already shifted into El Niño mode. We will also examine the emerging amplified Winter 2026/2027 pattern across the United States, Canada, and Europe, including the latest jet stream trends and potential disruptions of the Polar Vortex.
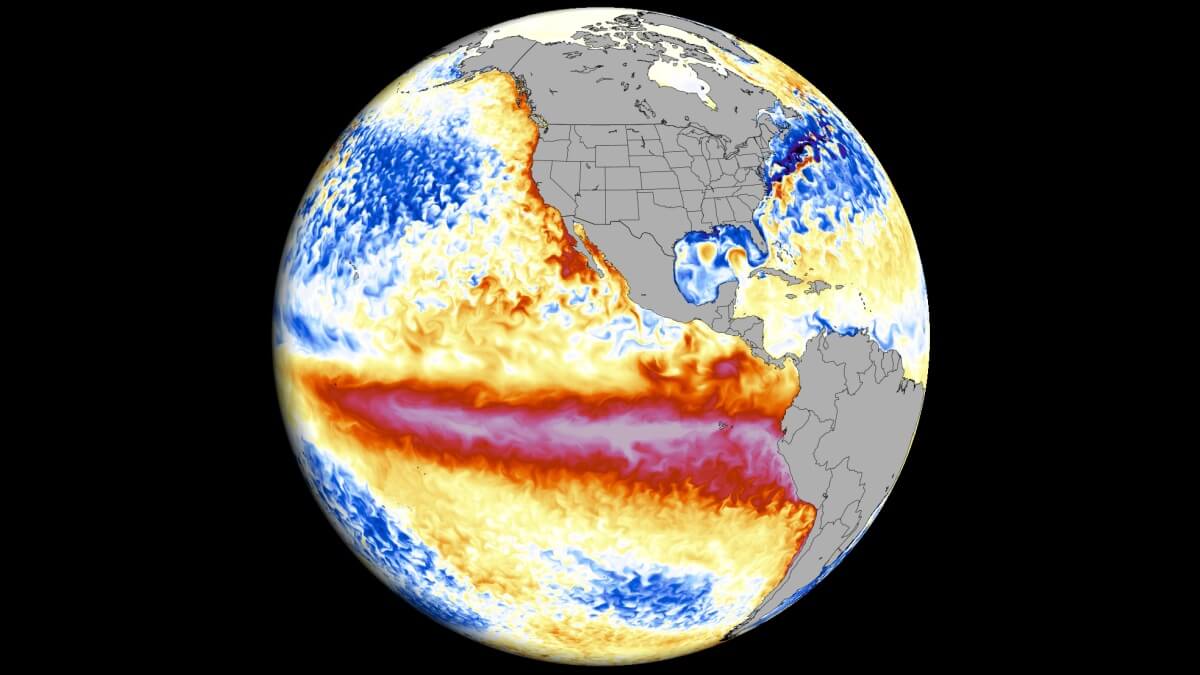
Planetary Dynamics: How El Niño Alters the Global Circulation
For several weeks, we have been tracking the growth of an El Niño event that will be a major global weather driver in 2026/2027. This is a warm phase of the ENSO region in the equatorial Pacific Ocean that alternates between warm and cold phases every few years.
Currently, we are entering a very strong El Niño, so we can look at the usual changes it brings to the atmospheric circulation. The upward and downward atmospheric motion and circulation in the tropical regions is called a Walker Cell, and is especially sensitive to strong ENSO events.
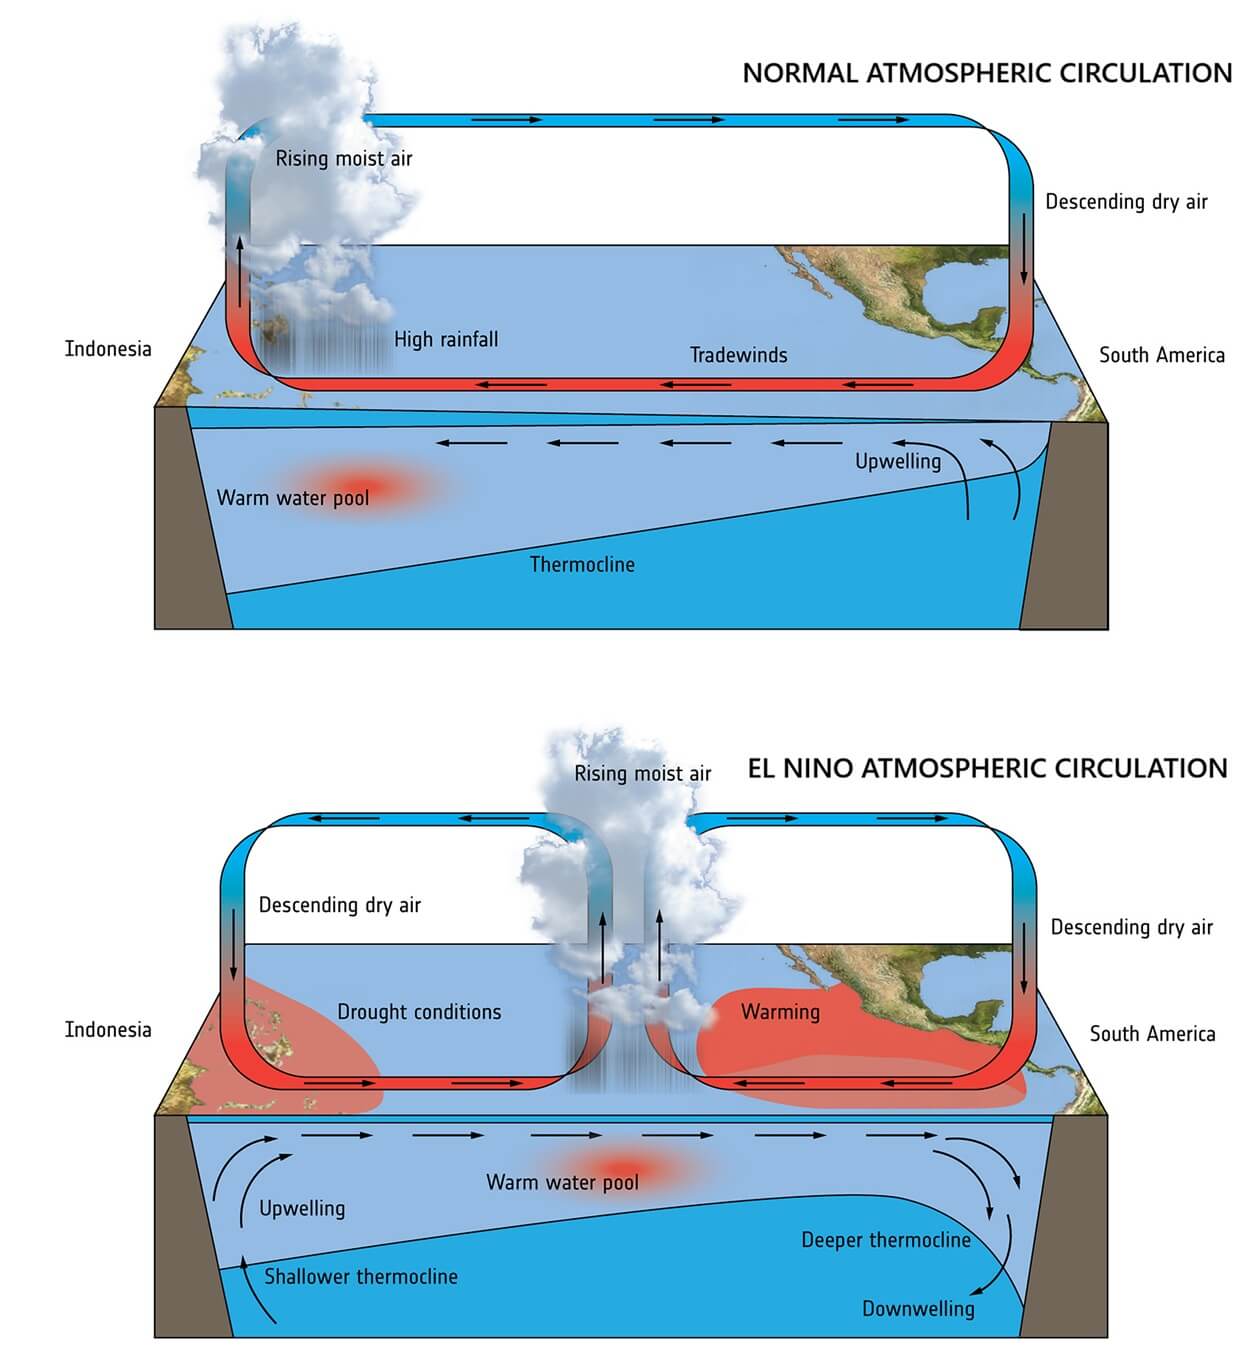
The schematic above, by ESA, shows the changes in this atmospheric motion cell during a normal atmosphere (ENSO neutral) versus an El Niño event, altering the global atmosphere with a so-called atmospheric bridge.
In simple terms, the El Niño causes a pressure drop in the central and eastern tropical Pacific and a high-pressure zone over the western Pacific. This has a major influence on the tropical rainfall and pressure patterns, filtering into the mid latitudes and the global weather system.
As mentioned, all the available data shows the 2026/2027 event will be a clear Super El Niño. Super events are rather rare, occurring once per decade or less. Below is an analysis by NASA Earth that shows the evolution during the last Super El Niño event in 2015, and how widespread the ocean anomalies were, compared to the start of the event, exceeding +3 degrees above normal over a large area.
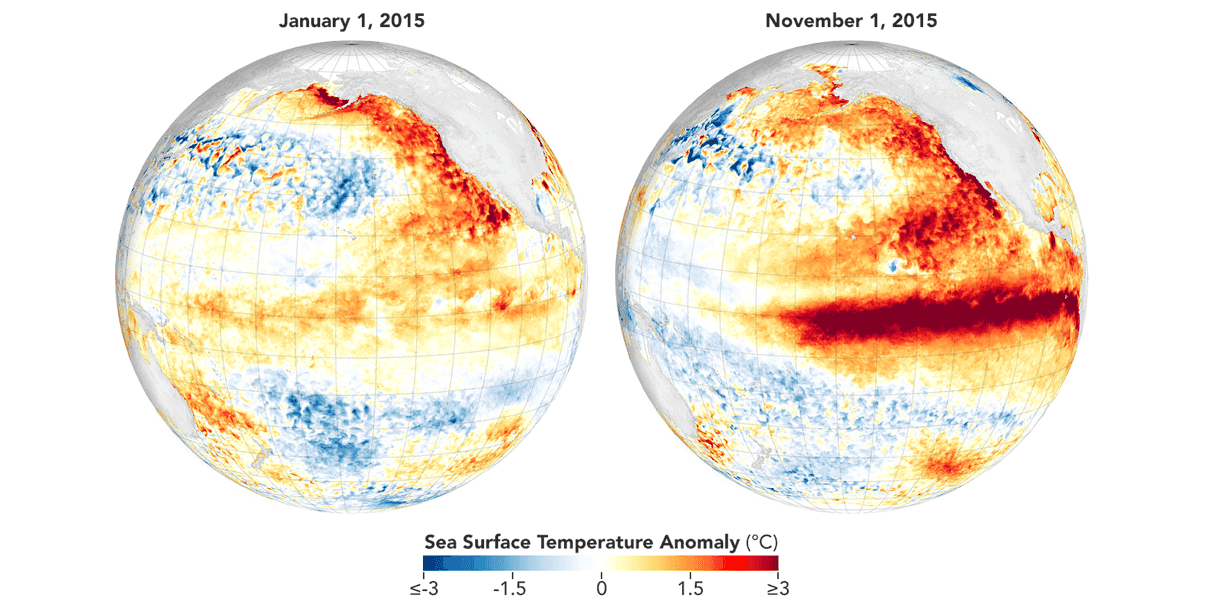
A Super El Niño is like a massive “pressure release valve” for piled-up warm water and energy in the Pacific. It is a high-energy event with strong, planetary impacts on weather, especially during the cold weather season over North America.
This whole Super El Niño lifecycle is nicely visible in the video below, showing a great visualization from NASA Earth data. You can see a full Super El Niño evolution, with an example from the latest such event in 2015. It starts with a massive subsurface warm anomaly making way towards the eastern Pacific and surfacing, releasing a large warm ocean surface anomaly.
The latest analysis data now shows the exact same process unfolding rapidly, but with an even stronger energy signature than most previous super events.
A Powerful Kelvin Wave Is Driving the Next Stage
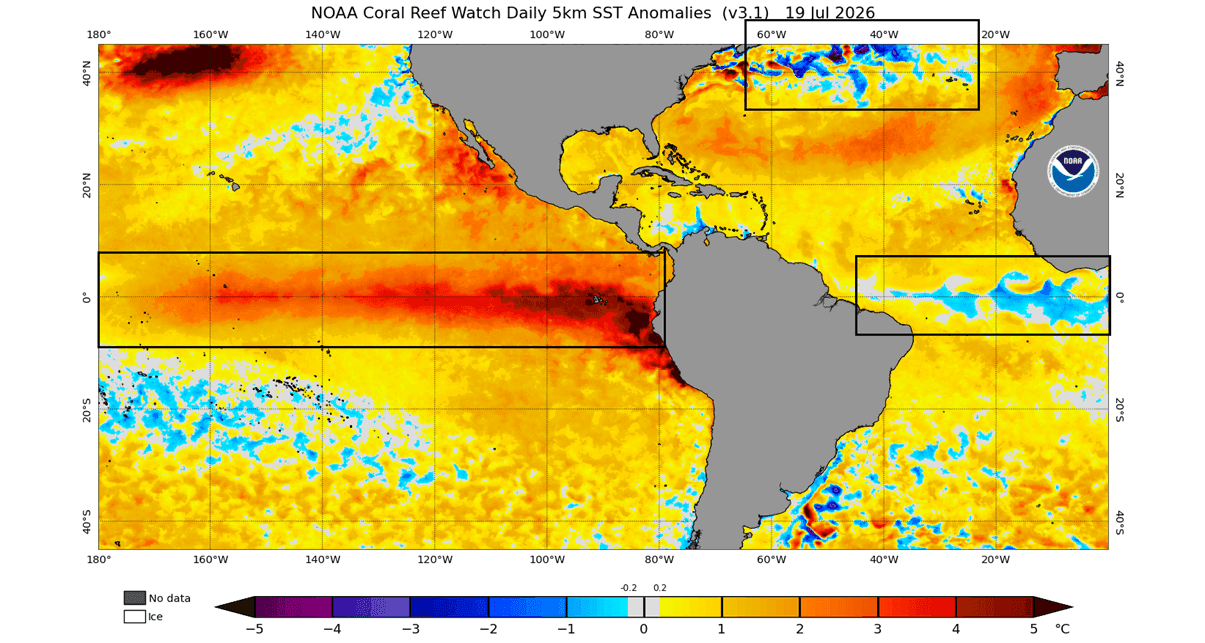
The latest ocean analysis below shows the main ENSO region already covered in strong warm anomalies. You can see the peak warmth in the eastern parts reaching already 3-4 degrees above normal, which is a very rapid onset of strong anomalies at this time of the year. Also note the two colder areas in the North Atlantic and the tropics.
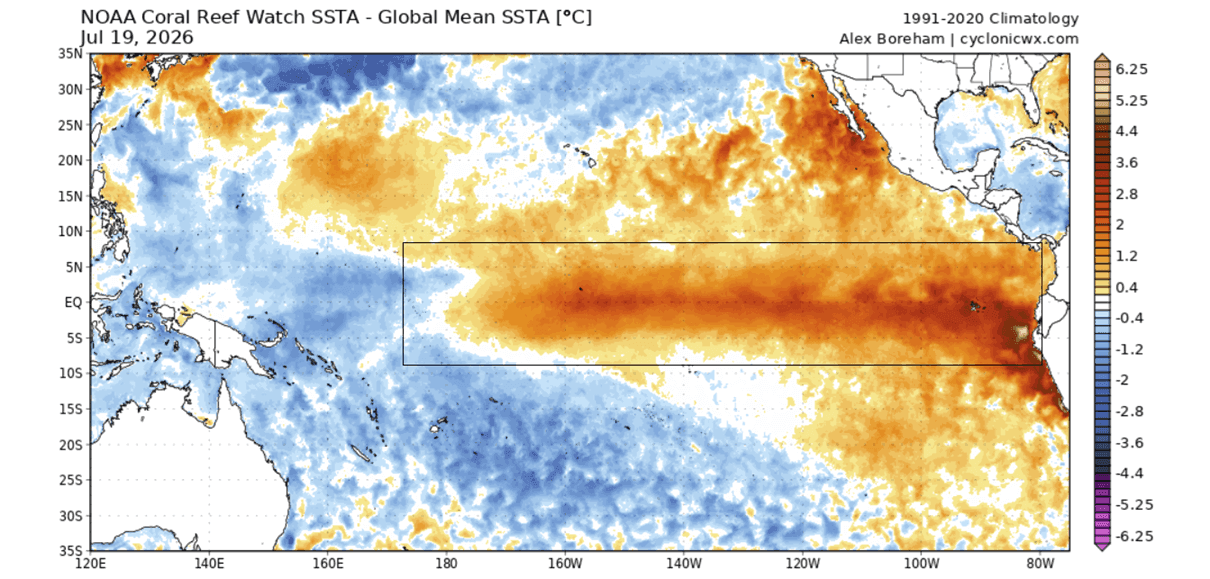
The analysis below also shows the ocean temperature anomalies, but has the global average (mean) removed. This much better shows the pure warm signal of the emerging El Niño, making a strong contrast with the surrounding oceans, reflecting it into the atmosphere. But the true engine of this event is hidden below the ocean surface.
Below you can see the subsurface temperature anomaly across the tropical Pacific in the top 500m (1640ft) of the ocean. This reveals the subsurface core (engine) of this El Niño event: a strong, warm anomaly, peaking over 7 degrees above normal. It’s called a Kelvin Wave, which is pushed below the surface towards the central and eastern regions, where it begins to rise to the surface.
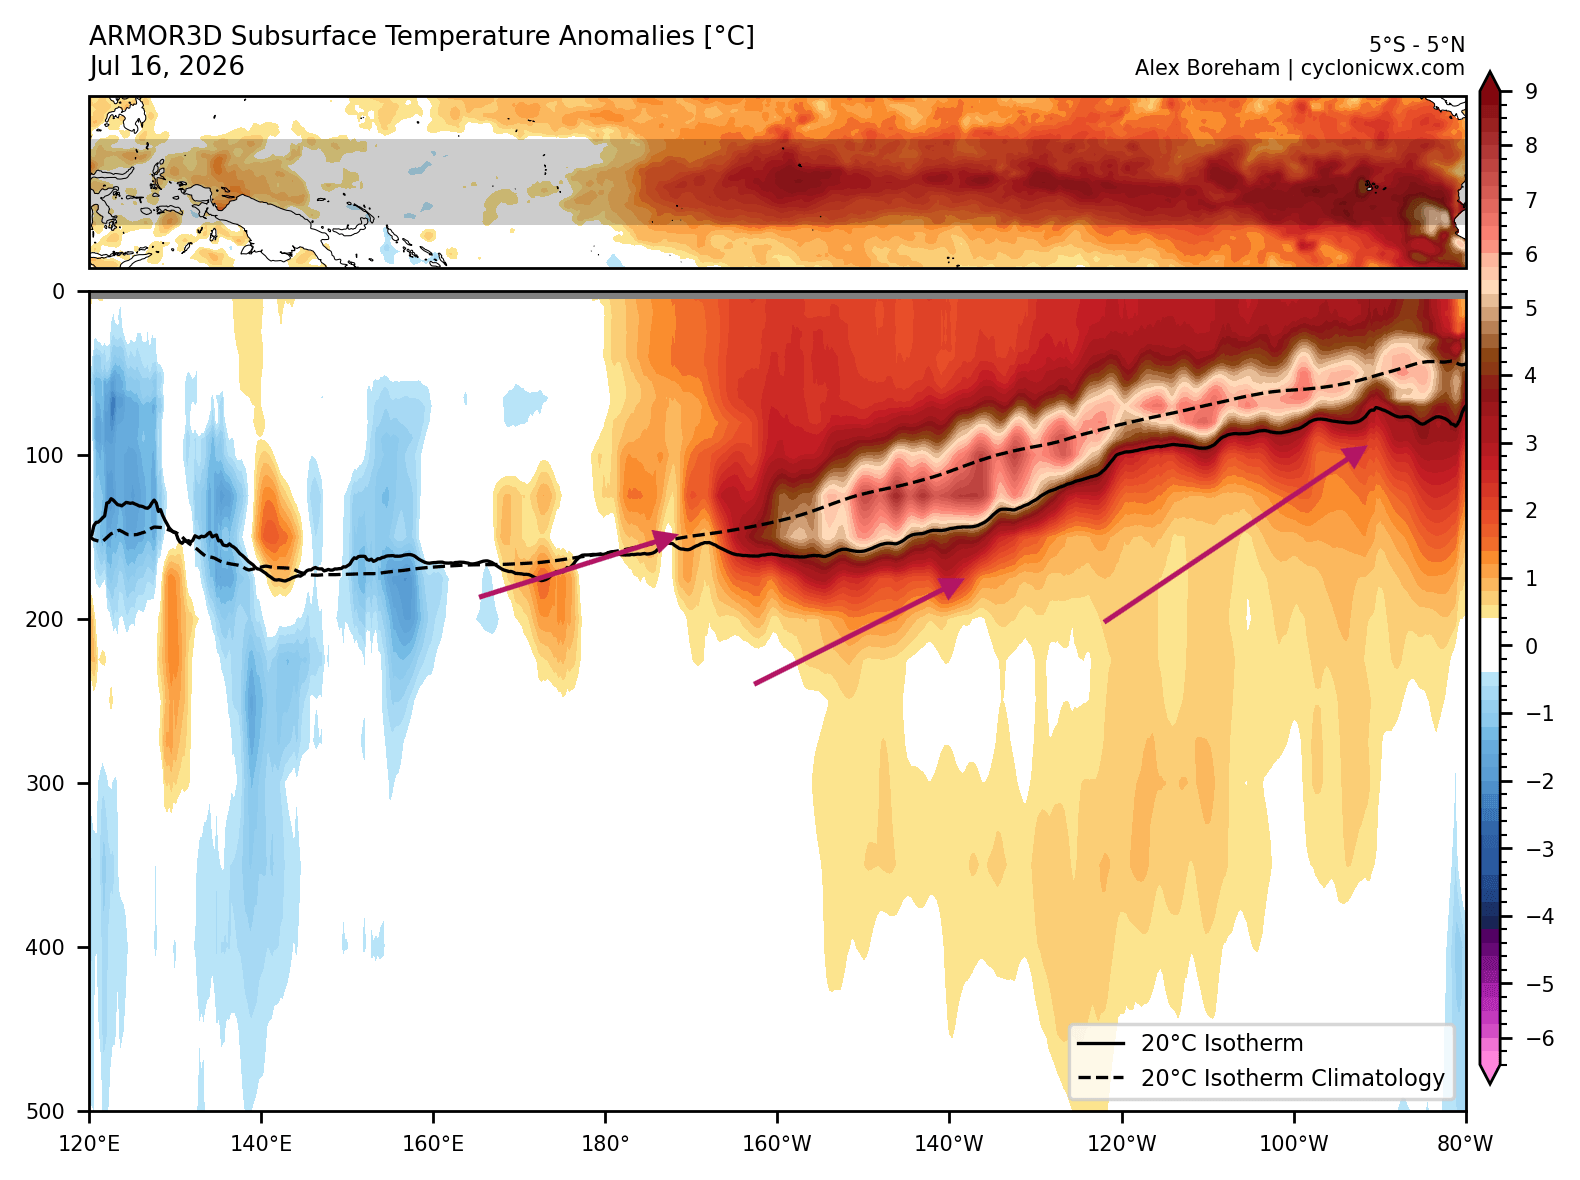
These subsurface Kelvin waves are driven by the westerly wind bursts across the tropical Pacific, pushing the warmer subsurface ocean waters to the east, where they rise to the surface. This is a great example of how the atmosphere can drive the ocean changes.
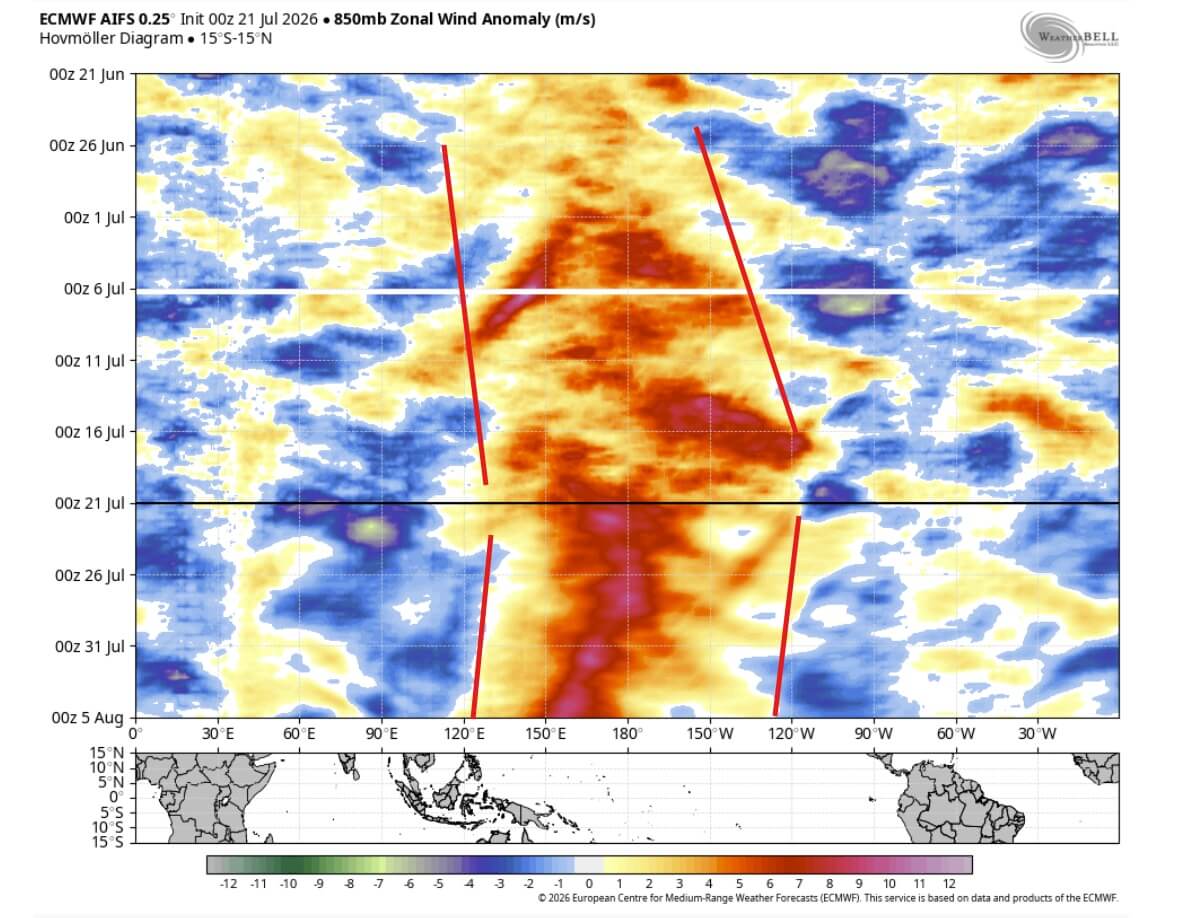
Below is the latest analysis and forecast of the winds across the tropics. You can already see the strong westerly wind burst anomalies in the analysis part, driving the El Niño event at its core. But the forecast now also shows even stronger westerly anomalies across the Pacific, which will help further grow and strengthen the 2026/2027 Super El Niño event.
This is also reflected in the seasonal forecasts, which currently indicate we are facing a record-breaking Super El Niño event in the making.
Multi-Model Consensus: Forecasts Exceed the Super El Niño Threshold
A Super El Niño is scientifically recognized when sea surface temperature anomalies in the main region exceed and sustain a threshold of +2.0 or higher above the long-term average. This is used to identify the strongest events, which usually have a greater impact on the atmosphere than a more modest event.
You can see this in the comparison below from a newer study, which reveals why the overall strength of an El Niño matters so much for the global atmosphere. While a moderate event (right) has scattered impacts, a strong or Super El Niño (left) can completely overhaul tropical rainfall, pressure, and winds during the peak winter months.
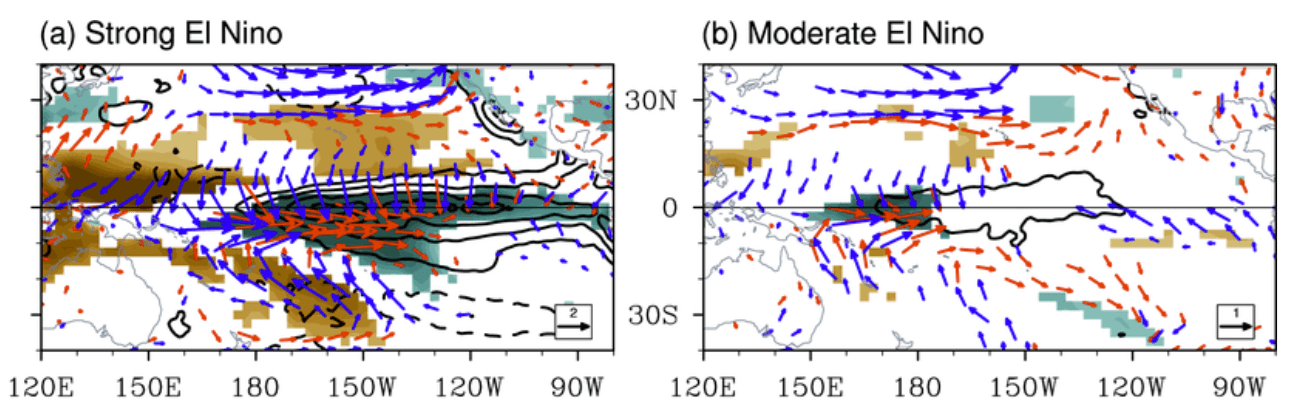
A stronger event creates larger areas of tropical rainfall (green) and severe dry zones (brown) across the Pacific. The arrows also signal a breakdown of the normal trade winds, creating a powerful atmospheric feedback loop that a moderate event simply cannot replicate.
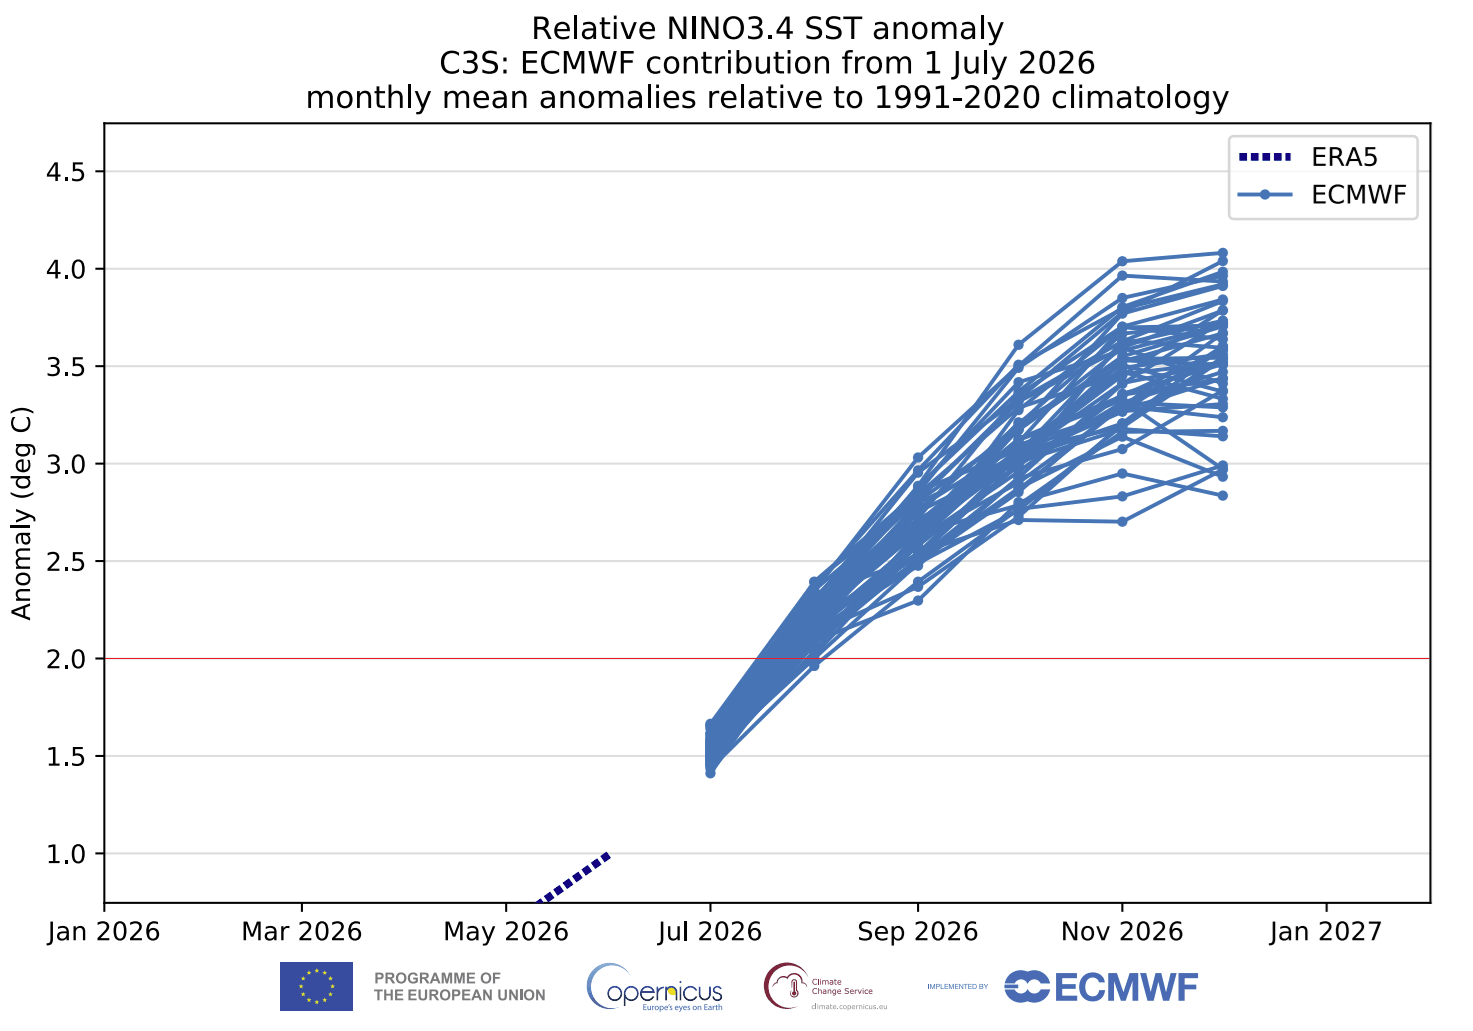
This matters because, as you can see below, the ECMWF forecast shows a strong El Niño developing, easily exceeding the +2 degrees threshold and pushing it into the Super event category. But it goes beyond that, exceeding the +3 threshold, and could become the strongest El Niño events in recorded history.
The image below puts the current event into proper context, as it shows the comparison with the last two larger events, the moderate 2023/2024 event and the last Super El Niño of 2015/2016. You can see that the El Niño has already passed the 2015 Super event in development, and has easily exceeded the very peak of the last El Niño event this early in the season.
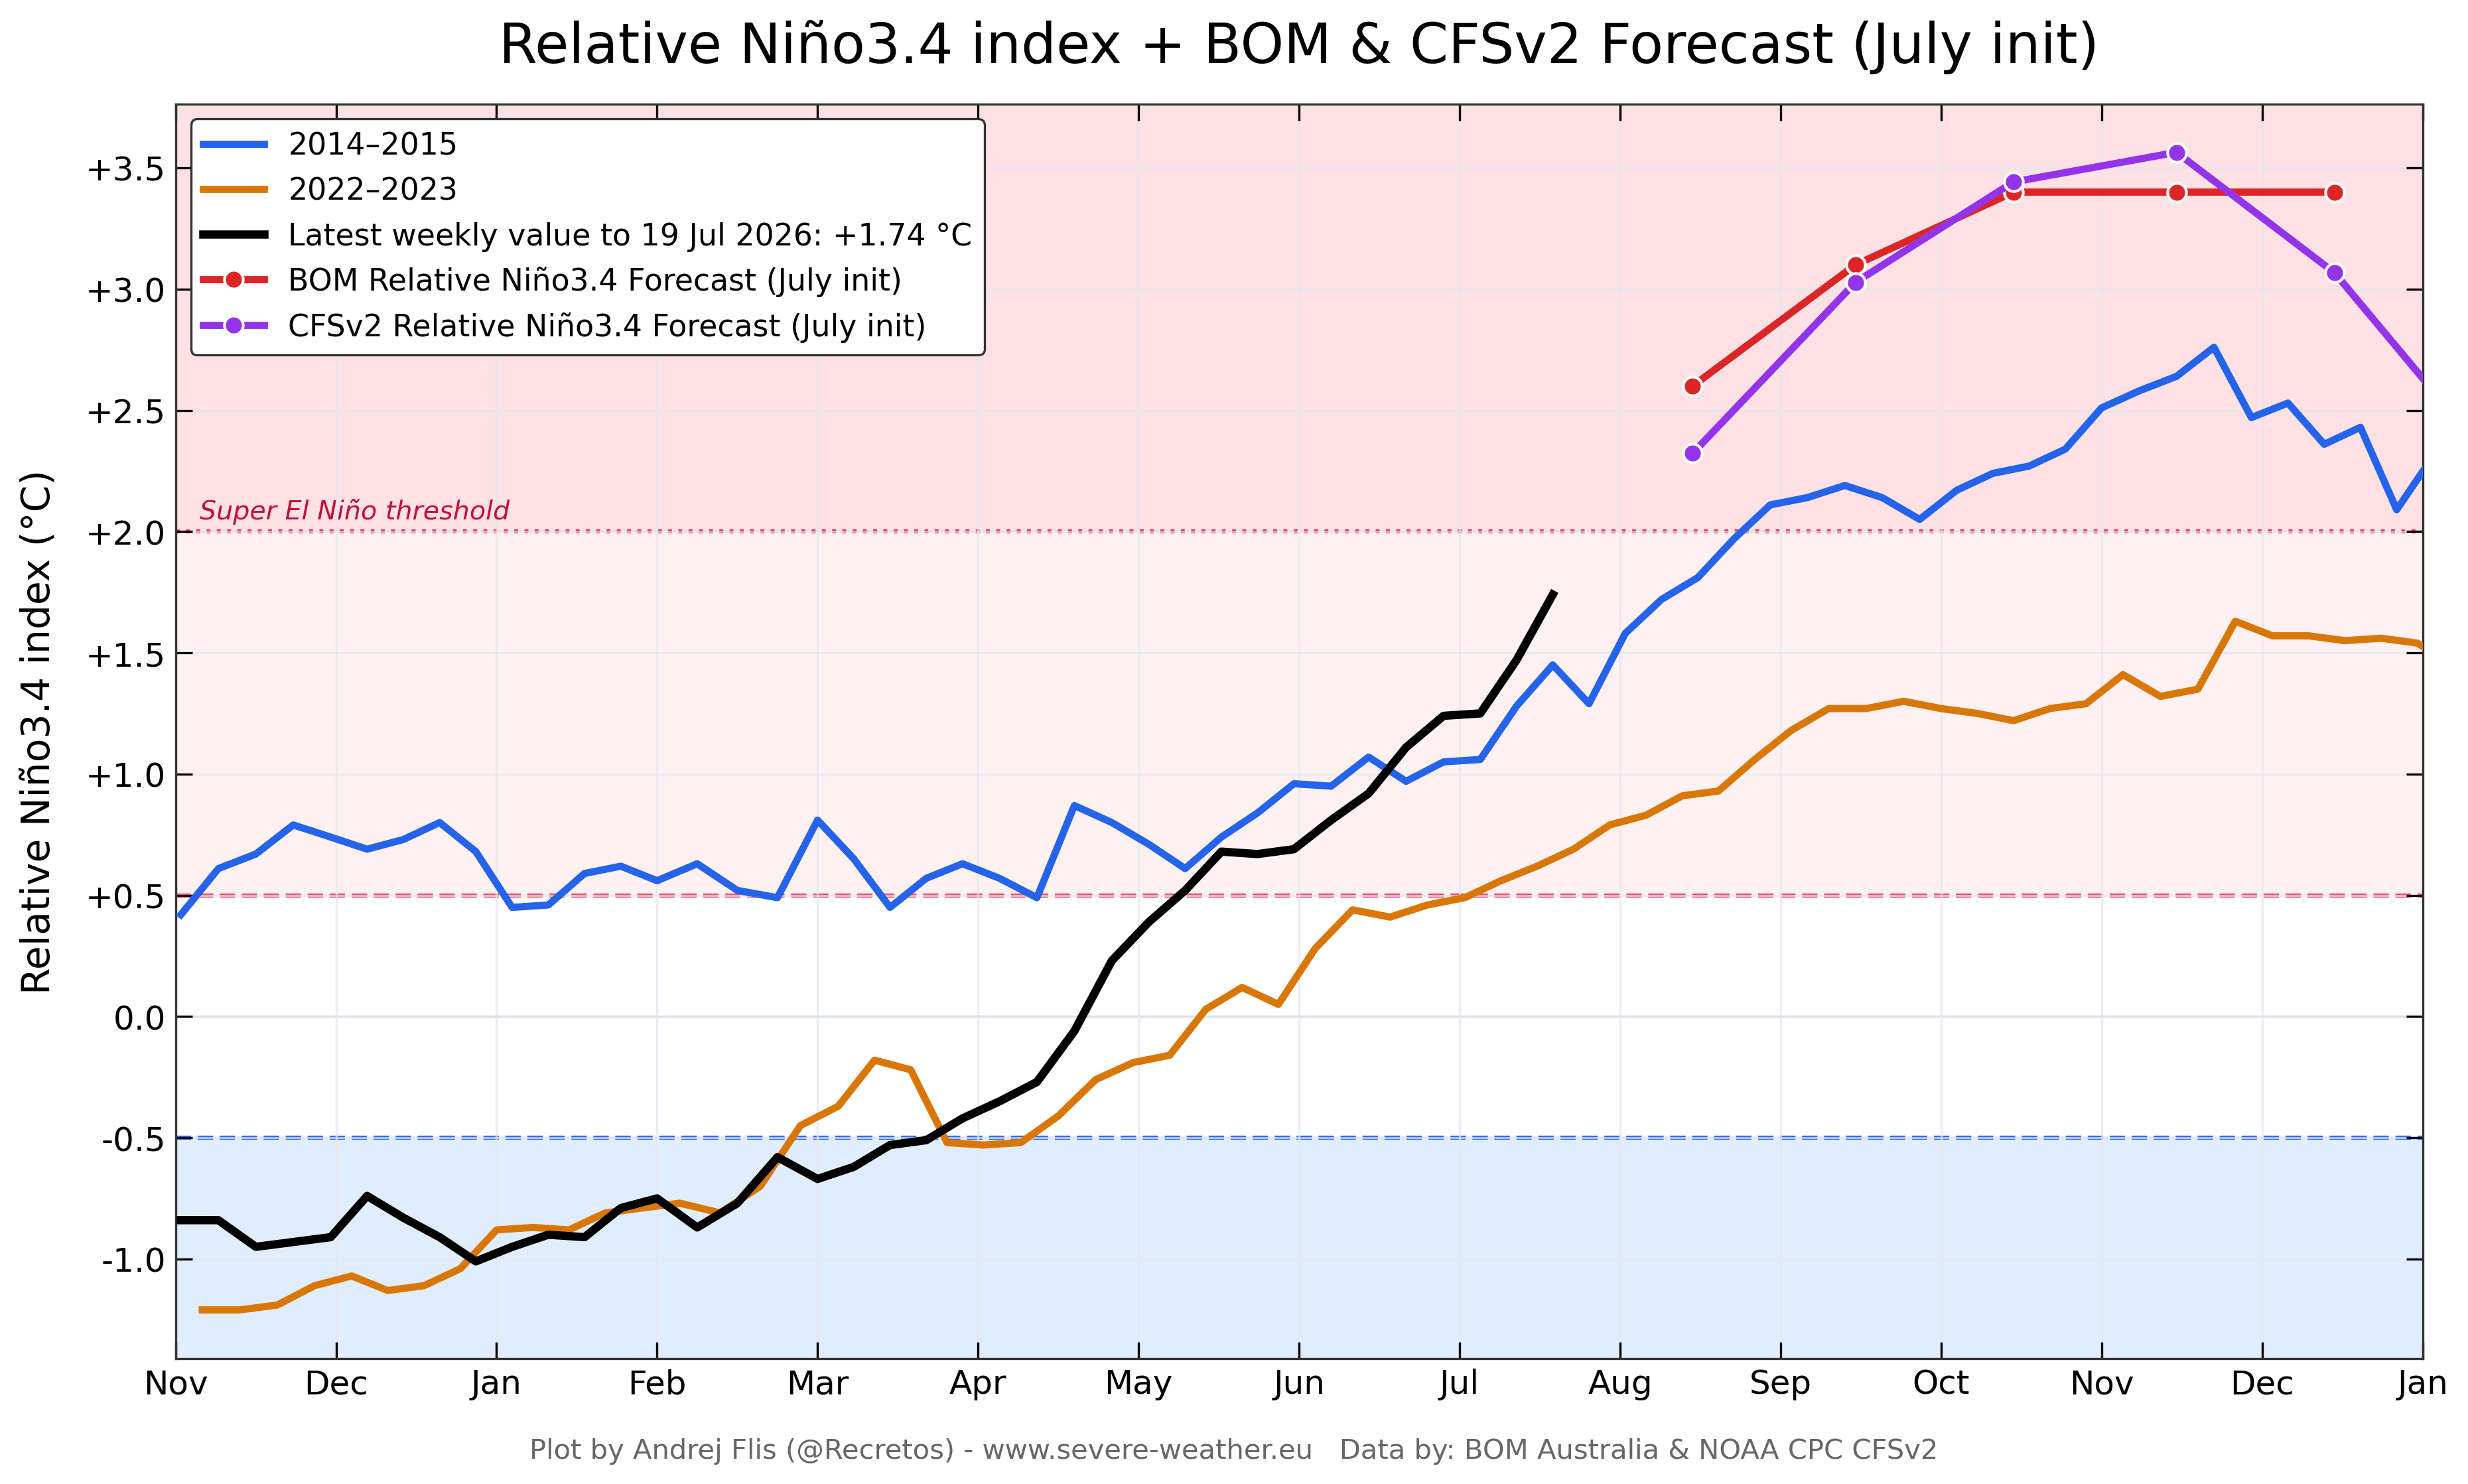
We also added the forecast from BOM and CFSv2 on the plot, which shows the extreme ceiling of the current El Niño, agreeing with the ECMWF forecast for peaking close to +3 degrees above normal. We use the relative ENSO index for the analysis and forecast because it is normalized across decades, making events directly comparable.
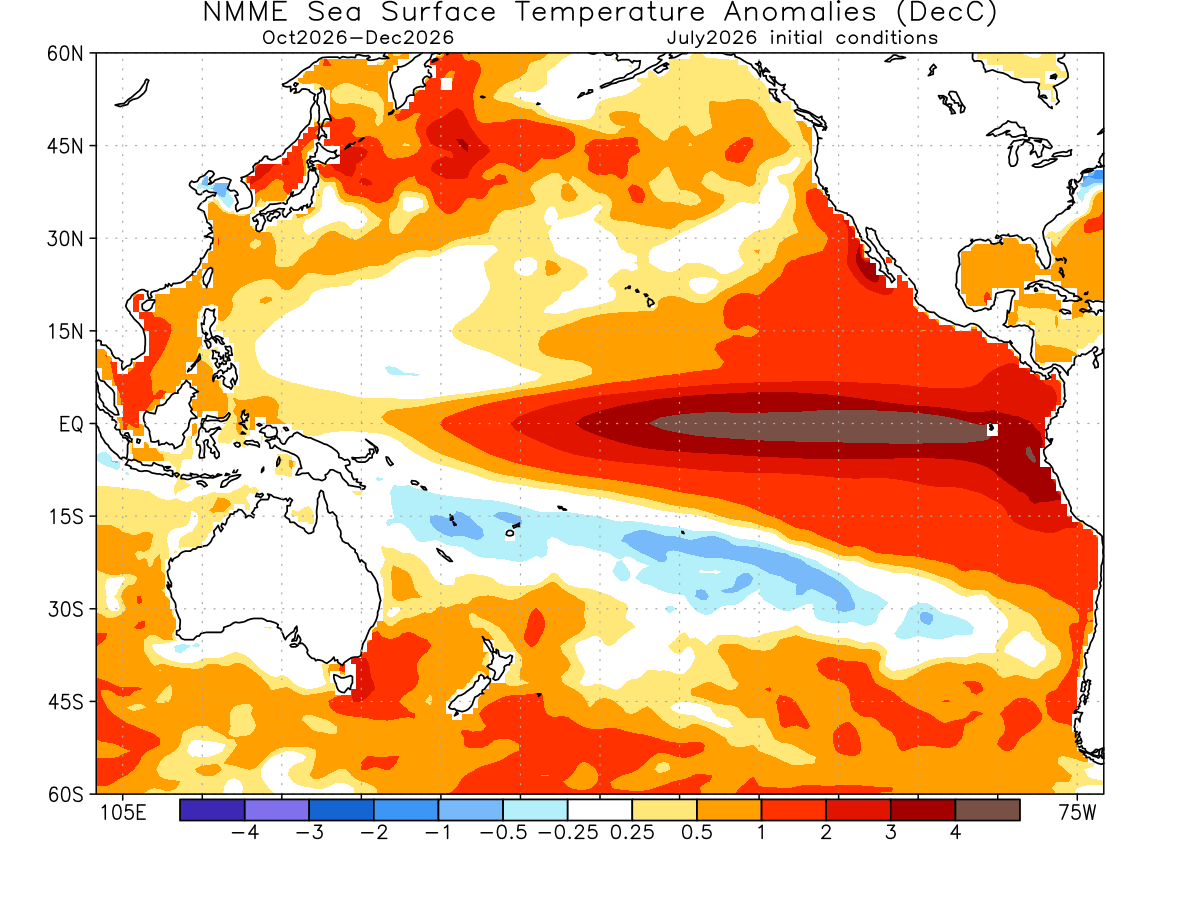
The full extent of the 2026 event is seen on the latest NMME forecast for the October-December period, which shows a significant El Niño anomaly across the tropical and northern Pacific. The anomaly values peak across the entire ENSO region above +4 degrees, making this a remarkable event if verified.
A Super El Niño event leads to more extreme weather shifts, turning typical seasonal changes into high-impact events with massive flooding, severe droughts, and significantly altering the location and strength of pressure systems, affecting the weather worldwide.
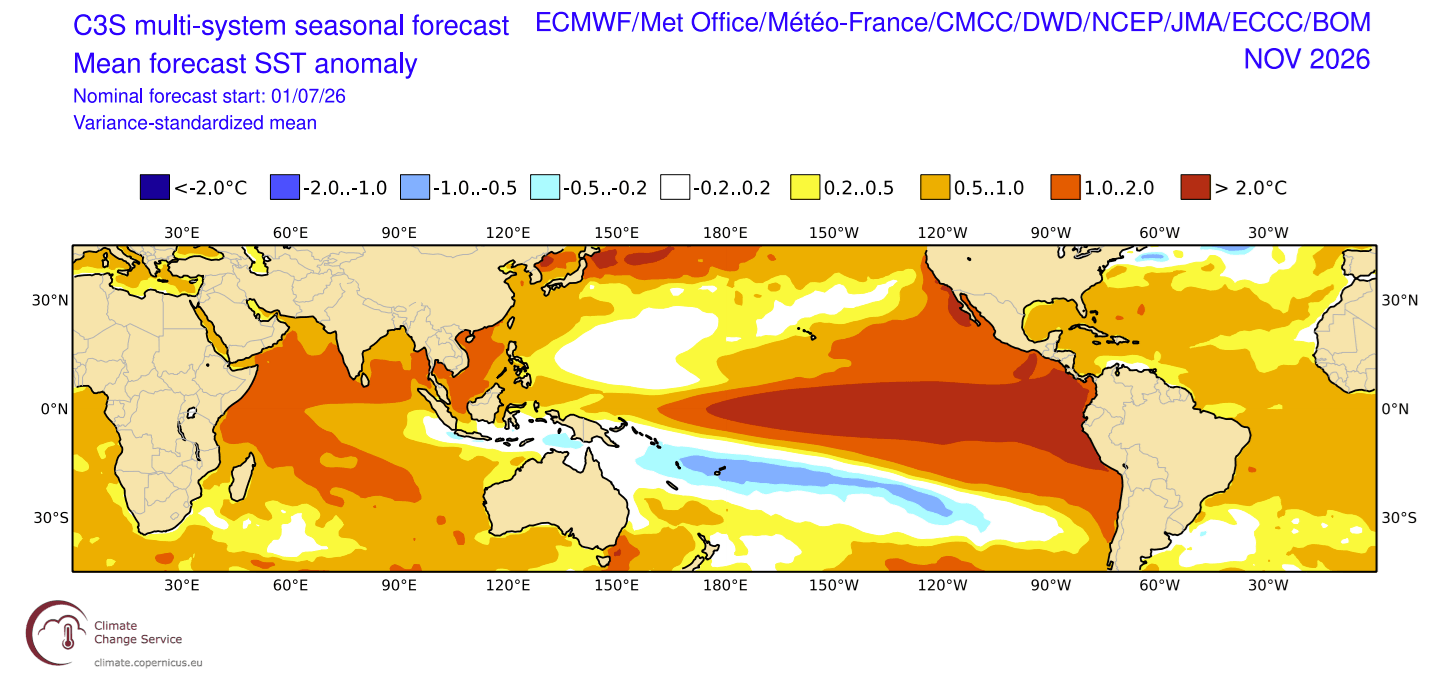
El Niño events usually peak later in the year, with the latest forecasts trending toward a max anomaly around November-December. The multi-system forecast below for November shows a really strong event, with the Super El Niño anomaly covering over 10% of the global ocean surface.
The latest forecasts are also continuing a trend of showing a stronger El Niño with each new forecast run, pushing the 2026 event into the clear record-breaking scale.
New Forecasts Push El Niño Toward the Top of the Historical Record
We produced a custom forecast plot that compares the most recent forecasts with the historical El Niño events since 1870. The forecasts from 3 different weather centers all show a record-strong El Niño event, not seen in modern history, and likely to peak higher than any El Niño in the past 155 years.
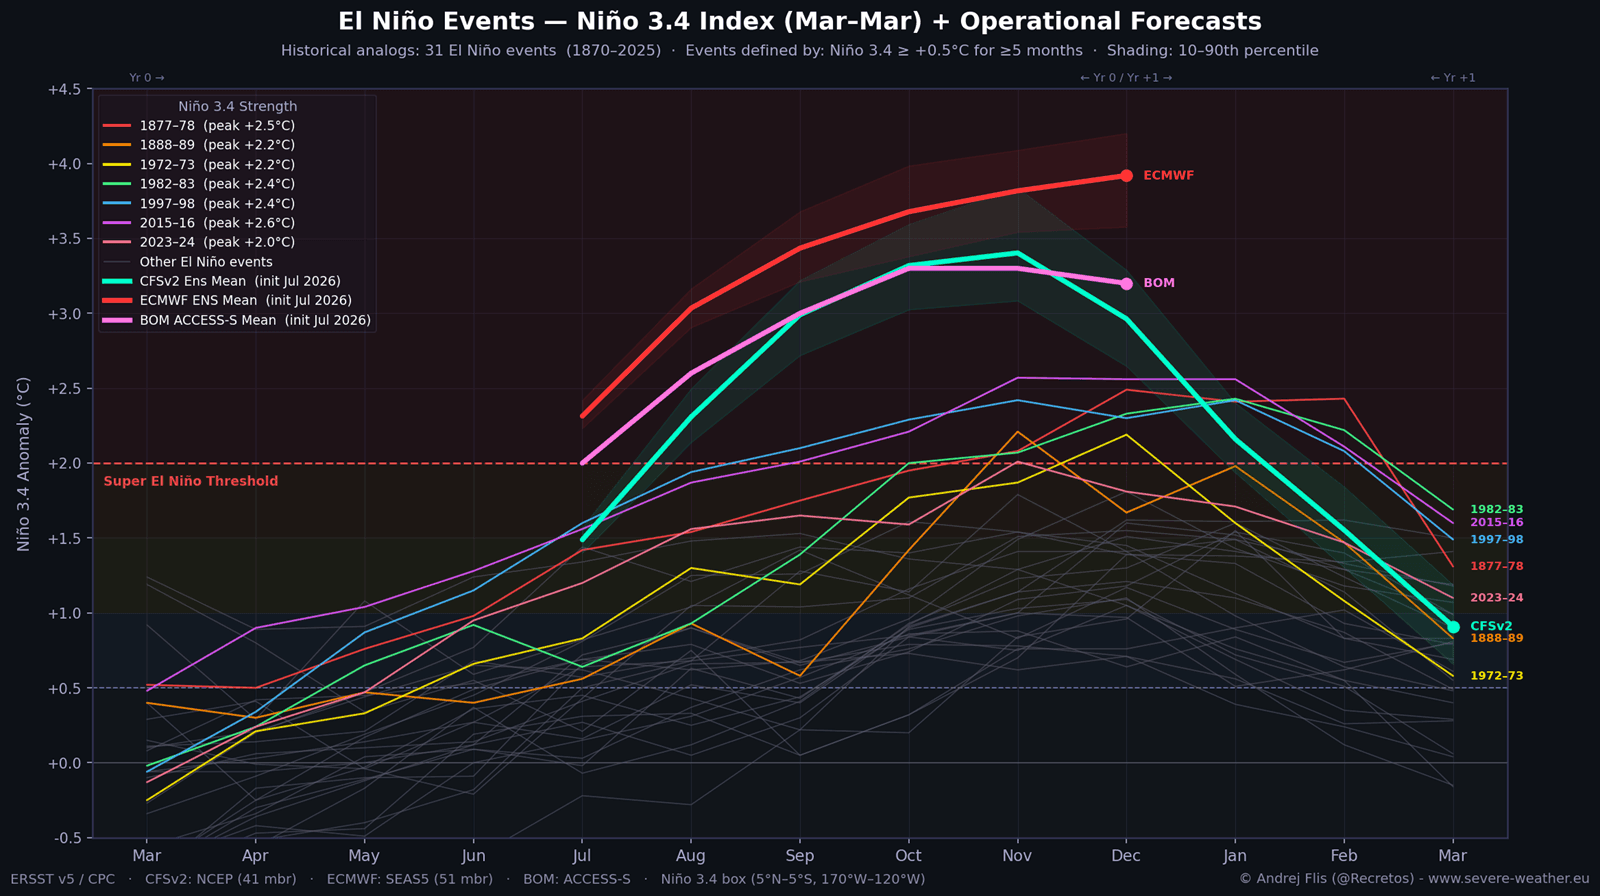
Forecasts are from the NOAA CFSv2 model in the United States (cyan line), the European ECMWF (red line), and the Australian BOM (pink line). Three forecasts from three continents and from different modeling authorities, all showing that we are heading for a record-strong event in 2026/2027.
The projected 2026 peak is currently higher than any previous Super El Niño event. This in itself is a big “red flag” scenario, warning us of the potential weather impacts ahead for months to come.
But we are also observing a trend in which each new forecast shows a stronger peak anomaly. Below is a comparison of the last 7 ENSO forecasts, released since January. You can clearly see that each new run shows a stronger event, with the last two runs pushing it into record-strong territory, above all previous events.
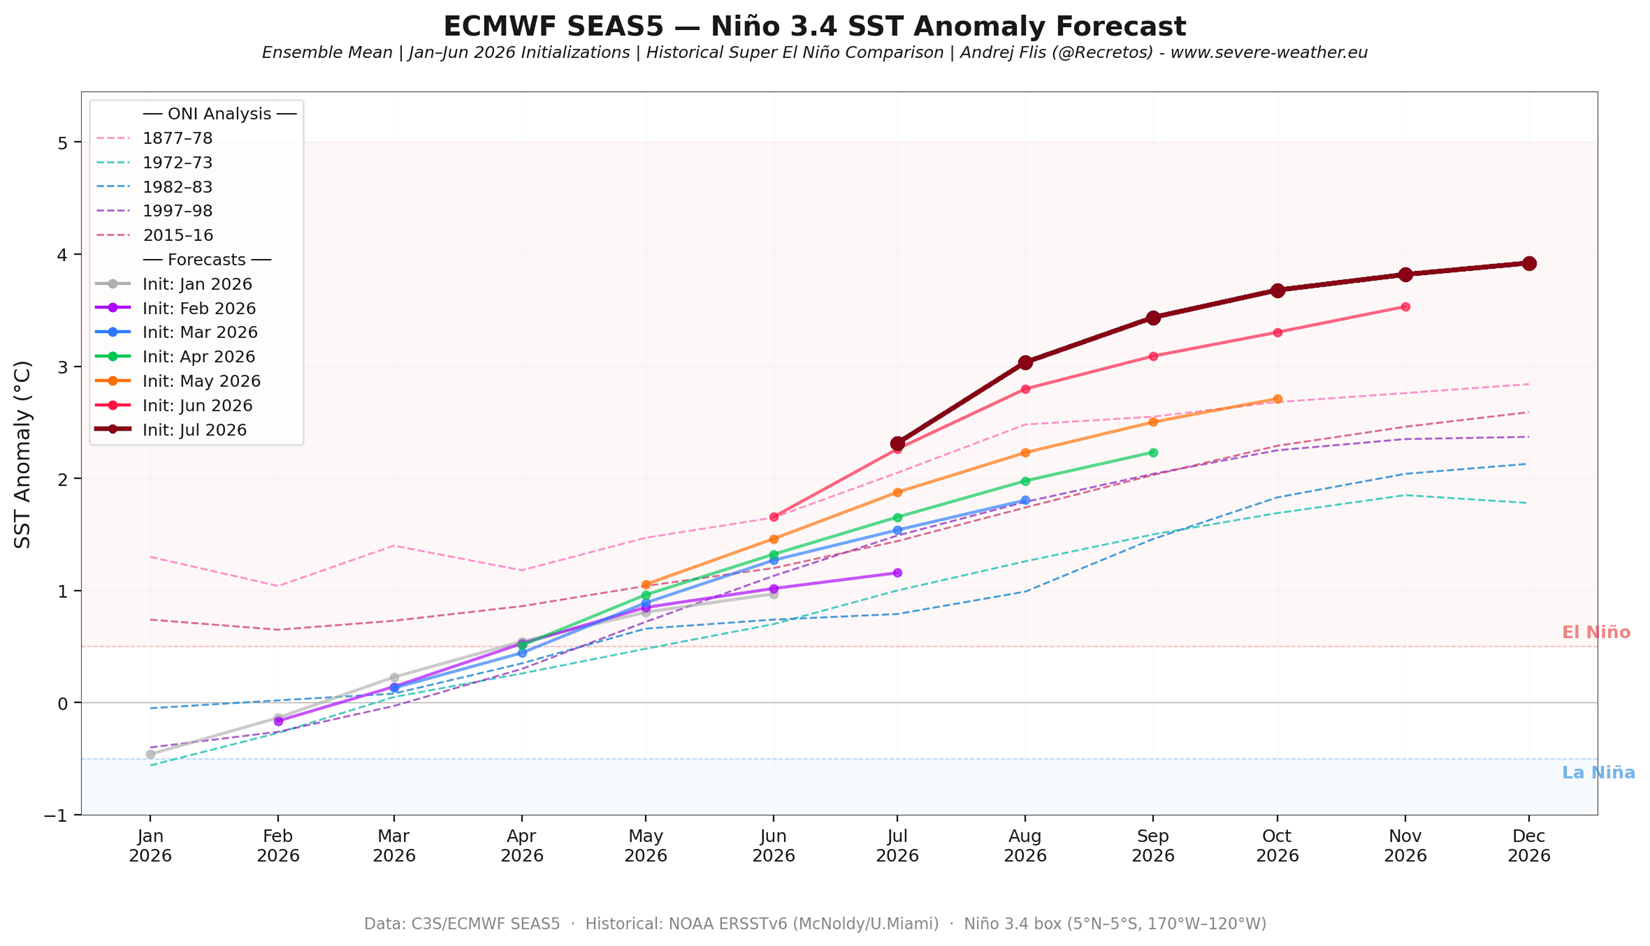
This is because the latest data is always used to produce a forecast. And as the event is unfolding, we get a much clearer analysis, from which the forecast is produced. In this case, the long-range data doesn’t fully grasp the strength of the westerly wind bursts in the Pacific, so once it sees it in the analysis data, it properly adjusts the forecast with each new run.
All the data so far shows that a truly remarkable ocean event is unfolding, but it has already been detected in the atmosphere as well.
The Global Atmospheric Shift Into El Niño Mode
To search for the atmospheric signature of the El Niño, we need to find its circulation in the Walker cell, the tropical rising and sinking of air.
Below is the latest analysis of the so-called Velocity Potential parameter, which is used to reveal the broad areas of rising and sinking air in the atmosphere. You can see a large rising air anomaly directly over the central and eastern Pacific, forced by the lower pressure and rainfall of the El Niño.
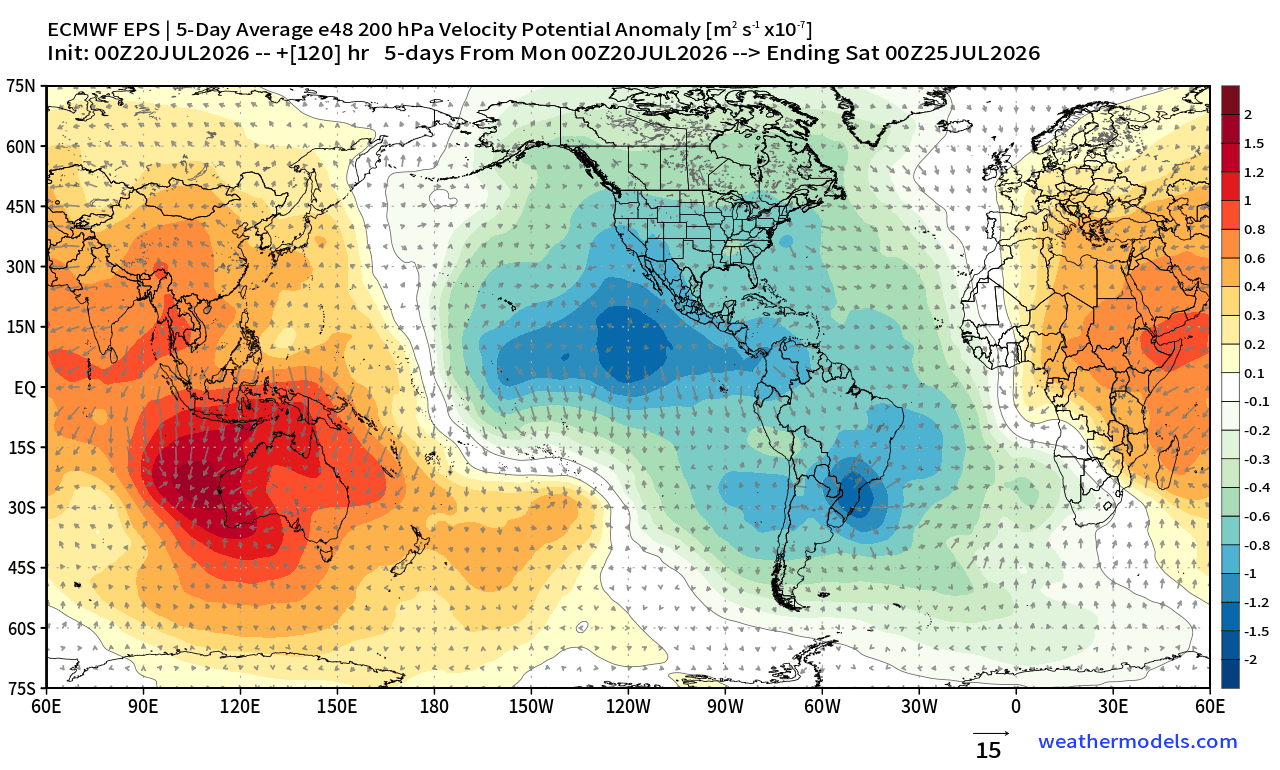
These areas of rising and sinking air (Walker cell) are usually dynamic, moving around the globe with different atmospheric waves and drivers. But when a Super El Niño appears, the strong ocean heat and energy overpowers these moving weather drivers.
It can force the atmosphere to lock down, creating what scientists call an atmospheric standing wave. We can see this in the ECMWF extended forecast below, which shows the main areas of the Walker cell. You can see an almost fixed/stationary area of rising air and low pressure over the tropical Pacific and the ENSO region, revealing the standing wave formation.
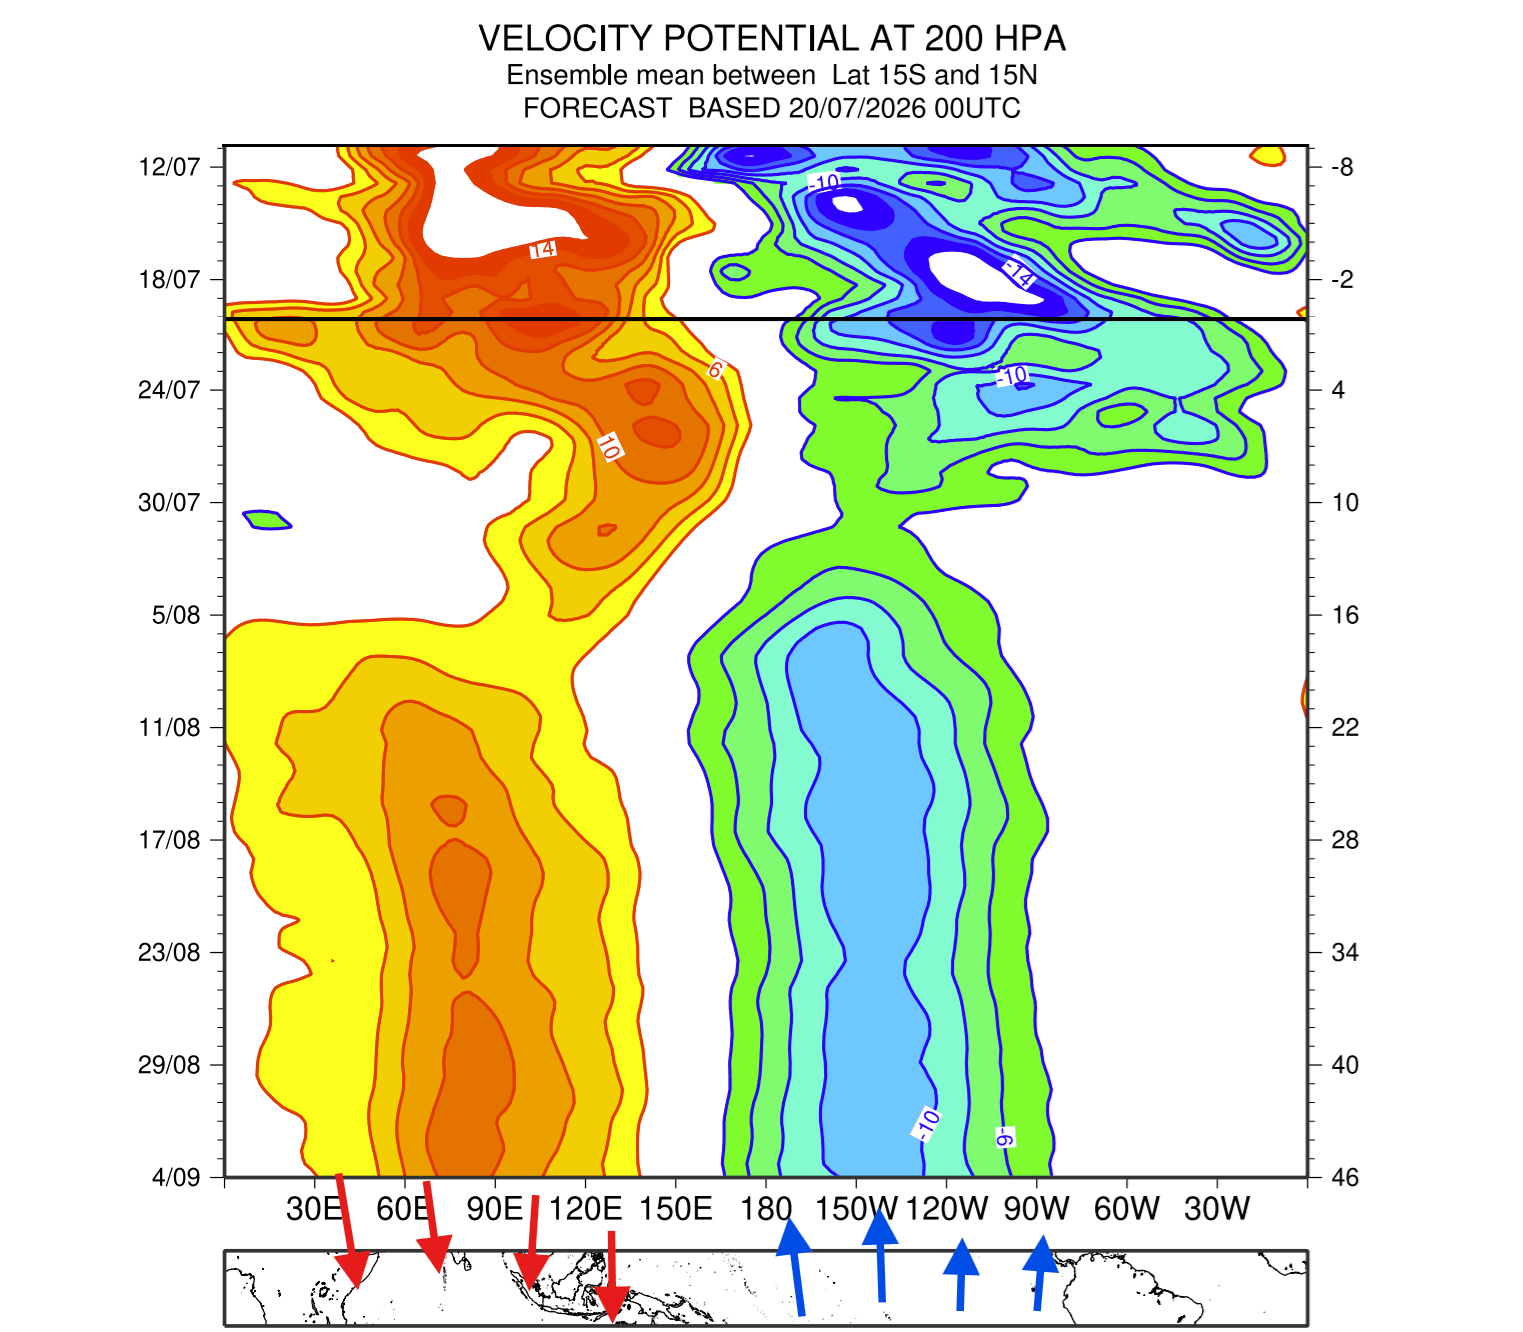
If we look further ahead into September, the forecast shows a strong anomaly of rising air over the Pacific and sinking air in the Indian Ocean. With a huge standing wave of rising air above the Pacific, the atmosphere is locked in El Niño mode, and staying in this mode at least through Winter 2026/2027 and next Spring.
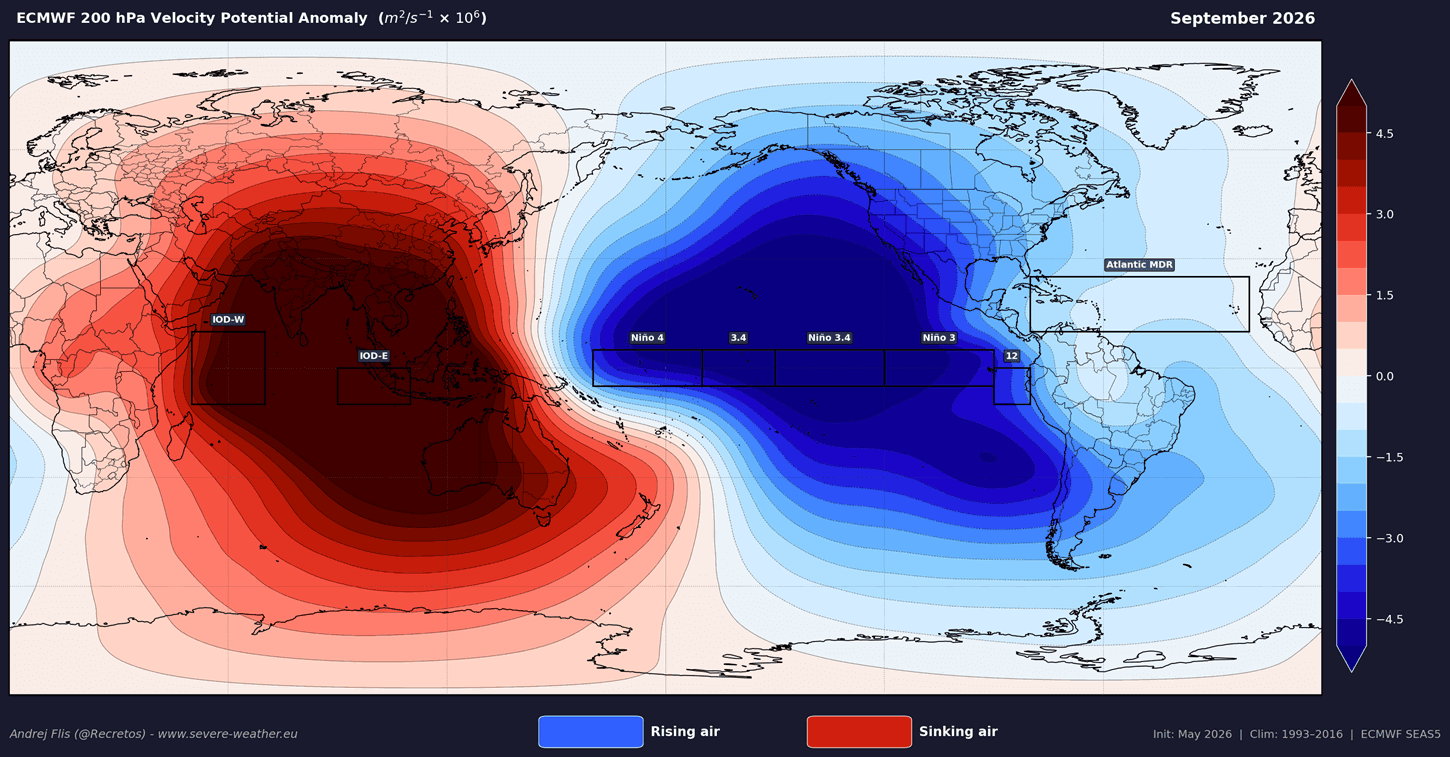
This means the weather in your backyard is directly or indirectly connected to what’s happening in the tropical Pacific, affecting the whole planet, no matter how far away you live.
With the potentially record-strong 2026/2027 Super El Niño event, we might be entering uncharted territory in terms of atmospheric impacts. Usually, the biggest impact in the Northern Hemisphere arrives during Winter, when the pressure systems are at their strongest.
Winter 2026/2027: The Strongest Signal Develops Over North America
In this segment, we will focus on Winter 2026/2027, since it’s the most high-impact season, and usually of most interest. We already wrote separate forecast and analysis articles on the Fall season and the Atlantic Hurricane season, which we will also link down below.
During an El Niño cold weather season, a persistent, strong low-pressure area forms in the North Pacific. That pushes the polar jet stream further north, bringing warmer-than-normal temperatures to the northern United States and western Canada. Below is an El Niño weather pattern schematic that highlights the main areas of impact.
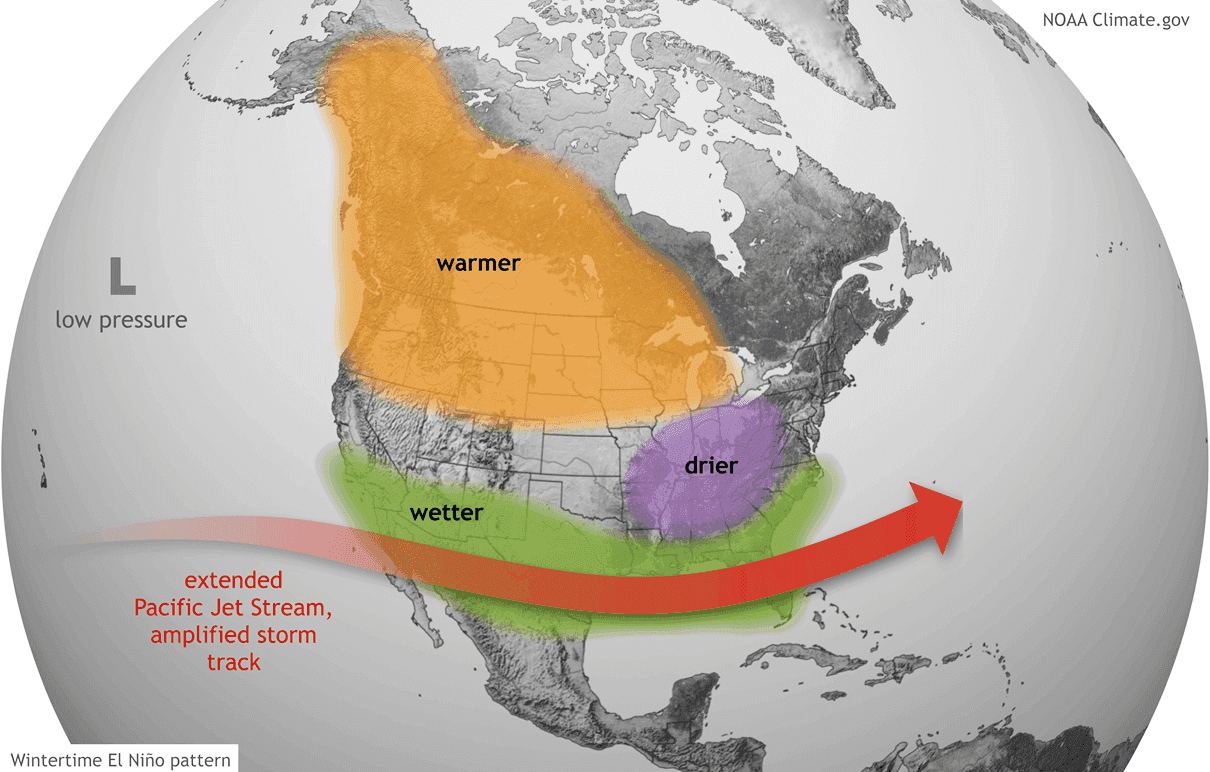
Also very important is that the southerly Pacific jet stream gets amplified during an El Niño. That means more low-pressure systems and storms over the southern half of the United States, with lots of precipitation and cooler weather, moving east.
But since we are in a potential record strong Super El Niño, the textbook scenarios might severely underestimate the weather development. Especially towards early-mid Winter, when the pressure patterns really start amplifying.
Below is the January forecast trend from two different models, the NOAA CFSv2 and ECMWF. Both show a nearly identical high-amplitude Winter pattern, dominated by a high-pressure blocking anomaly over Canada in the mid-levels. This blocking anomaly acts like a large obstacle, deflecting the polar jet stream and creating a milder, warmer-than-average Winter across most of Canada and the far northern United States.
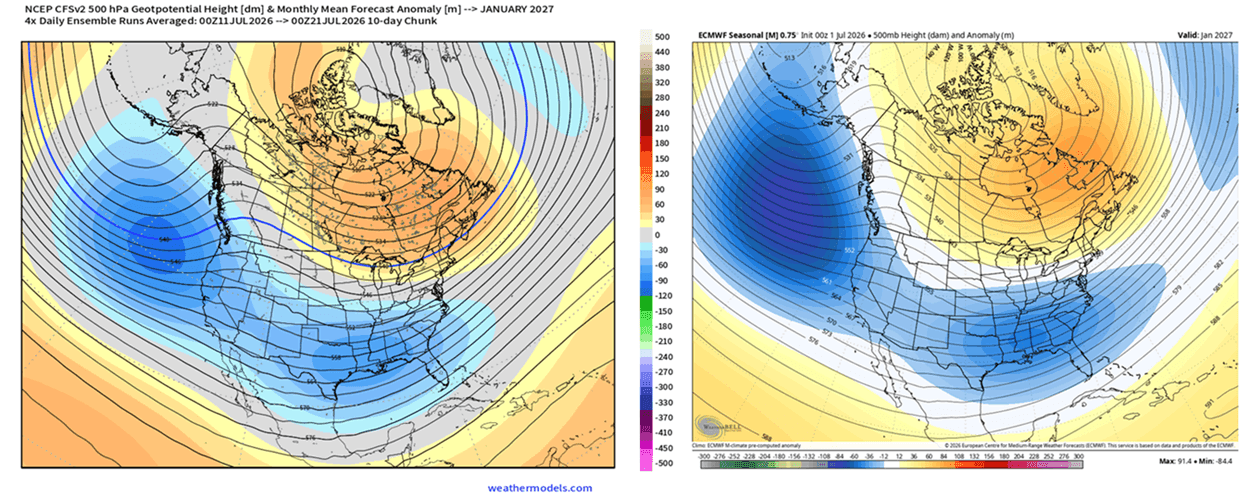
In response, a highly active area of low pressure is forecast to stretch straight across the Western, Southern, and Eastern United States. This reflects a powerful Pacific jet stream, which brings frequent, moisture-rich systems to the Southern, Central, and Eastern United States, as well as lower temperatures.
The January trend forecast also shows a highly amplified sea-level pressure pattern over North America. Strong positive anomalies are centered over Canada and Greenland, and extensive low-pressure anomalies stretch from the North Pacific across the United States. In essence, this is a proper pressure anomaly for a strong El Niño, but amplified in a Super event.
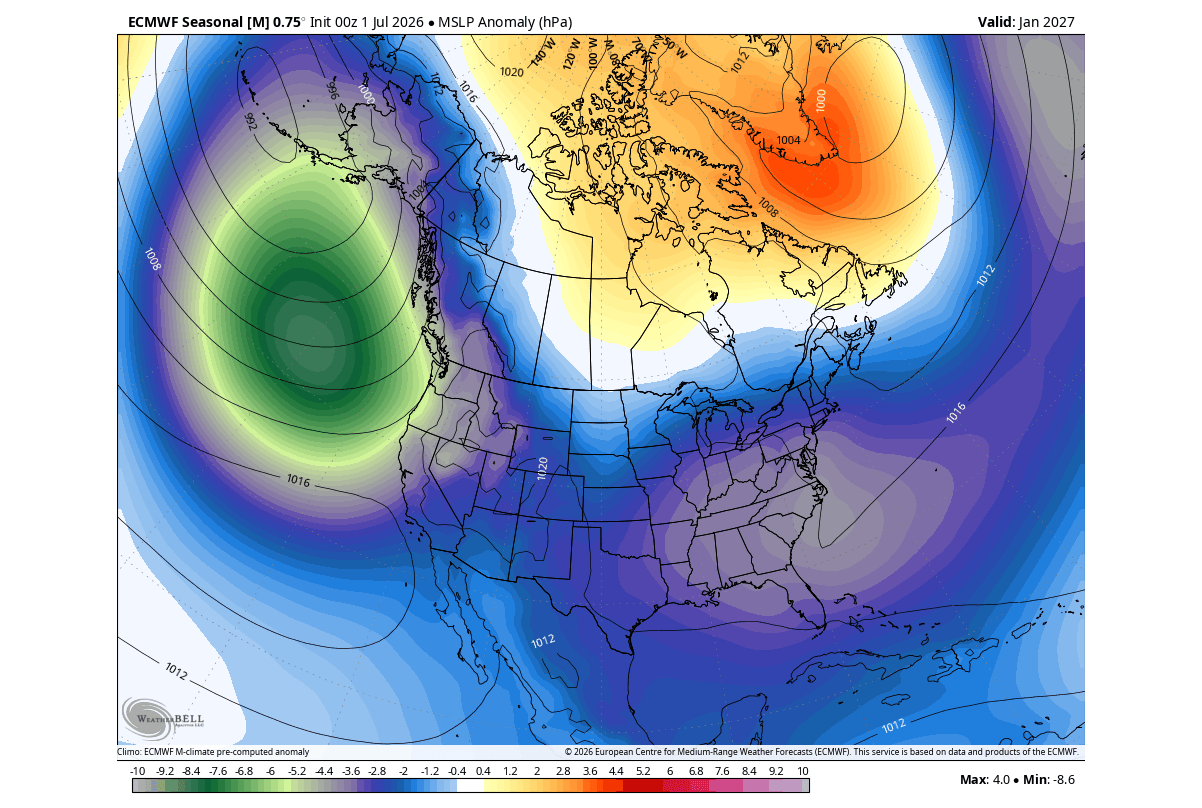
Such a pattern supports a stronger southern storm track across the United States, while the Canadian high-pressure anomaly can help deflect colder air southward into parts of the central and eastern United States. This is not a promise of snowstorms or cold outbreaks, but it signals a winter pattern with increased potential for stronger storm systems and temperature contrasts into January.
Also, one might ask, why do we bother with January forecast trends in mid-Summer? As you can see, most (if not all) forecasts are already fixating on a specific pressure pattern, really highlighting how strong a driver this Super El Niño actually is, allowing us to grasp good early trends.
We can also use the CFSv2 forecast for February, as most other forecasts don’t reach this far out yet. But it shows even stronger amplification of the pattern, creating a deeper low-pressure zone over the eastern United States, and a stronger high-pressure block over Canada.
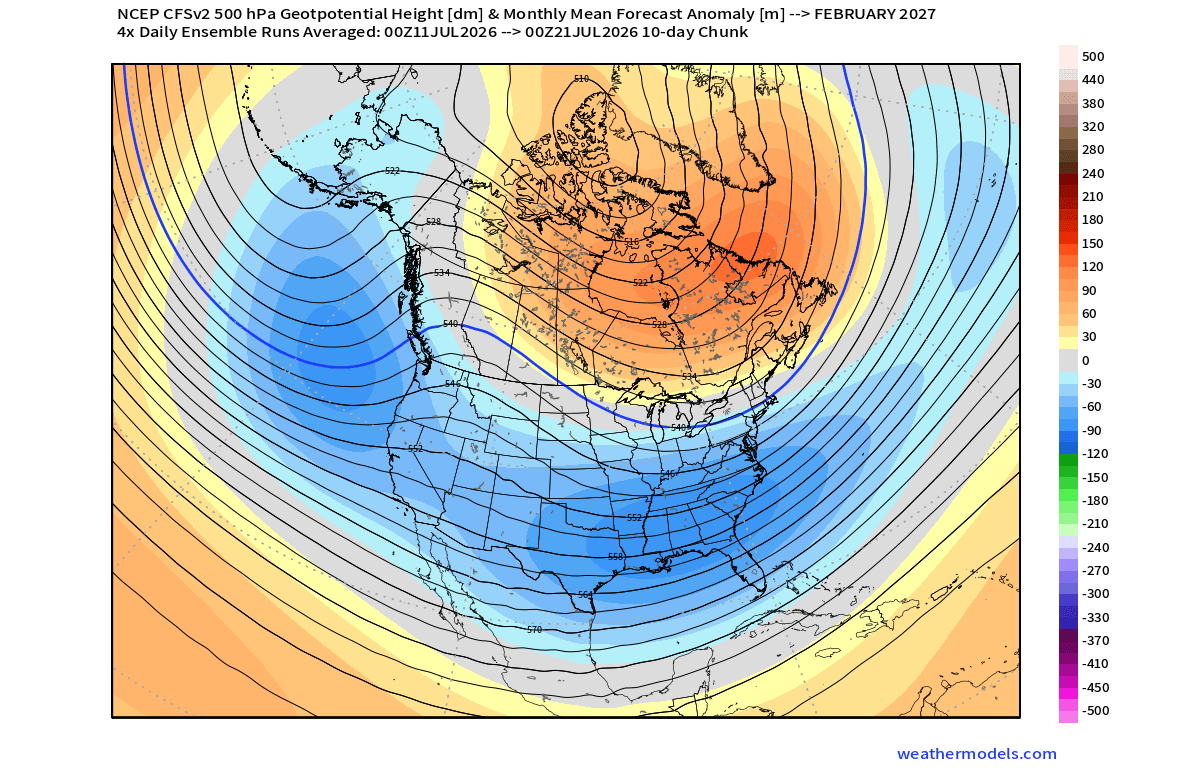
This setup drives an energized southern jet stream, bringing frequent low-pressure systems, heavy precipitation, and stormy weather from California and Texas through the Gulf Coast and into the East.
Paired with strong high-pressure blocking over Canada (orange), this broad trough can open the door for colder air intrusions and heightened winter storm potential across the Central, Southern, and Eastern United States.
The surface temperature anomaly forecast for January and February directly reflects this impact of the southern jet stream setup. You can see how temperature patterns are projected to evolve across North America as the El Niño influence reaches its mid-to-late winter peak, with a spreading anomaly of below-normal temperatures.
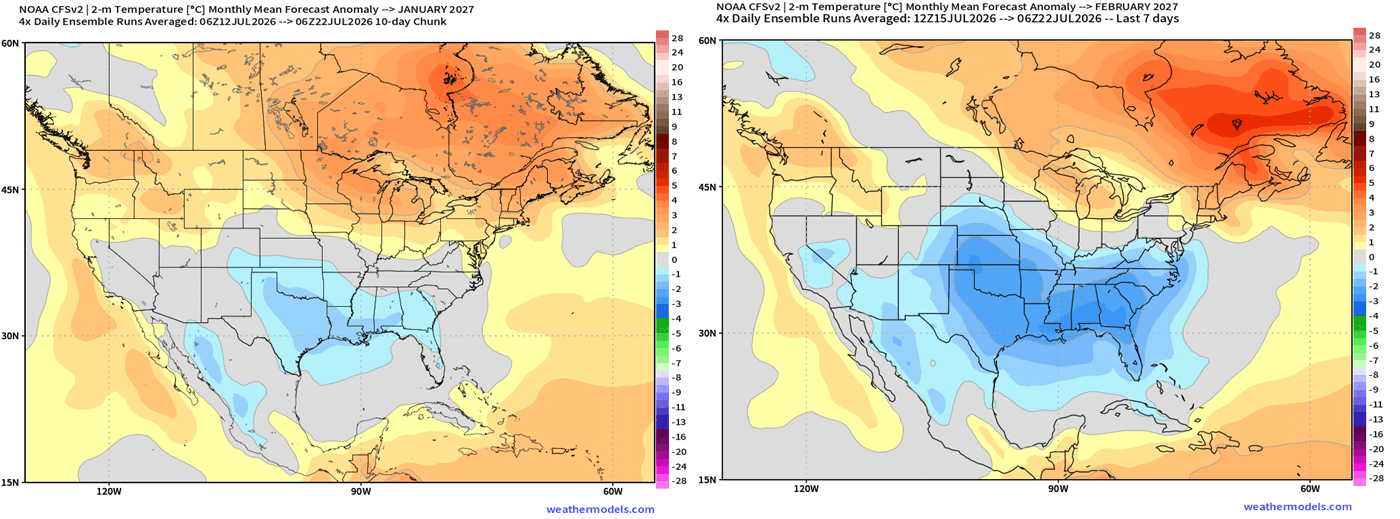
In January (left), a distinct cooling footprint establishes itself across the Southern Plains and Gulf Coast, contrasted by strong warm anomalies across Canada. By February (right), this temperature split intensifies, with a broad pool of below-normal temperatures deepening and expanding across the Central, Southern, and Eastern United States as cold air intrusions become far more frequent.
The NMME multi-model forecast shows a classic, active El Niño storm track in the January-March period. A continuous corridor of above-normal moisture stretches across the entire southern half of the United States, creating above-normal precipitation in the southern and eastern parts of the United States.
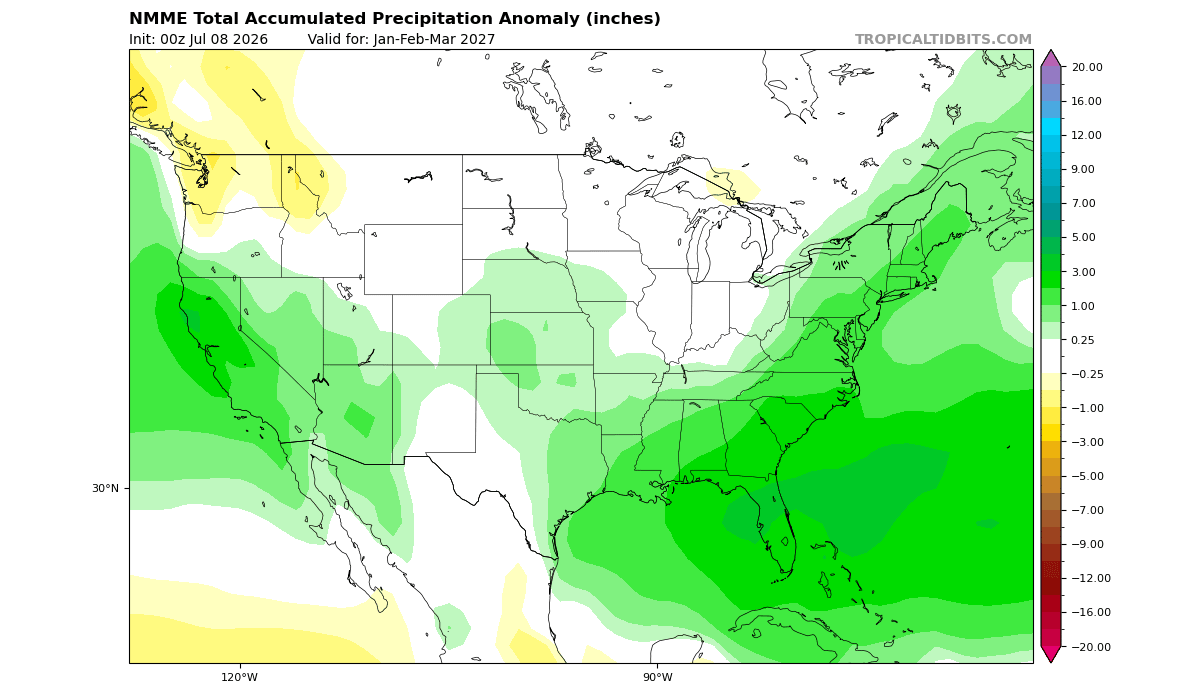
Where this heavy moisture track intersects cold air, the setup significantly elevates the potential for major winter storms, ice events, and heavy snowfall from the Southern Plains and Mid-Atlantic into the interior Northeast. But it does rely on having a cold enough air mass to work with.
Europe Shows a Different and Less Certain El Niño Response
We can also take a look at the mid-winter pattern for Europe. The January forecast trend shows a typical strong El Niño pattern, with a high-pressure ridge from the south and a low-pressure area over the northwestern and northern parts, as the CFSv2 (left) indicates.
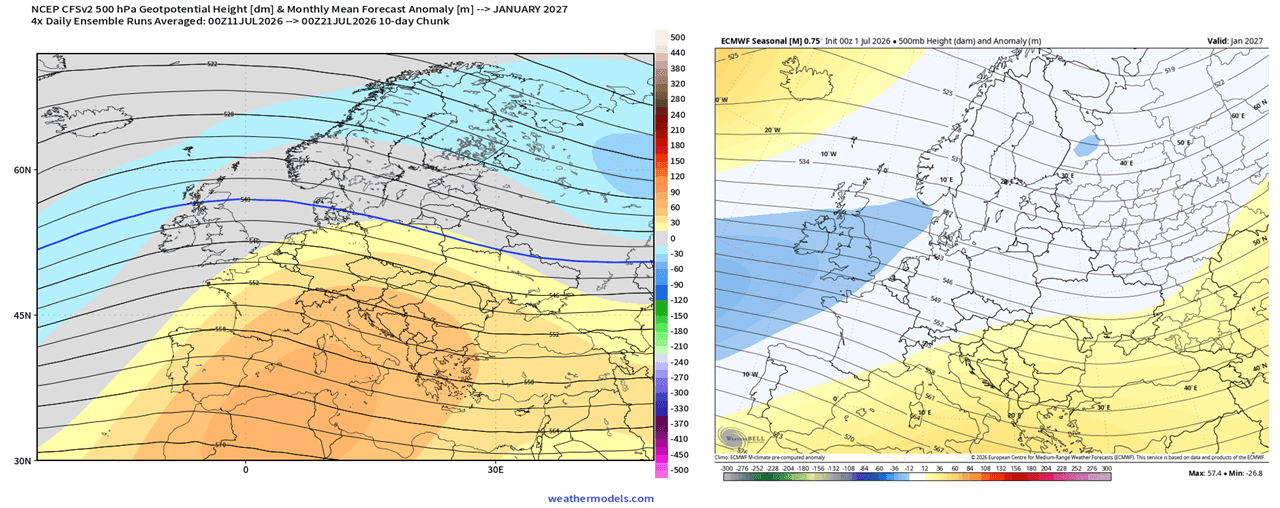
The ECMWF forecast on the right is similar, but shows a bit weaker ridge, allowing the low-pressure zone to drop further down, allowing northwest Europe a better chance at a northerly flow.
This is reflected in the January temperature forecast, where the CFSv2 shows a large spread of above-normal temperatures under the expanded ridge. But the ECMWF on the right still allows some northerly flow into the UK and Ireland, as the low-pressure area sits further south.
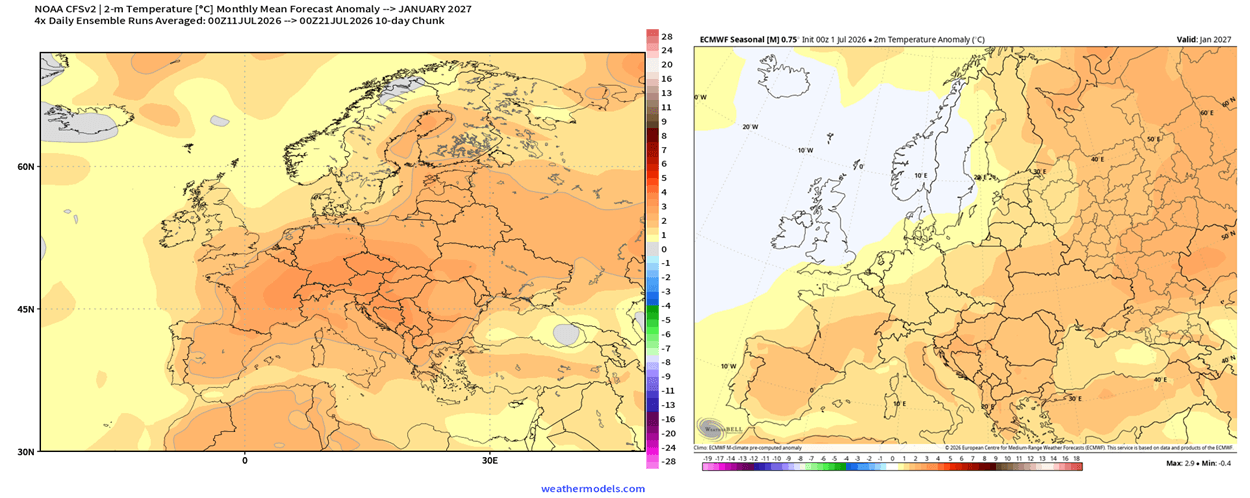
This goes to show that the pattern over Europe is not yet locked in, because this region is not under a direct impact from El Niño as North America. We can, however, still see a stronger ridge trend in the forecasts, consistent with past strong El Niño events.
But aside from El Niño, there is one more winter weather driver that works in the atmosphere, and can actually be modified by the El Niño to help shape the pressure anomalies: the stratospheric Polar Vortex.
Super El Niño Raises the Risk of a Polar Vortex Disruption
In simple terms, the Polar Vortex is a name for broad winter circulation over the northern (and southern) hemispheres. You can imagine the Polar Vortex as a spinning wall over and around the polar regions, rising from the surface into the stratosphere (over 50km/ 30miles high), trapping the cold polar air inside when strong.
But a weak Polar Vortex creates a disrupted jet stream pattern as it breaks down, leading to a strong weather response. As a result, it cannot fully contain the cold polar air, which then has an easier path from the polar regions into the United States or other mid-latitude areas.
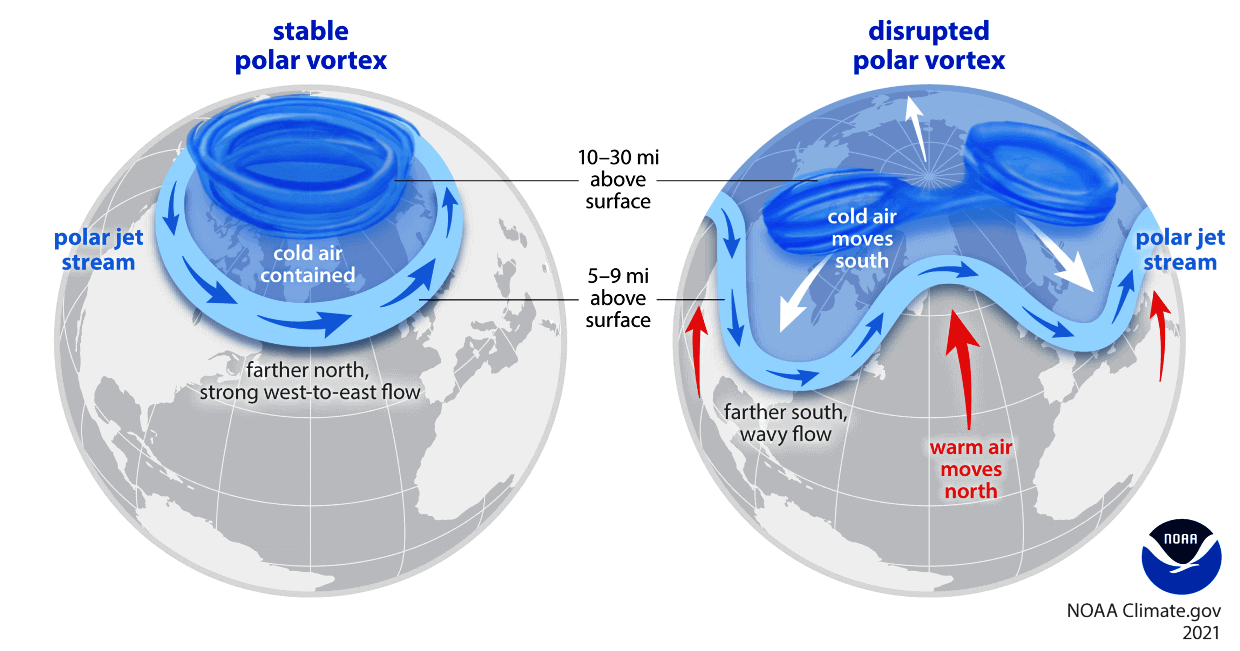
For a colder and snowier Winter, you want to see a weak Polar Vortex. In nature, a weak Polar Vortex indicates a full collapse or a major disruption of its structure, most often created by a Stratospheric Warming event, which is a rapid rise of pressure and temperature in the stratosphere, disrupting the Polar Vortex.
Historically, an El Niño winter has a high chance of producing a Sudden Stratospheric Warming event (SSW). It has usually produced them in the early and mid-winter period, but also several later in the season. The image below shows the typical SSW event frequency by month and by the ENSO event.
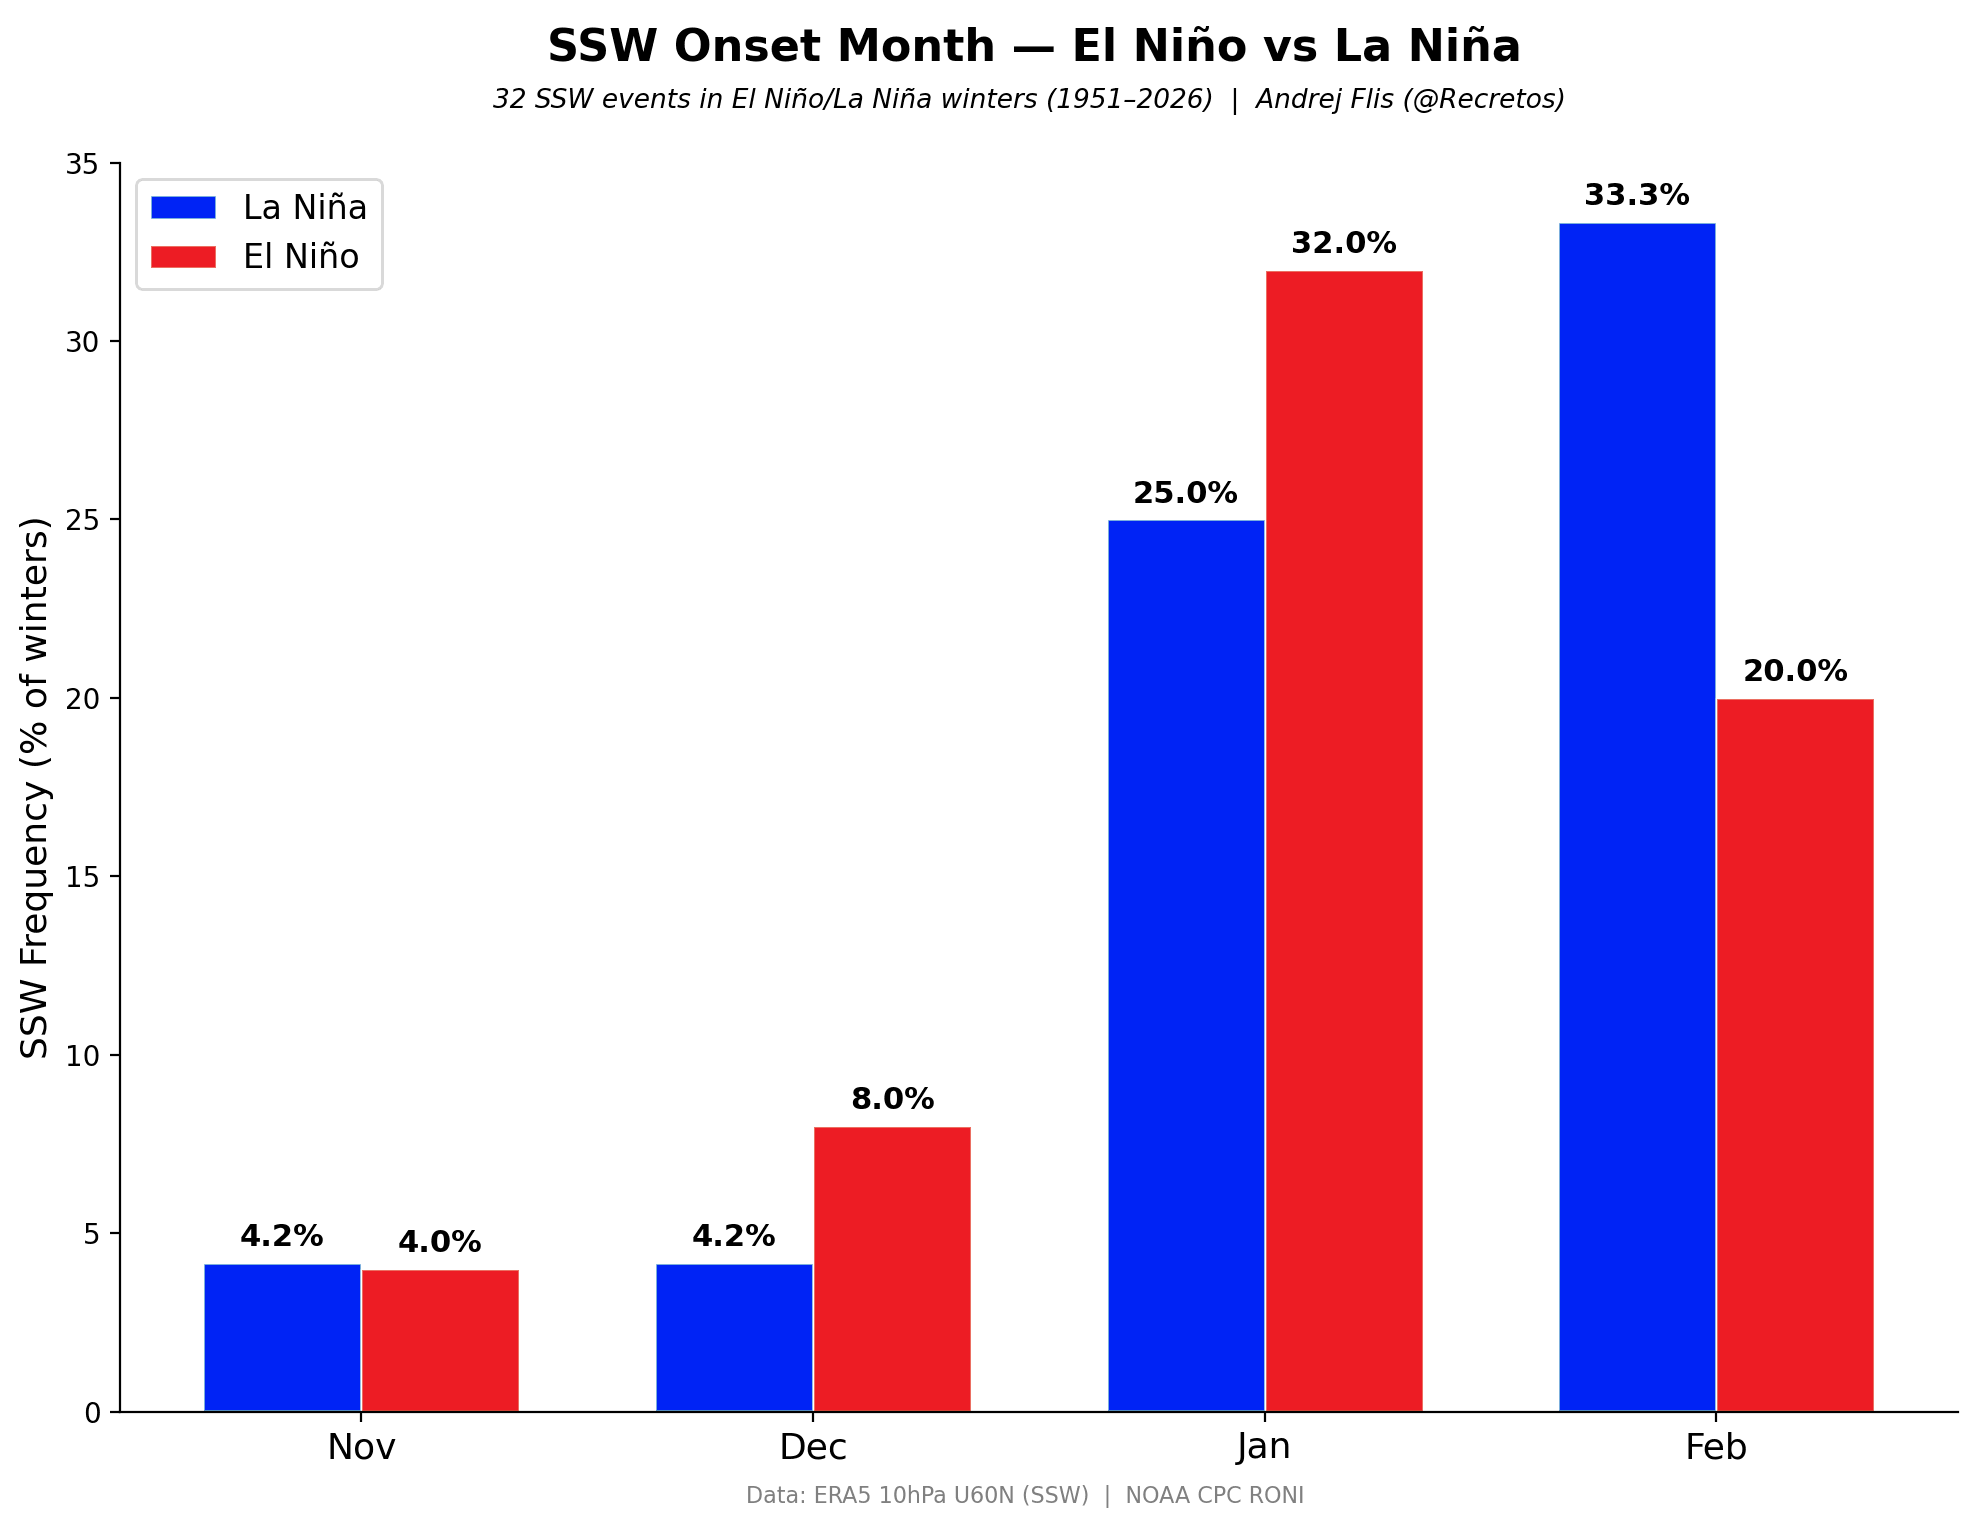
As you can see above, an El Niño phase has a higher chance of producing a Polar Vortex collapse event in mid-winter. It also shows a better chance for a Polar Vortex disruption in December and January, trying to keep it weaker from the very start of the season.
The strength of the El Niño also matters. Below is the winter atmosphere simulation from a recent study, that compares the Polar Vortex impact of El Niño (EN) in different strengths: weak (W), moderate (M), and strong or super event (S).
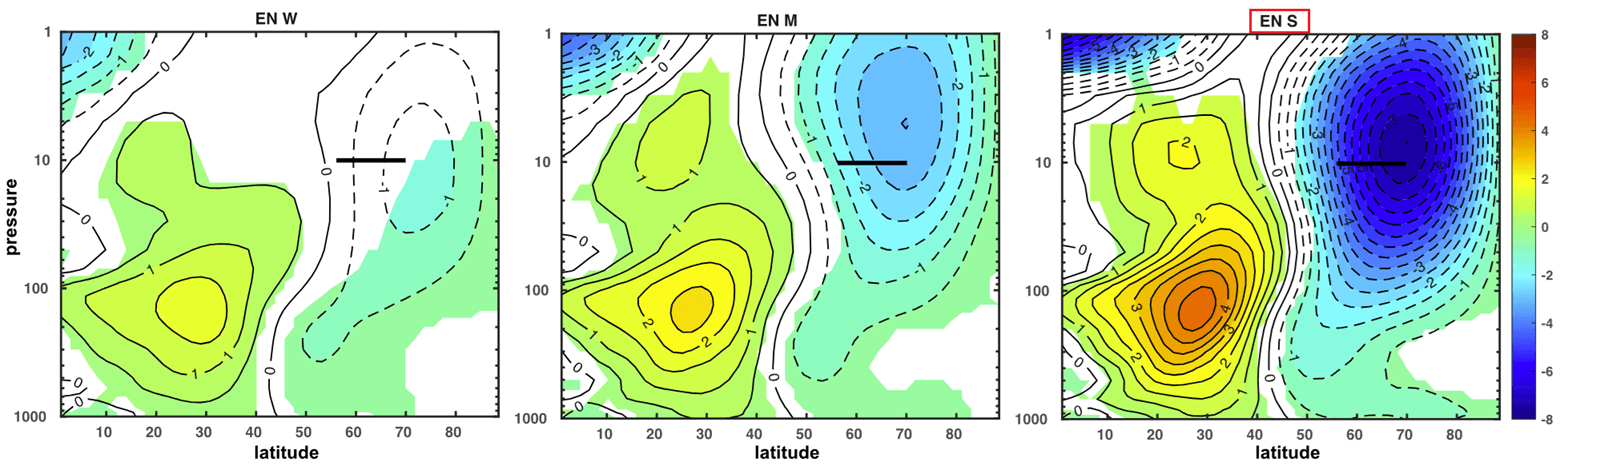
As you can see on the very right panel, the strong El Niño shows a significant deceleration of the stratospheric Polar Vortex in the polar regions, leading to a potentially more disrupted weather pattern across the United States, Canada, and Europe.
The raw seasonal forecast data allows us to look at the trends for the stratosphere. Below you can see the Polar Vortex forecast, or rather its wind, which is the main way we estimate its strength. The latest seasonal forecast data shows a surprising Polar Vortex disruption trend for January, as one would expect for a Super El Niño year.
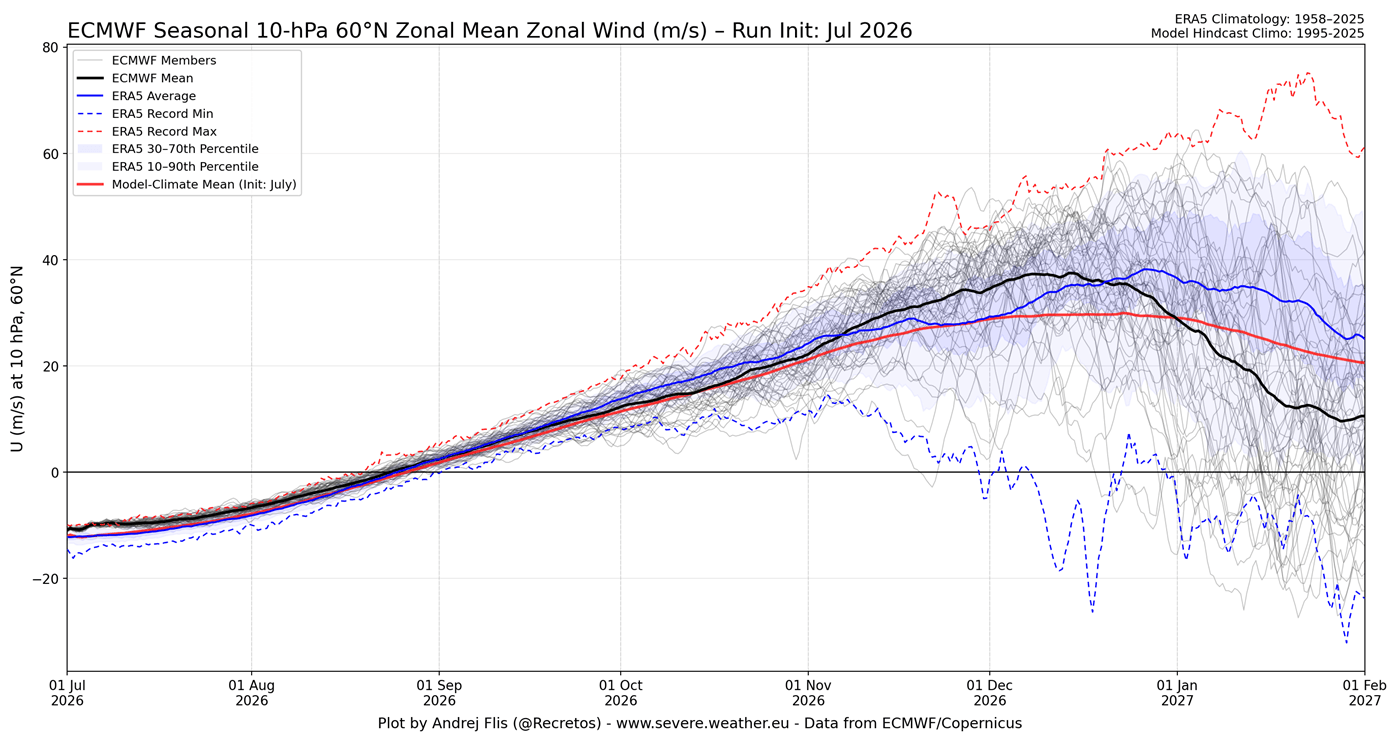
The forecast line (black) goes far below the long-term average line (blue), and the model’s own normal (red), indicating a power drop and a strong disruption trend for the Polar Vortex in January/February. As shown earlier, a January Polar Vortex Disruption occurs often during a Super El Niño event, exactly what the latest forecast suggests.
A Polar Vortex slowdown can mean a pressure rise over the pole and jet stream disruption, while a Polar Vortex collapse is a full reversal of the stratospheric winds. That helps to unlock the cold air from the pole, releasing it southward into the United States, Canada, and Europe.
Below is the average temperature of 0-30 days after a Polar Vortex collapse event. This shows that most of the United States and northern and central parts of Europe are typically colder than normal after an SSW event. Of course, a Super El Niño can ultimately change the actual flow of cold air with its own pressure anomalies.
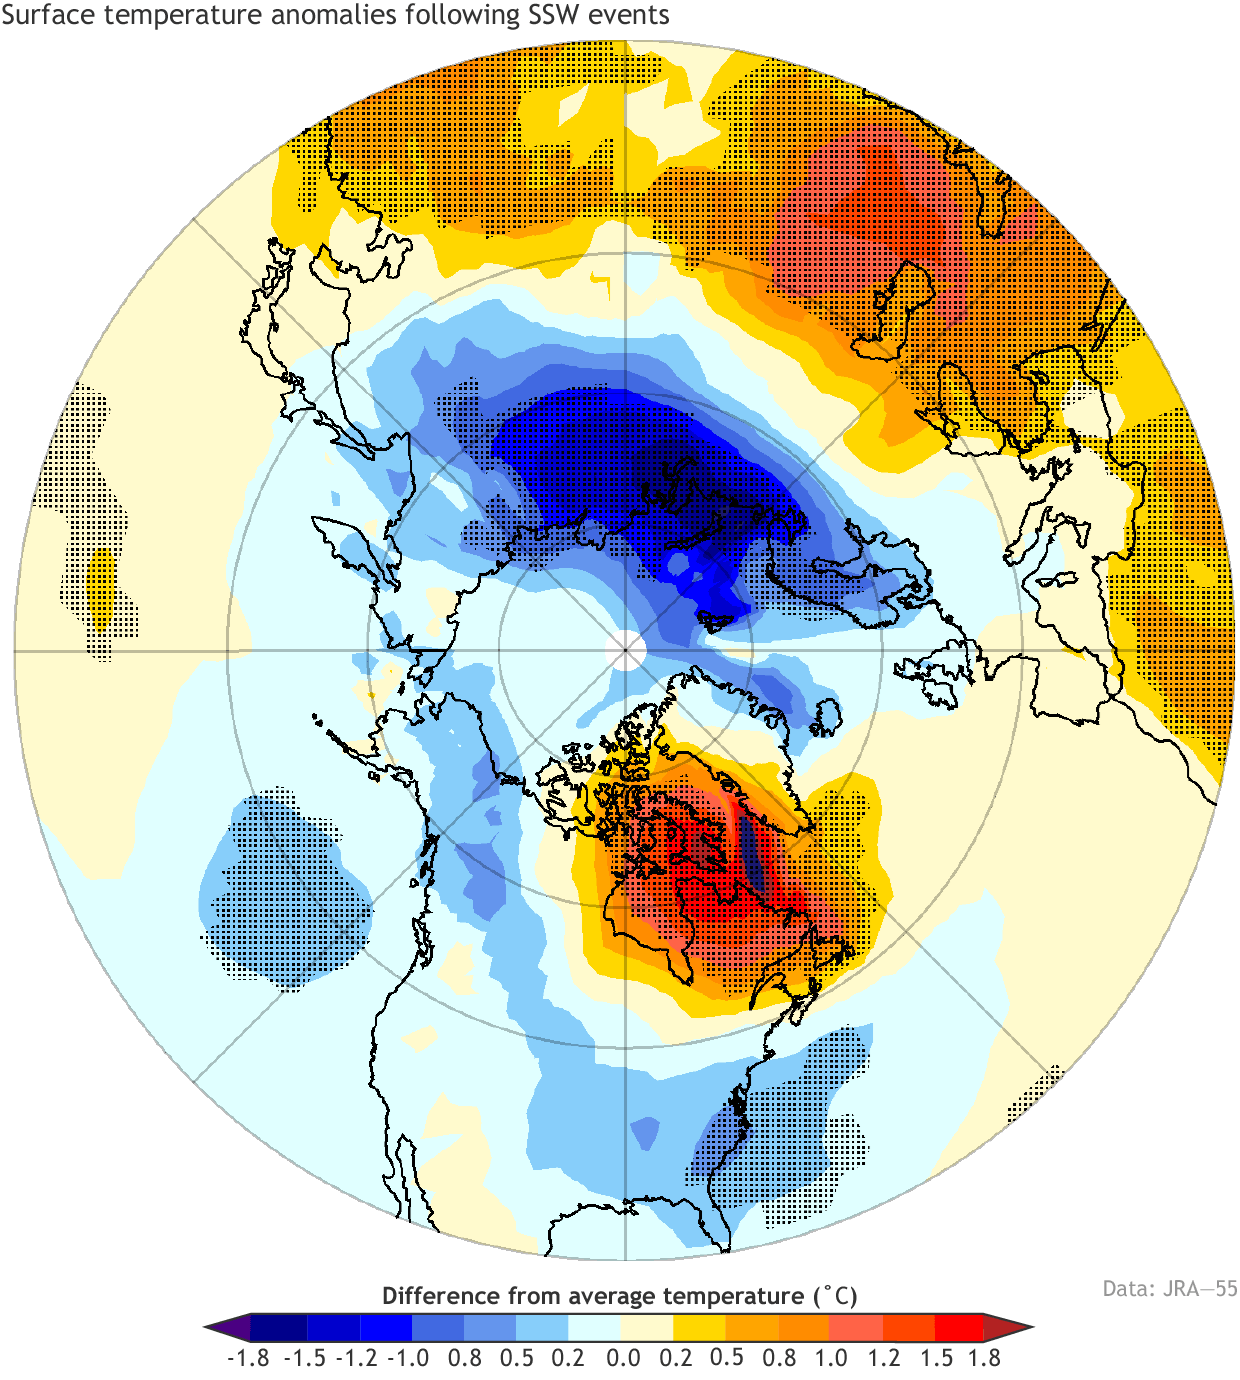
This is the pattern that we also saw last winter, which featured a disrupted lower Polar Vortex core moving into North America, establishing the “Polar Express” pattern, the same as seen in the image above.
A strong El Niño can increase pressure on the Polar Vortex and raise the chance of a mid-winter disruption. A full collapse is not guaranteed, but the combination of tropical forcing and the emerging seasonal signal makes the stratosphere a very important factor to monitor during Winter 2026/2027.
Scientific Studies Used in this Article
- North American Teleconnections: Distinct North American Teleconnection of the Strong El Niños as Modulated by the ENSO-Annual Cycle Combination Mode – Liu et al. (2024).
- ENSO-Stratosphere Teleconnections: Nonlinearity and Asymmetry of the ENSO Stratospheric Pathway to North Atlantic and Europe, Revisited – Manzini et al. (2024).
Forecast and analysis images in this article are from ECMWF, TropicalTidbits, weathermodels.com, and WeatherBell (using a commercial license).
Our first look at Fall 2026 forecasts: Fall 2026 Forecast: Super El Niño Sets Up a Winter-Like Weather Pattern That Strengthens Into January
Atlantic Hurricane Season: A Rare Atlantic Niña Emerges, Joins Super El Niño to Build an Atmospheric Shield for the U.S.
We will keep you updated on the global weather pattern development, so bookmark our page. Also, if you have seen this article in the Google App (Discover) feed, click the like (♥) or the star button there to see more of our forecasts and our latest articles on weather and nature in general.