UPDATE OCTOBER 7th, 2026: October long-range data trends colder and snowier for the U.S. and milder for southern Canada and Europe
Winter 2026/2027 is shaping up around a strong Super El Niño, with the latest seasonal forecasts showing a clear split-flow pattern developing across North America and toward Europe. The large-scale setup is becoming well-defined, with several major forecast systems now pointing toward a stronger, more amplified winter pattern as the season progresses.
In this first in-depth Winter 2026/2027 forecast, I break down the latest ocean data, historical Super El Niño winter patterns, the latest temperature and snowfall predictions, early Polar Vortex weakening signals, and the month-to-month evolution across the United States, Canada, and Europe.
I put this forecast together not just as a data update, but also as an accessible visual guide to help explain what is driving the upcoming season. Through regional maps, snowfall and ski-condition outlooks, Super El Niño analysis, Polar Vortex signals, and monthly forecasts, we will build a complete picture of what Winter 2026/2027 could bring.
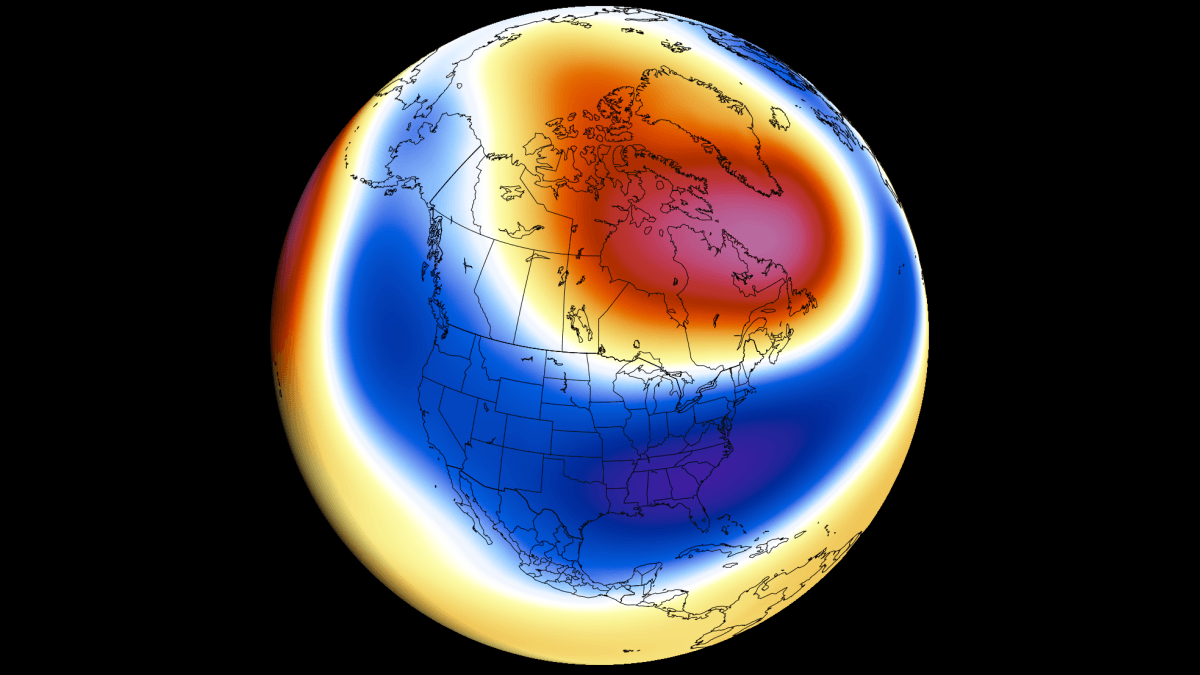
Super El Niño 2026: Ocean Heat Builds Ahead of Winter
We are continuing to track the development of a Super El Niño event that is already a major global weather driver. This Super El Niño is on a strong trajectory, with the forecasts continuing to keep it well within a Super to Extreme event threshold.
Below you can see the atmospheric changes that an El Niño brings, changing the overall global circulation. The upward and downward atmospheric motion and circulation in the tropical regions is called a Walker Cell, and is especially sensitive to strong ENSO events (El Niño or La Niña). Image by ESA.
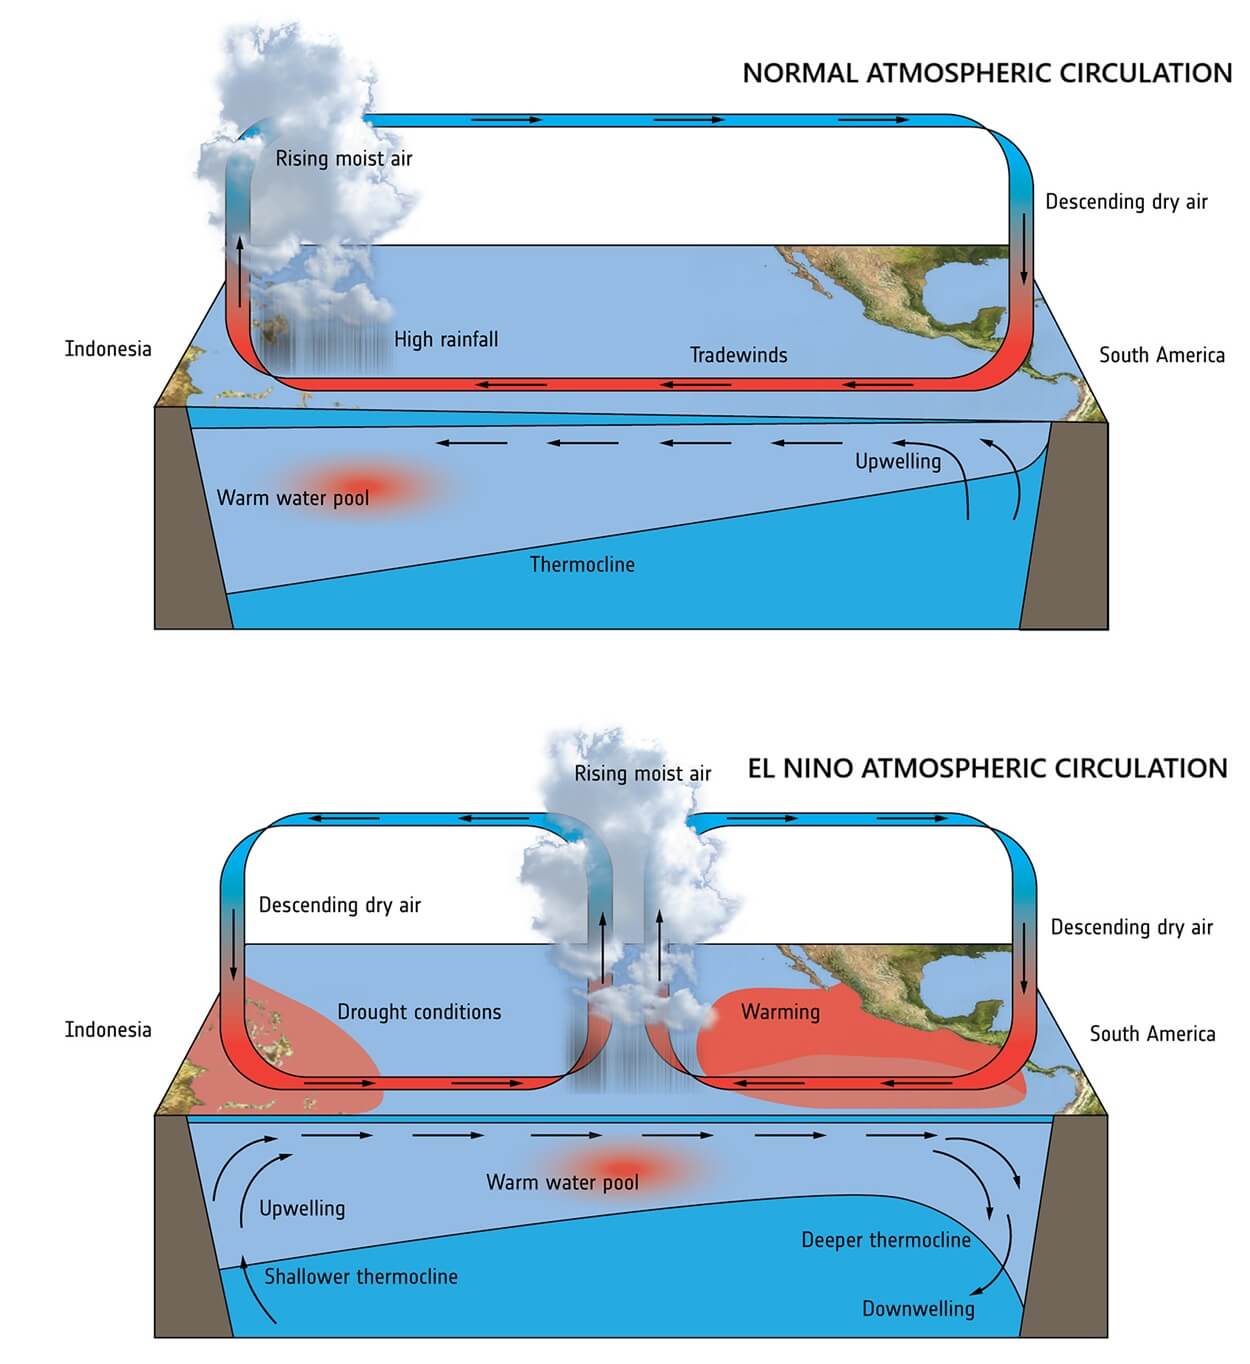
To keep it simple, El Niño lowers atmospheric pressure in the central and eastern tropical Pacific while building high pressure over the west parts. This shift launches atmospheric wave trains across both hemispheres, directly reshaping global jet streams, precipitation, and seasonal weather patterns.
El Niño events occur every few years, but Super events are rare, occurring once per decade or less, usually with strong atmospheric impacts.
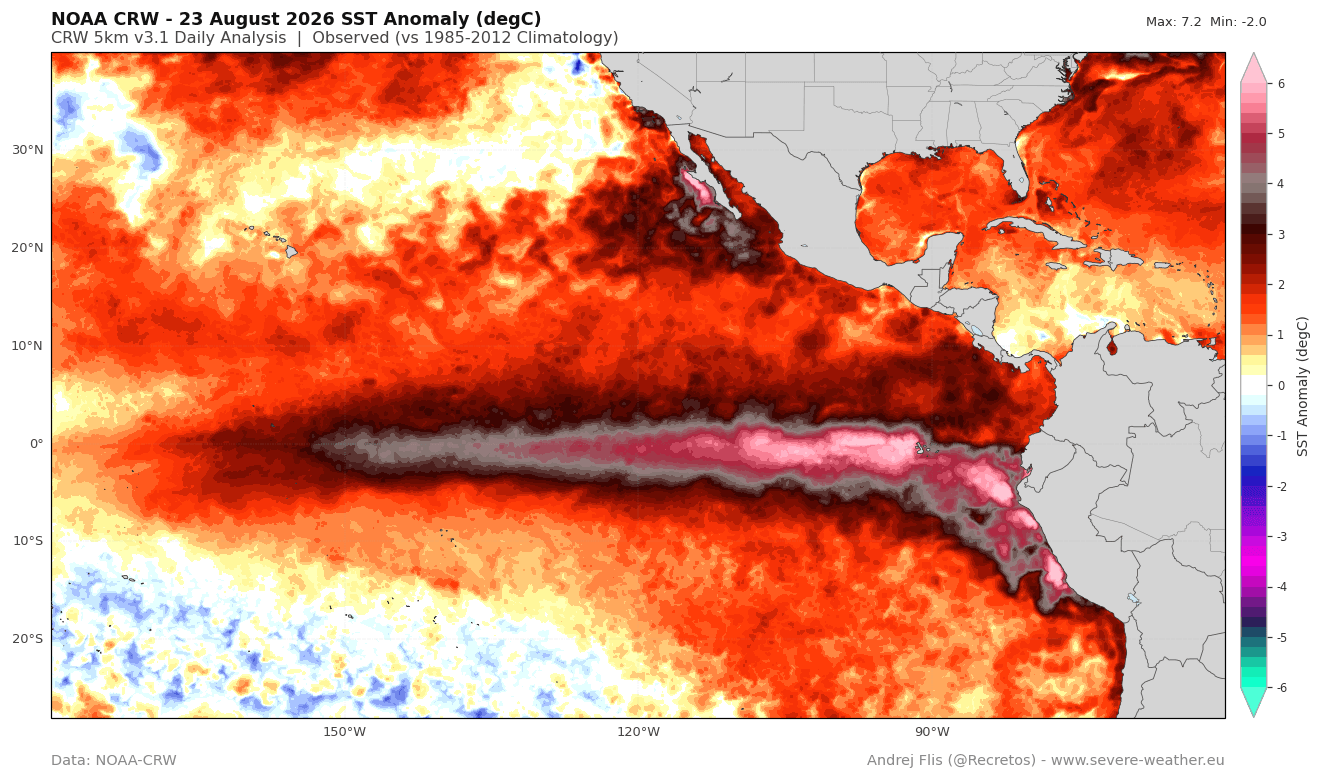
I base my El Niño analysis on NOAA-CRW data. In the latest data below, you can see substantial warm anomalies continuing, with values exceeding 6°C (11°F) above normal over a large area. This is a really strong anomaly at this phase of development, already reaching into Super El Niño territory.
This growth is also confirmed by the latest analysis graph below for the main ENSO region from OISST. We can see a rapid, continuous anomaly increase, with El Niño on a rapid growth trajectory. There is a slight break currently, but this is normal and expected, with forecasts still showing several months of growth ahead.
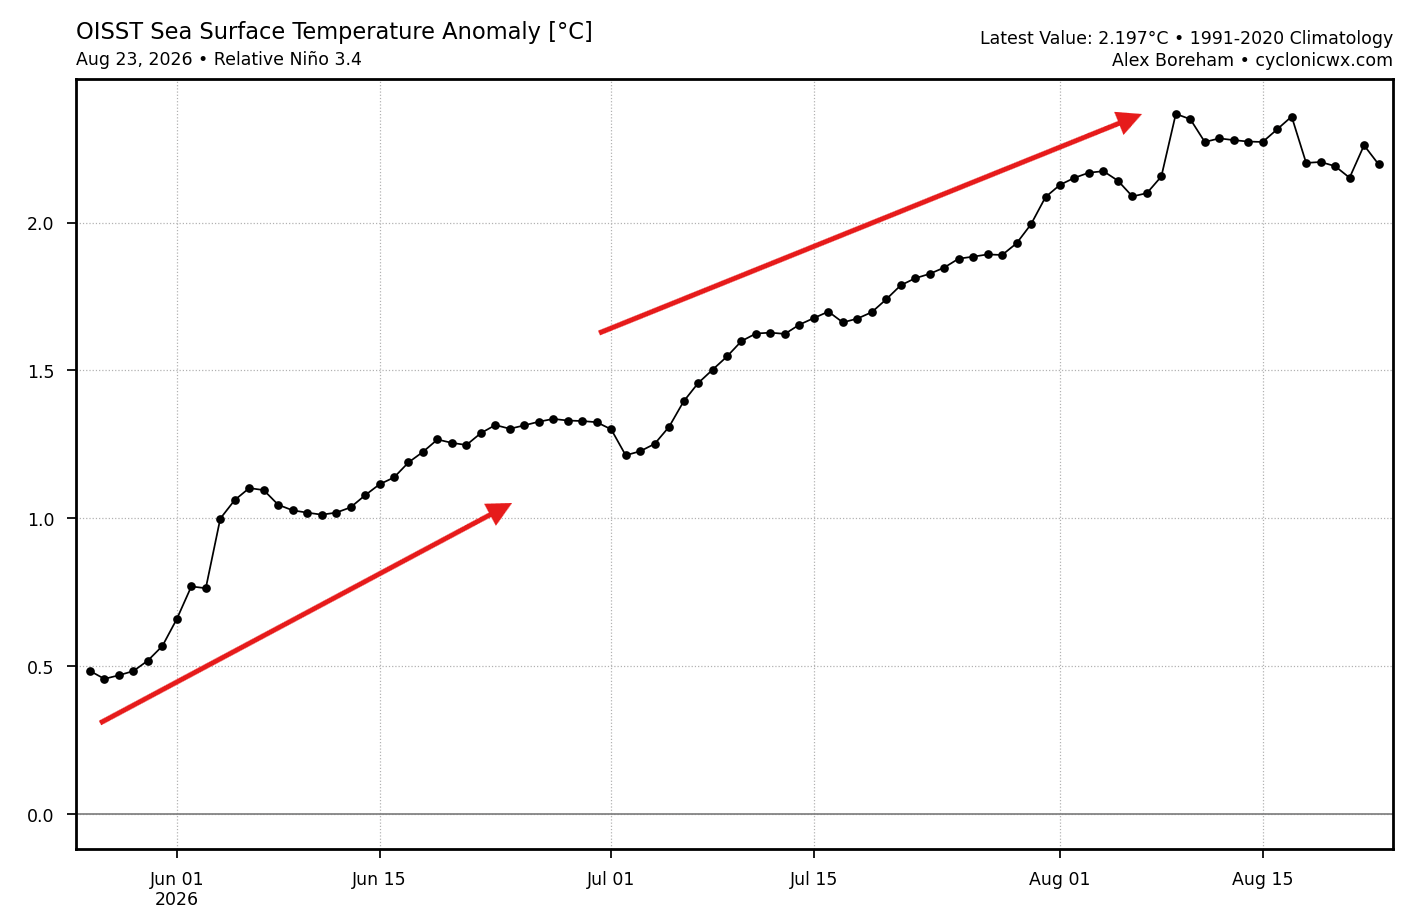
To be classified as a Super El Niño event, sustained seasonal values must exceed +2 degrees, which we have already exceeded. So we just need to sustain this on a seasonal scale, which should not be hard to do, given the powerful core of this event and the latest forecasts.
Below you can see the real core (heart) of this Super El Niño event: a significant subsurface temperature anomaly in the top 250m (800ft) of the tropical Pacific. This is a so-called downwelling Kelvin Wave, with peak anomalies over 9 degrees (16°F) above normal, being the engine and core of this event.
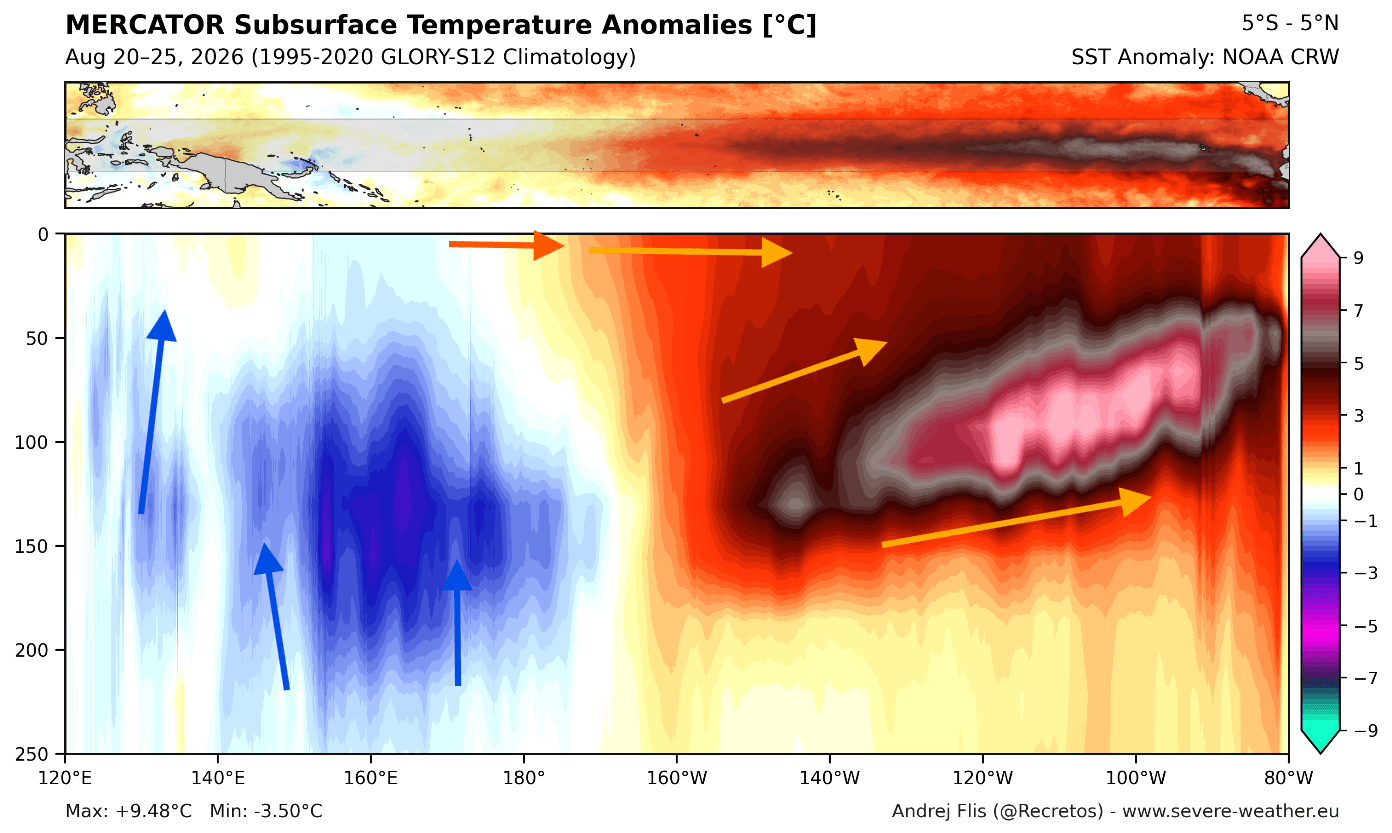
In the west, a rising cold anomaly (blue) is visible below 50 meters (164ft), and no, it does not mean an early end for El Niño. It actually marks the classic tilting of the Pacific thermocline, signaling an extreme event. Strong westerly wind bursts displace warm upper-ocean waters eastward into the Kelvin Wave, pulling colder, deeper water up in the west as the Super El Niño strengthens.
Below is a video I produced from subsurface ocean data. It shows the development of a Kelvin Wave over the past 90 days, with visible eastward movement and rapid growth. You can also see how it expands, giving rise to a Super El Niño in the eastern parts.
Ocean surface anomalies are just the visible surface signature of this large subsurface warm-core anomaly that slowly surfaces. It provides a continuous supply of energy to keep the El Niño strong and healthy well into the Winter season, which the latest forecasts also indicate.
Super El Niño Forecast: Models Push Toward Record Strength
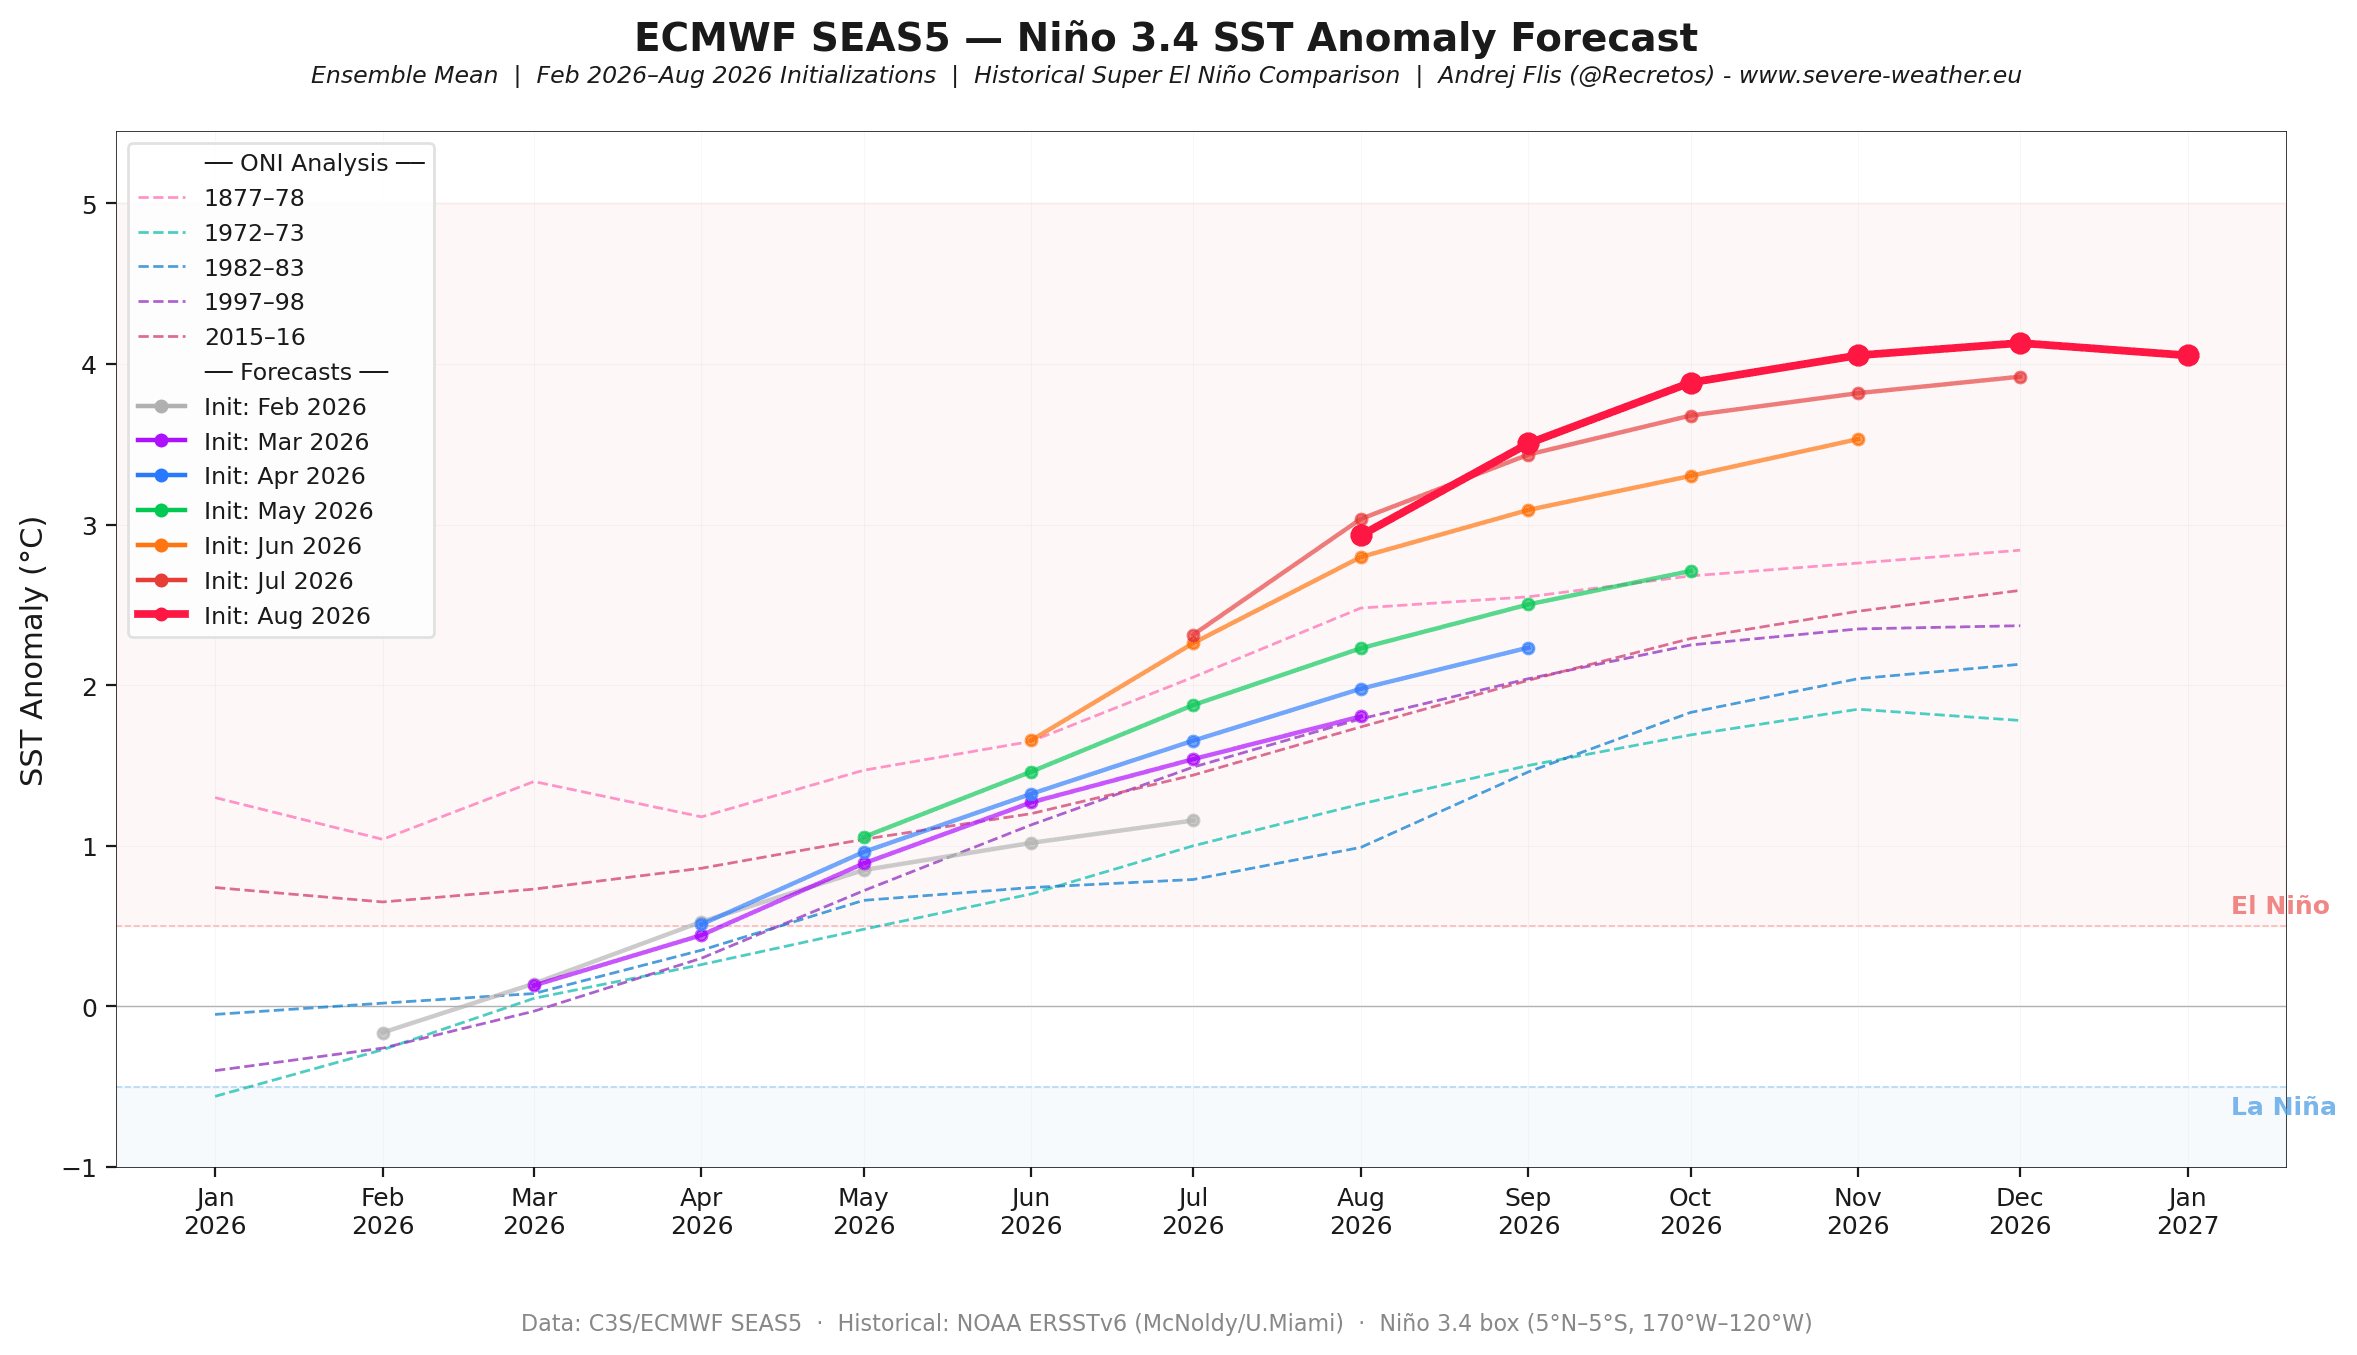
Most seasonal forecast systems simulate the ocean along with the atmosphere. Since seasonal models cannot properly predict individual wind bursts and Kelvin waves until they start occurring, each monthly update must adjust to new data. As a result, the models have steadily raised the peak strength of this Super El Niño with each new forecast run.
This has created a very strong visual forecast trend, with each new forecast showing a stronger peak El Niño anomaly.
Below is a comparison I produced using the most recent ECMWF forecasts, released since early February. You can clearly see that each new run shows a stronger event, with the last three runs pushing it into record-strong territory, above the strongest Super El Niño events.
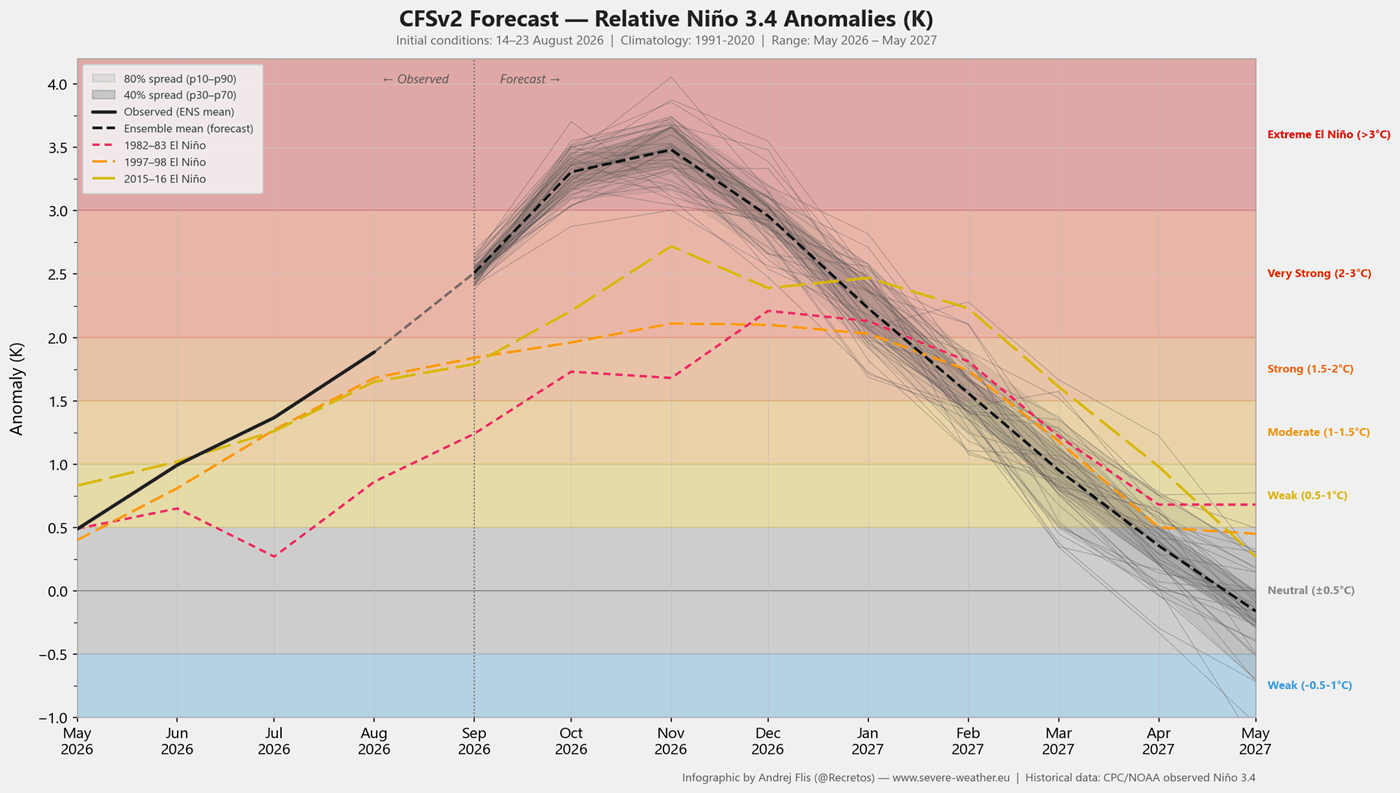
In the image below, we can also see the NCEP CFSv2 model forecast, which shows the fully released Kelvin Wave at peak. The El Niño is forecast to reach extreme levels, surpassing the Super El Niño threshold (+2 degrees), and also exceeding the +3 anomaly. Both forecast systems agree on a historic El Niño development and influence on Winter 2026/2027.
To give you an idea of how this looks in nature, you can see the ECMWF forecast below for the November-December period. It reveals a significant Super El Niño event. If the projected basin-wide ENSO strength verifies, the 2026 event would rank among the strongest on record, if not the strongest.
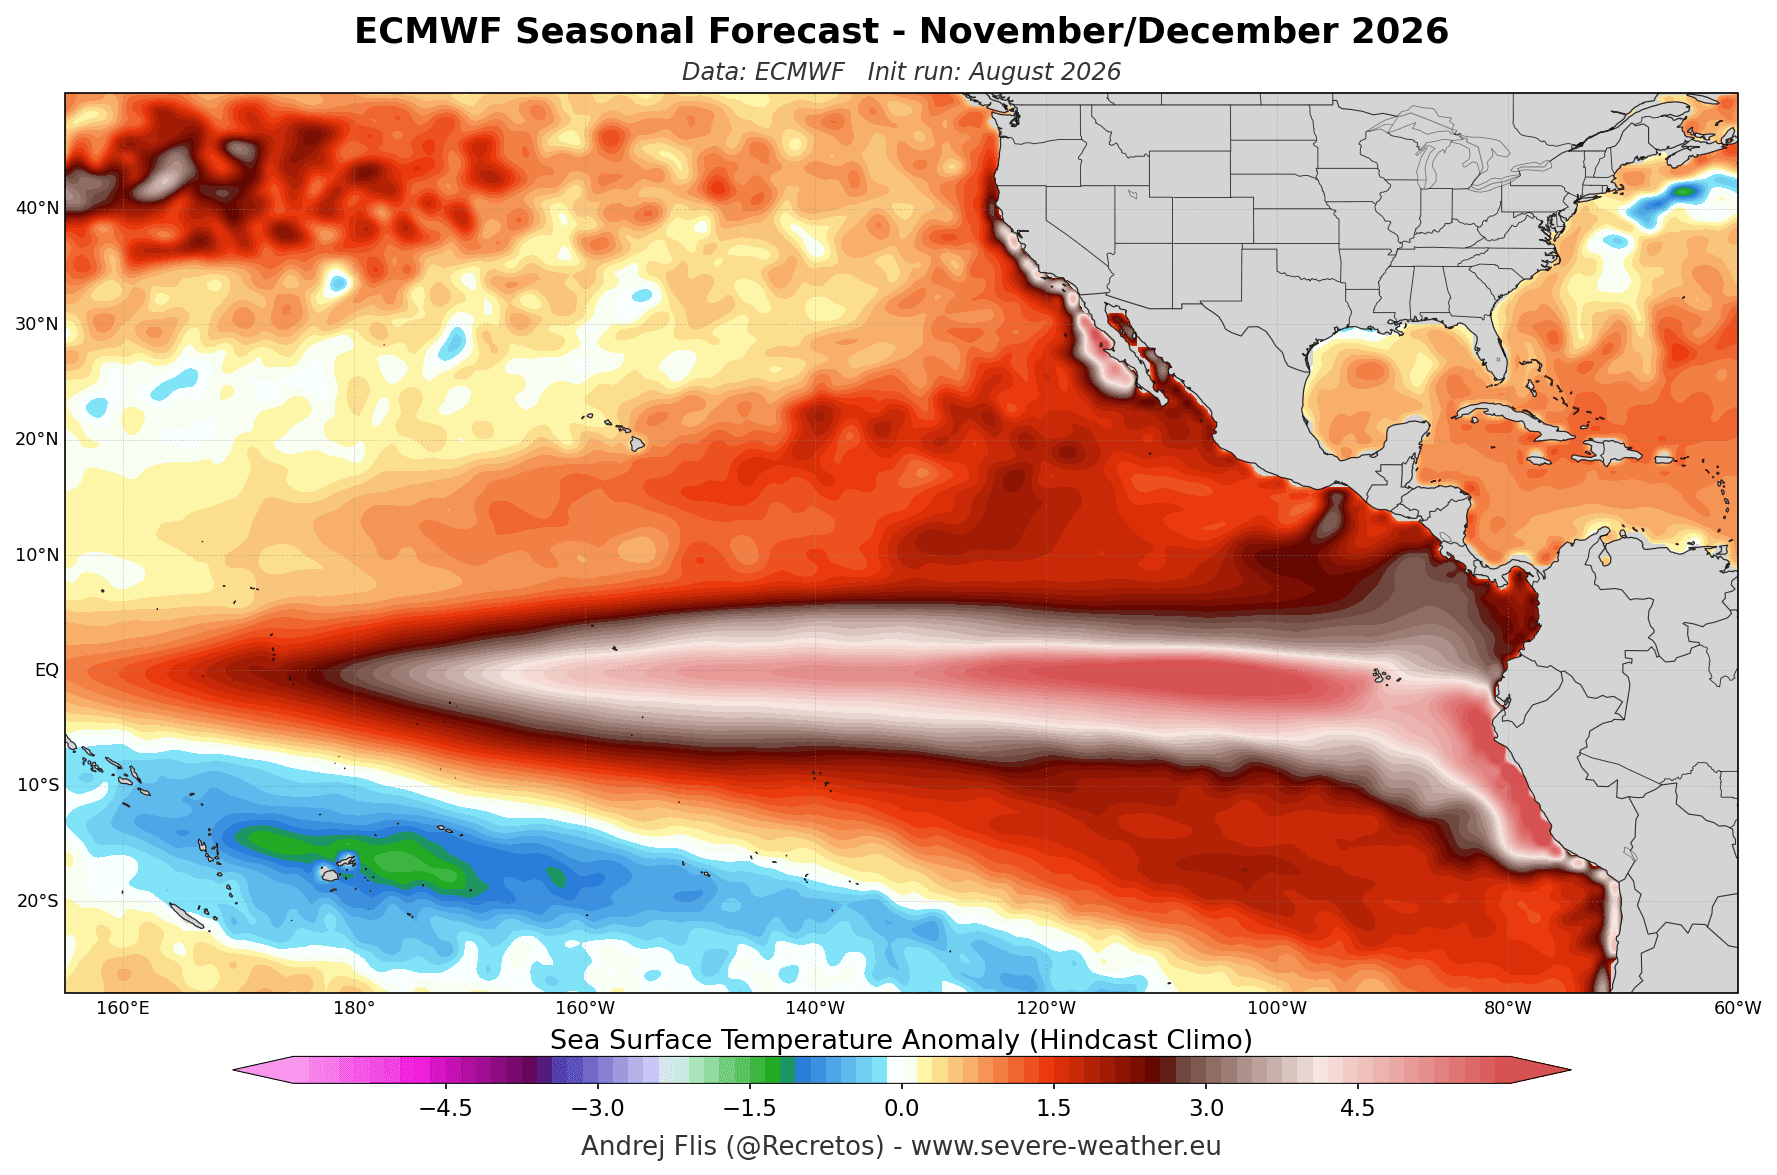
El Niño events always peak later in the year, with the latest forecasts trending toward a max anomaly around November-December, as seen above. This is primed for atmospheric Winter impacts for 2026/2027.
We can look at the past Super El Niño Winters to get an idea of what winter weather impacts we can expect from such a powerful event.
Past Super El Niño Winters: Pressure, Temperature and Snowfall Patterns
As we get to Winter El Niño impacts, the strength of the event really starts to matter. The schematic below (by Raganato et al.) shows how strong tropical forcing creates a planetary wave train in upper levels as winter begins. Strong ocean anomalies and the massive energy of a Super El Niño create an atmospheric domino effect that spreads across the entire Northern Hemisphere during the cold-weather season.
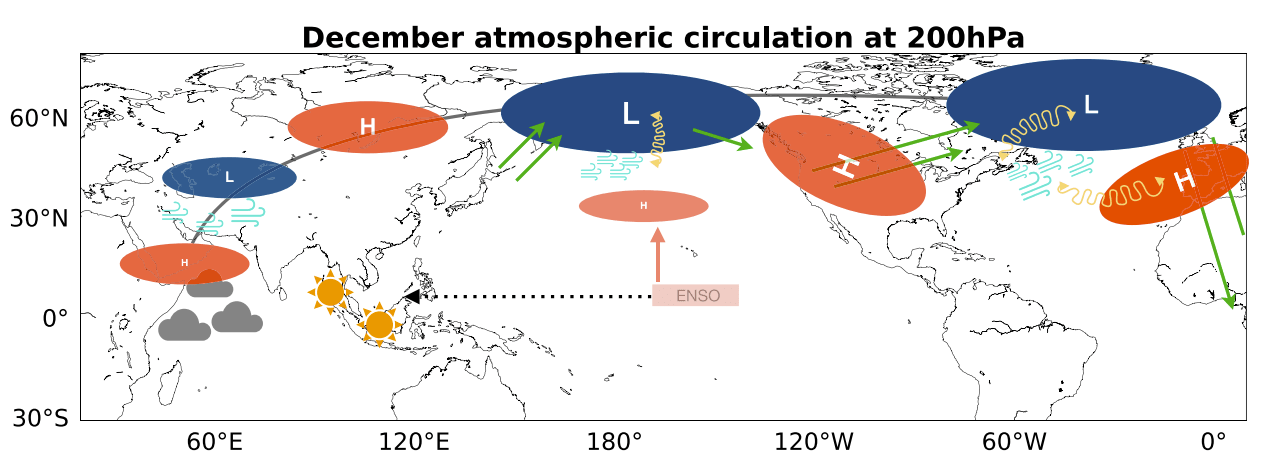
This pressure wave train acts like a giant atmospheric highway, creating a repeating chain of high and low-pressure systems around the globe. The result is a deep low-pressure trough over the North Pacific, forcing a strong ridge over Canada and driving another low-pressure zone over the southern U.S. and into the Atlantic.
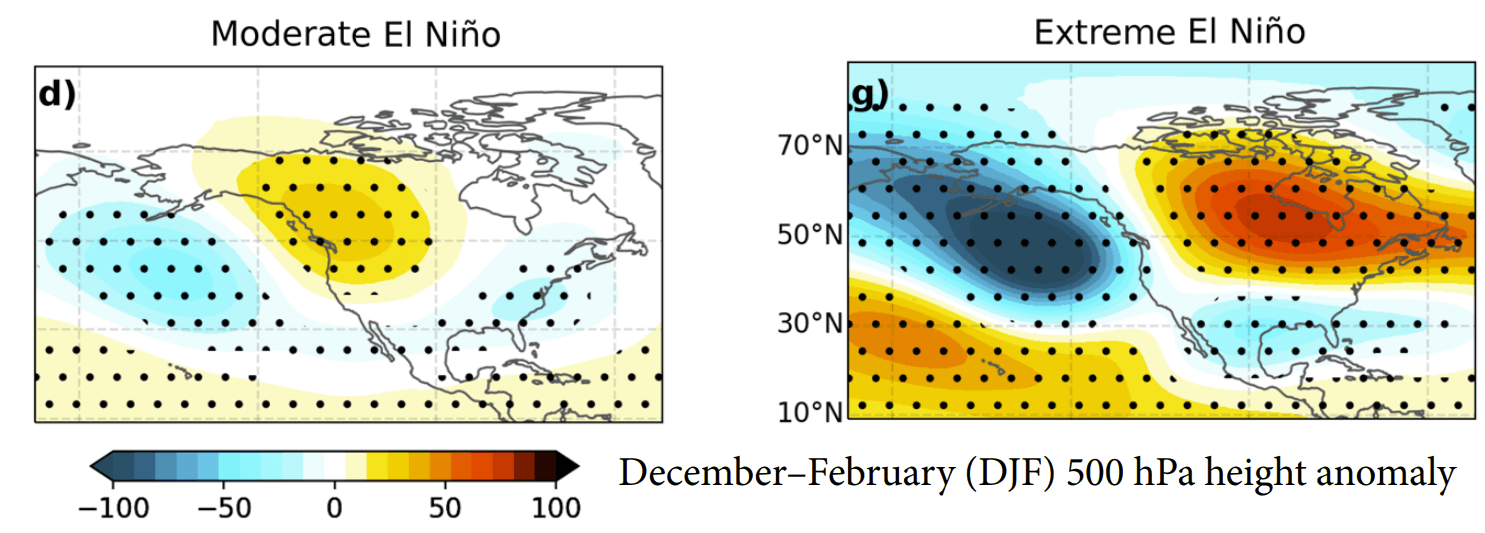
While a moderate event produces a mild wave pattern, a Super El Niño usually triggers a far more aggressive shift in the jet stream. The transition from a Moderate to an Extreme El Niño leads to a deeper Pacific trough and a stronger Canadian ridge, forming an atmospheric highway across the United States. The image is from a recent study (linked below).
It’s hard to find anything in the past data to compare to the 2026 event and Winter impacts. But we can still look at the last 4 Super El Niño events and how the average Winter looked in those seasons. I produced graphics showing pressure, temperature, and snowfall patterns for Winters in these Super El Niño events.
The pressure analysis is the most telling, as it shows the average positioning of the pressure systems across these four events. We can see a strong atmospheric wave train forced by the Super El Niño events. The main feature is the deep, intense low-pressure anomaly over the North Pacific, reflecting an expanded Aleutian Low.
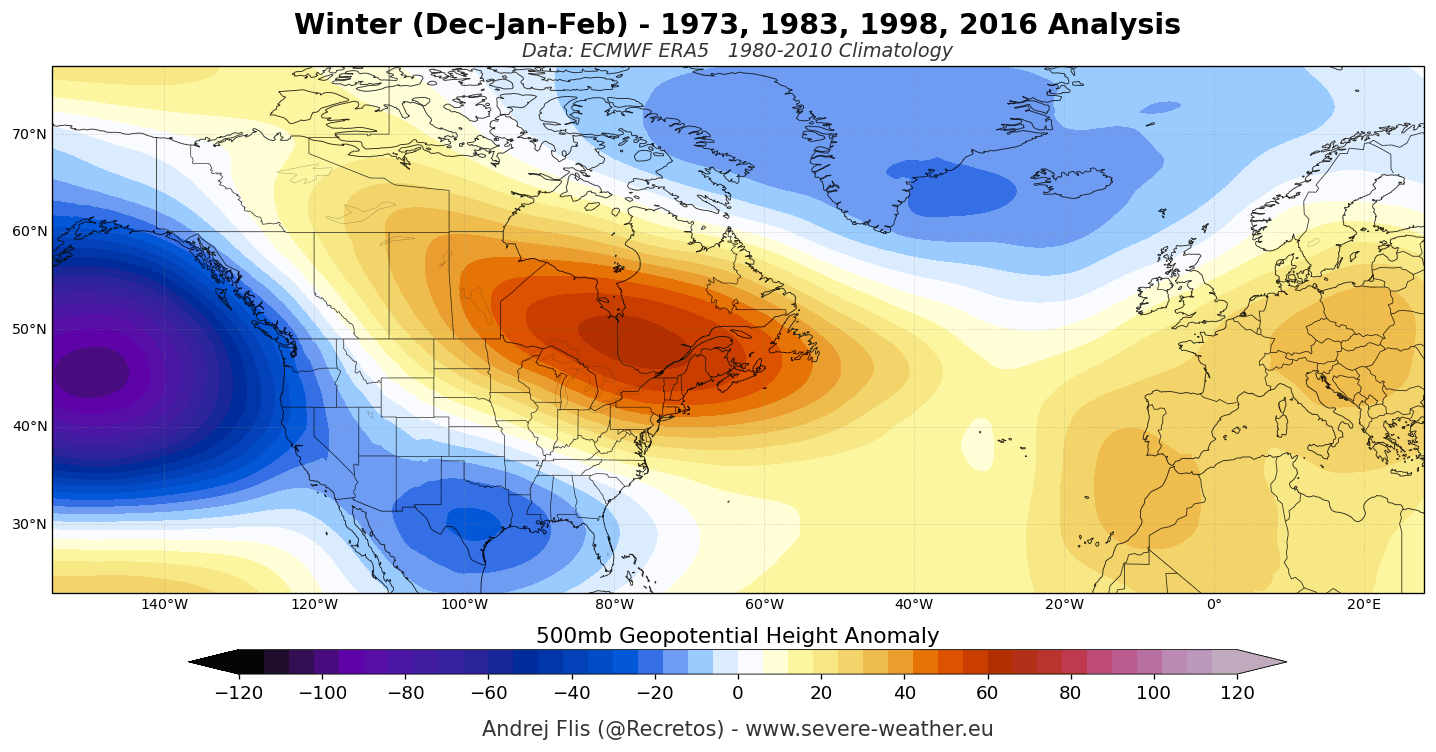
Such a deep low forces a massive high-pressure ridge over Canada, the northern U.S., and the Great Lakes, forcing the jet stream to split. This keeps the coldest air deflected away from the northern parts with an active storm track across the southern United States. Downstream, this favors lower pressure over the North Atlantic and a milder westerly flow across most of mainland Europe.
The temperature analysis below visually tells this story, showing the average winter (December–February) temperature anomalies across past Super El Niño events. It clearly highlights the sharp contrast between the warmer air mass under the high-pressure zone in Canada and the northern U.S., and the low-pressure highway to the south.
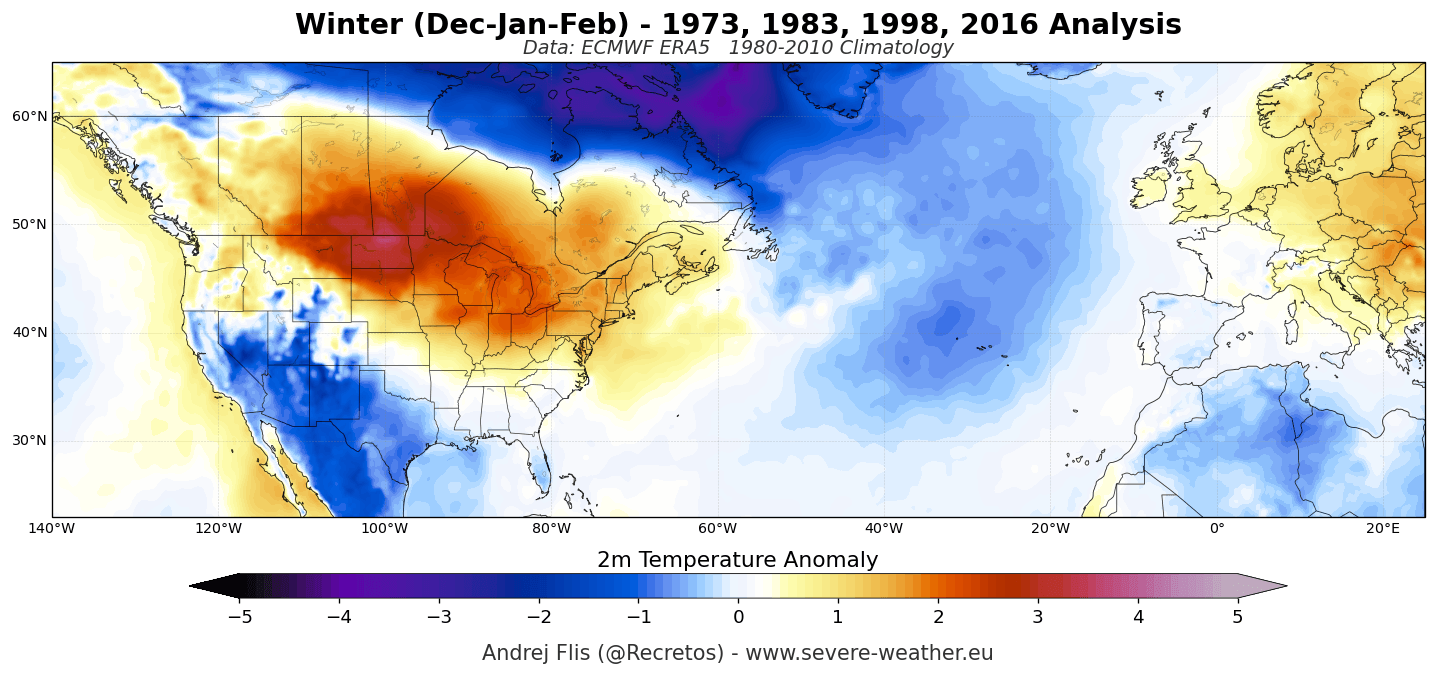
Over the Northern Plains, the Upper Midwest, the Great Lakes, and southern Canada, we see well above-normal temperatures. But the active subtropical jet stream keeps temperatures cooler across the southern United States, due to persistent cloud cover and precipitation. Over Europe, the dominant westerly flow drives above-average temperatures across most of the continent.
Pressure, temperature, and moisture changes also shape the snowfall pattern. Below is a composite I produced from ERA5 data, showing average winter snowfall anomalies in the past 4 Super El Niño events. Above-normal snowfall is focused across the Sierra Nevada, the Four Corners, the Southern Rockies, and into parts of the Central Plains, driven by persistent southern storm activity.
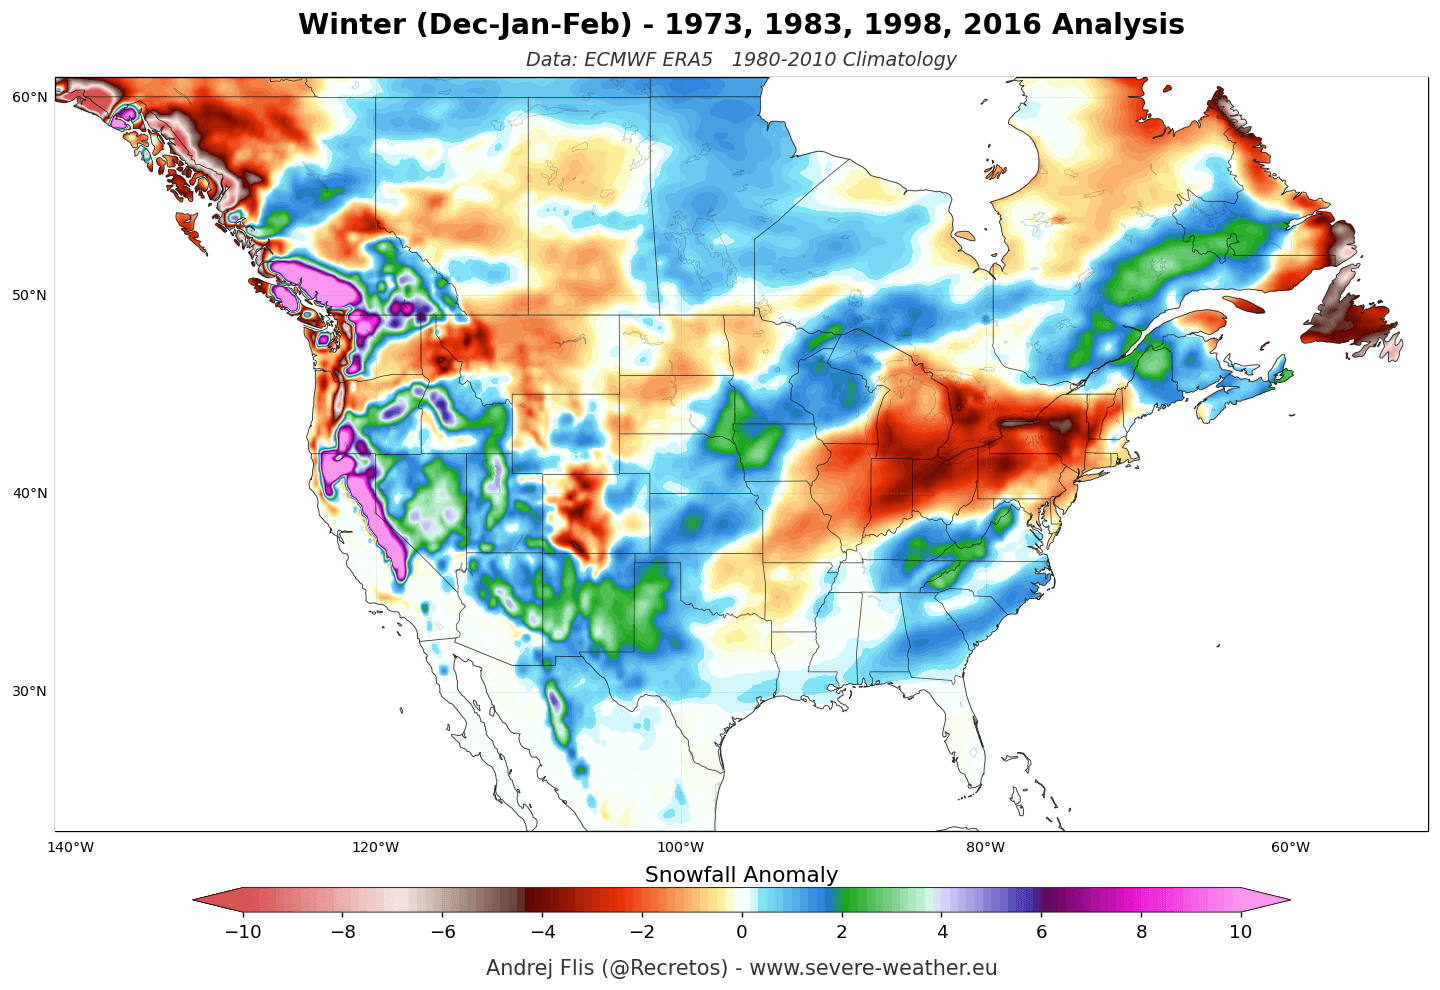
In contrast, widespread snowfall deficits (red/brown) were recorded over the Pacific Northwest, the Great Lakes, the Ohio Valley, and the Northeast. In these regions, the warm Canadian ridge limits cold air intrusions and can suppress sustained northern storm tracks.
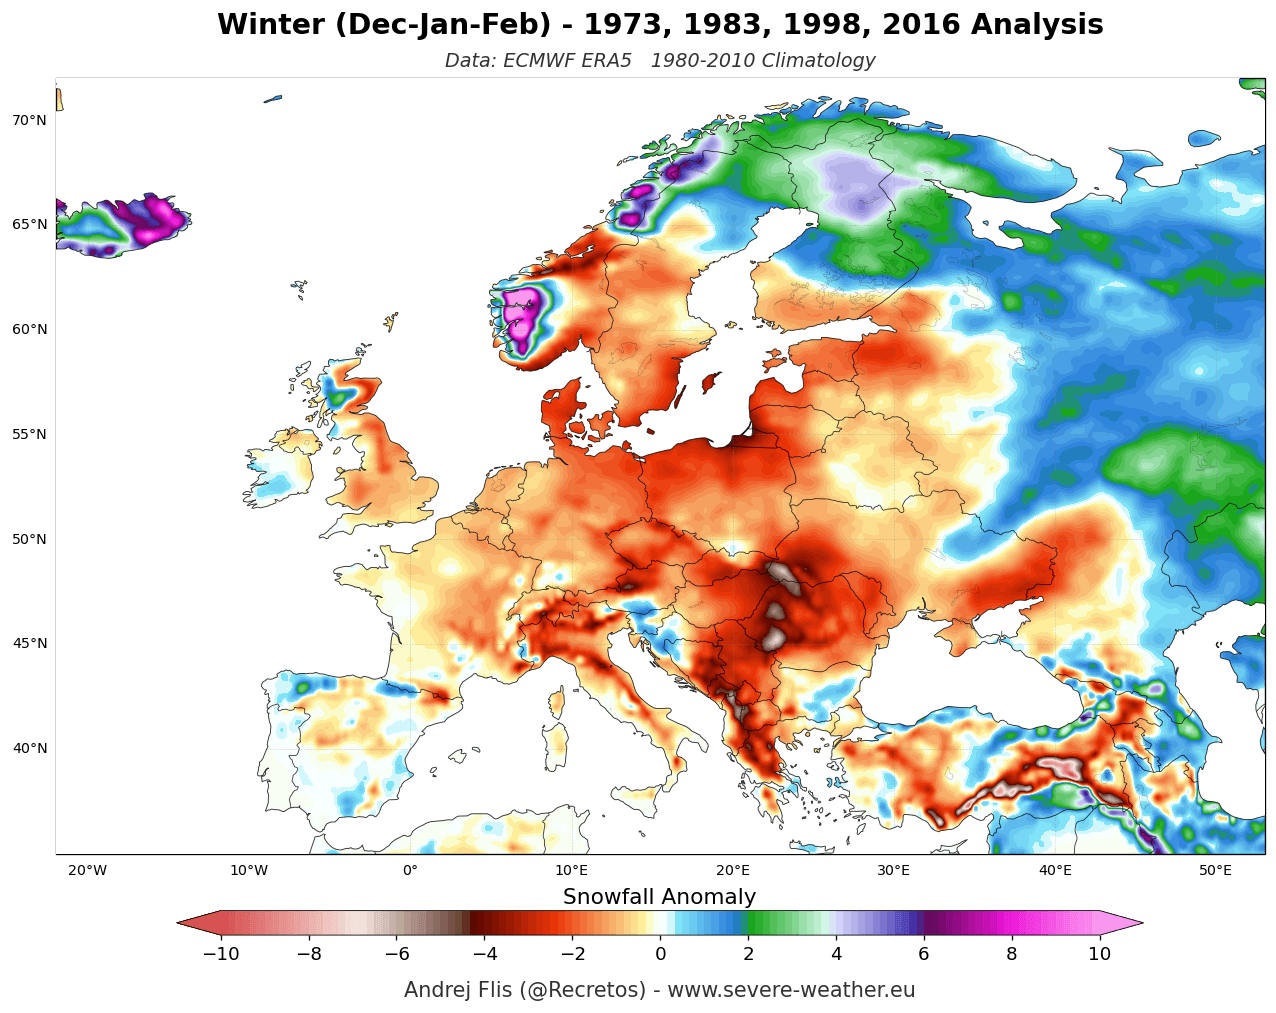
In these winters, widespread snowfall deficits were recorded over mainland Europe, the northwest, southern, and north-central regions. The key behind it is the mild westerly flow from the Atlantic. The only notable above-average snowfall anomalies (green to purple) were confined to northern and northeastern parts, where temperatures remained cold enough for incoming moisture to fall as snow.
With an unusually strong Super El Niño developing, the atmosphere is entering a level of forcing rarely seen in the observational record. But with the latest long-range forecasts now converging on the expected El Niño strength, we can have a proper look at the atmospheric trends for Winter 2026/2027.
Winter 2026/2027 Forecast: A Split-Flow Pattern Develops Across North America
The winter season is the most high-energy part of the year and usually the one that interests most people. For seasonal forecasting, I tend to use the ECMWF model first, which is often regarded as the most reliable for handling these processes, and that is also my personal experience.
Below is the very latest ECMWF pressure anomaly forecast, released this month, and it is quite exceptional. This is the forecast for the December-February period, and it shows a strong El Niño forcing. The major points are the deep low-pressure zone in the North Pacific and the blocking high-pressure area over Canada.
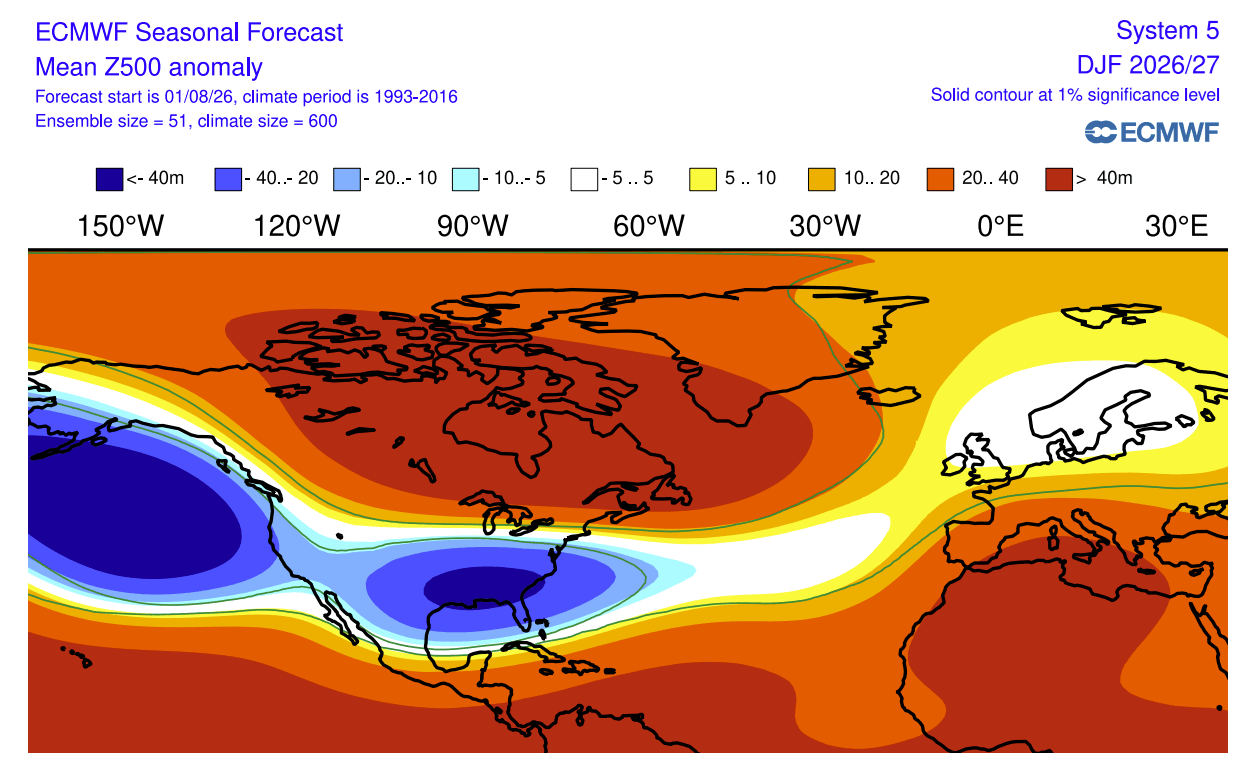
The forecast also shows an amplified low-pressure pattern across the southern and eastern United States. This is aligned with a strong Pacific jet stream, the key component of a Super El Niño Winter. The low-pressure zone continues into the Atlantic and over northern Europe, with a ridge to the south.
Below is the latest jet stream forecast for January 2027, using the wind anomaly at the 200mb height level (12km/7.5miles). You can see the powerful Pacific jet stream and the weaker Polar jet stream above it. This is the typical El Niño split-flow that favors milder conditions in the north while driving an active storm track across the southern United States.
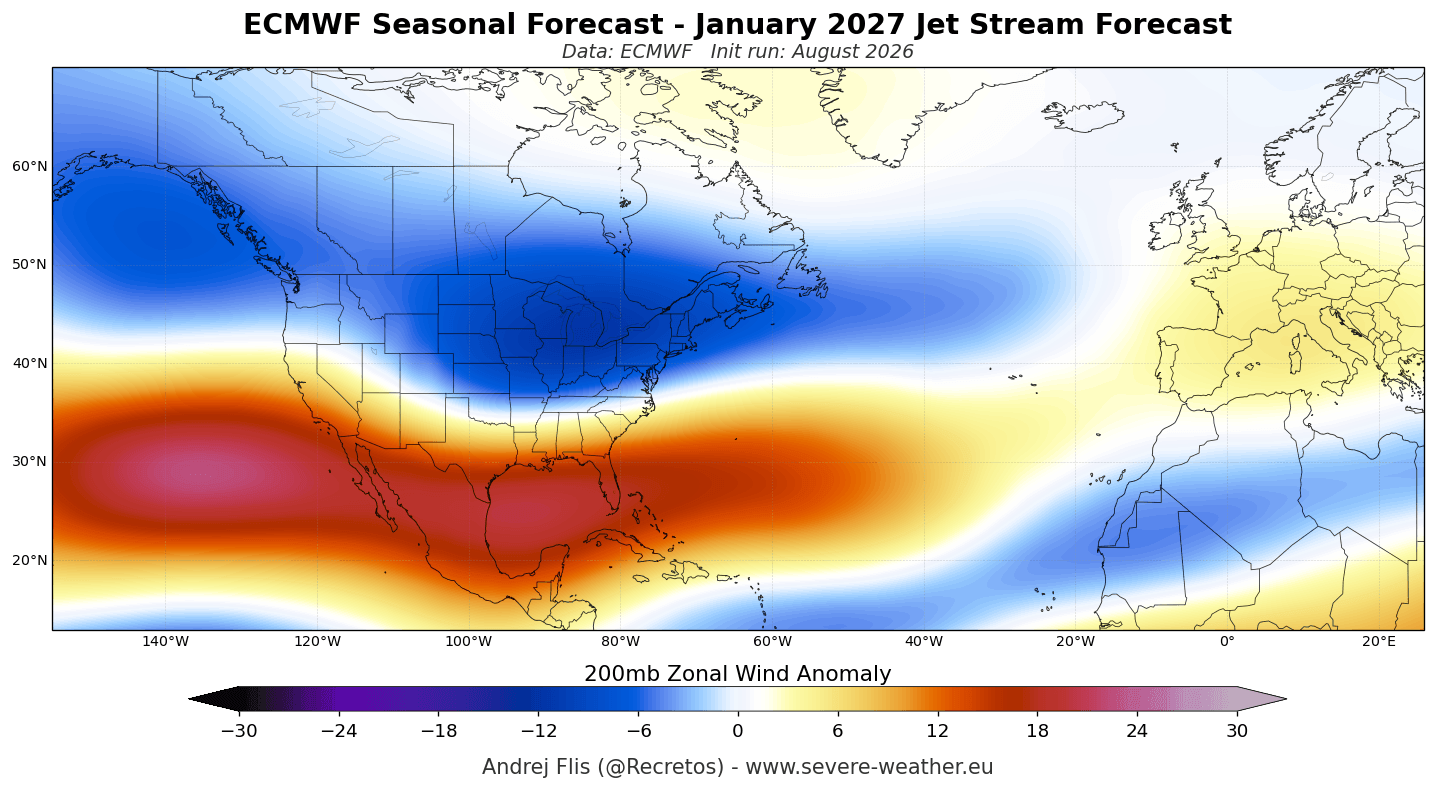
The extended jet stream also reaches toward Europe, supporting a milder westerly and southwesterly flow over the continent. This is the clearest signature of a Super El Niño in a winter forecast, deepening its influence on seasonal temperature and precipitation patterns.
This weather pattern translates into a sharp temperature difference between the United States and Canada. In the forecast below, you can see above-normal temperatures under the high-pressure zone in Canada and the northern United States, including the U.S. West Coast and the Northeast.
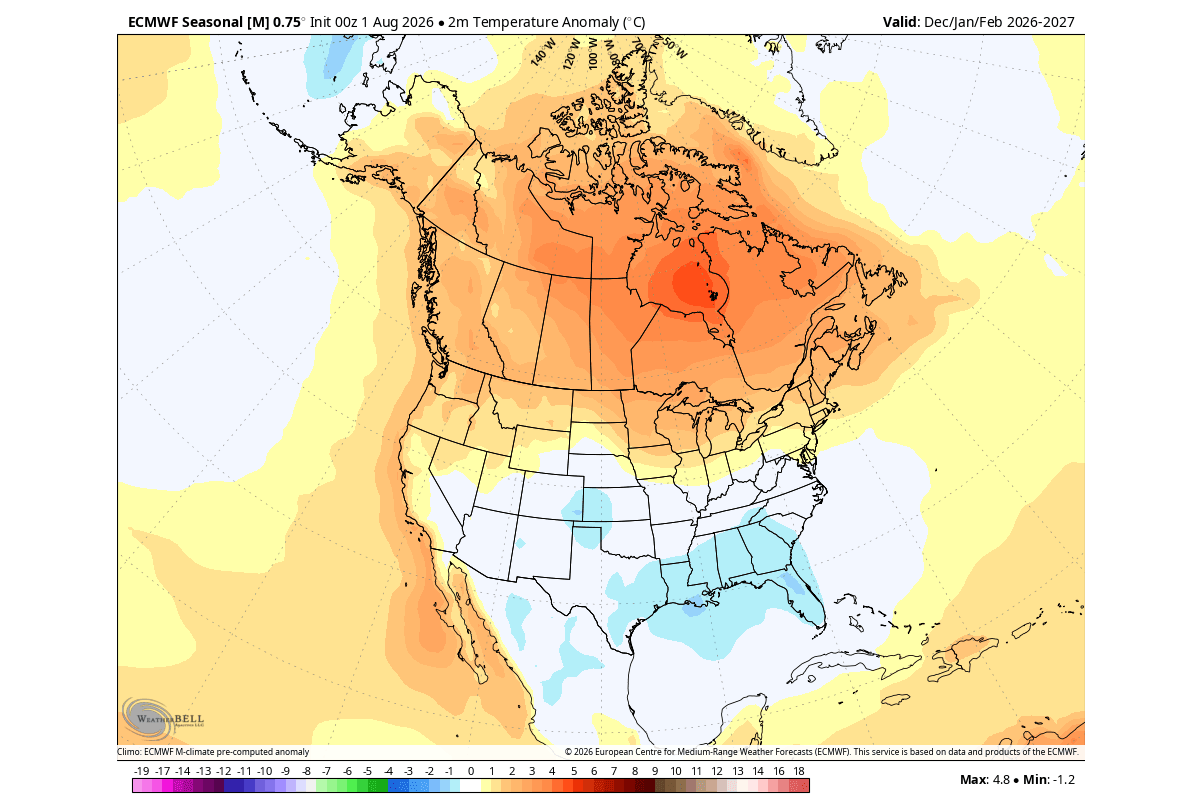
The active southern low-pressure zone allows cooler-than-normal temperatures across Texas, the Gulf Coast, and the Southeast and East. This is primarily driven by low-pressure systems, which bring persistent cloud cover and rain.
The precipitation forecast also shows a clear El Niño signature, with increased rainfall over most of the United States, especially in the south and west, due to an amplified Pacific jet stream. An amplified Pacific jet brings more moisture and low-pressure systems, creating increased precipitation and unsettled weather.
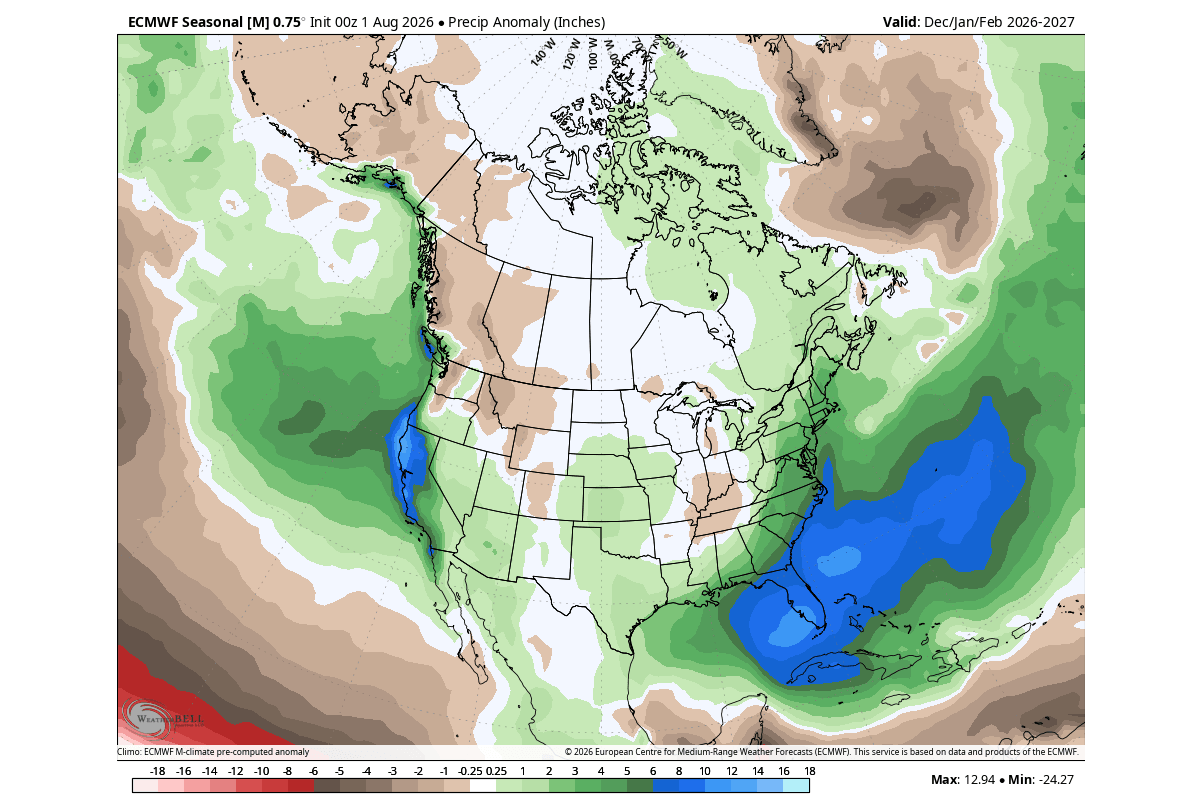
We can see areas with below-normal rainfall in the northwestern United States, the upper Midwest, and over southern and western Canada.
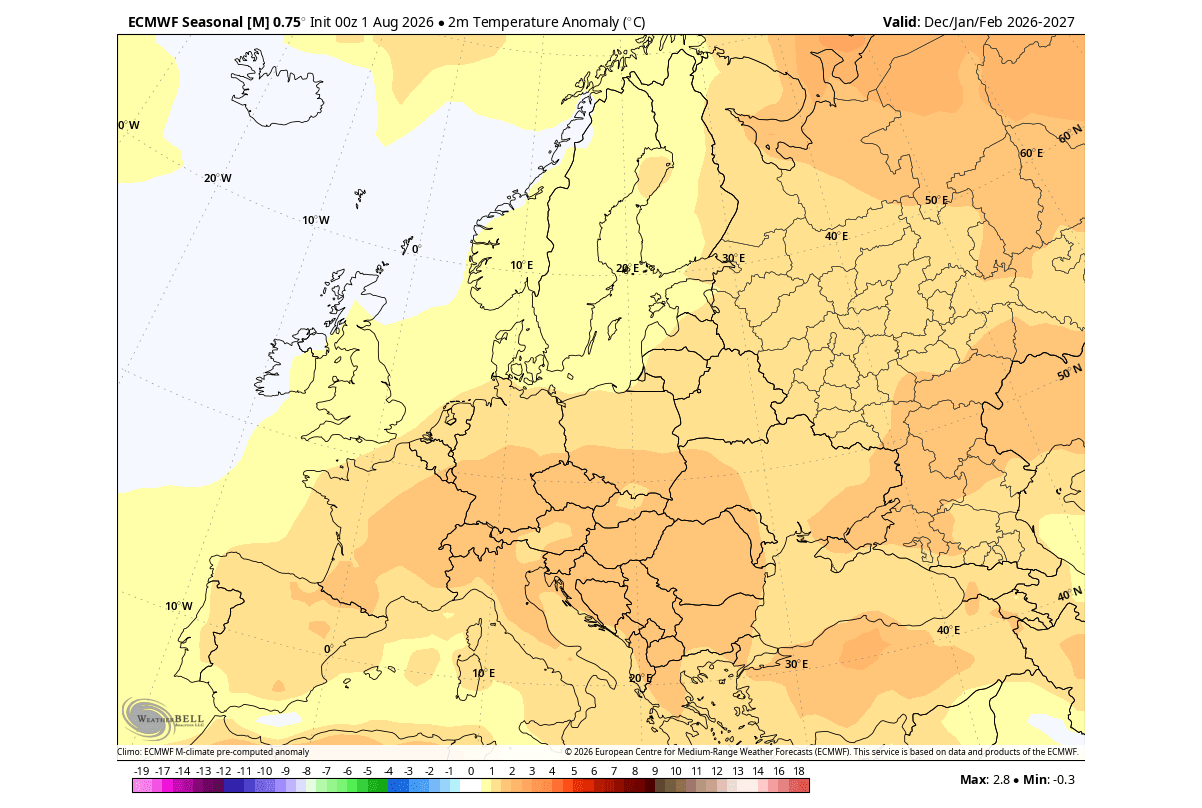
The impact of the Super El Niño also reaches Europe. In the latest December-February temperature forecast below, you can see mostly above-normal temperatures during the winter season. This is the result of a dominant mild westerly flow. It still allows some northerly flow into the northwest, as low-pressure areas move from the Atlantic into northern Europe, pulling some northerly flow on their rear side.
The precipitation forecast shows above-normal winter precipitation across much of the continent. The westerly and southwesterly flow from the Atlantic brings in abundant moisture, increasing precipitation potential across much of the continent, especially in the western, central, and southeastern areas.
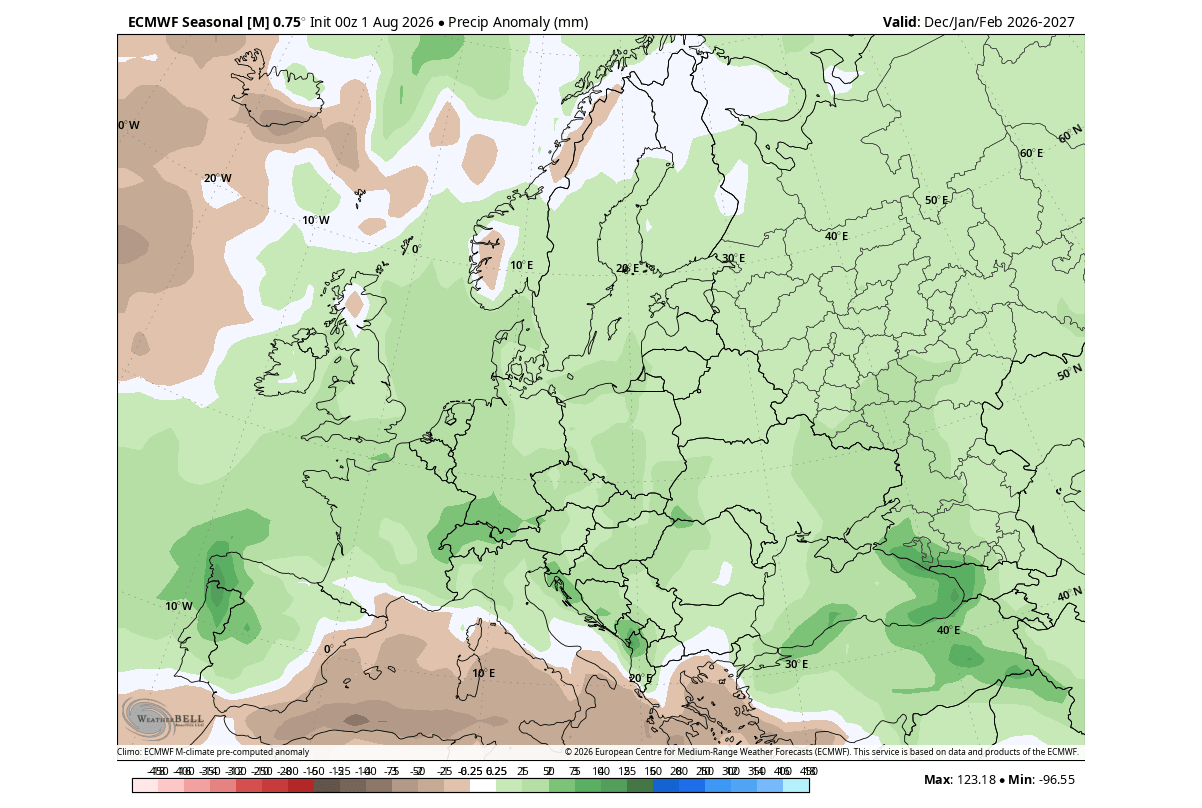
But more precipitation in winter does not always mean heavy snow, since snowfall also requires a source of cold air, which varies by region and elevation.
Winter 2026/2027 Snowfall Forecast: United States, Canada and Europe
A Super El Niño strongly impacts the snowfall pattern. When an active southern jet stream overlaps periodic cold air drops from Canada, it can bring the primary winter storm corridor farther south than usual.
Below is the latest ECMWF snowfall forecast, and it shows this development. You can see reduced snowfall across the Northern United States and southern and Atlantic Canada. But we can see interesting above-normal snowfall potential across the Central and Eastern United States, and eastern Canada.
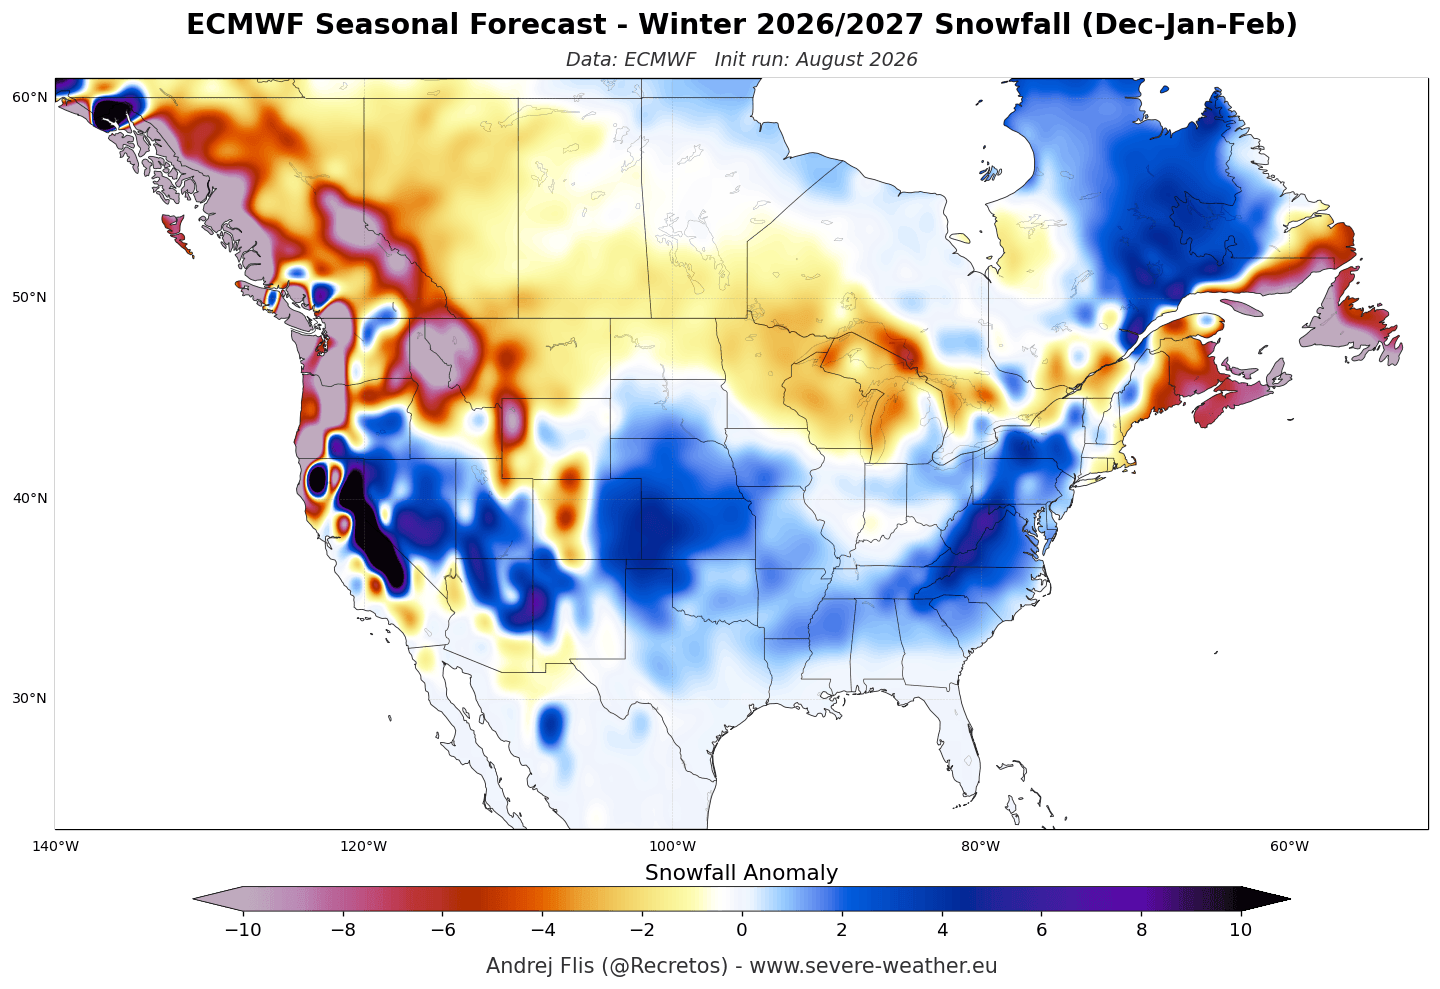
Above-normal snowfall potential is indicated across the Southwestern and Southeastern U.S., the Central Plains, parts of the Midwest, East, and into the Mid-Atlantic.
For skiers and winter sports enthusiasts, this pattern sets up a clear north-south divide across major mountain resorts. The highest snow potential is focused across California’s Sierra Nevada, Utah, and the Central to Southern Rockies (Colorado, Arizona, and New Mexico).
In contrast, resorts across the Pacific Northwest (the Cascades and British Columbia), the Northern Rockies (Idaho and Montana), and parts of Northern New England and Atlantic Canada face a much tougher setup, with persistent mild conditions and storm deflection favoring below-average seasonal snowpack.
Over Europe, the main snowfall potential comes from individual low-pressure systems moving farther inland and southward, bringing a more northerly flow for a change. The overall seasonal pattern is not particularly favorable for broad snowfall across Europe, with exceptions in the north and northeast and at higher elevations in the central parts.
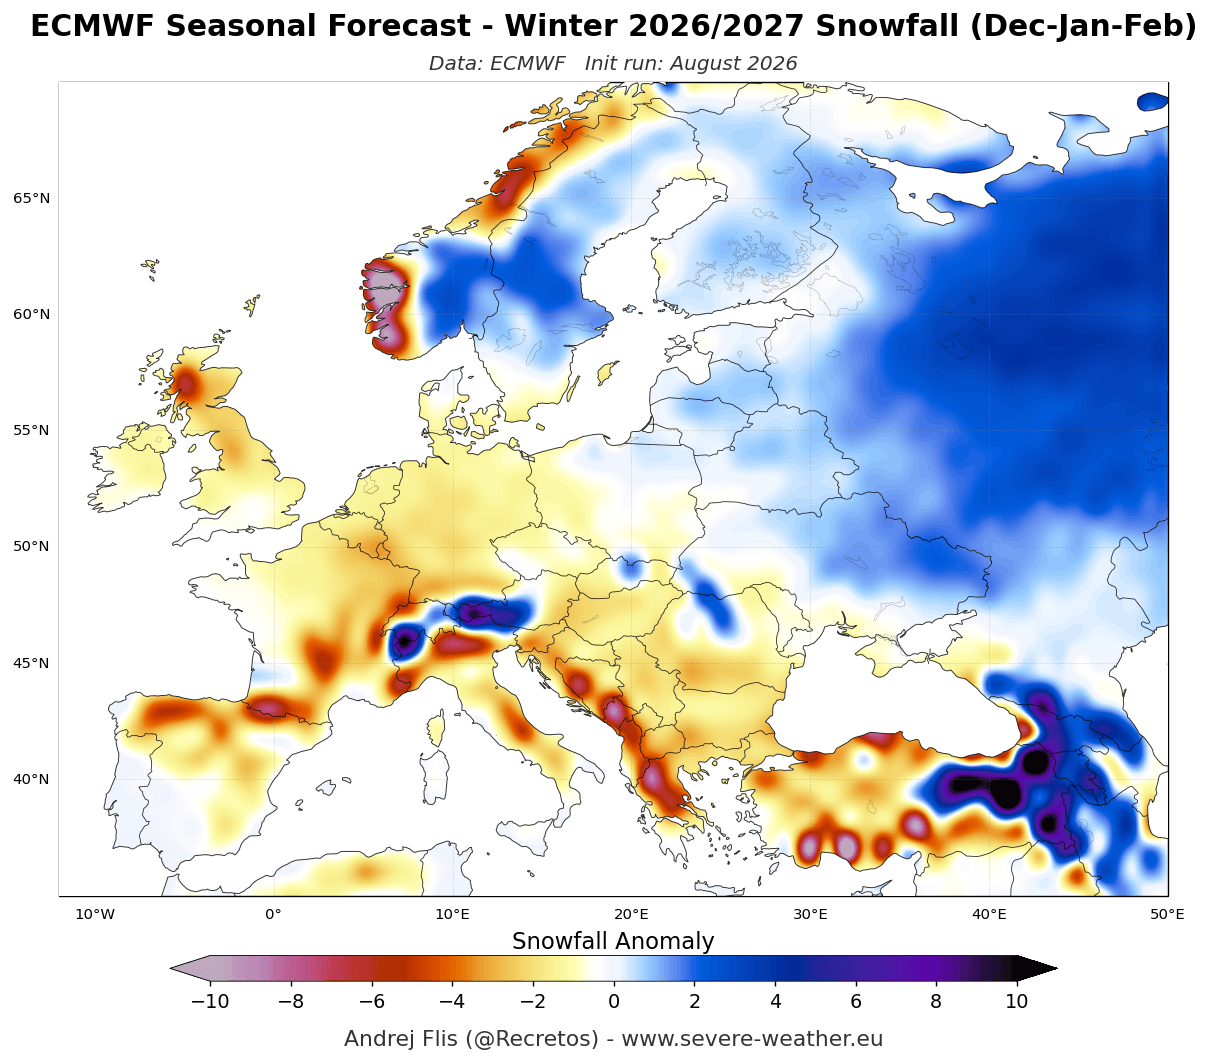
For European skiers, the upcoming season will be defined by elevation and latitude. A dominant mild Atlantic flow is driving widespread snowfall deficits across the lowlands and mid-elevations. Resorts in the Pyrenees, Apennines, Balkans, and Scottish Highlands can face a difficult setup with below-average natural snowpack.
But because these Atlantic systems carry abundant moisture, the highest elevations of the Alps (above 1800-2000m) in the western and central parts are likely to see above-normal snowfall where temperatures remain cold enough. For consistent deep snow and reliable conditions, the best setup will be found farther up over northern Europe.
I will soon finish a separate in-depth article on different snowfall predictions for Winter 2026/2027 over the United States, Canada, and Europe, with a monthly breakdown for more detail.
Using different forecasting solutions is a great way to see how convincing or stable a scenario is. For this reason, we will also look at the Winter 2026/2027 weather pattern using a multi-model forecast.
NMME Winter Forecast: A Second Model Supports the Large-Scale Pattern
I often use the NMME system in seasonal forecasting. Its initials stand for North American Multi-Model Ensemble. This system combines several individual predictions from the United States and Canada to produce an average forecast, merging different solutions.
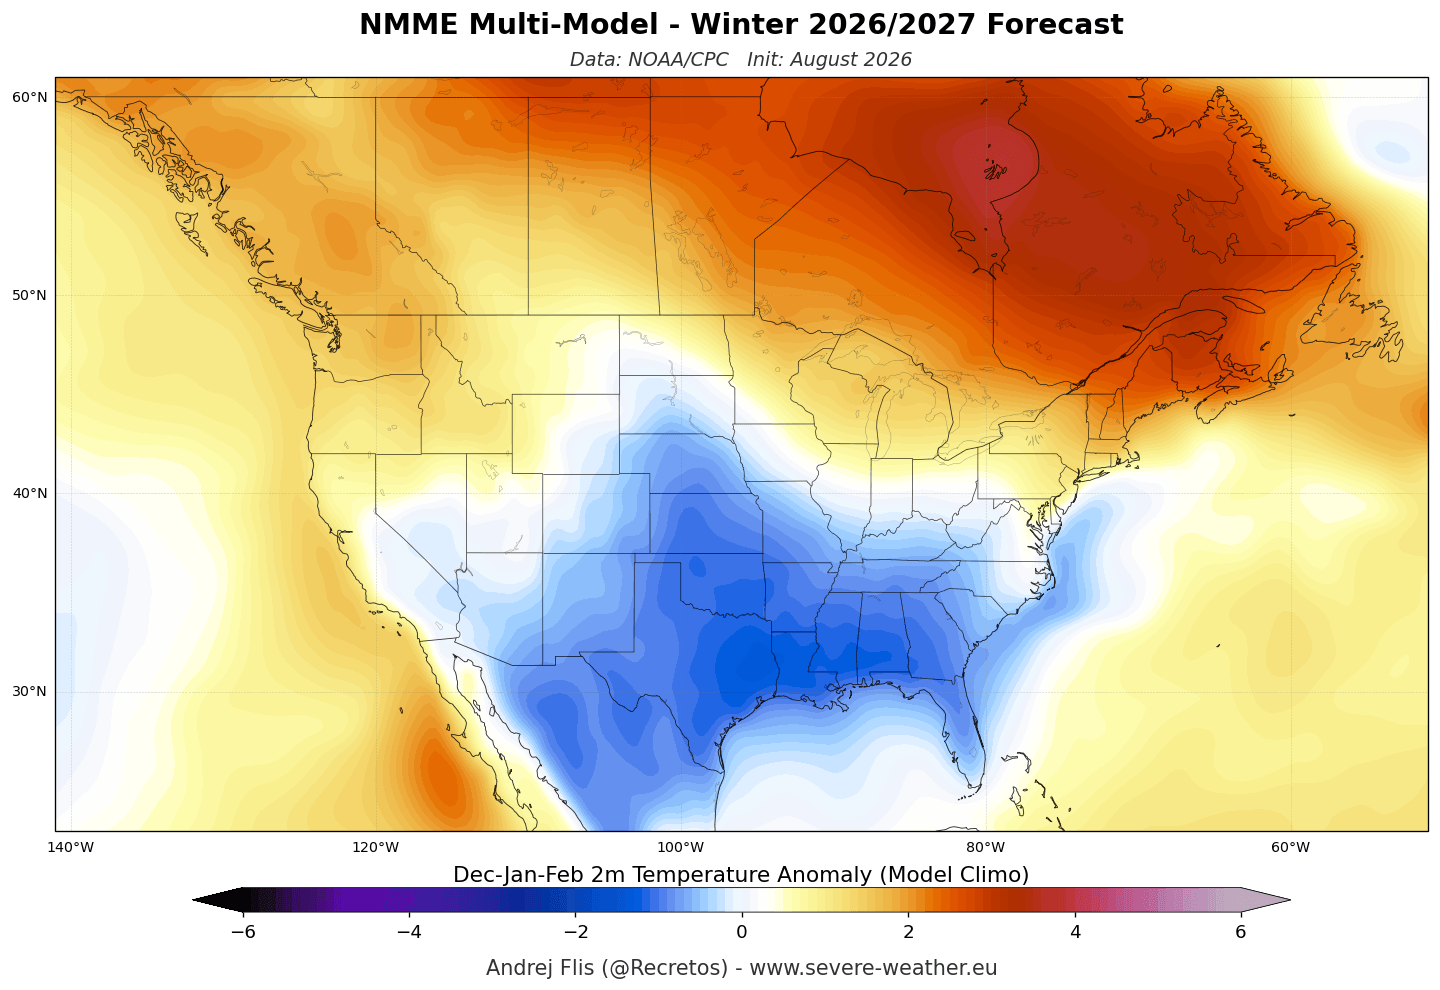
Looking at North America, it shows a similar forecast to ECMWF, with the main warm anomaly focused over the northern United States and Canada. This forecast also shows the below-normal temperature area over the southern and central United States, and over parts of the east. This is associated with the low-pressure zone over the southern U.S. and an amplified Pacific jet stream.
The NMME precipitation forecast for North America also confirms a stronger southern jet stream will be active, bringing moisture and precipitation. As in the ECMWF forecast, the bulk of the above-normal rainfall is over the West Coast and the southern and southeastern United States, and up the eastern parts of the U.S. and Canada.
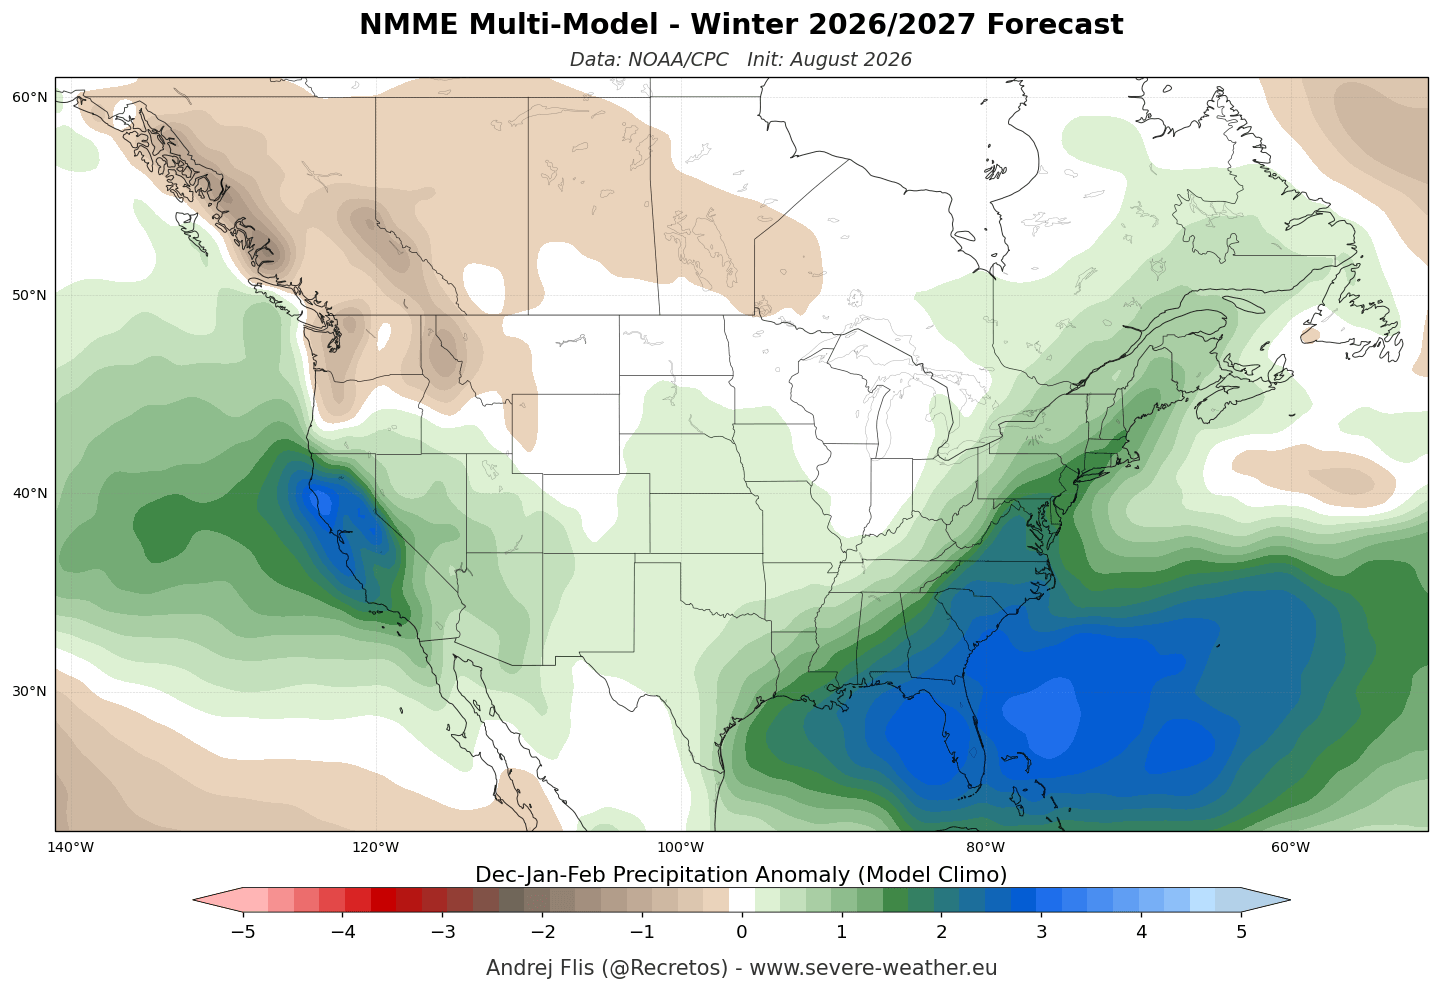
Below-normal rainfall is forecast over the Pacific Northwest and parts of southern Canada due to a high-pressure area over Canada, creating a strong pressure difference to the south.
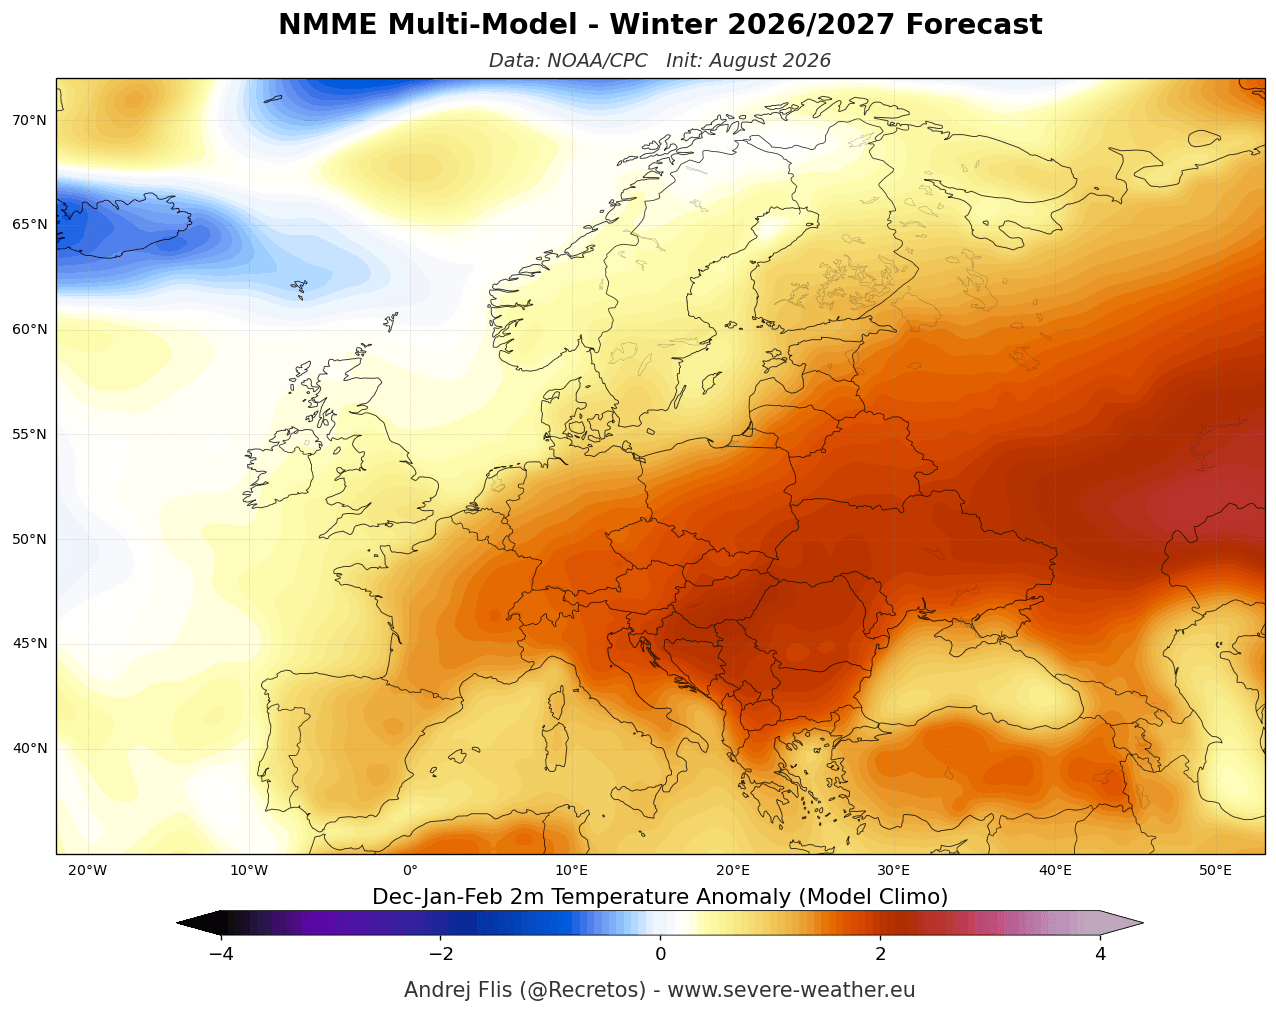
The surface temperature forecast for Europe shows a warm anomaly over much of the continent. The strongest warm anomalies are in the central areas, confirming a more westerly or southwesterly flow, the same as in the previous model above.
This westerly flow pattern is also evident in the winter precipitation forecast, which shows wetter conditions that are almost identical to those of the ECMWF model above. More precipitation is forecast across the northwestern, western, central, and northern parts. This suggests a likely low-pressure system in the North Atlantic into northern Europe, bringing in mild, moist oceanic air from the west and southwest.
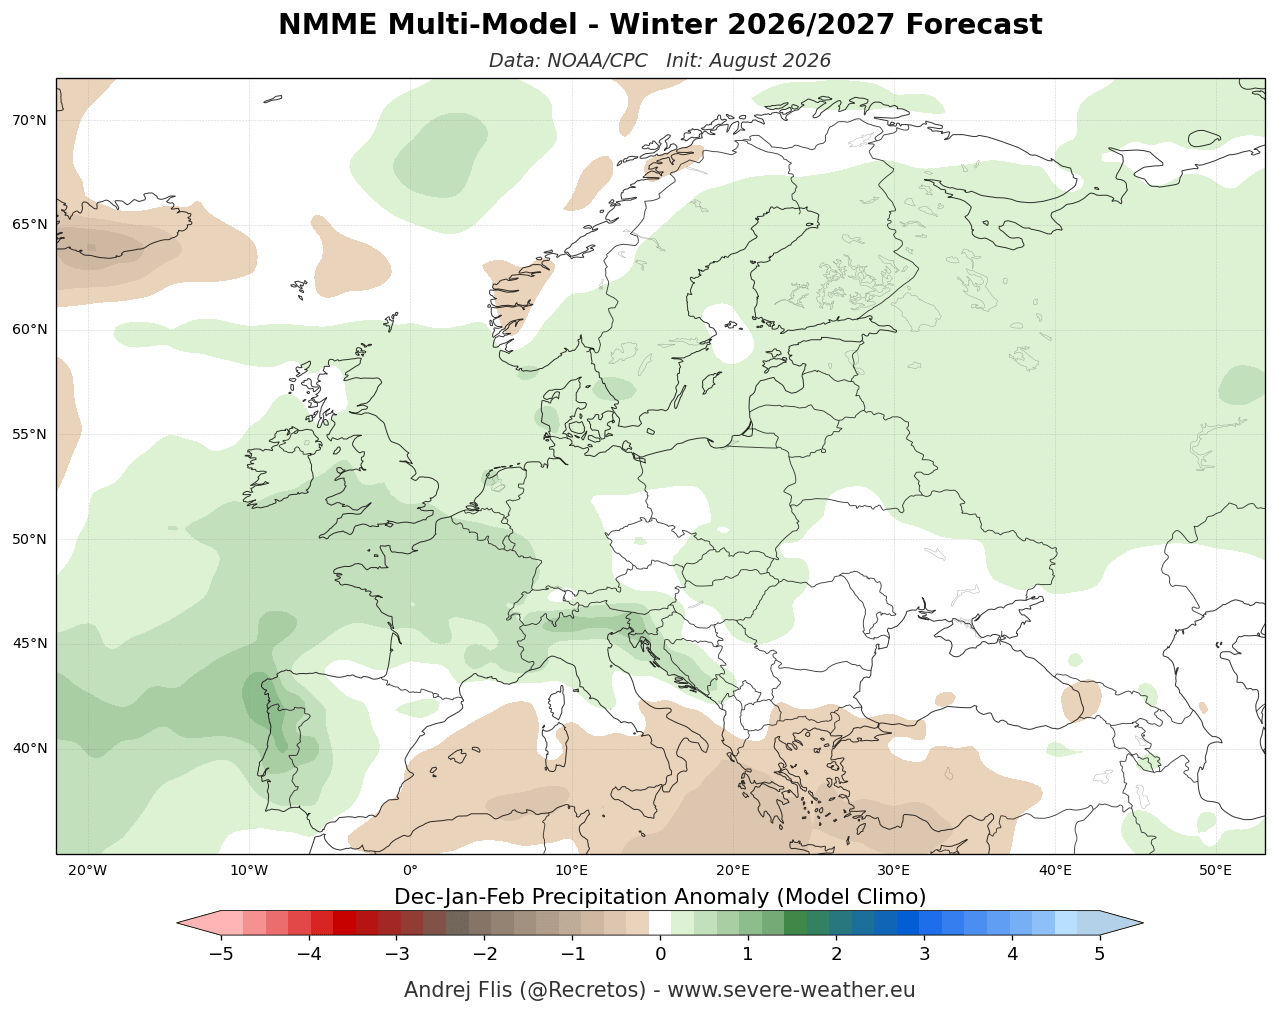
The broad agreement between ECMWF and the NMME multi-model ensemble increases confidence in the large-scale winter signal, particularly over the United States and Canada. And it makes sense, since the main driving force behind Winter 2026/2027 will be a potentially historic Super El Niño.
But there is one more winter weather driver that works in the atmosphere on a shorter scale and can actually be modified by El Niño to help shape the pressure anomalies: the stratospheric Polar Vortex.
Polar Vortex Forecast: Early Disruption Signal Appears for Mid-Winter
In simple terms, the Polar Vortex is a name for broad winter circulation over the northern (and southern) hemispheres. You can imagine the Polar Vortex as a spinning wall around the polar regions, rising from the surface into the stratosphere (over 50km/30miles high), trapping the cold polar air inside when strong.
When the stratospheric Polar Vortex becomes much weaker or disrupted, this disruption can gradually reach the weather patterns closer to the surface over the following weeks. This can shift the jet stream and build stronger high-pressure areas near the Arctic, making it easier for cold air to reach parts of the U.S., Canada, or Europe.
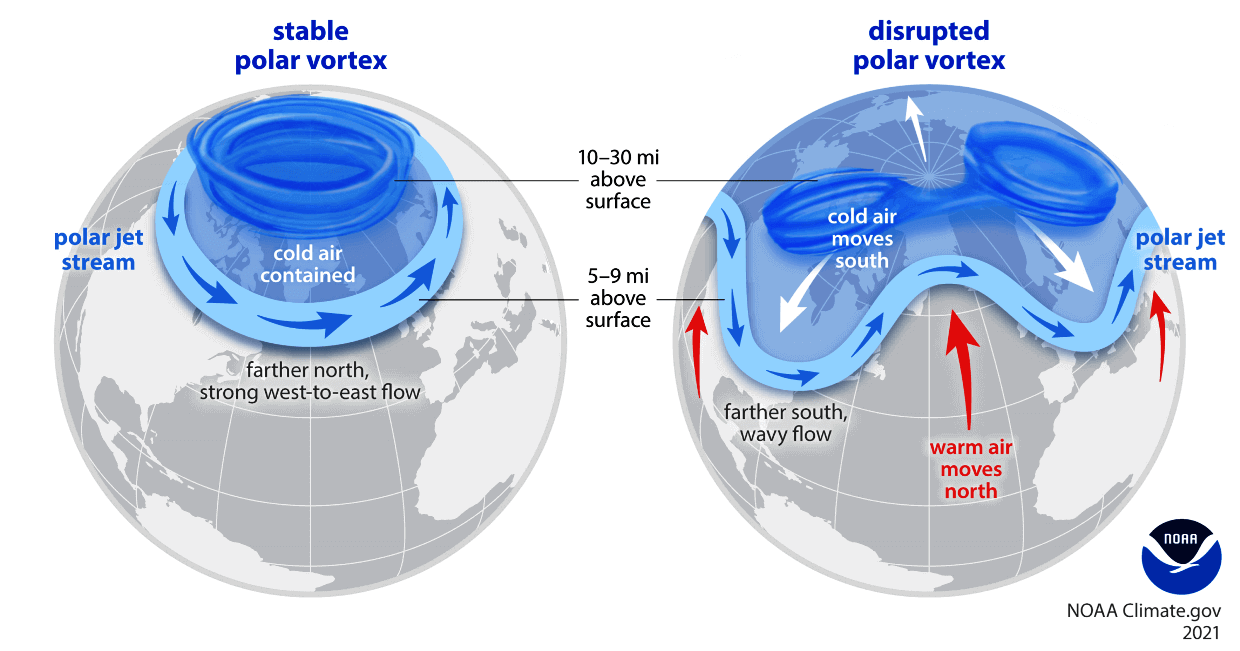
A weak or disrupted Polar Vortex can increase the potential for colder winter patterns across parts of the mid-latitudes, although it does not guarantee cold or snow in any specific region. The most dramatic disruptions are Sudden Stratospheric Warming (SSW) events, when powerful atmospheric waves rapidly weaken the Polar Vortex and can even reverse its stratospheric circulation.
Below is the winter atmospheric simulation from a recent study (linked below) that compares the impact of El Niño (EN) on the Polar Vortex across different strengths: weak (W), moderate (M), and strong or super-event (S). Warm colors show faster winds, and cold colors indicate weaker winds.
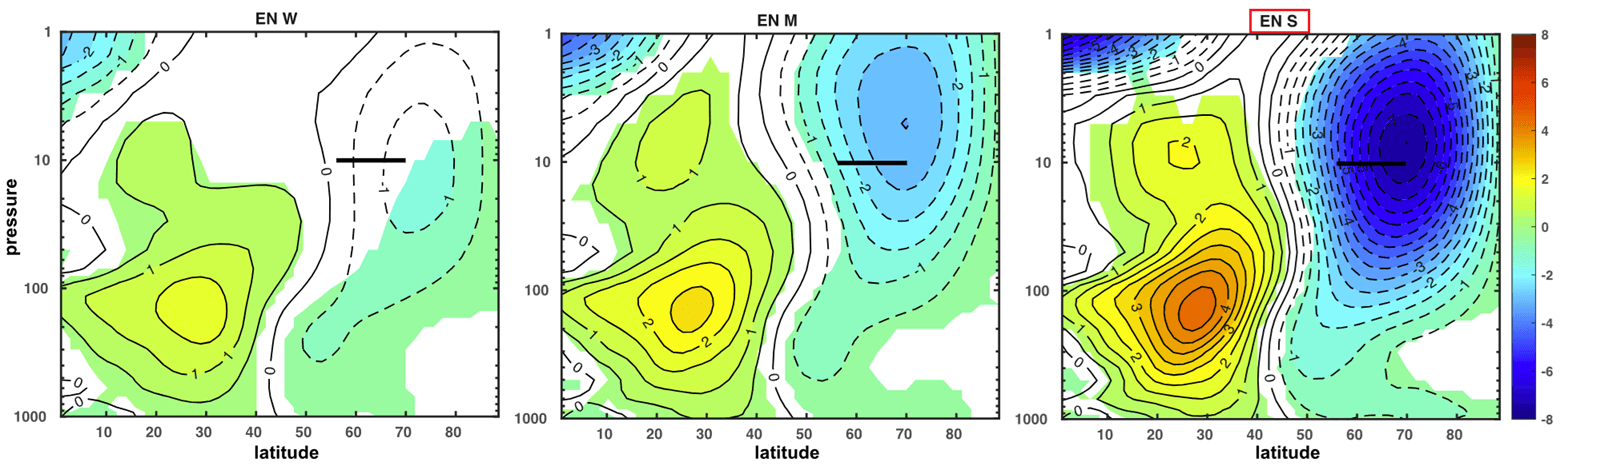
The far-right panel shows that a strong El Niño can produce a substantial weakening of the stratospheric Polar Vortex later in mid-to-late winter. An important point is that the response is not simply dependent on El Niño strength, but can change significantly over the course of the winter.
The most recent ECMWF seasonal forecast shows an unusual weakening of the stratospheric westerly winds around late December and January. The below-normal wind signal indicates a weaker Polar Vortex during this period. This does not predict a specific SSW event months in advance, but it suggests an atmospheric state that could be more favorable for a significant disruption.
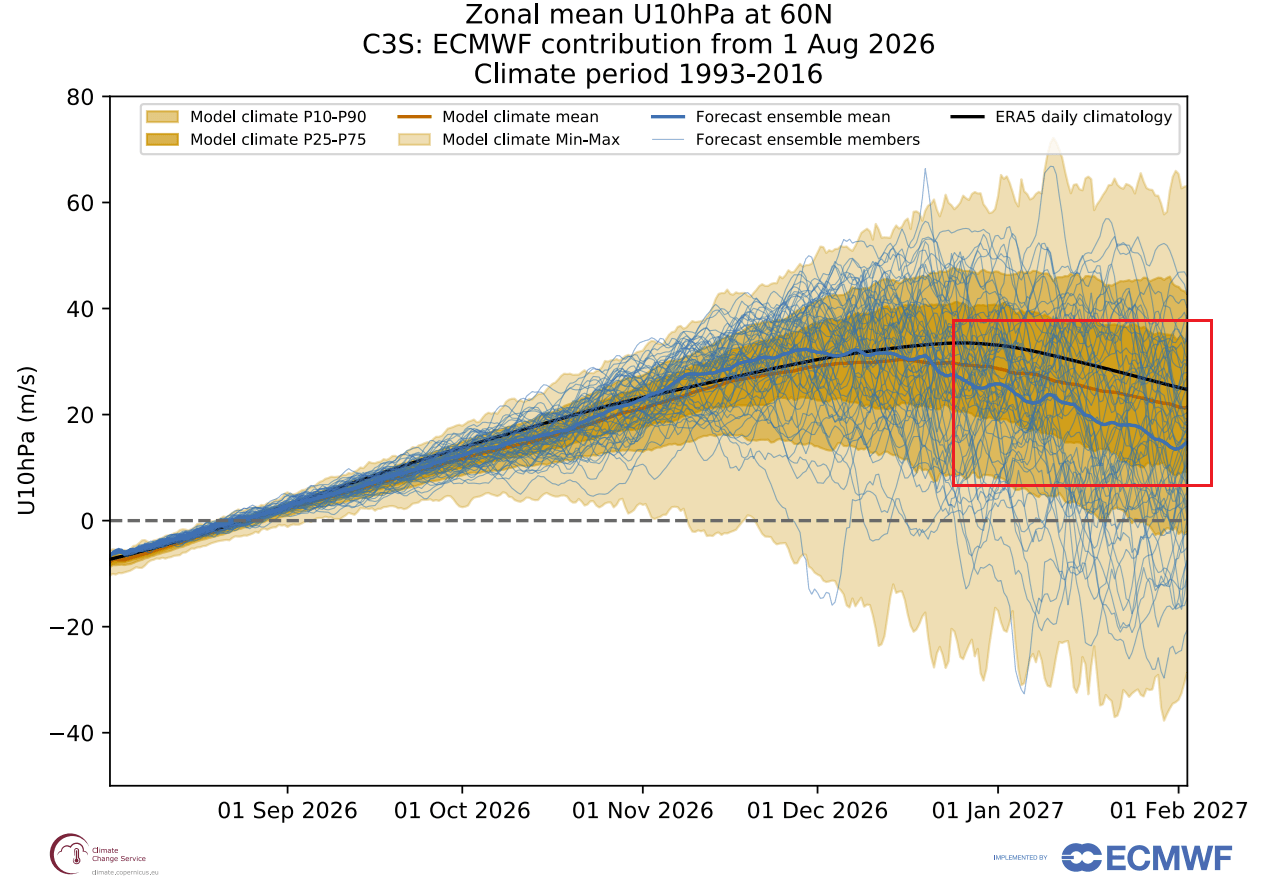
We can also look at the UKMO stratospheric forecast, which shows an even stronger weakening signal over the same late December-January period. This is a likely response to the El Niño pattern releasing substantial energy into the stratosphere via its amplified atmospheric waves.
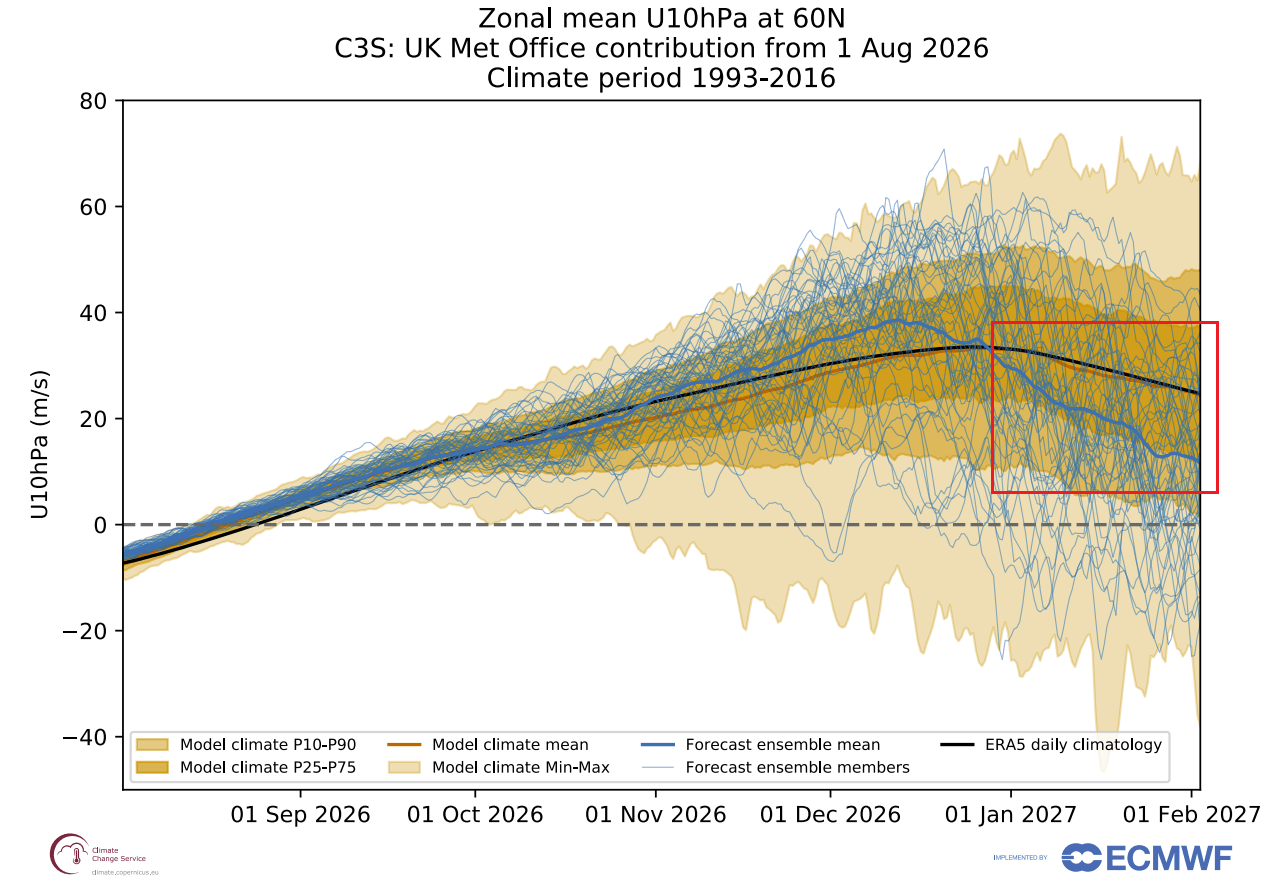
Agreement between the two systems adds confidence to the broader seasonal signal for a weaker Polar Vortex around mid-Winter. Neither forecast can determine at this range whether a major SSW will actually occur, but seeing an early deceleration is an important signal.
A Polar Vortex slowdown means that its strong westerly winds are weakening. If those winds eventually reverse direction high in the stratosphere, we have a major Stratospheric Warming event. If that disruption later reaches the lower atmosphere, it can disturb the jet stream and increase the chance of cold-air outbreaks further south.
The image below shows the average temperature pattern in the first 30 days after major SSW events. On average, colder conditions become more likely across large parts of the United States and northern and central Europe. Of course, this is an average across many events, and a Super El Niño can ultimately alter the actual flow of cold air with its own pressure anomalies.
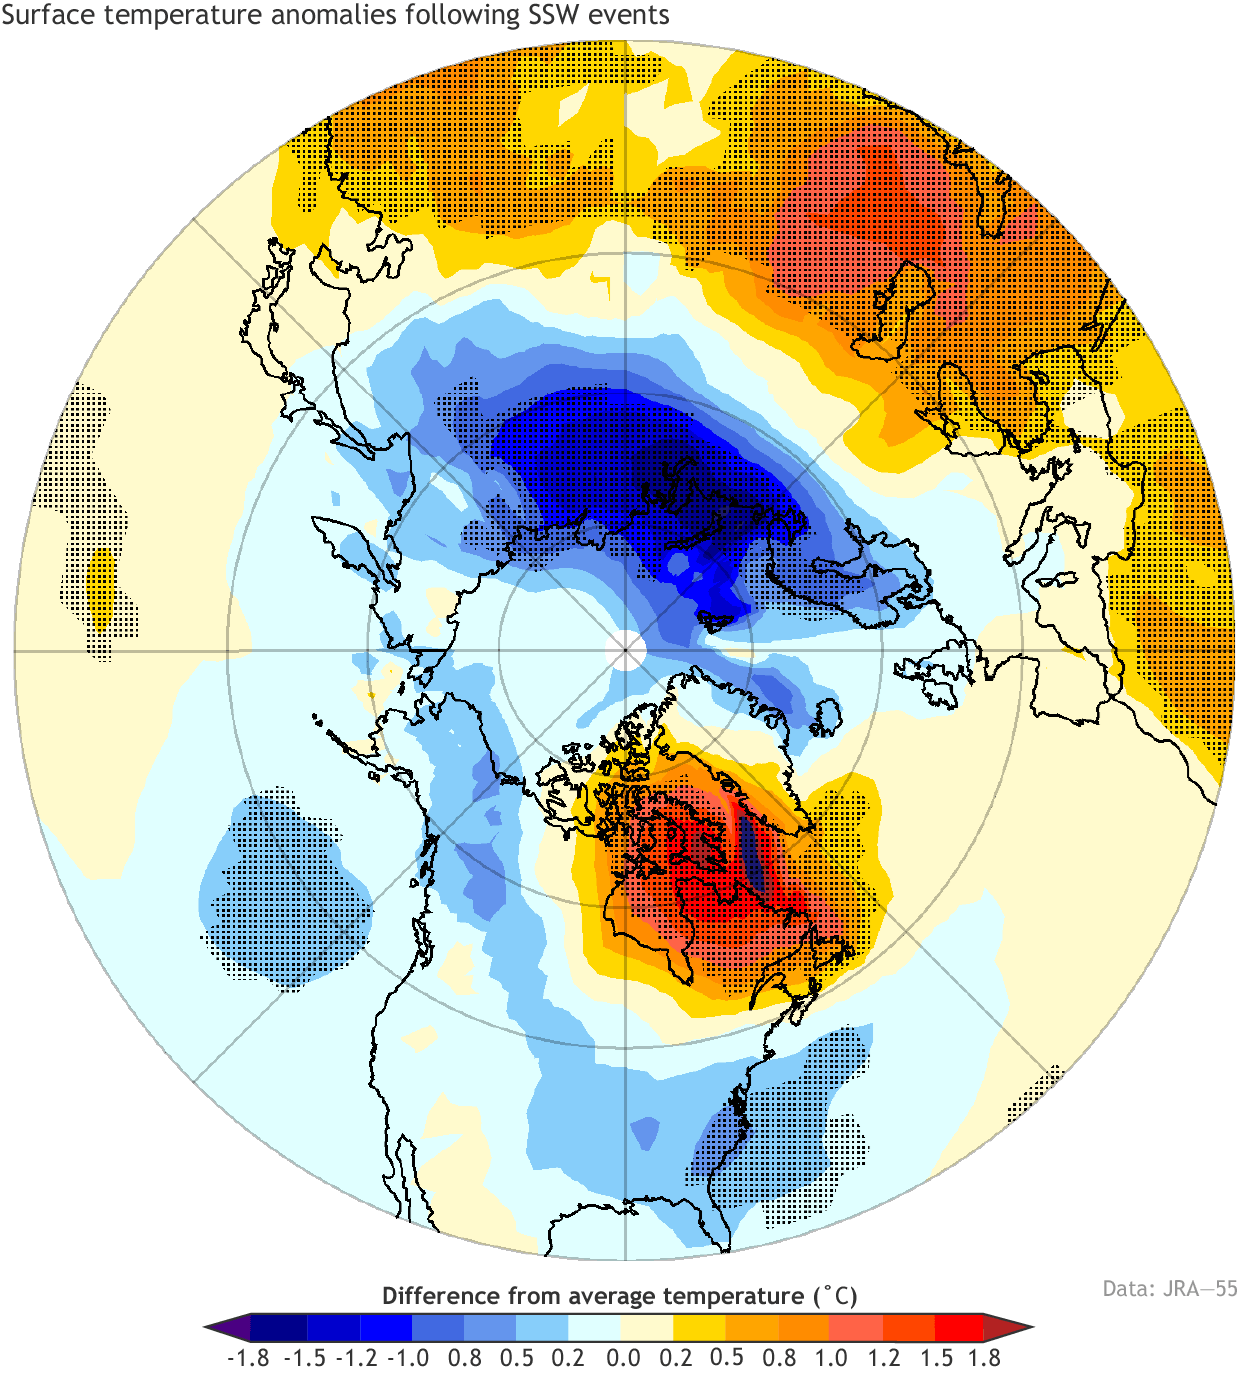
This is the pattern that we also saw last winter, featuring a disrupted lower Polar Vortex core moving into North America, establishing the “Polar Express” pattern, the same as seen in the image above.
Research also showed that strong El Niño winters can have an unusual evolution of the Polar Vortex. Relatively strong circulation early in the season is followed by rapid weakening around the December-January transition.
This means the Polar Vortex can behave very differently from one part of Winter to another. It can start the season relatively strong and then weaken rapidly around December and January. That is actually close to what the two seasonal forecasts above are currently showing for 2026/2027.
Winter 2026/2027 Monthly Breakdown: Pattern Amplifies Into January and February
Research indicates that a strong El Niño can send more atmospheric wave energy upward from the Pacific, putting extra pressure on the stratospheric Polar Vortex as Winter progresses. If the vortex starts to weaken, it can further disrupt the weather patterns later in the season, adding to the already strong El Niño influence.
The image below shows a direct comparison of the December (left) and January (right) forecasts. You can see a significant change in the strength of the anomalies in the otherwise same pressure pattern layout. In the January forecast, we can see obvious amplification of the Pacific low-pressure zone, which powers the Pacific jet stream over the southern United States.
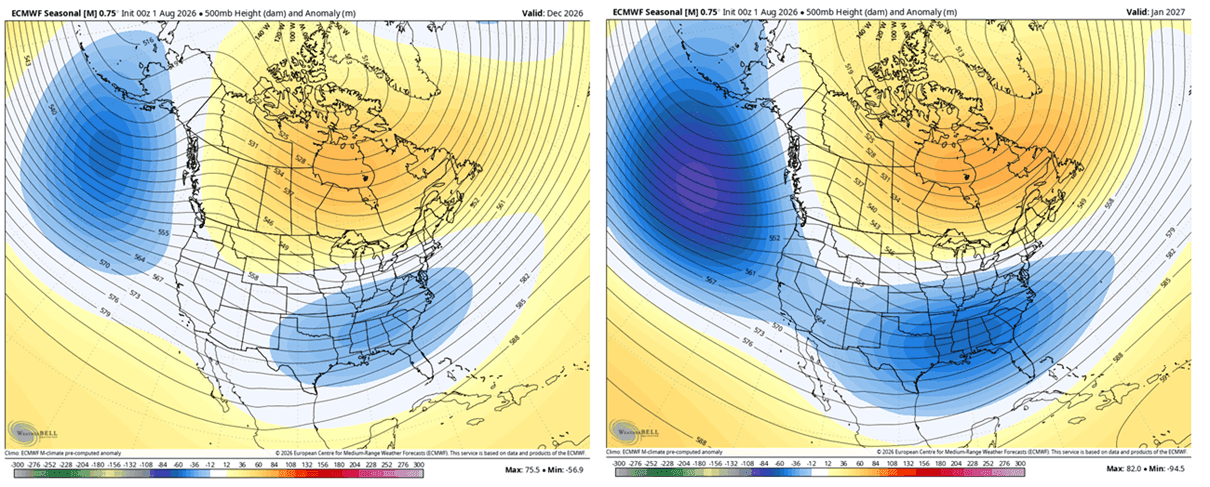
Seasonal pressure anomalies often become stronger as winter progresses, but the important feature here is that the same main pressure areas remain in place and become stronger, rather than shifting into a completely different pattern. This suggests that the established El Niño pattern could become increasingly amplified from December into January.
The temperature comparison also shows how the regional contrasts become more pronounced from December into January. Stronger warm anomalies develop beneath the Canadian ridge, while the southern United States remains cooler under the active southern storm track. This growing north-south contrast is another sign that the El Niño split-flow pattern is becoming stronger as Winter progresses.
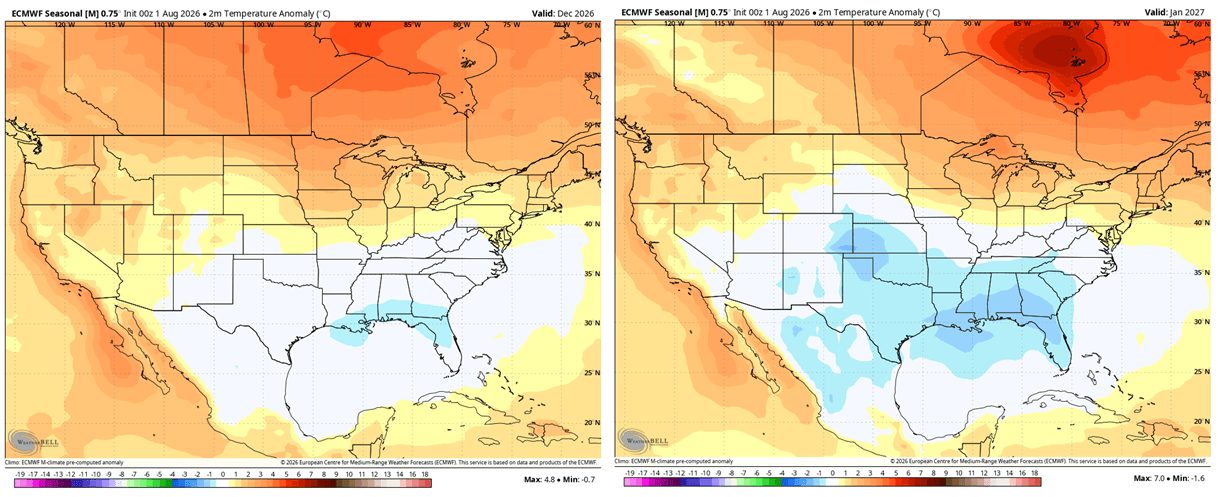
Such an amplified setup can also become more favorable for periodic cold air intrusions into the central and eastern United States if the northern blocking and southern storm track align correctly.
Looking at the February forecast trend, current data show further amplification from January, with strong blocking centered over Canada at mid-levels. This favors a pronounced split-flow setup, with the northern flow pushed around the strong Canadian high-pressure area, while an active southern jet runs across the United States. The ridge also favors above-normal temperatures across Canada and the far northern United States.
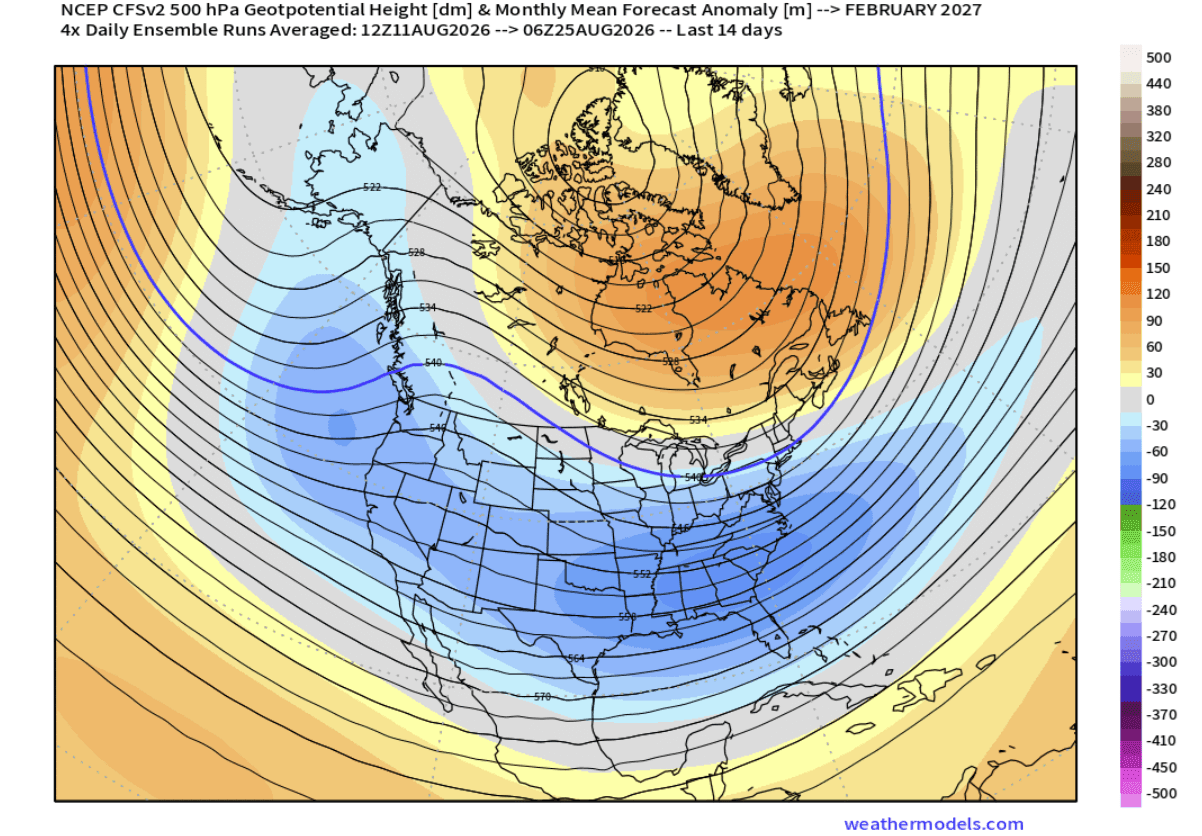
At the same time, a highly active low-pressure zone extends across the southern and eastern United States. This is consistent with an enhanced subtropical jet and a stronger southern storm track. This brings more moisture-rich systems into the Southern, Central, and Eastern United States.
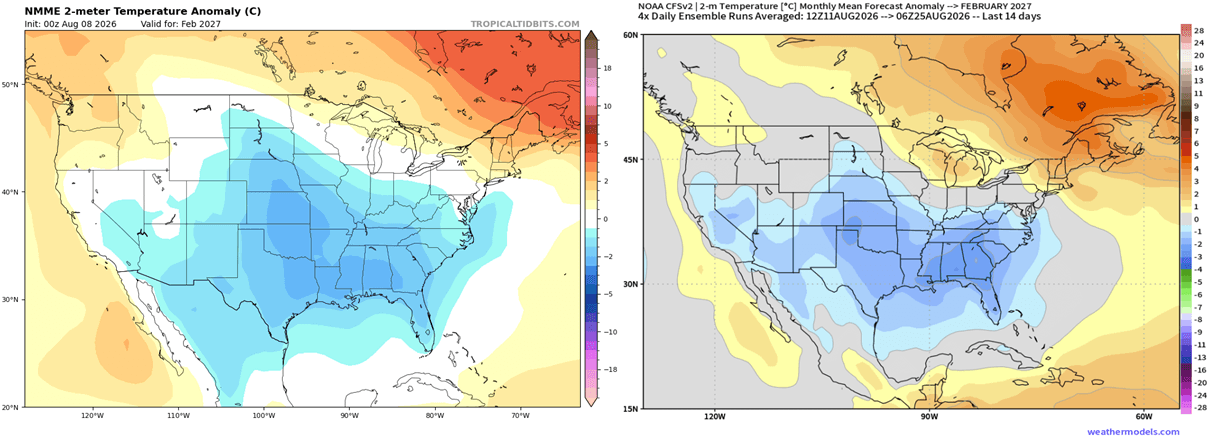
The temperature comparison below adds support to this mid-to-late Winter trend. Two different forecast systems show a broad area of below-normal temperatures across parts of the central, southern, and eastern United States in February, aligned with the amplified southern low-pressure pattern. This doesn’t guarantee individual cold outbreaks, but it strengthens the signal for a colder pattern across parts of the United States later in Winter.
The story is different over Europe, where the forecasts show much less monthly change from December (left) into January (right). A persistent westerly pattern remains dominant, consistent with the North Atlantic weather response, typically seen during Super El Niño winters.
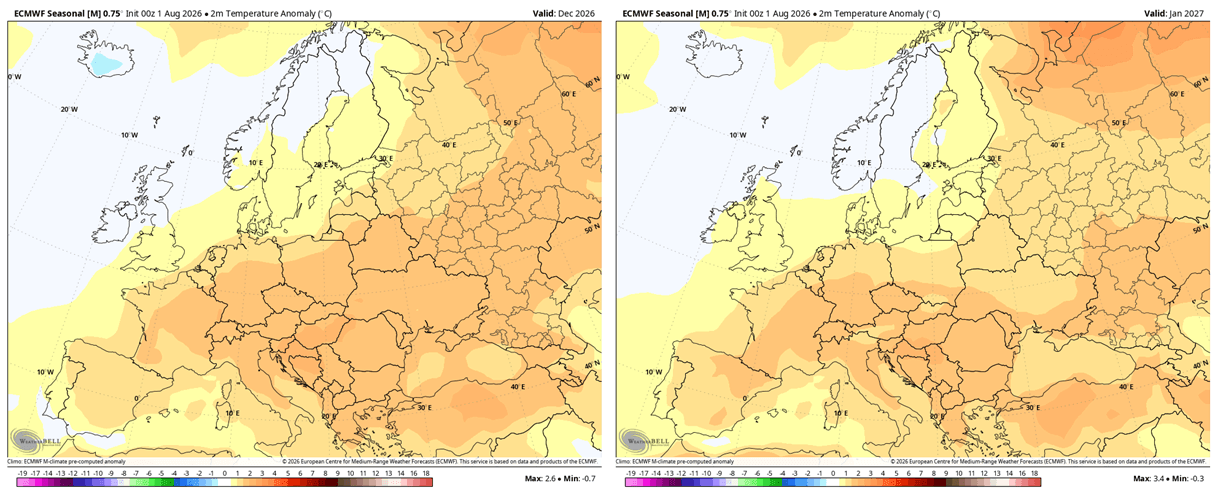
This pattern limits any long-lasting winter potential, but there is some room to improve. Unlike North America, where the models show a clear, direct Super El Niño signal, the current Winter trends over Europe also remain sensitive to changes in the North Atlantic circulation, so the final outcome depends also on other factors.
If you like this article and would like to see more of our weather and nature coverage, you can quickly and easily add us as a Preferred Source on Google Search.
Make us your Preferred Weather & Nature Source on Google
Scientific Studies Used in this Forecast Article
- Extreme El Niño Winter Teleconnections: A Distinct and Reproducible Teleconnection Pattern over North America during Extreme El Niño Events – Beniche et al. (2024).
- Polar Vortex and Winter Patterns: A Strong Phase Reversal of the Arctic Oscillation in Midwinter 2015/2016: Role of the Stratospheric Polar Vortex and Tropospheric Blocking – Cheung et al. (2016).
- ENSO-Stratosphere Pathway: Nonlinearity and Asymmetry of the ENSO Stratospheric Pathway to North Atlantic and Europe, Revisited – Manzini et al. (2024).
- Strong El Niño and the Polar Vortex: The Impact of Strong El Niño and La Niña Events on the North Atlantic – Hardiman et al. (2019).
Forecast and analysis images in this article are from ECMWF, CyclonicWX, weathermodels.com, and WeatherBell (using a commercial license).
Fall 2026 Final Forecast: Fall 2026 Forecast Update: Super El Niño Builds a Split-Flow Pattern Ahead of Winter 2026/2027
Snowfall Forecast 2026/2027: Winter 2026/2027 Snowfall Predictions: New Data Shows a Strong Super El Niño Snow Pattern
We will keep you updated on the global weather pattern development, so bookmark our page. Also, if you have seen this article in the Google App (Discover) feed, click the like (♥) or the star button there to see more of our forecasts and our latest articles on weather and nature in general.