UPDATE September 16th, 2026: A New Polar Vortex is Now Emerging, with a Mid-Winter Disruption Forecast for 2026/2027
Early signs are emerging for a potentially more disrupted Polar Vortex during Winter 2026/2027. New long-range data shows a notable January weakening signal in the stratosphere, while several major background drivers are developing in a way that can increase the chance of a more dynamic winter pattern across the United States, Canada, and Europe.
The main signal comes from a developing Super El Niño, an active westerly wind anomaly high above the tropics, and unusually low Arctic sea ice in key regions. Each of these can influence the Polar Vortex in a different way, by sending more wave energy into the stratosphere or by changing the circulation around the North Pole.
A weaker or disrupted Polar Vortex does not guarantee cold and snow for everyone. But it does increase the chance that Arctic air can break out of the polar regions and reach the mid-latitudes. In this article, we look at the three major global signals now being monitored and how they align to shape the Winter 2026/2027 Polar Vortex and weather patterns.
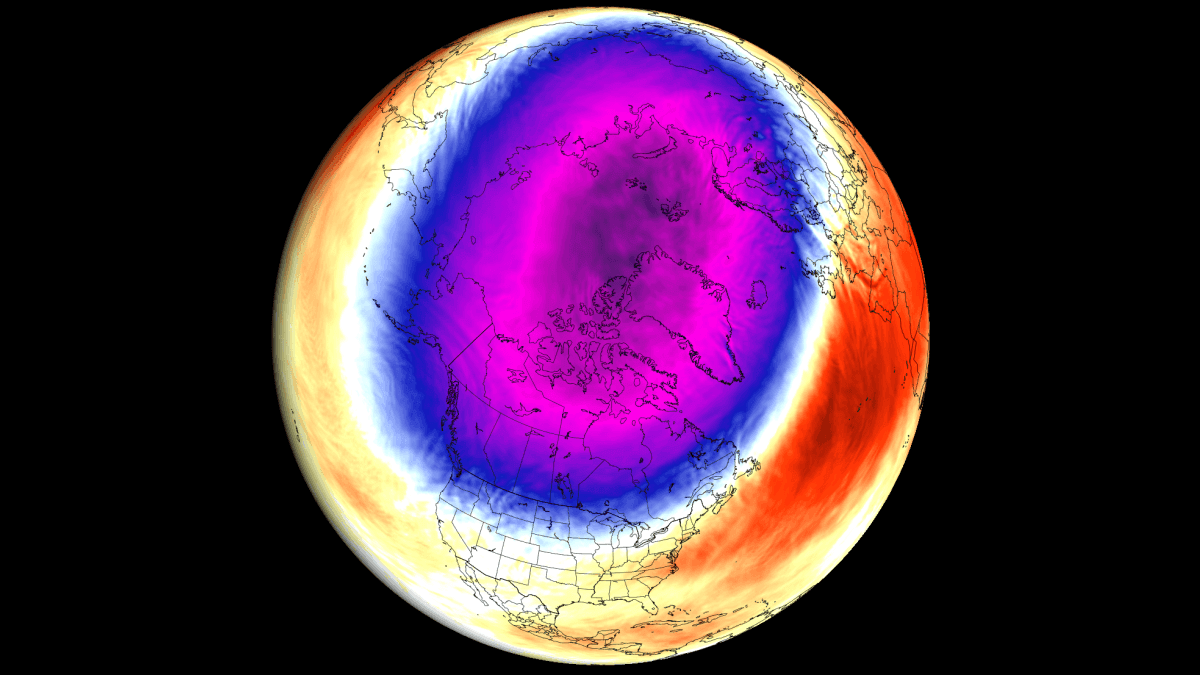
Polar Vortex: The Winter Circulation Above the North Pole
In simple terms, the Polar Vortex is a name for broad winter circulation over the northern (and southern) hemispheres. You can imagine the Polar Vortex as a spinning wall over the polar regions, rising from the surface into the stratosphere (over 50km/30 30miles high), trapping the cold polar air inside.
The Polar Vortex is divided into two layers: the stratosphere (at higher altitudes) and the troposphere (at lower altitudes). These two layers are connected but often behave differently. A stable Polar Vortex acts like a barrier, locking the coldest air into the North Pole, creating milder conditions for the United States and Europe.
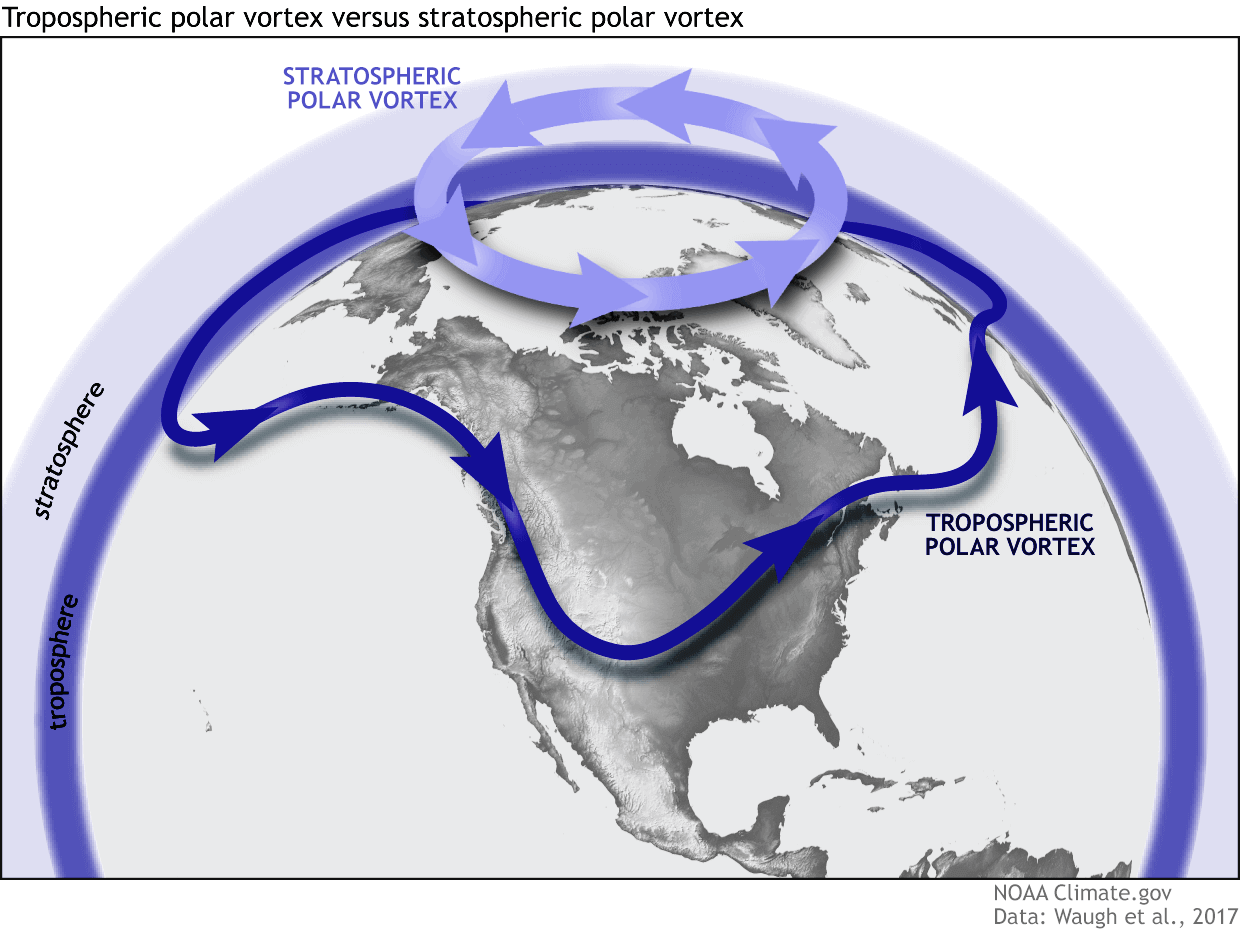
When the Polar Vortex is disrupted or collapses, these “polar walls” break down, allowing cold Arctic air to spill southward into the mid-latitudes. This can be amplified if the Polar Vortex is strong before collapsing. Below is an example from NOAA of how a disrupted Polar Vortex releases cold polar air into the United States or Europe.
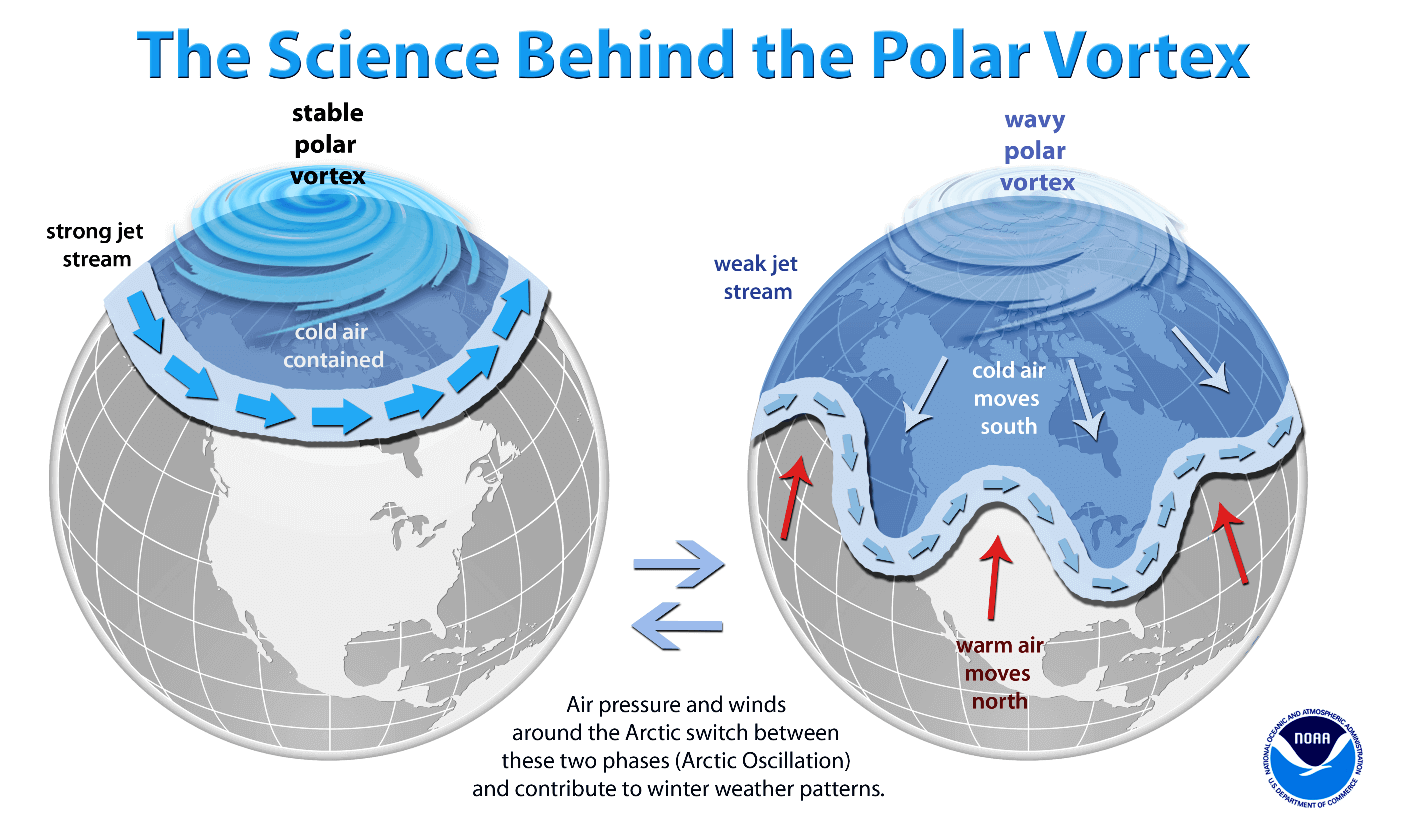
If you like cold winter weather across the United States, Canada, or Europe, then a weak/disrupted Polar Vortex is by far the best option. But a disrupted Polar Vortex does not guarantee cold in every single area of the mid-latitudes.
To show the Polar Vortex in its true form, we produced a high-resolution video below that reveals its proper 3D structure. This video shows the disruption of the Polar Vortex in early 2026, which brought down a cold air outbreak into the central and eastern United States and parts of Europe.
The disruption usually arises from a rise in stratospheric pressure and temperature, known as a Sudden Stratospheric Warming (SSW) event, or from other dynamics that can originate as waves of energy rise from the lower levels.
Not every disruption is a major Stratospheric Warming event. But even smaller disruptions can influence the Polar Vortex and the winter weather at the surface. And there are many ways that the Polar Vortex can be weakened, and some can be detected very early ahead of the season.
For Winter 2026/2027, we are currently looking at three early factors that have a known impact on the Polar Vortex:
- ENSO – A Super El Niño forecast
- QBO – Stratospheric wind anomaly
- Sea-Ice loss
We will quickly go over each factor, starting at the ocean surface and moving up into the atmosphere.
Super El Niño: A Strong Pacific Signal for the Polar Vortex
The first factor is the ENSO, which is short for “El Niño Southern Oscillation.” This is a region of the equatorial Pacific Ocean that changes between warm and cold phases. Typically, there is a phase change every 1-3 years, but some events can last for several years.
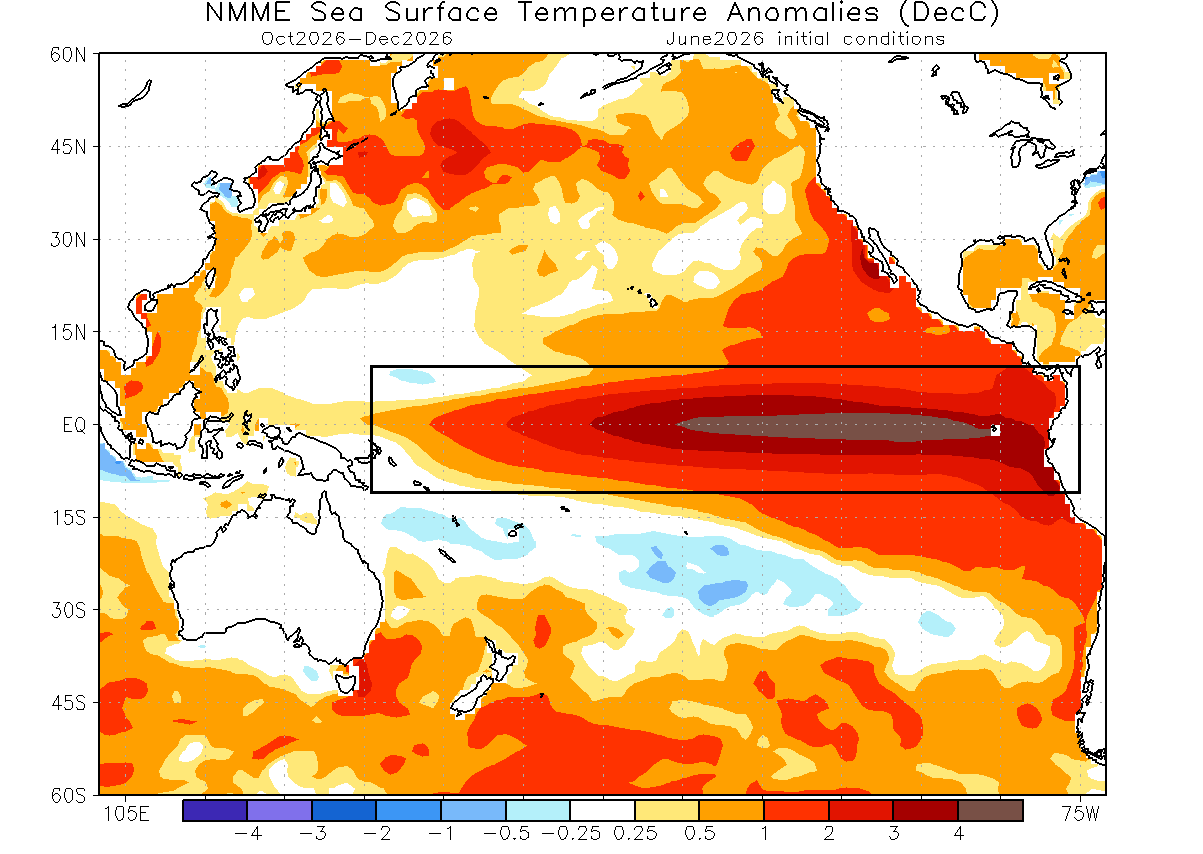
We are currently observing a very strong El Niño event (warm phase) developing, forecast to peak as one of the strongest such events in decades.
Below is the ocean temperature forecast for late autumn and early winter from the NMME model. You can see a large area of strong warm ocean anomalies, which is the forecasted El Niño event. With peak seasonal anomalies over 4 degrees above normal, this would be classified as a Super El Niño event.
This is reflected in the latest ENSO forecast from the NCEP CFSv2 model, seen below. It shows a very strong El Niño developing, exceeding the Super El Niño threshold (+2 degrees), having an immediate impact on the fall and winter patterns. The current development shows the same trend as previous strongest events, forecast to rise even higher, as one of the strongest events on record.
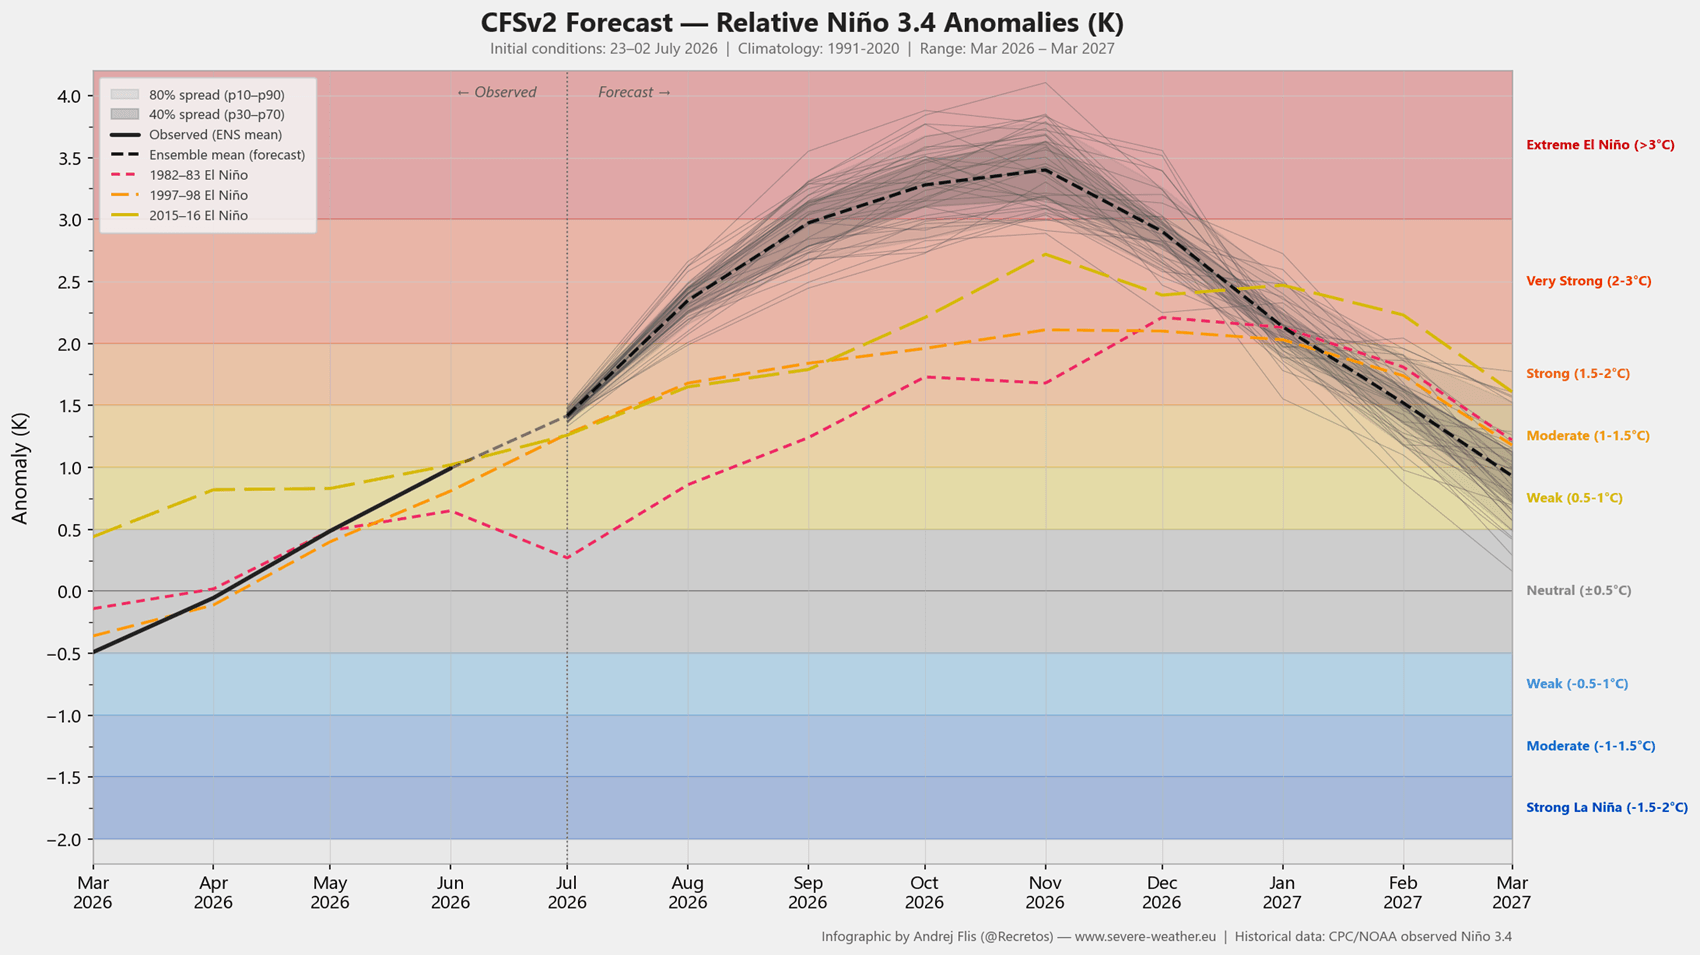
A super El Niño event usually leads to more extreme weather shifts, amplifying normal seasonal changes into high-impact weather events. That can result in massive flooding, severe droughts, and significantly altered pressure system tracks that can affect the entire planet, especially in the winter season.
Historically, an El Niño winter has a high chance of producing a Stratospheric Warming Event (SSW). It has produced them in the past and also in the more recent winters. The image below shows the typical SSW event frequency by month and by the ENSO event.
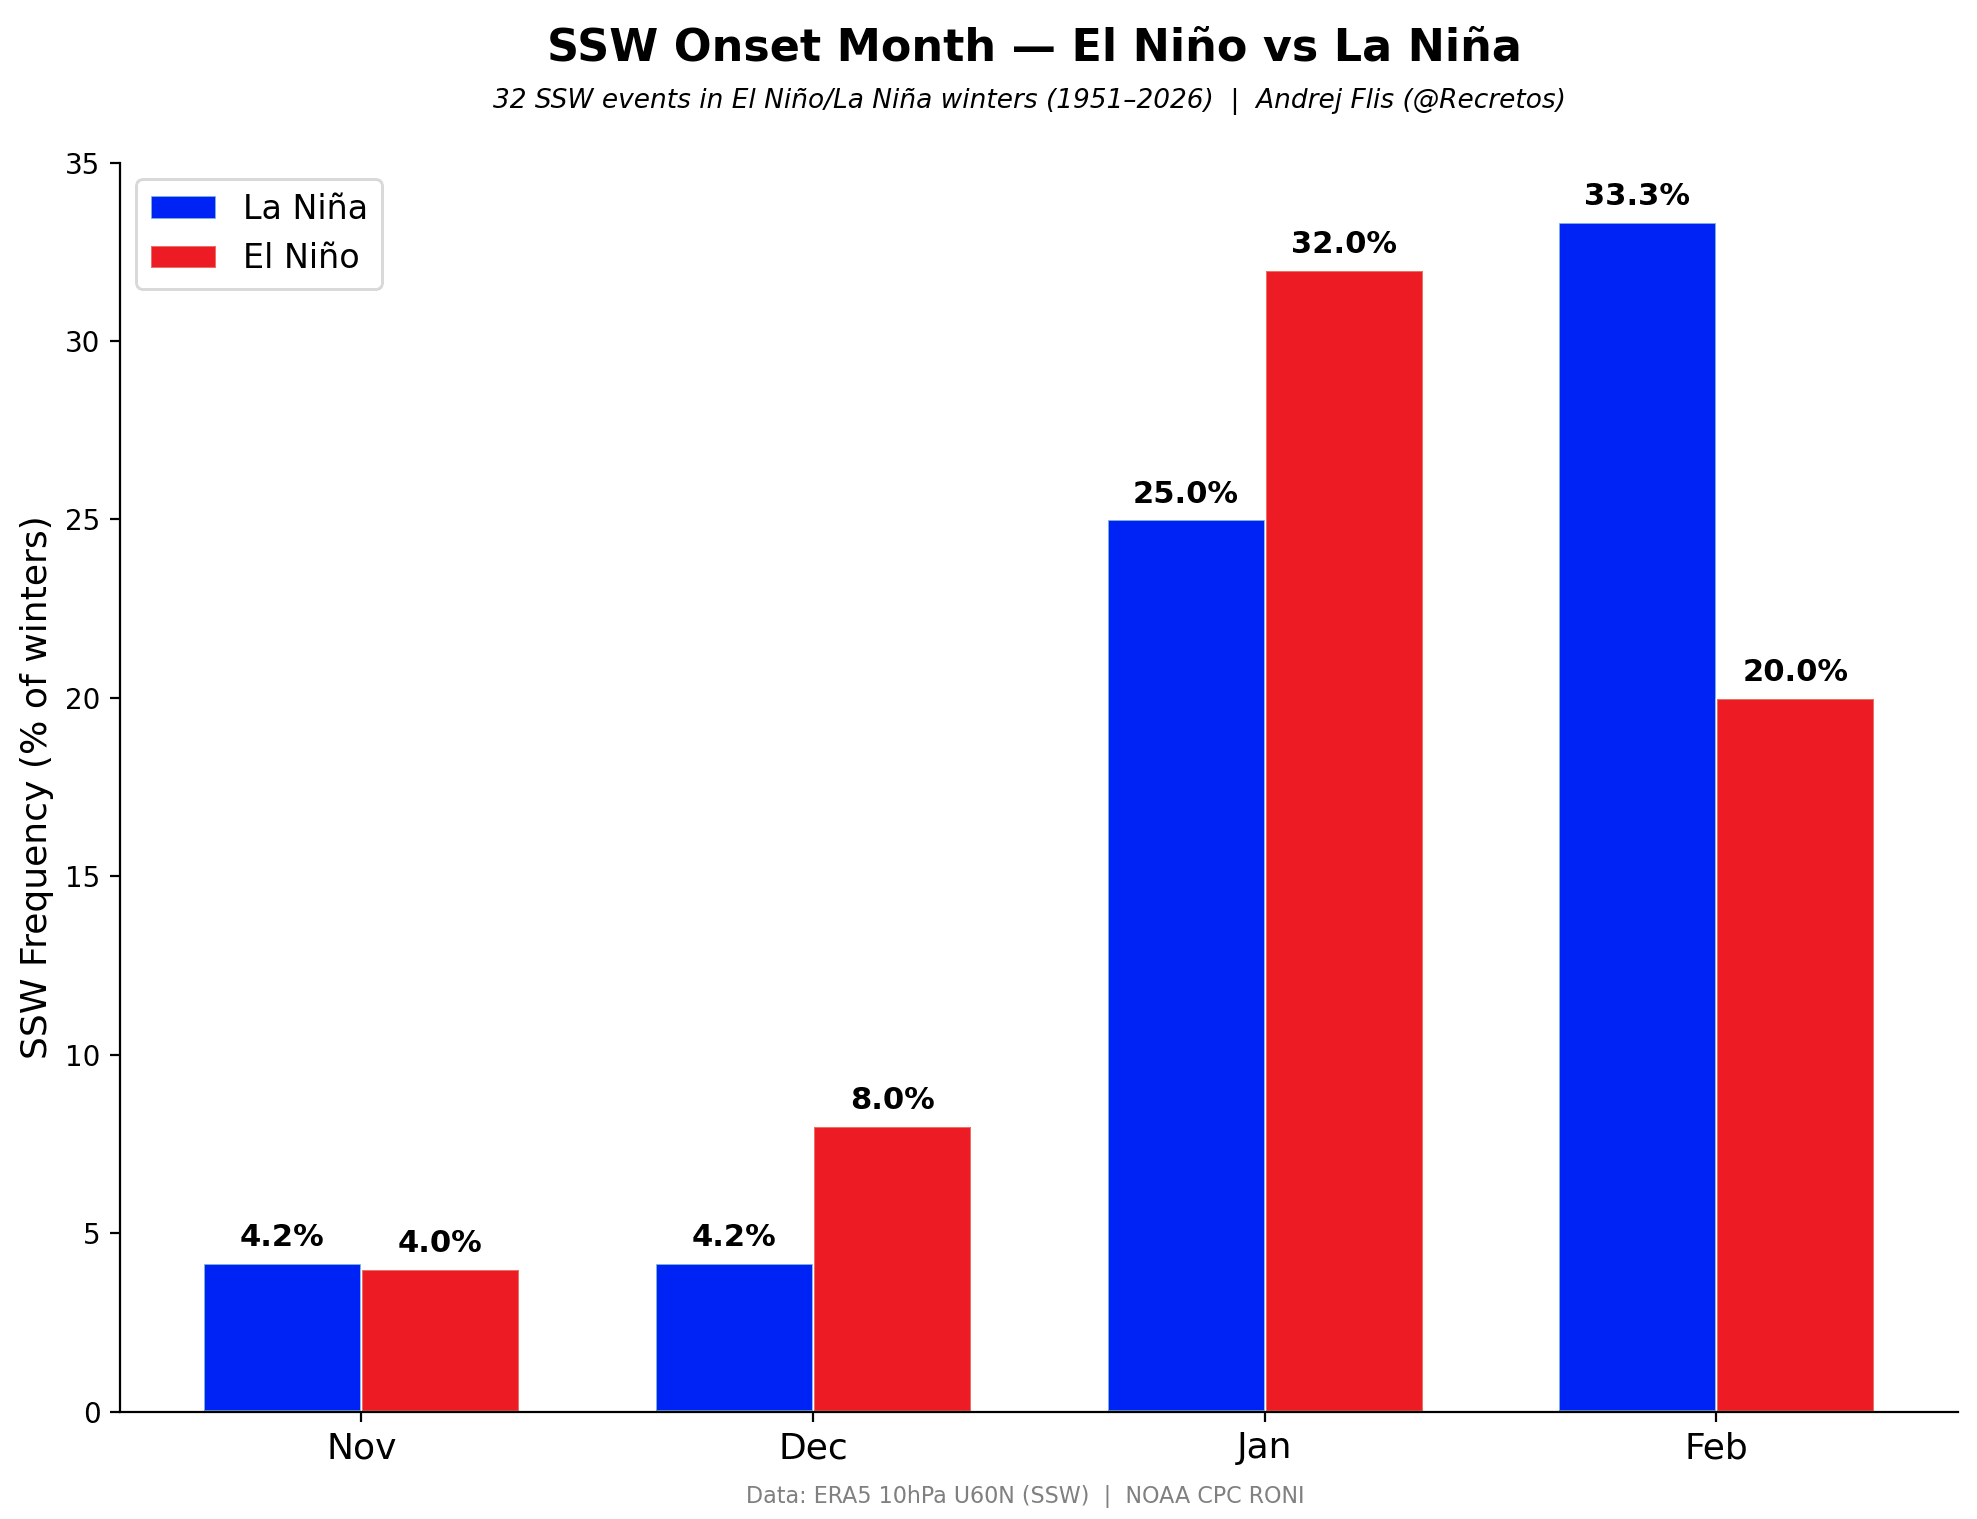
As you can see, El Niño phase has a higher chance of producing a Polar Vortex collapse event in mid-winter. It shows a better chance for a Polar Vortex disruption in December and January, compared to a La Niña event, with an especially high impact in January.
The reason behind this can be seen in the image below. It shows the typical pressure anomaly before the SSW or a Polar Vortex disruption. On the right panel, we can see the mid-winter pressure pattern during an El Niño event. Two main regions are outlined, and show that El Niño typically creates a very favorable pattern to disrupt the Polar Vortex.
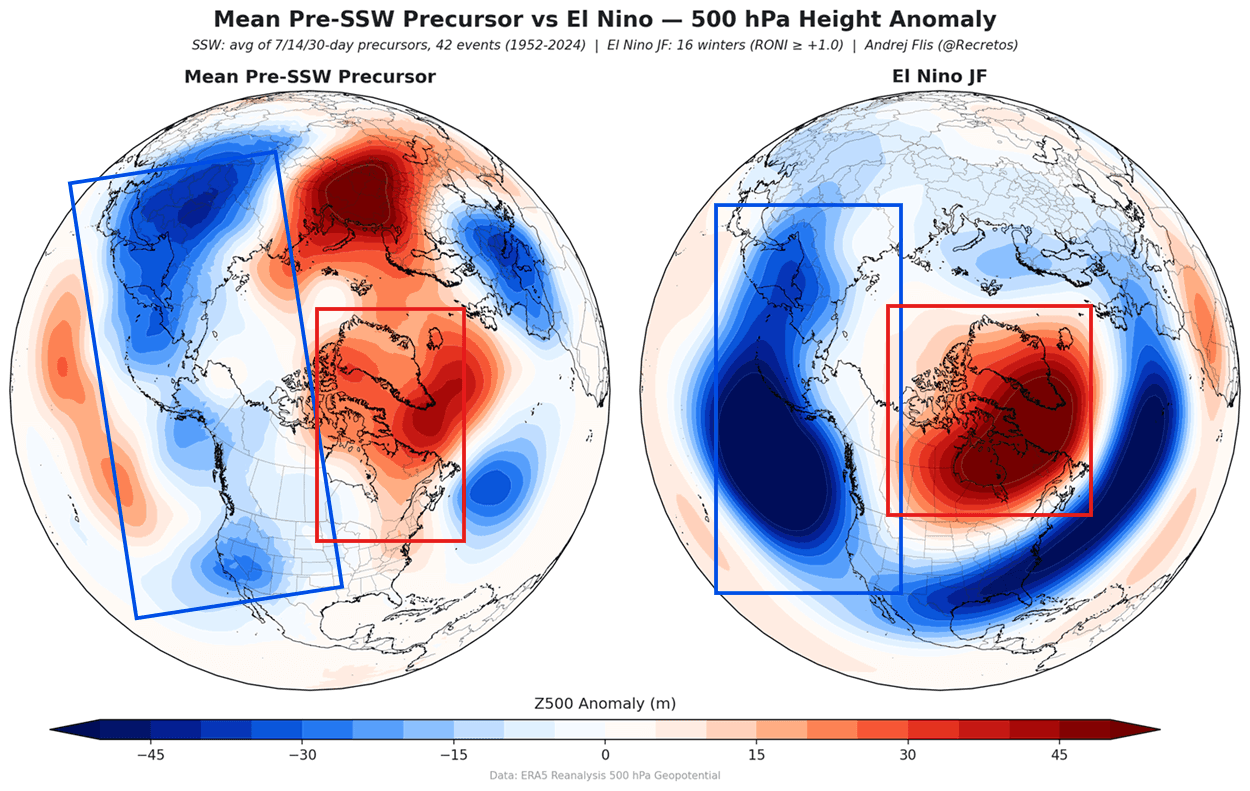
We see a low-pressure anomaly in the North Pacific and Aleutians, and a high-pressure zone over Greenland and north Canada. This planetary pressure wave setup can send a great amount of energy up into the stratosphere, disrupting the Polar Vortex above.
Below is a 2-panel image for the stratospheric 10mb level (30km/18.5miles height). On the left, it shows the mid-winter stratospheric pressure anomaly in a Super El Niño event. You can see a displaced Polar Vortex core, with a stratospheric high-pressure anomaly, driven by the planetary wave energy from below.
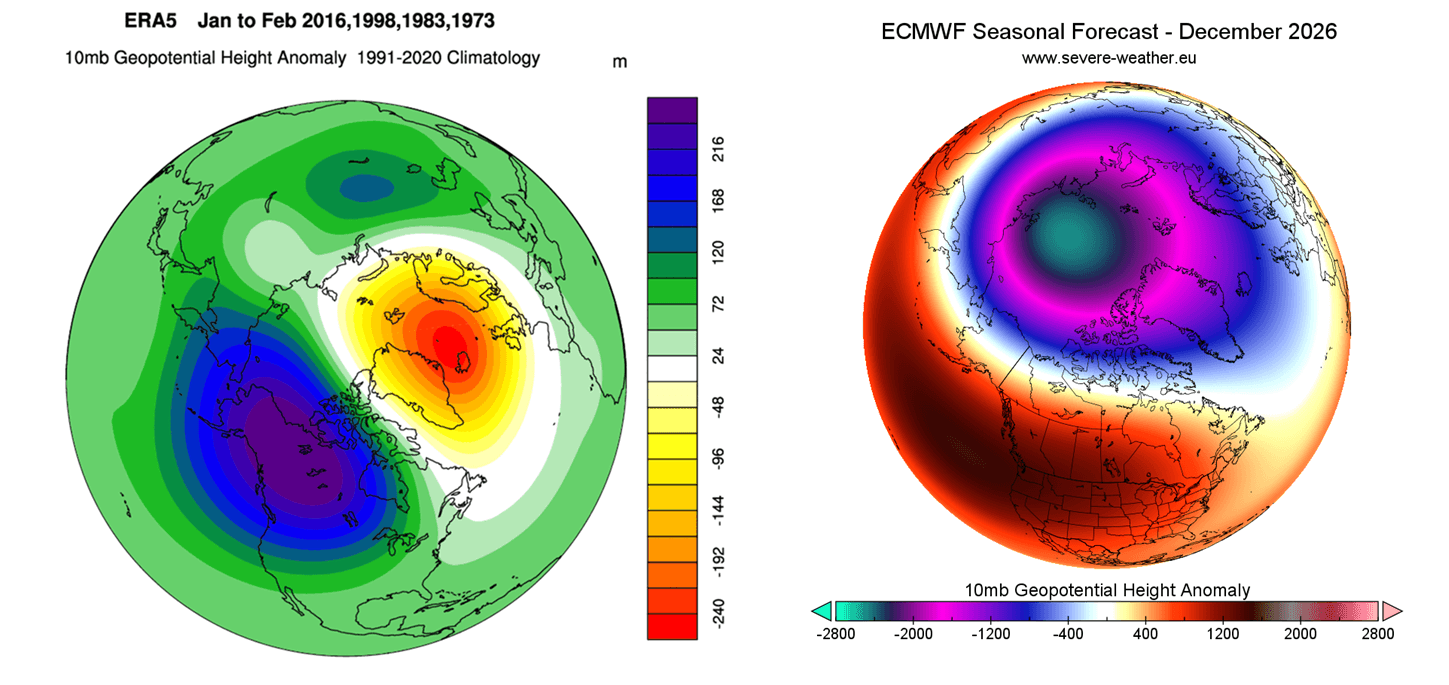
On the right, you can see the actual December 2026 forecast, which shows a similar pattern, just rotated. It shows low displacement for the Polar Vortex core, but a building stratospheric high-pressure anomaly around the Polar Vortex core.
The raw seasonal data allows us to look at the trends into January 2027. And below we have the Polar Vortex forecast, or rather its wind, which is the main way we estimate its strength. The latest seasonal forecast data was released just 2 days ago, and it shows a surprising Polar Vortex disruption trend for January.
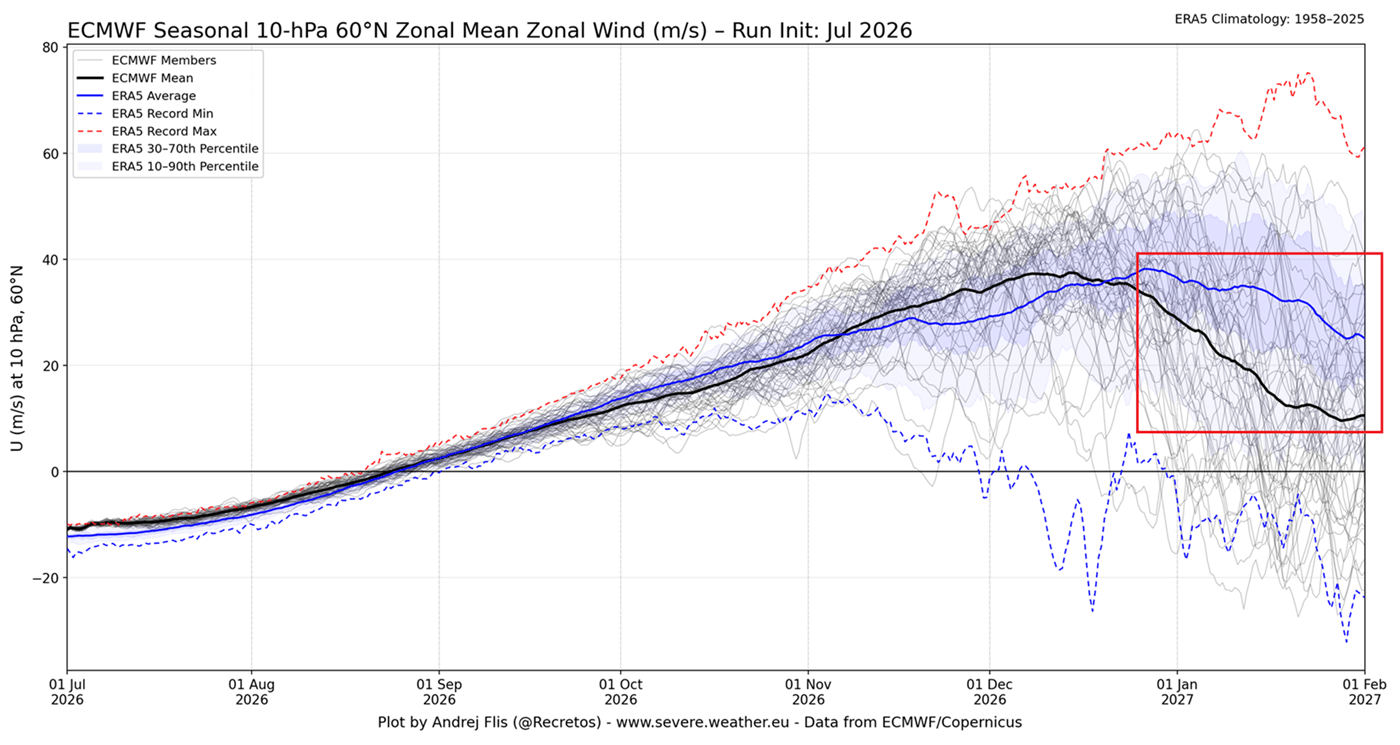
The forecast line (black) goes far below the long-term average line (blue), indicating a power drop and a strong disruption trend for the Polar Vortex in January/February. As shown already, a January Polar Vortex Disruption occurs often during a Super El Niño event, exactly what the latest forecast suggests.
This is just the first factor that currently shows a strong signal for a dynamic winter circulation due to the potential Polar Vortex disruption. For the next one, we have to go up into the atmosphere and across the whole globe.
The Planetary Stratospheric Wind Pattern Above the Tropics
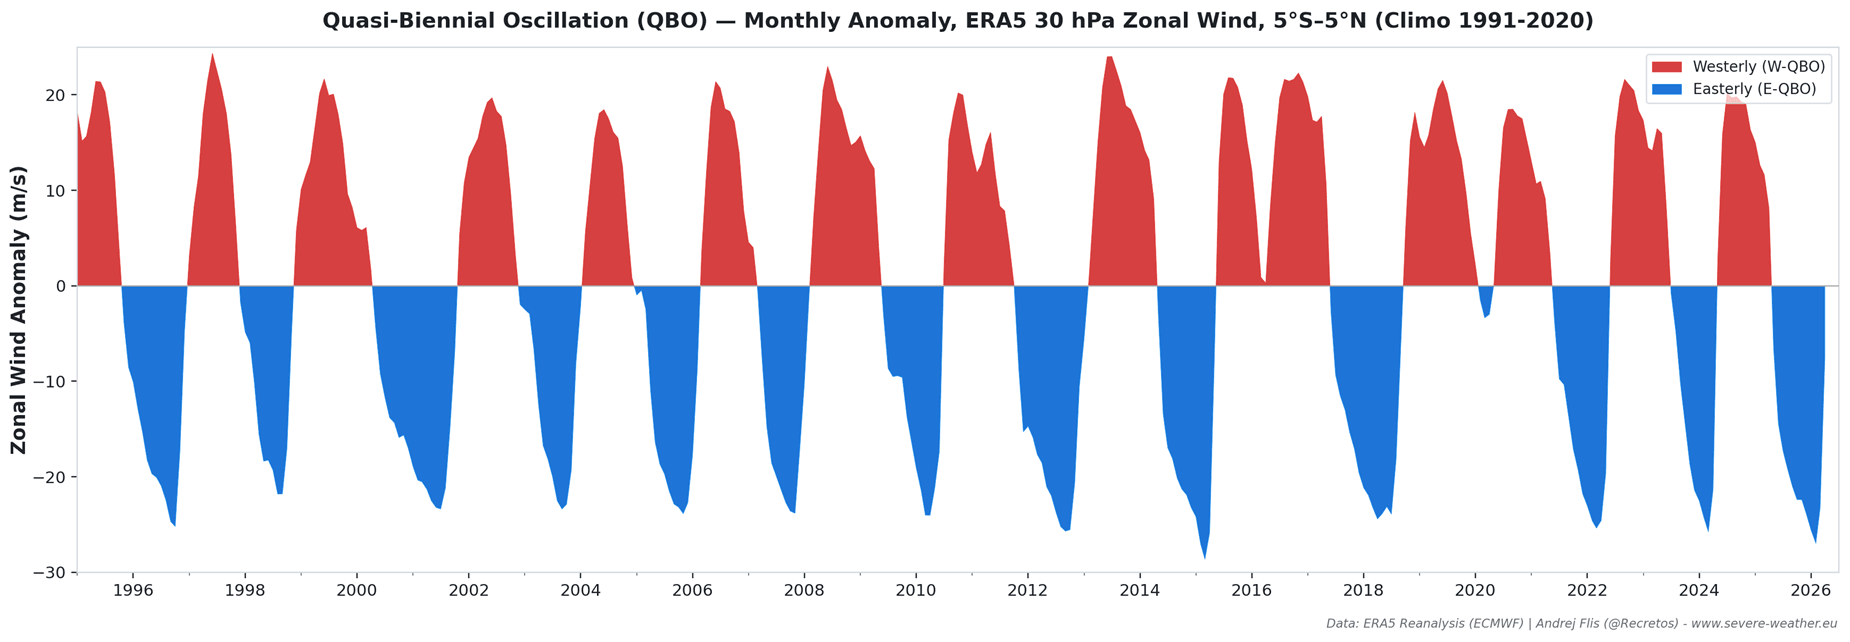
Just like the ENSO region, there is also a part of the atmosphere that alternates between a positive and a negative phase. But instead of temperatures, we are observing wind direction. This is called the Quasi-Biennial Oscillation, or simply QBO.
The QBO is a regular variation of the winds high above, in the tropical Stratosphere, shifting between easterly and westerly winds. Strong winds in the stratosphere travel in a belt around the planet at the equator. And every 17 months or so, these winds completely change direction.
Below is a graph we made showing zonal wind anomalies over the tropics for the past 30 years at around 24km (15mi) altitude. It nicely shows just how regularly this wind shift really is from one phase to another, giving the QBO its nickname as the heartbeat of the atmosphere.
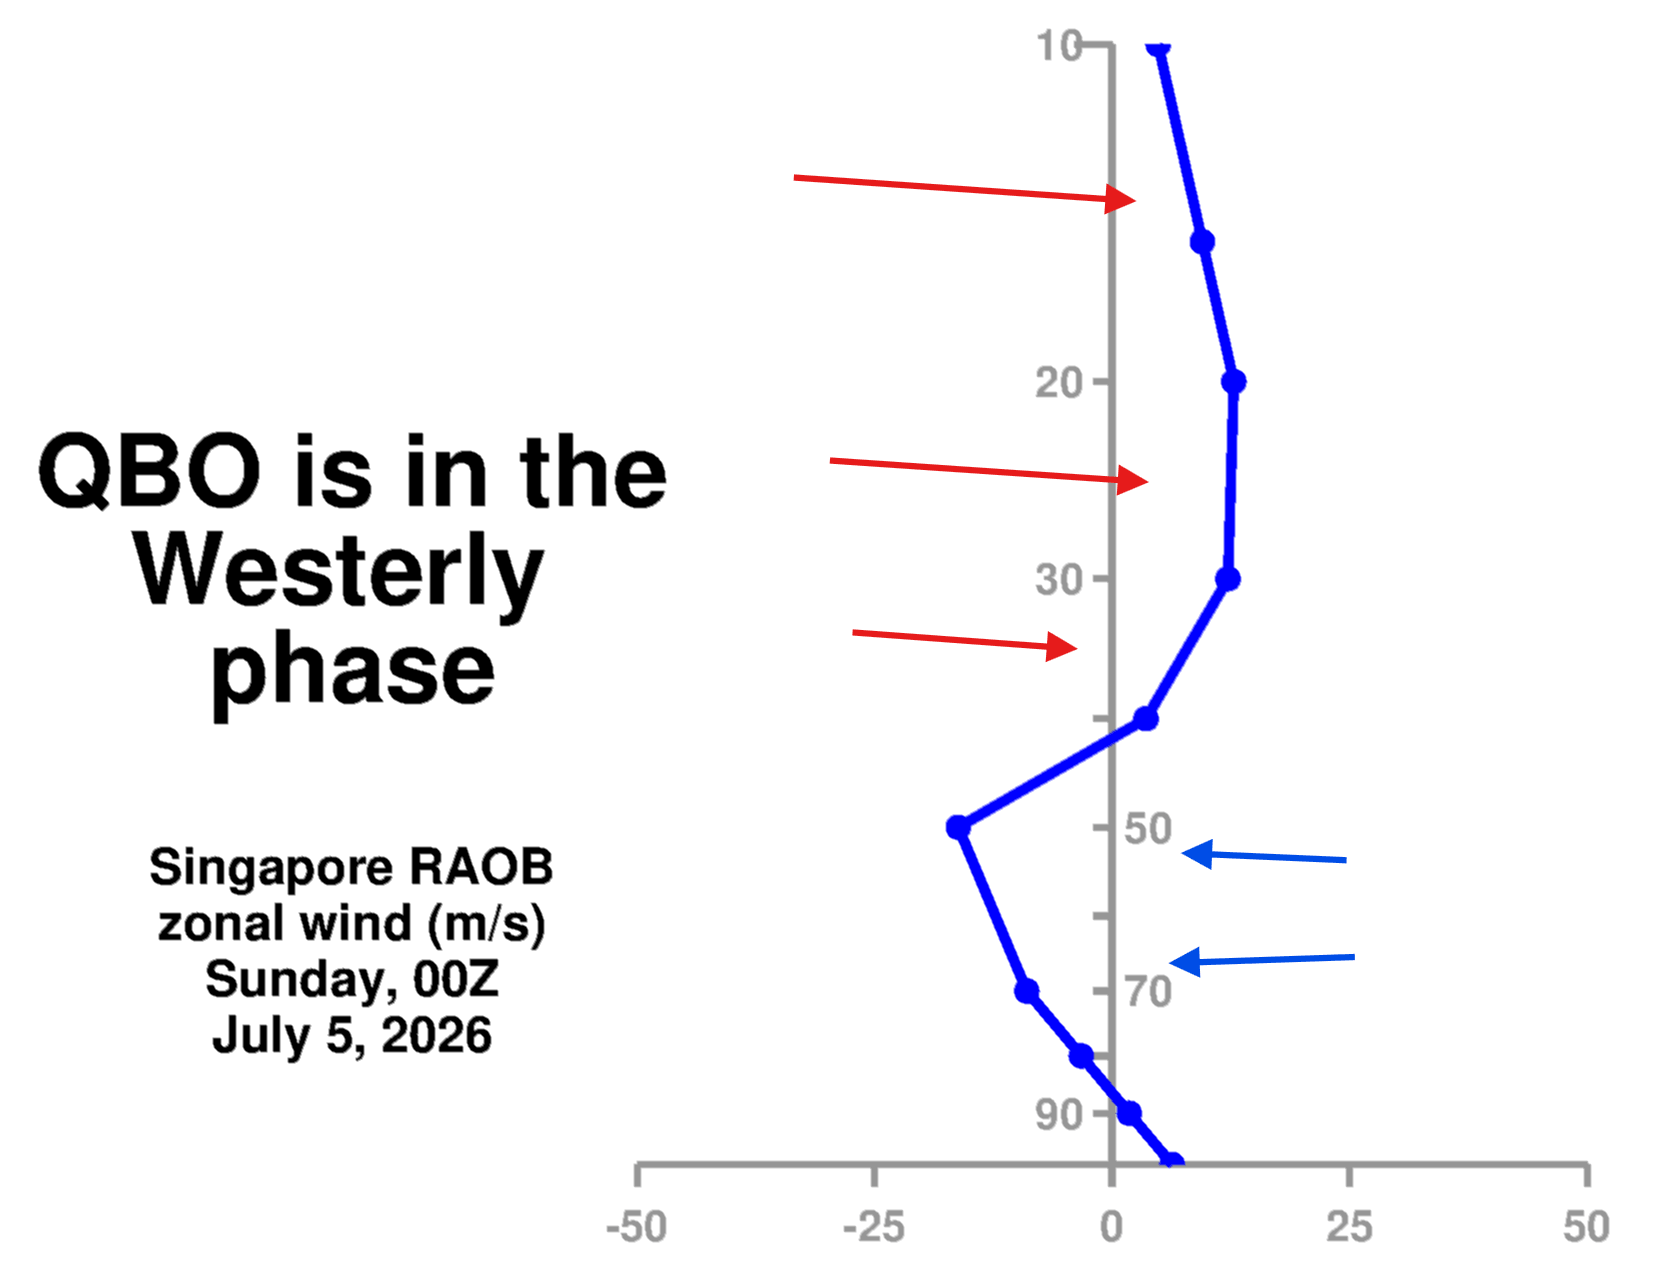
A daily NASA radiosonde analysis also shows the wind direction in the stratosphere above the tropics. It reveals the westerly winds around the 10-40mb level (22-30km or 14-19miles high), confirming the west QBO phase is currently active. It is in the early stages and will continue to strengthen and stabilize around the 30mb level (24km/15 miles) as it descends towards winter.
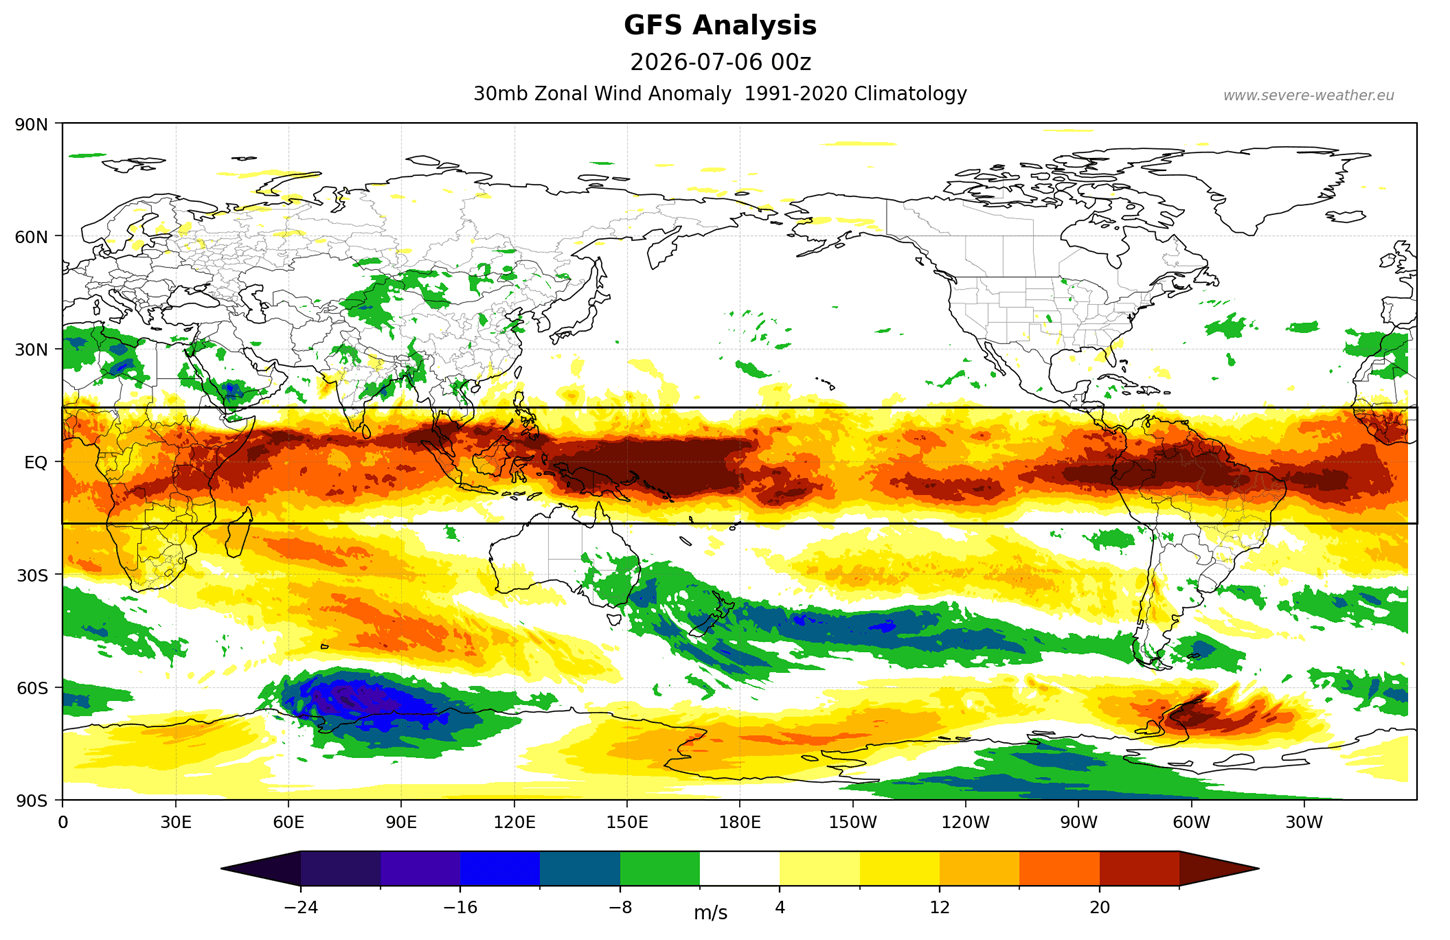
Looking at the latest GFS analysis for zonal winds at the 30mb level (24km/15 miles), we can see the westerly wind anomaly over the equator. This confirms the active west QBO that is expected to evolve further and descend lower as we head into fall and winter.
There are several reasons why QBO is important for Winter weather. One very important aspect is, of course, the Polar Vortex, which is why we even talk about the QBO in this article. The image below, from a stratospheric study, shows the connection between the West QBO and the Polar Vortex in the December-January winter period.
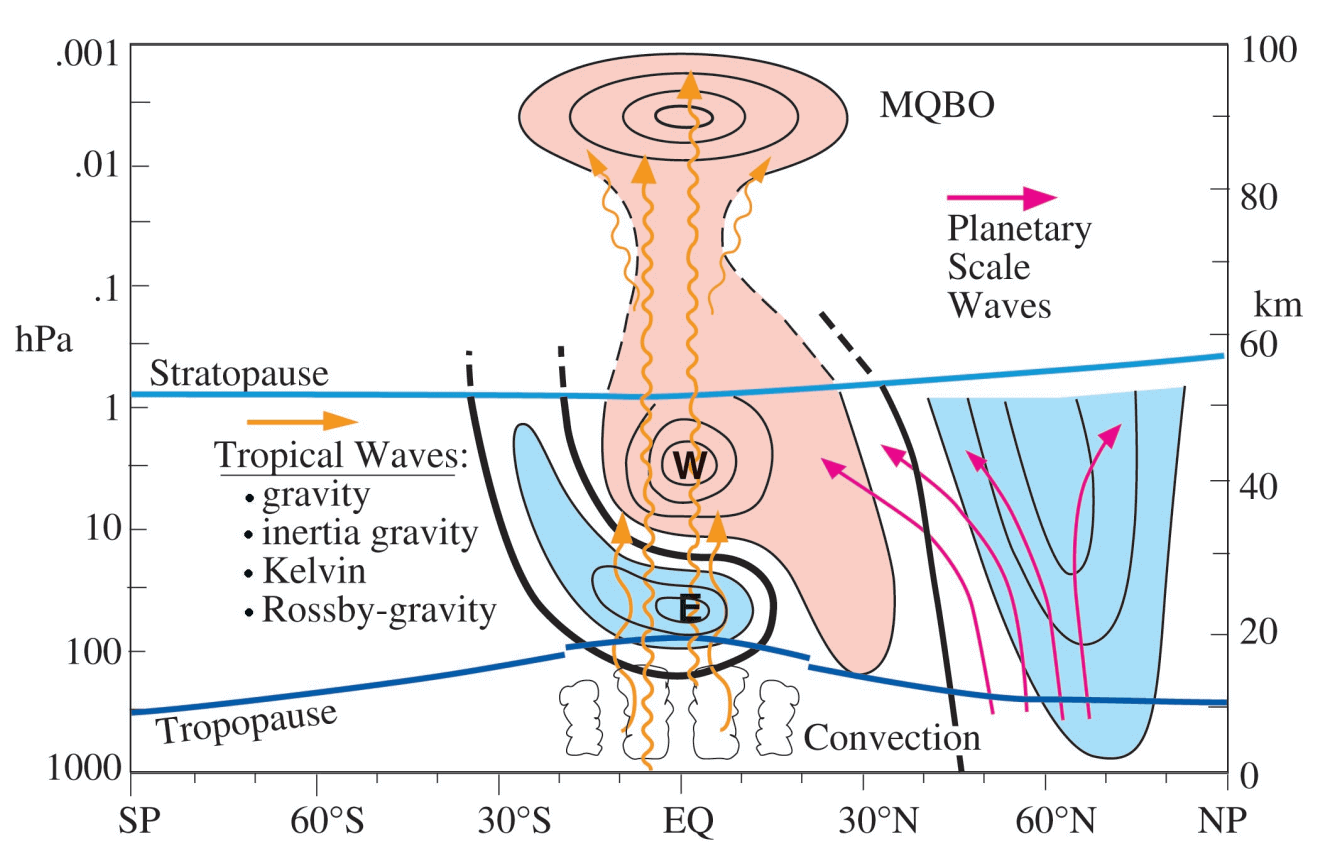
A west QBO usually helps to keep the Polar Vortex stronger and more stable, deflecting the planetary wave energy from the pole. But during a strong El Niño, that stabilizing effect can become weaker, because El Niño can really amplify the atmospheric wave energy from the Pacific into the polar stratosphere.
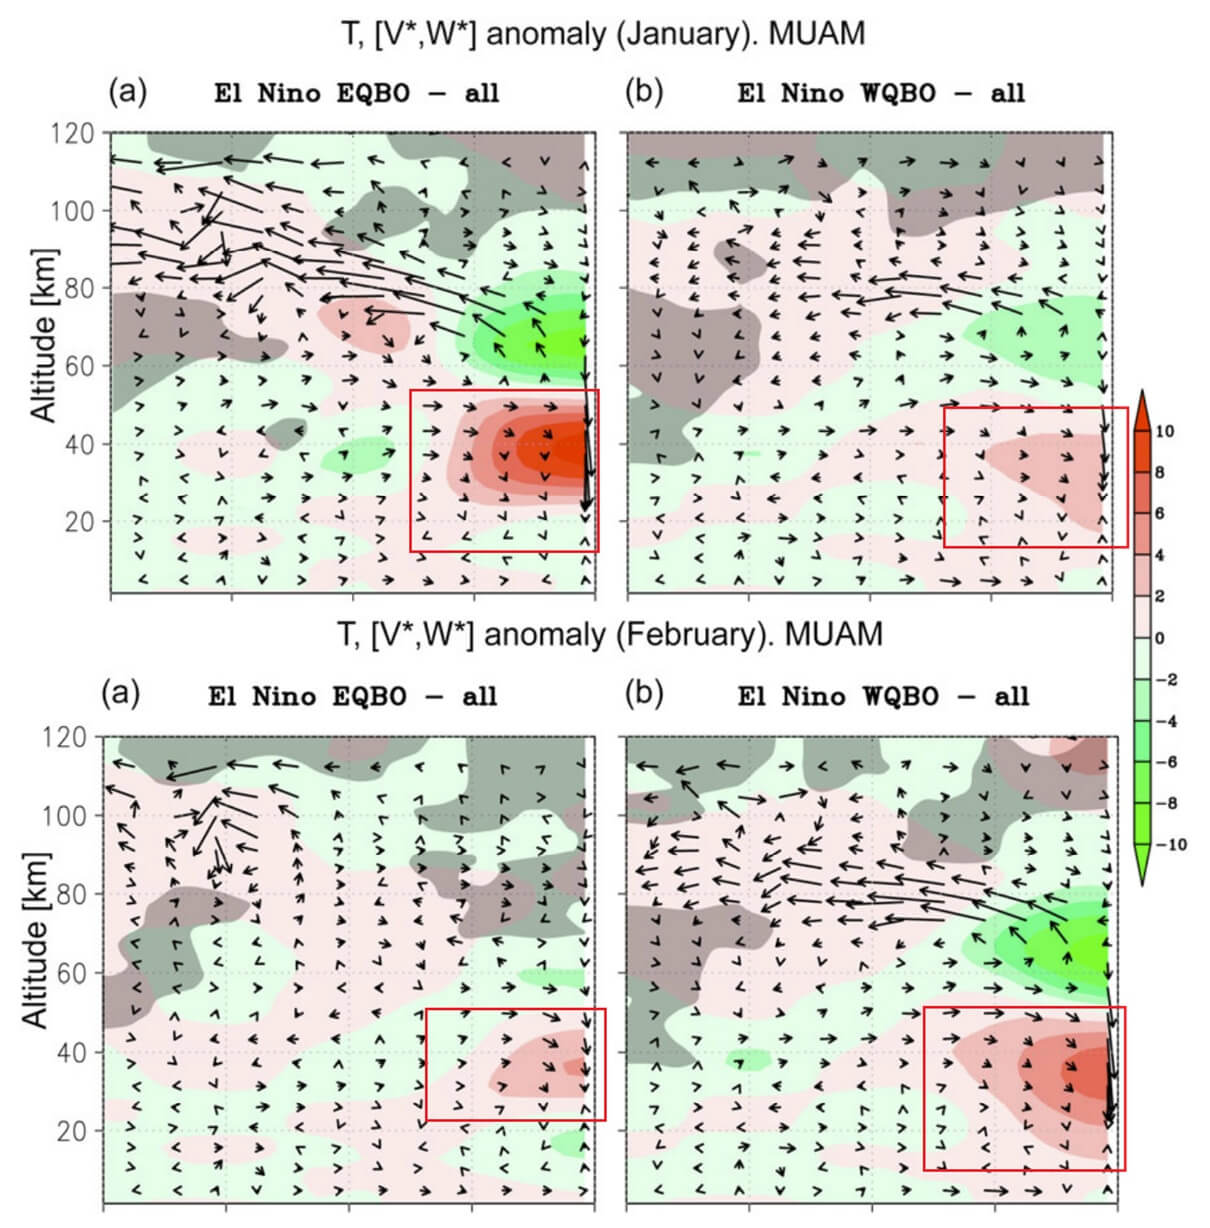
The actual merged impact of El Niño and QBO can be seen below, in an image from a new Polar Vortex study. It shows that El Niño can substantially weaken the Polar Vortex, but the timing depends on the QBO: the easterly phase is more favorable in January, while the westerly phase becomes more favorable later in February.
All the studies used to in the research process for this article will be linked at the bottom.
So while the risk is not a guaranteed Polar Vortex collapse or SSW, it definitely shows some form of Polar disruption to occur, clearly visible also in the latest long-range forecast higher up for Winter 2026/2027.
Overall, a wQBO + El Niño results in a more complicated winter setup. The Polar Vortex may start the season stronger, but the El Niño influence can still drive a weakening or disruption in mid and late winter. Especially if other background signals also indicate greater pressure on the Polar Vortex, such as the low sea ice anomaly over the North Pole.
Arctic Sea Ice: A High-Latitude Signal for a Weaker Polar Vortex
The third impact factor for 2026/2027 is the sea-ice extent over the polar regions. The northern ice cap plays an important role in pressure patterns, energy balance, planetary (Rossby) waves, and others. This makes it an obvious candidate to directly relate to the winter Polar Vortex just above it.
In a recent study, it was uncovered that two regions play an important role in the winter strength of the Polar Vortex. The Barents/Kara Sea (BKS) and the Sea of Okhotsk (SOK). Below is an image from that study that shows the impact each of these regions has on the winter Polar Vortex with heavy ice loss.
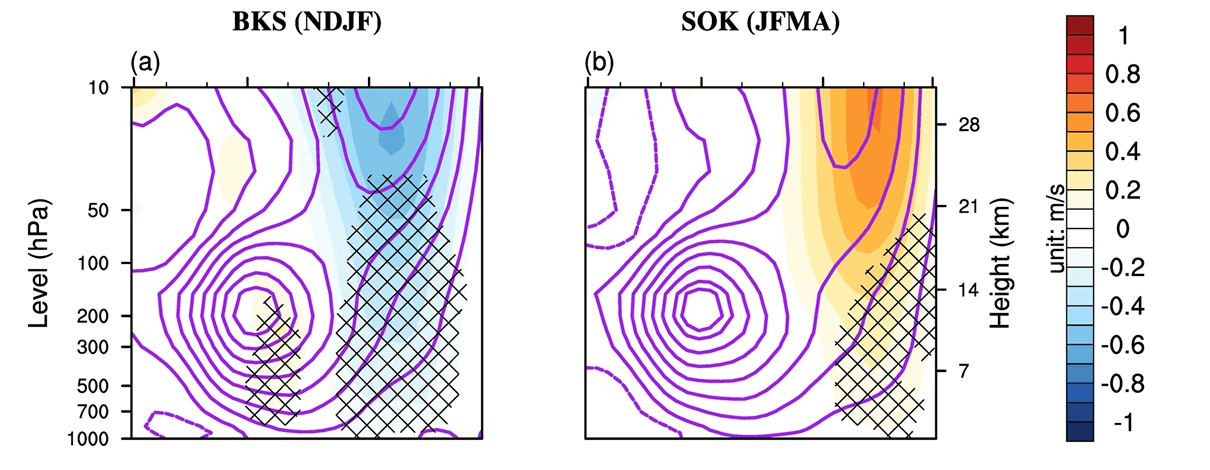
You can see an opposite relation, where the ice loss in the Barents/Kara region creates a weaker Polar Vortex, while ice loss in the Okhotsk causes a stronger Polar Vortex. This is because each region has a different impact on the planetary (Rossby) waves and their energy release into the stratosphere.
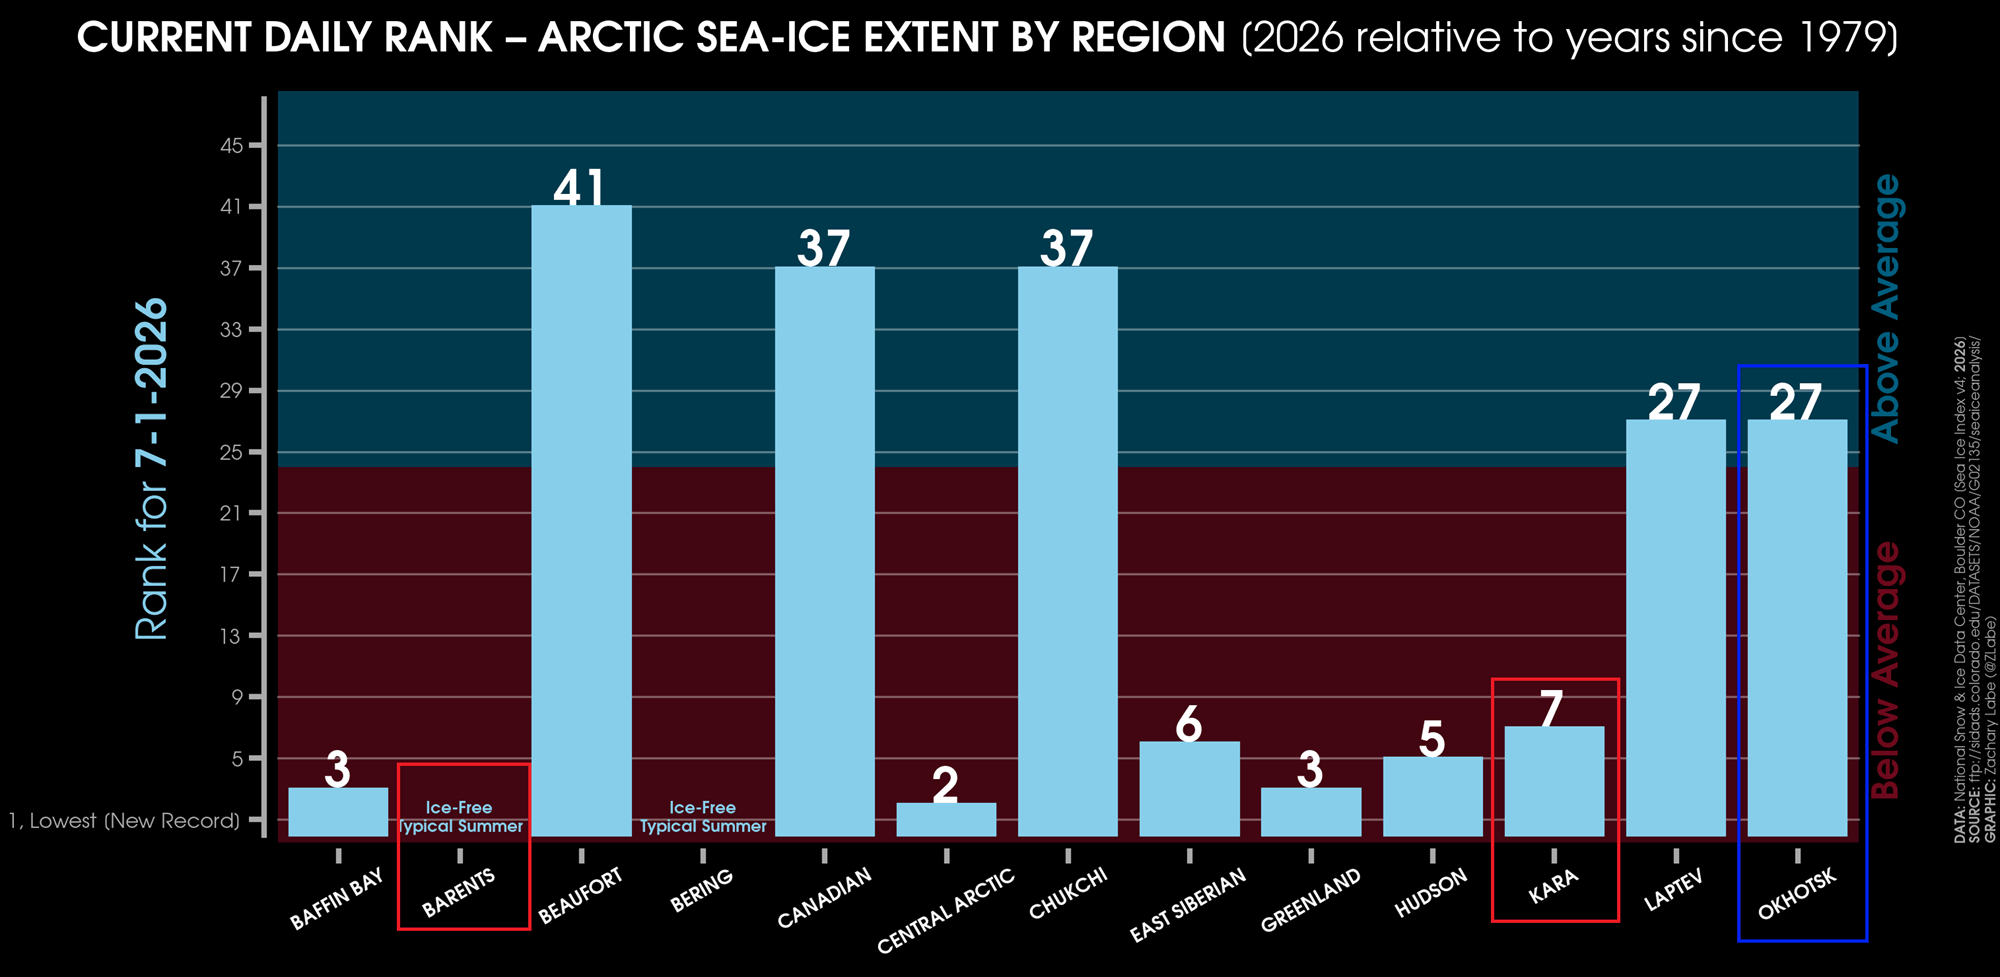
So, ideally, for a weaker Polar Vortex and potentially a colder winter, you would want to see less ice in the Barents/Kara region and more ice in the Okhotsk region. We can look at a special image to see the latest extent in each region.
As you can see below, the latest daily rank shows ice-free Barents and Kara regions, and above-normal sea-ice extent in the Okhotsk region. We are not yet in the main melt period, but this is currently a textbook situation for a weaker Polar Vortex to emerge in Winter 2026/2027. Image by Dr. Zachary Labe.
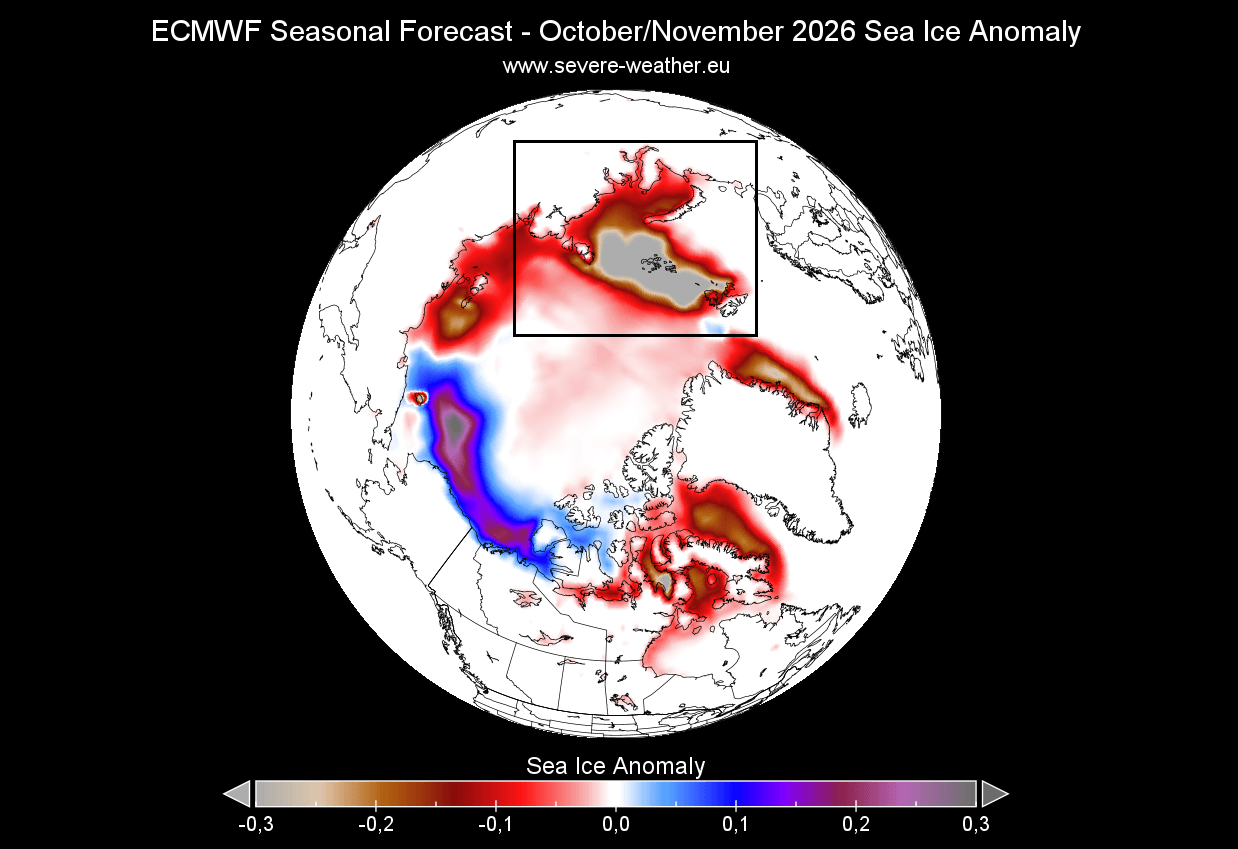
If we look at the latest ECMWF forecast of the Fall sea ice anomaly, we can see a strong melt season over most of the Arctic region. This is especially significant in the outer regions, as expected, with our main area of interest (Barents-Kara) showing the strongest melt anomalies and sea-ice deficit.
We also made an analysis of the low ice extent connection with the winter Polar Vortex. Below, you can nicely see that in low ice years, the Polar Vortex is weaker in the stratosphere, with higher pressure and temperature. This aligns with all the data above and adds another important factor to the trinity of global factors, favoring a potentially disrupted (colder) Winter 2026/2027 pattern.
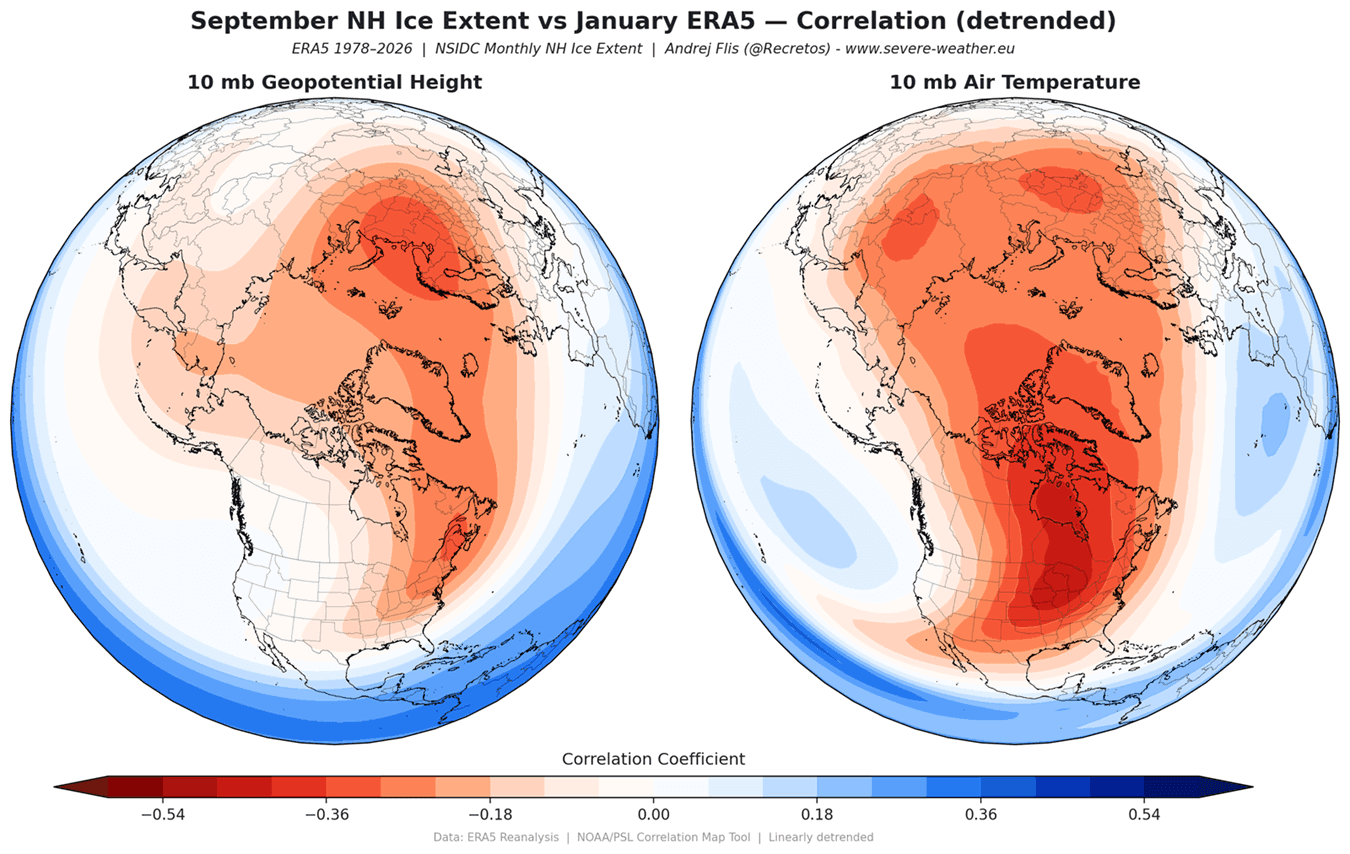
The temperatures in the stratosphere tend to be higher in a weak Polar Vortex. That can often result in a major Stratospheric Warming event (SSW), which can collapse the Polar Vortex, and create a blocking pattern for the United States and Europe, bringing cold air and snowfall.
All the information so far, be it analysis or forecast, points to an above-normal chance for a disruption or even a collapse of the Polar Vortex, which can fully unlock the cold winter potential.
Polar Vortex Collapse: What It Means for Your Winter Weather
A proper Polar Vortex collapse event (Sudden Stratospheric Warming) basically means a strong temperature and pressure rise in the Stratosphere and a resulting disruption of the Polar Vortex circulation.
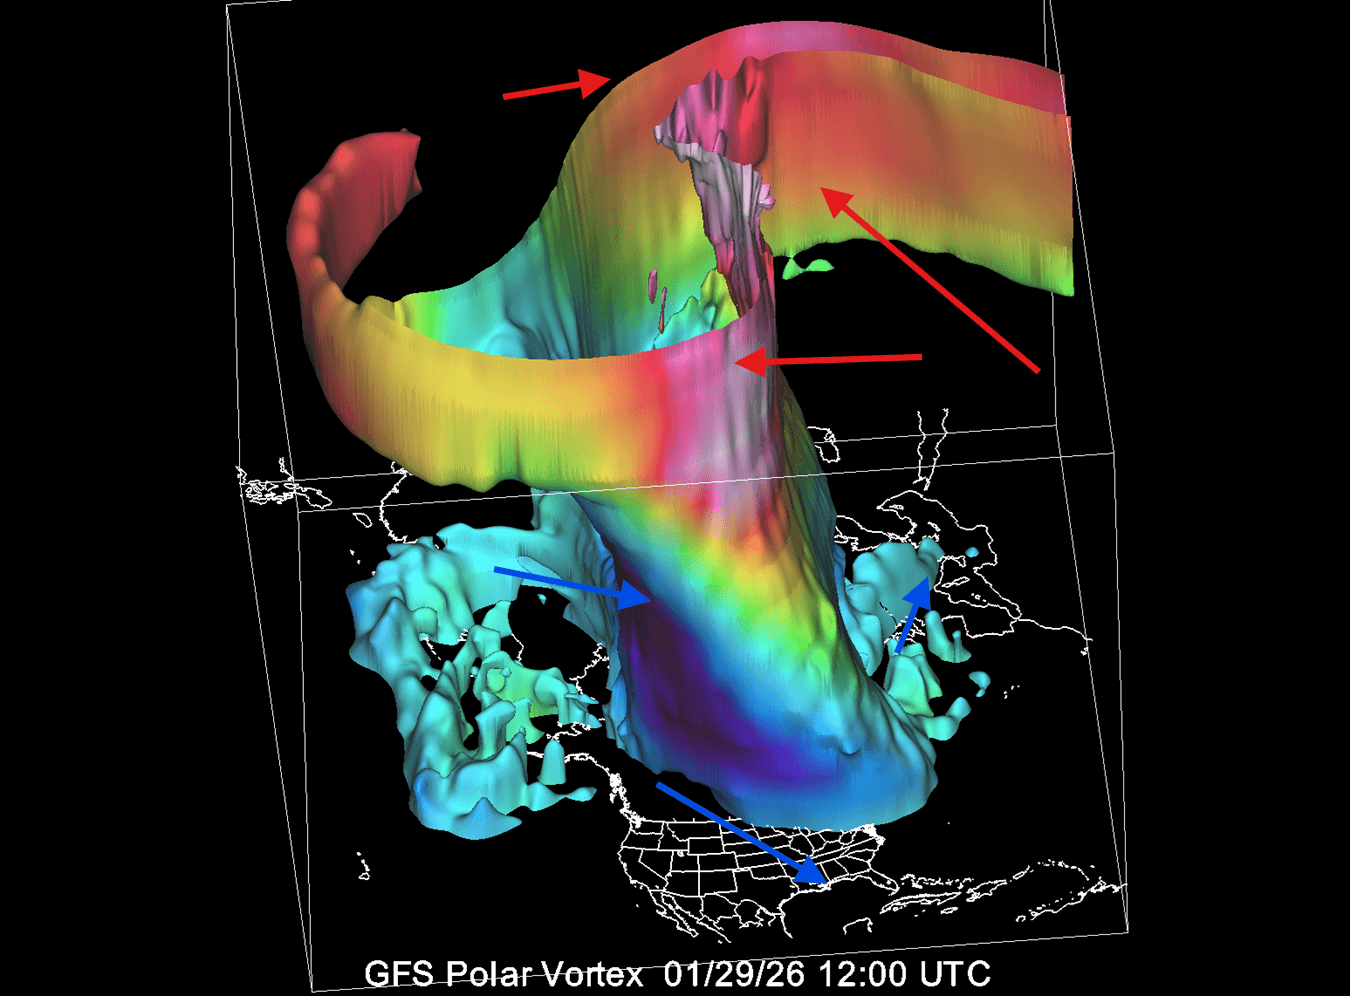
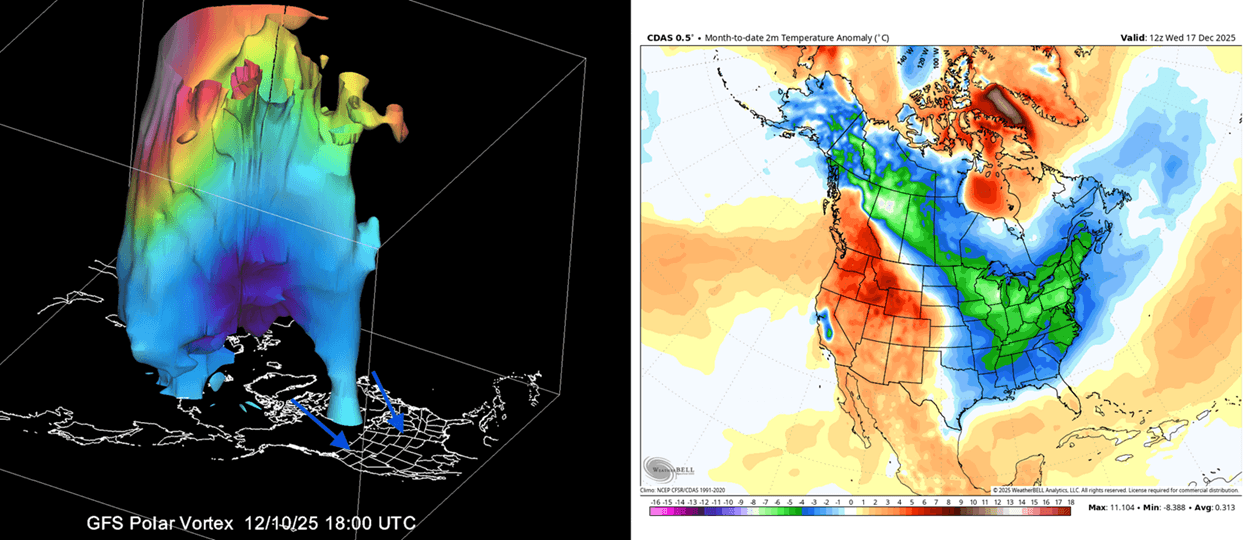
One such major event was recorded at the end of January this year. You can see this disruption in the 3D analysis below: high-pressure areas with warming have compressed the Polar Vortex, elongating its structure. This caused the Polar Vortex to push its lower core into North America, allowing a strong northerly flow with cold air to spill into the eastern United States, Canada, and parts of Europe.
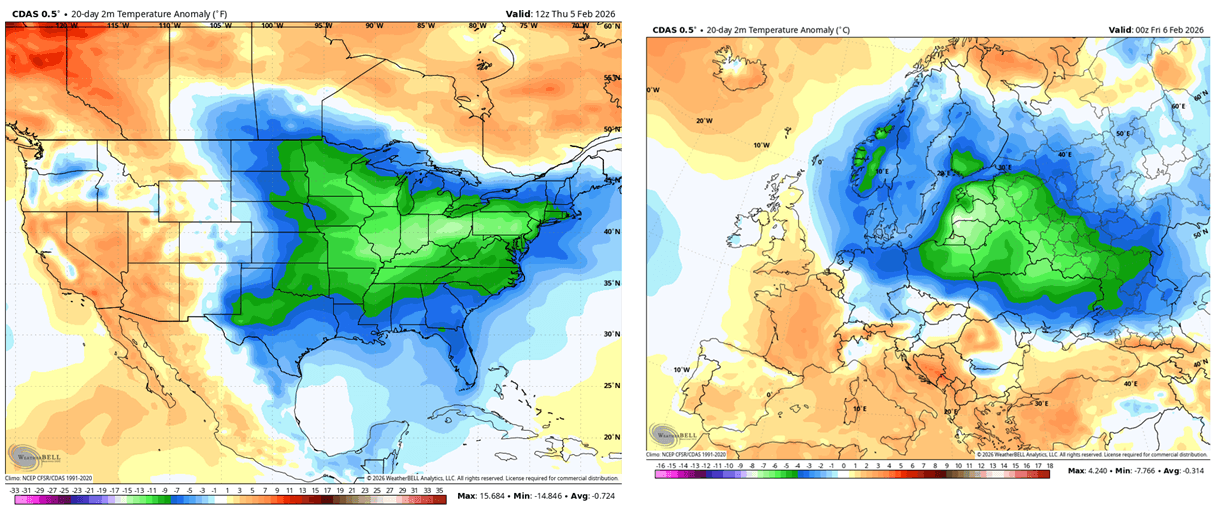
The resulting temperature anomalies following this disruption can be seen below, centered around late January and early February 2026. You can see the cold air outbreak brought down into the whole central and eastern half of the United States, and far southern Canada. Also over the north-central and northern parts of Europe.
But this was a disruption event, not a full collapse of the Polar Vortex. So, what does a full collapse event mean for our everyday weather at the surface? First, we need to understand that it can take some time for the effects from the stratosphere to reach the lower levels. That is why we usually look at the 0-30 day periods after such an event to identify the resulting weather changes.
First, we can look at the surface pressure changes following a Polar Vortex collapse event, using the NOAA CSL research images. The stratospheric warming event tends to create a high-pressure area over the polar regions as it moves into the lower levels of the atmosphere, breaking down the “Polar walls” over the North Pole.
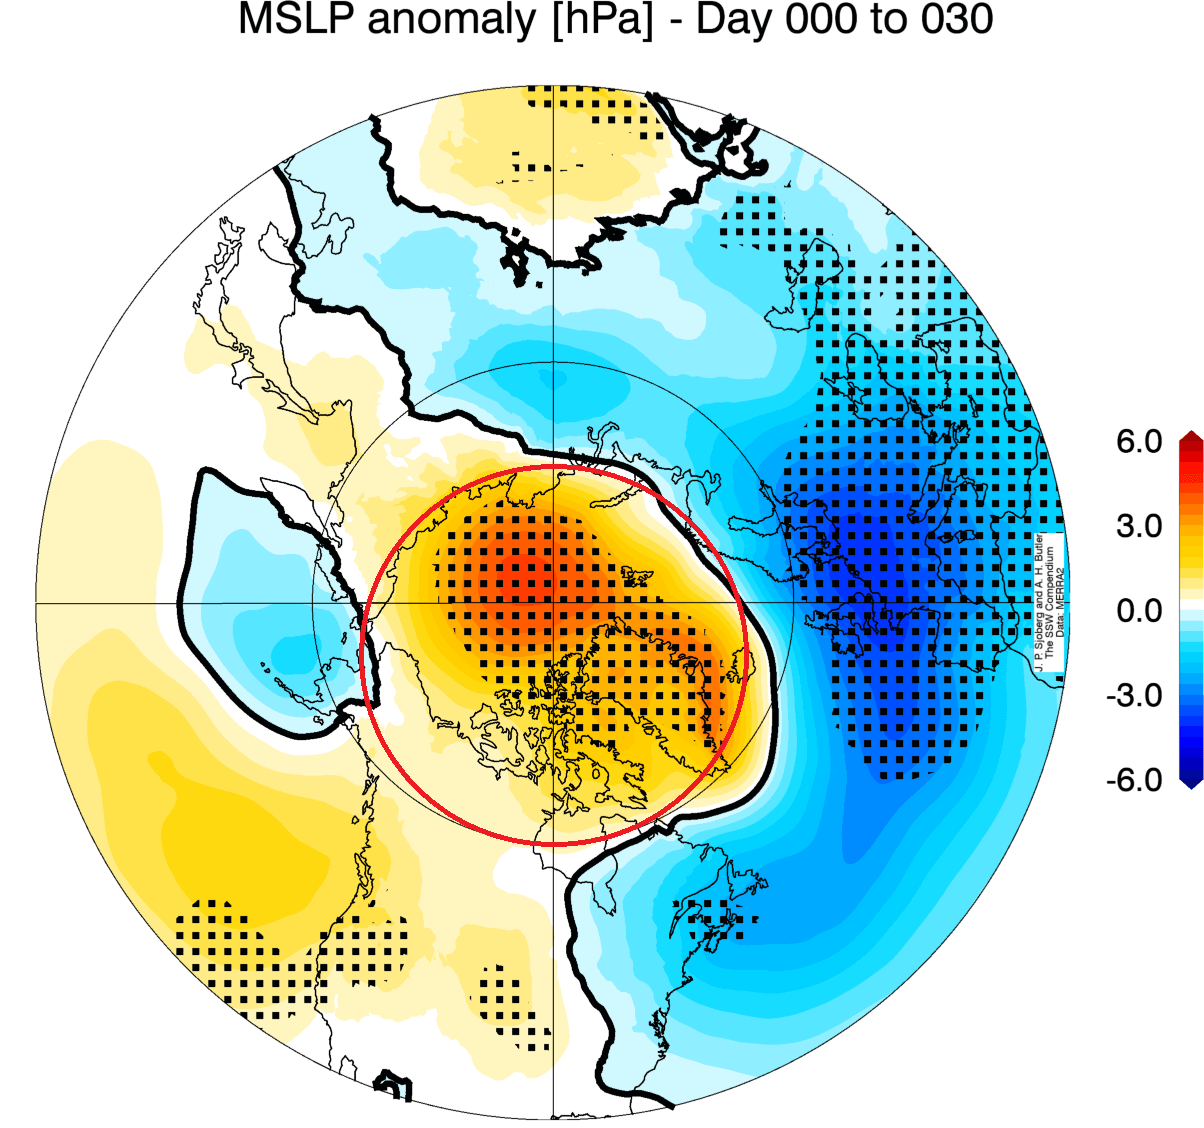
This means that as the pressure rises over the pole, the jet stream gets disrupted. That unlocks the cold air out of the pole and releases it down towards the south.
Below is the average temperature of 0-30 days after a Polar Vortex collapse event. This shows that most of the United States and northern and central parts of Europe are typically colder than normal after an SSW event. This is actually a very similar pattern to the late January event we showed above.
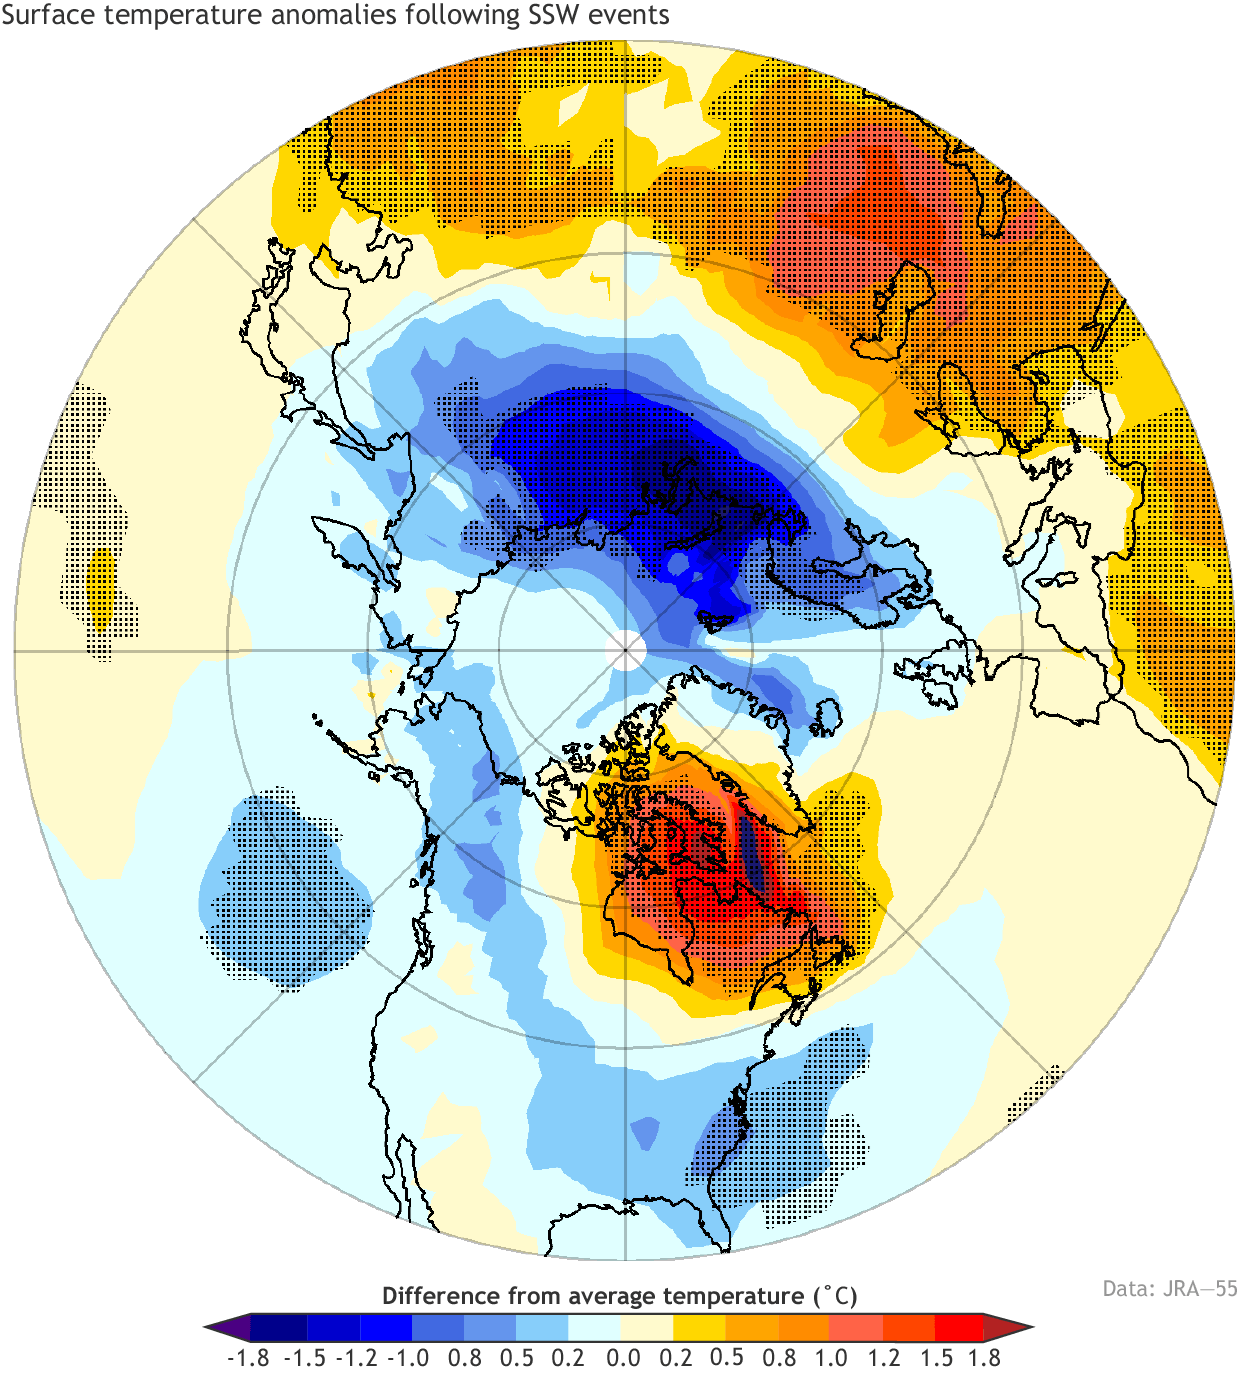
You can actually see almost exactly the same cold outbreak pattern from last December, which featured a Polar Vortex split in the lower levels. That brought one Polar Vortex core into North America, establishing the “Polar Express” pattern, the same as seen in the image above.
Looking at the snowfall after SSW events, we can see above-average snowfall over much of the eastern United States, the Midwest, southeastern Canada, and Europe. This is because of the pressure changes that follow a stratospheric warming event, allowing colder polar air to spill out towards the south and into these regions.
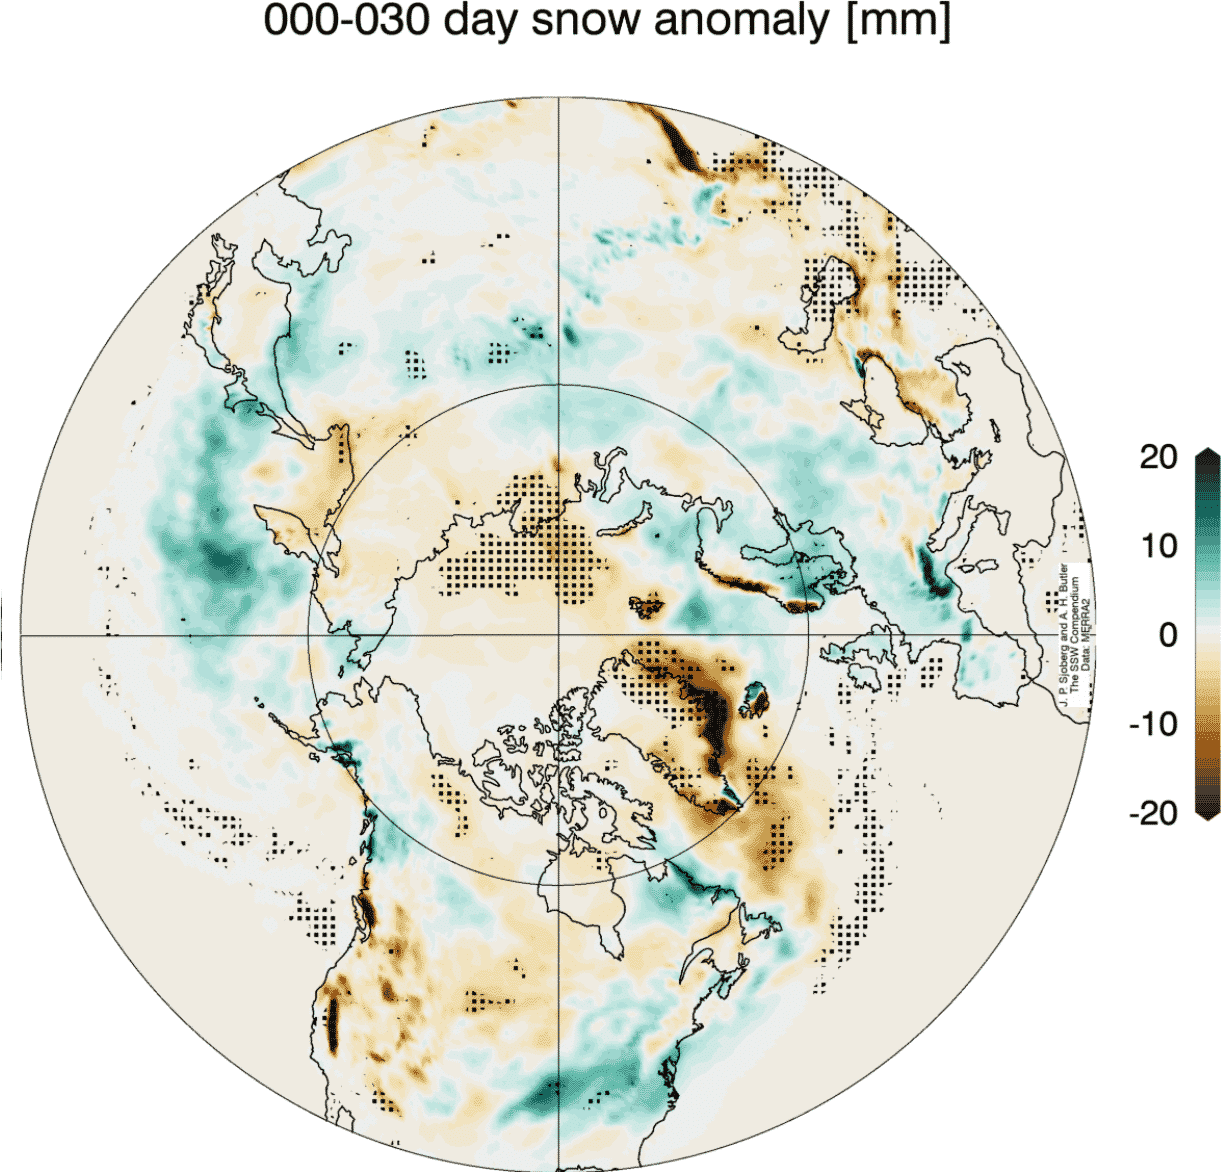
As you can see, a disrupted Polar Vortex can significantly change Winter weather across the United States, Canada, and Europe. For this reason, we closely monitor the weather patterns and all activity surrounding the Polar Vortex, starting early, as soon as the first signals are detected.
With signs emerging for a weaker Polar Vortex in 2026/2027, the Super El Niño can cause a strong enough disruption to fully collapse it. That can strongly increase the chance for more cold winter days and snowfall over the United States, Canada, and parts of Europe.
Studies Used in this Article
- Stratospheric Dynamics: Influence of Regional Sea Ice Loss on the Arctic Stratospheric Polar Vortex – Xu et al. (2024).
- QBO Dynamics: The quasi‐biennial oscillation – Baldwin et al. (2001).
- Modeling and Teleconnections: Analyzing Stratospheric Polar Vortex Strength and Persistence Under Different QBO and ENSO Phases – Ermakova et al. (2025).
We will keep you updated on the global weather pattern development, so bookmark our page. Also, if you have seen this article in the Google App (Discover) feed, click the like (♥) or the star button there to see more of our forecasts and our latest articles on weather and nature in general.
You can also read our full deep-dive on how the Super El Niño is merging with record-low Arctic sea ice.