Winter 2022/2023 snowfall predictions show a global weather signal from the La Nina, now starting to cool down further, getting ready for Winter. From Canada to the United States and across the Atlantic to Europe, we will look at the new Full snowfall forecasts and trends, with February data now also available.
First, we will look at the one main global weather driver in the upcoming weather seasons, La Nina. What does the latest ocean analysis data show, and what can we expect based on its past influence?
Then, looking at the global long-range weather forecasting systems and historical data analysis, you will see the snowfall predictions for the upcoming Winter and how they are altered by these large-scale influences.

GLOBAL SEASONAL WEATHER INFLUENCE
ENSO is a region of the equatorial Pacific Ocean that changes between warm and cold phases. Typically there is a phase change around every 1-3 years.
The cold phase is called La Nina, and the warm phase is called El Nino. We are currently in a La Nina phase, entering its 3rd year, which is a rare occurrence.
ENSO phases significantly influence tropical rainfall, pressure patterns, and the complex exchange between the ocean and the atmosphere. The image below shows the circulation pattern of a cold phase, which we are currently in.
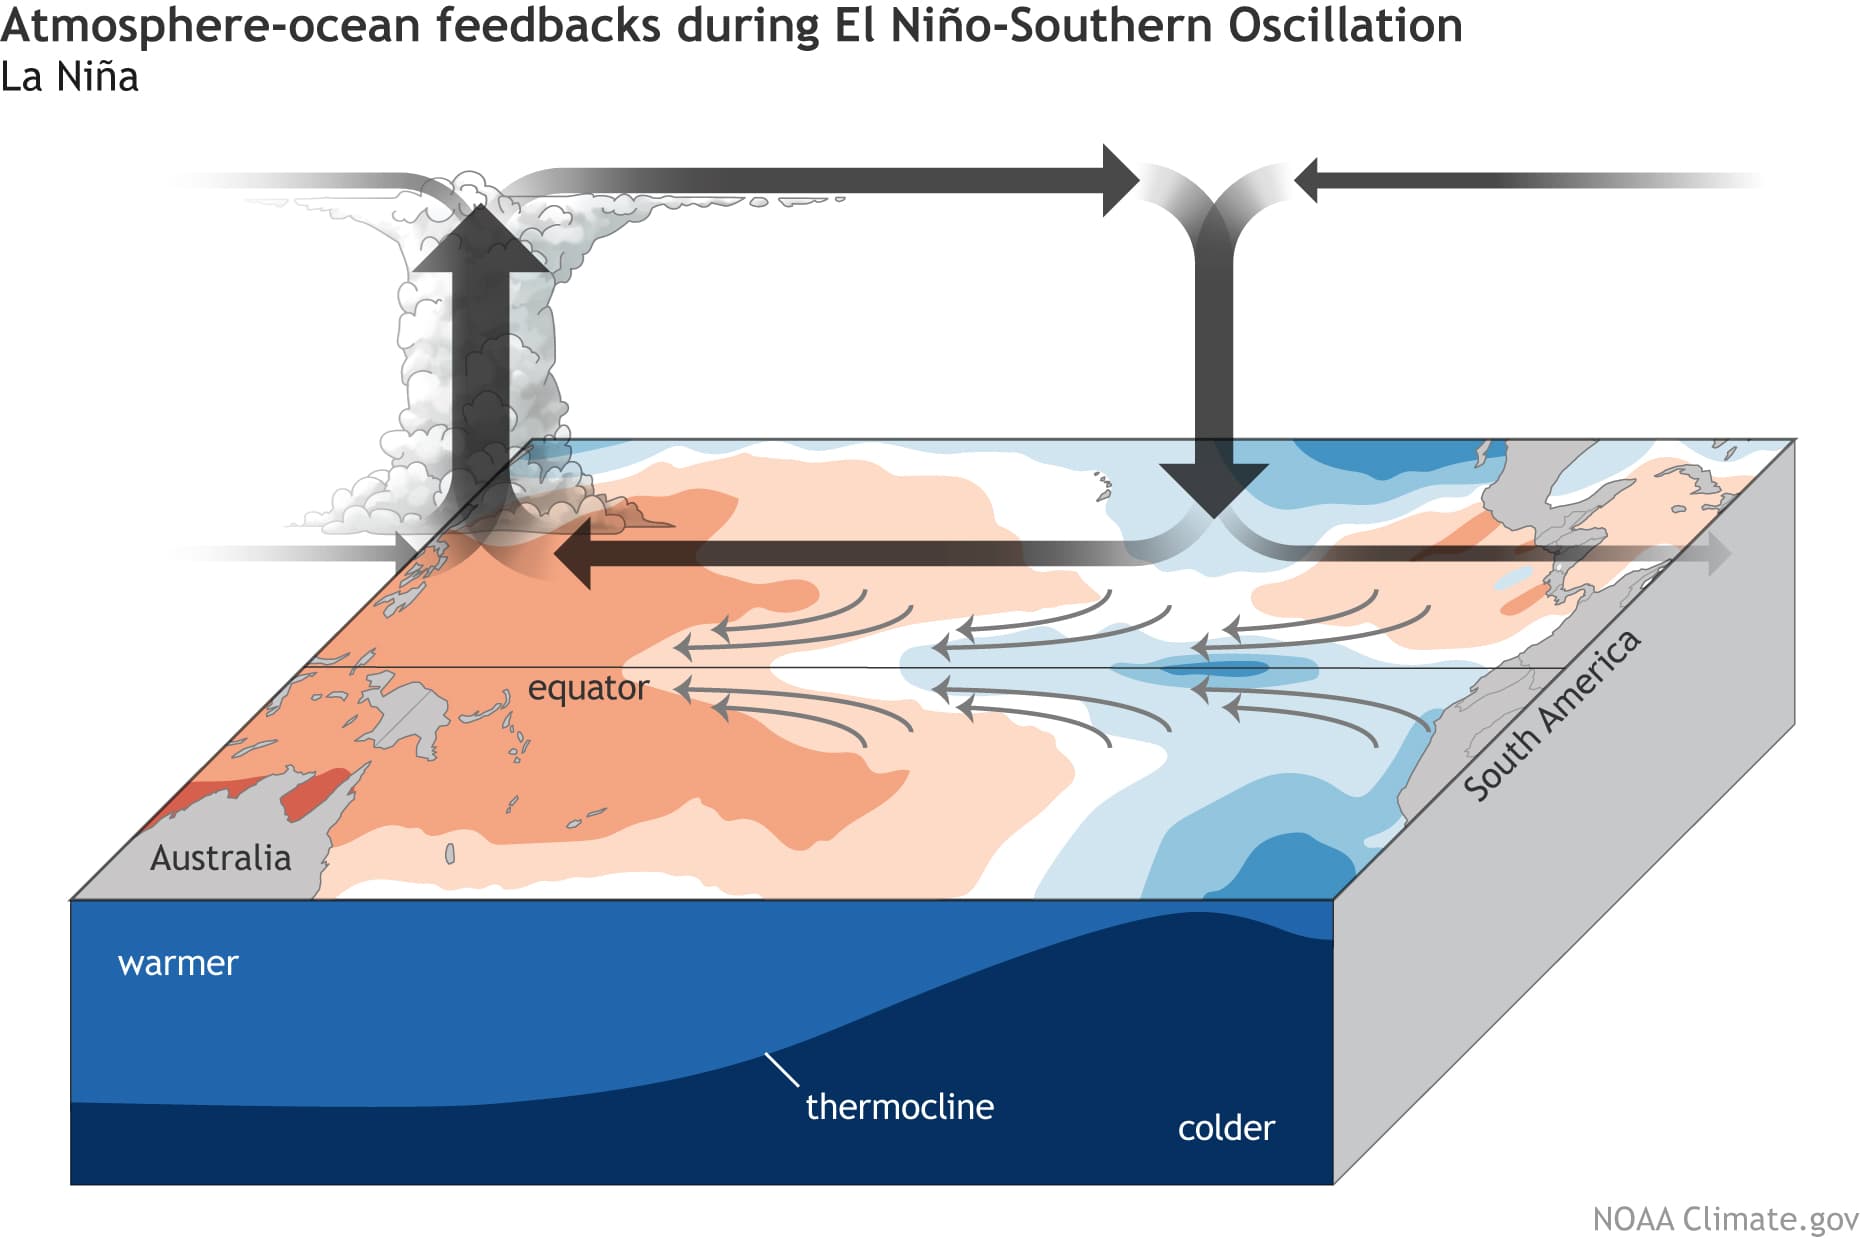
By doing this, the ENSO significantly impacts tropical rainfall and pressure patterns, altering the atmosphere-ocean feedback system. This feedback system spreads the ENSO influence globally, especially the Winter temperature and snowfall patterns.
Below we have the latest surface analysis of the tropical Pacific Ocean. Cold ocean anomalies extend across most of the tropical Pacific. This is the currently active La Nina, still strengthening at the moment.
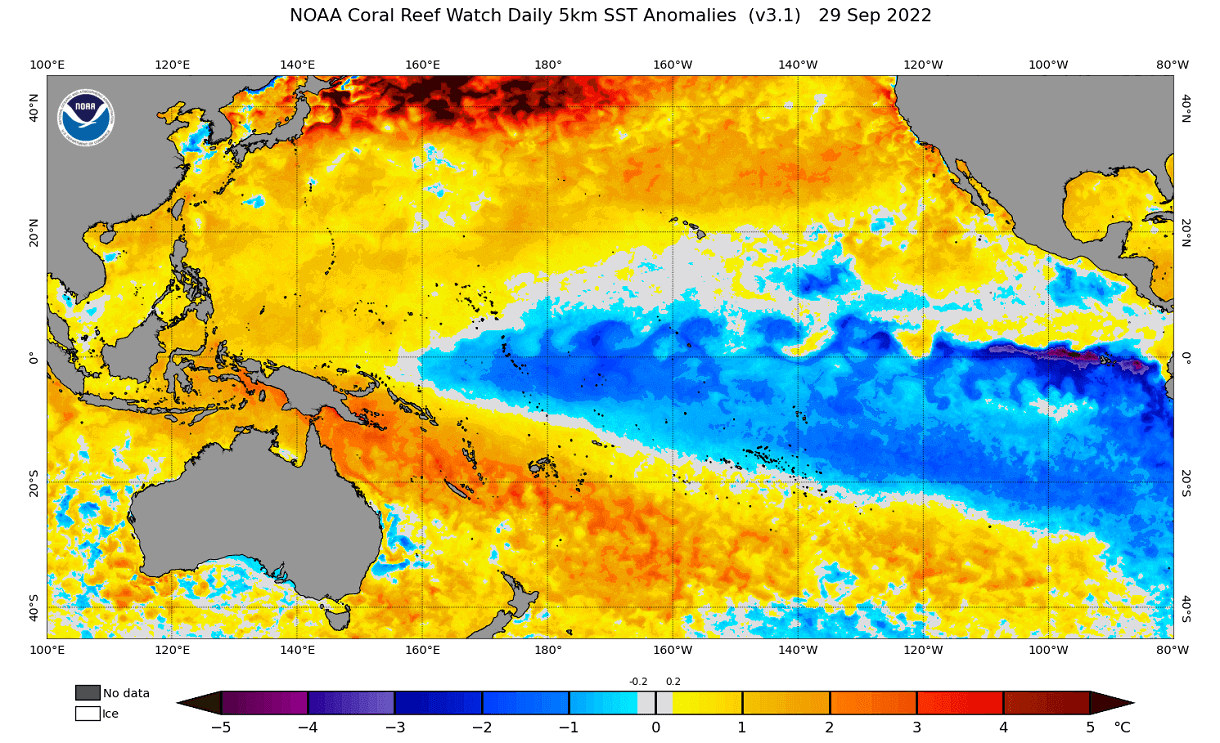
La Nina usually forms during strong trade winds, which can tell us much about the state of global circulation. This way, we can use these anomalies as an “indicator” to better understand the current state of the global climate system.
Below, you can see the last two years of ocean anomalies in the ENSO region. You can see the first La Nina event in 2020 and a second-year La Nina in late 2021. A third-year event is now developing and is forecast to last the entire Winter 2022/2023.

ENSO WINTER FORECAST
Below we have an Official NOAA CPC probability forecast graphic, which shows the long-range forecast of the central ENSO region. As forecasted, the La Nina conditions will last over the Fall and Winter. A weakening of the La Nina is expected for early next year, with a shift to a neutral phase.

To better understand the ENSO changes, we produced a video showing the La Nina anomalies from Summer into Fall.
The video below shows the developing cold ocean anomalies in the equatorial Pacific as we head deeper into Fall.
So what exactly does this mean for the winter weather patterns and snowfall potential? We will take a closer look at the weather influence that La Nina usually shows over North America, as it has a more direct impact.
Europe is not known to have any specific/direct influences, as it is too far from the source. But that does not mean it has no impact.
La Nina does change the weather globally, but apart from the direct influence over North America, places like Europe have many other factors at play before any La Nina influence can spread this far.
NORTH AMERICA WINTER WEATHER PATTERNS
Typically, the first influence of these ocean anomalies can be seen in the jet stream patterns changing. The jet stream is a large and powerful stream of air (wind) at around 8-11km (5-7mi) altitude.
Historically, a strong blocking high-pressure system in the North Pacific is the most typical effect of a cold ENSO phase (La Nina). That usually redirects the polar jet stream down over the northern United States.
The image below shows the average pressure pattern during the La Nina winters in the past 40 years. You can see a strong high-pressure system in the North Pacific and a low-pressure area over Canada and the northern United States. Images by NOAA Physical Sciences Laboratory (PSL).
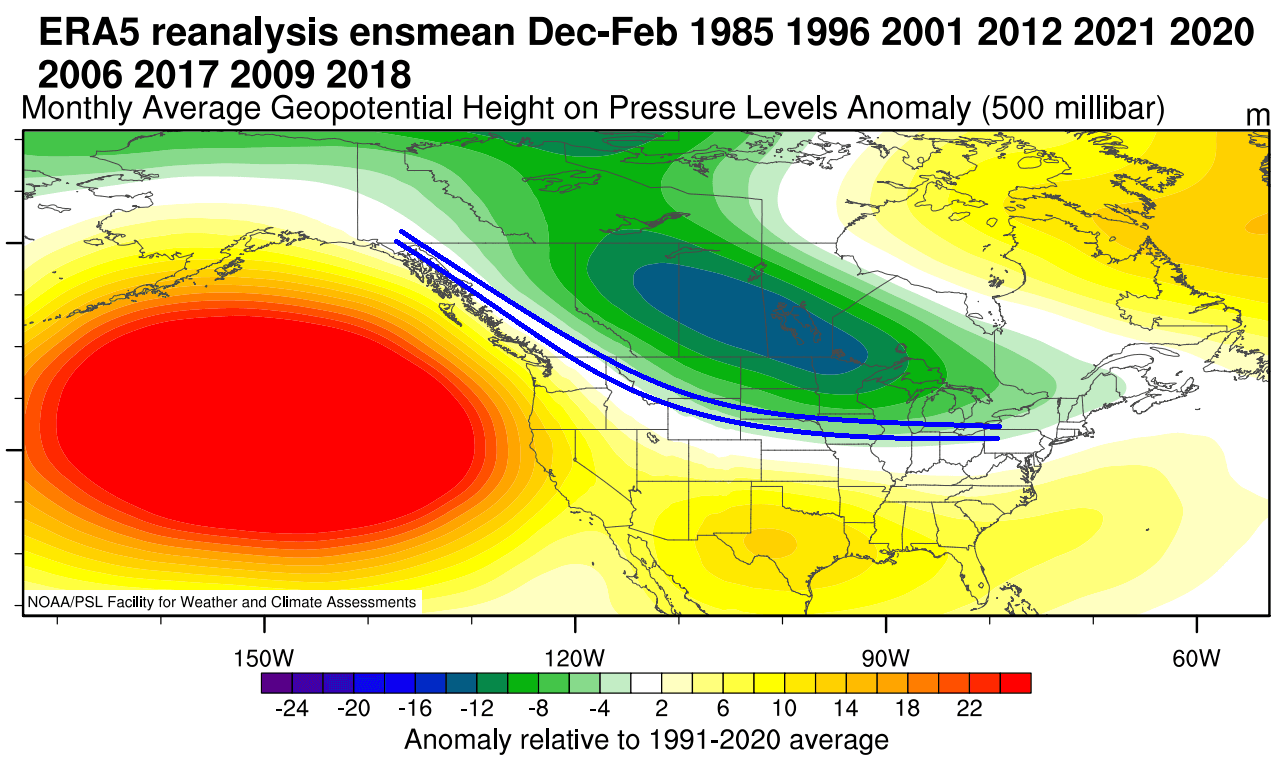
The circulation of the strong high-pressure system promotes the development of a low-pressure region over Alaska and western Canada. It pushes the jet stream downwards between the two strong pressure systems and is marked above by the blue lines.
You can see that jet stream redirection in the image below. The image shows the average jet stream position in La Nina winters and the resulting weather patterns developing over the United States and Canada.

The displaced jet stream brings colder temperatures and winter storms from the polar regions down into the northern and northwestern United States. Warmer and drier winter weather prevails over the southern states.
Looking at the temperature analysis for the same winters as above, we can see the cold anomaly area under the jet stream in western Canada and the northwestern United States. A cooler area extends over the Midwest and down into the south-central plains.
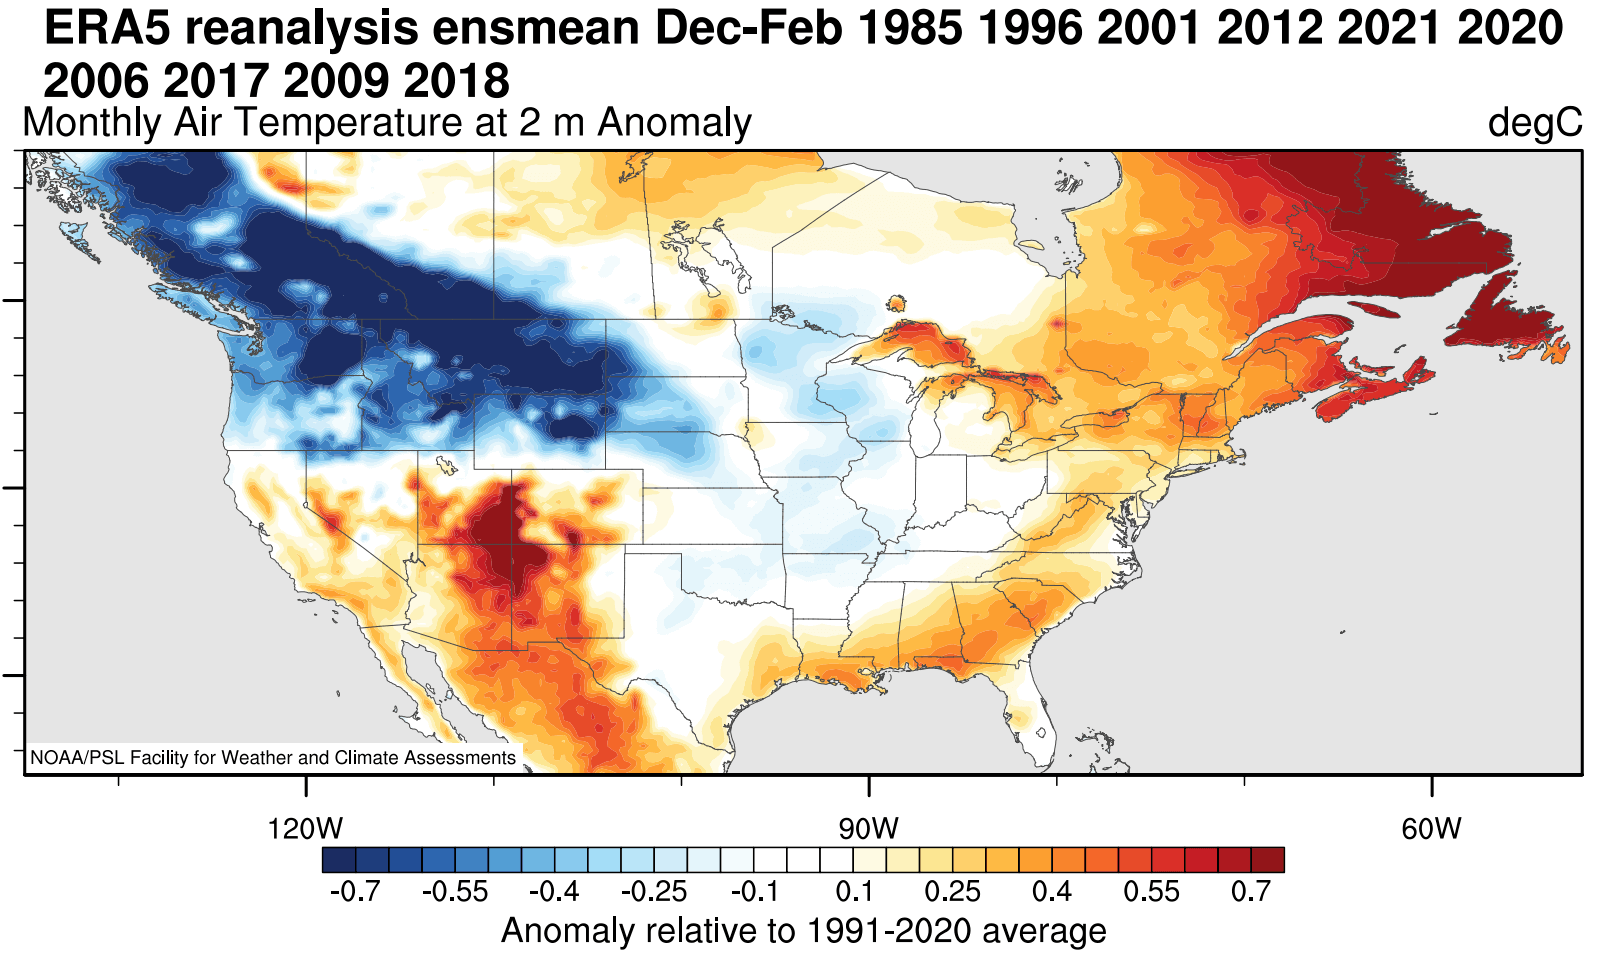
Warmer than normal weather and mild winter conditions typically develop over the southwestern United States, eastern United States, and eastern Canada. The main winter weather dynamics are usually between the warm and cold anomalies in the Midwest and the central United States.
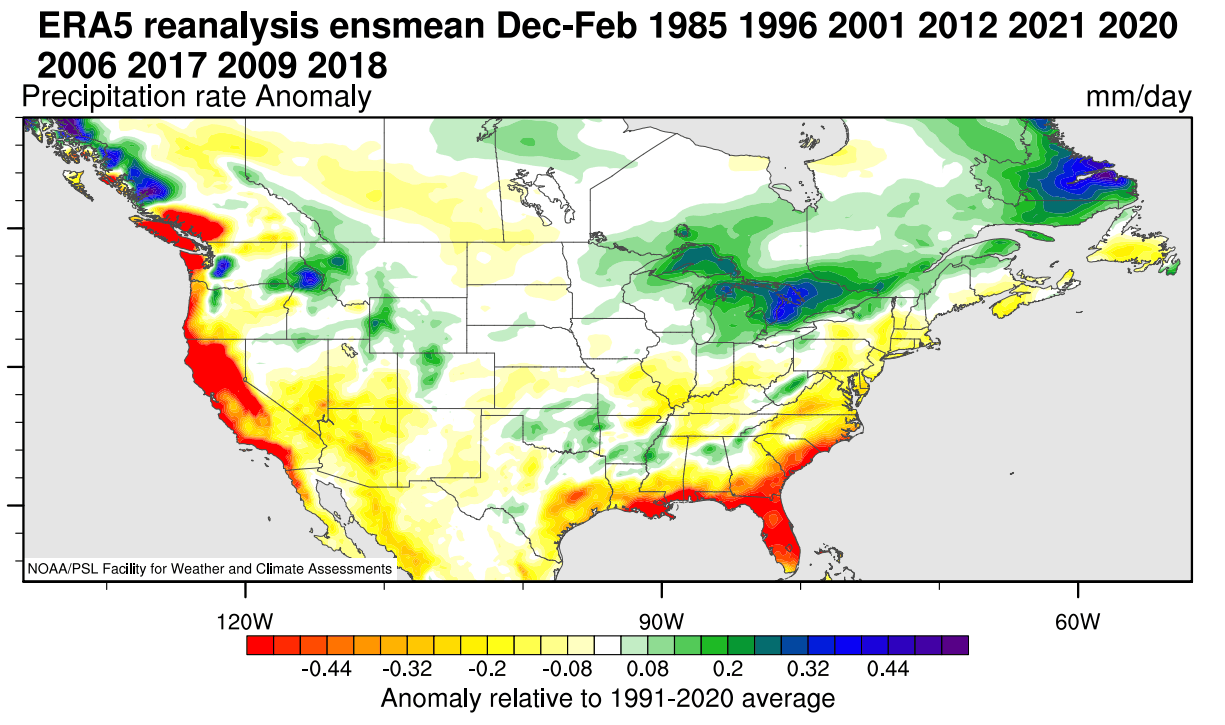
Precipitation-wise, La Nina winters are usually drier over the southwestern United States and Canada. Drier conditions also develop in the southeastern United States as La Nina produces a weaker subtropical jet stream and less moisture for the east. More precipitation is typical over the northwestern United States, the Great Lakes, and parts of the northeast.
But speaking of precipitation, what about snowfall? The data shows that the La Nina jet stream pattern also changes the snowfall potential over North America as the pressure systems take a different path.
The colder air is more easily accessible to the northern United States, which increases the snowfall potential when moisture is available. In the graphic below by NOAA-Climate, you can see the average snowfall pattern for weak La Nina years, as expected for this Winter season.
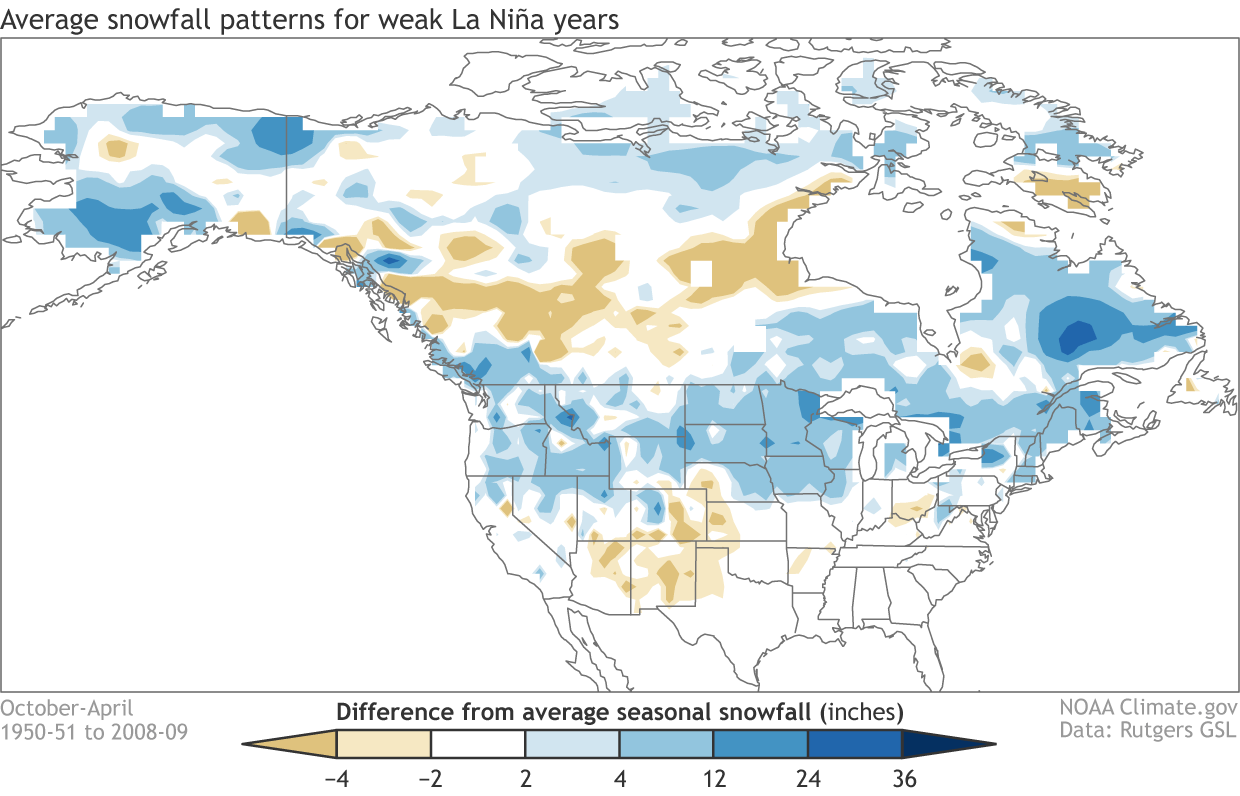
Besides the northwestern United States and the Midwest, we can see more snowfall potential over the northeastern United States and eastern Canada.
But now, we will look at some actual Winter snowfall predictions from the latest forecast models. Since the latest forecast data was released in mid-late September, we now have the February data included, so it is a full-Winter snowfall forecast.
WINTER 2022/2023 ECMWF/UKMO SNOWFALL PREDICTIONS
The format of this forecast is simple. We will look at two well-established seasonal weather forecasting systems. First is the ECMWF, and then it is the UKMO. The data used to produce these graphics, is the latest available at the present time, from mid-September.
You will see the average snowfall forecast for the meteorological Winter season, covering the December-January-February period. We will then do a monthly breakdown, as there are a lot of details in the monthly forecast that the whole seasonal average does not show.
ECMWF WINTER 2022/2023 SNOWFALL FORECAST UPDATE
We will start with the ECMWF, the most often used and highly regarded seasonal forecasting system.
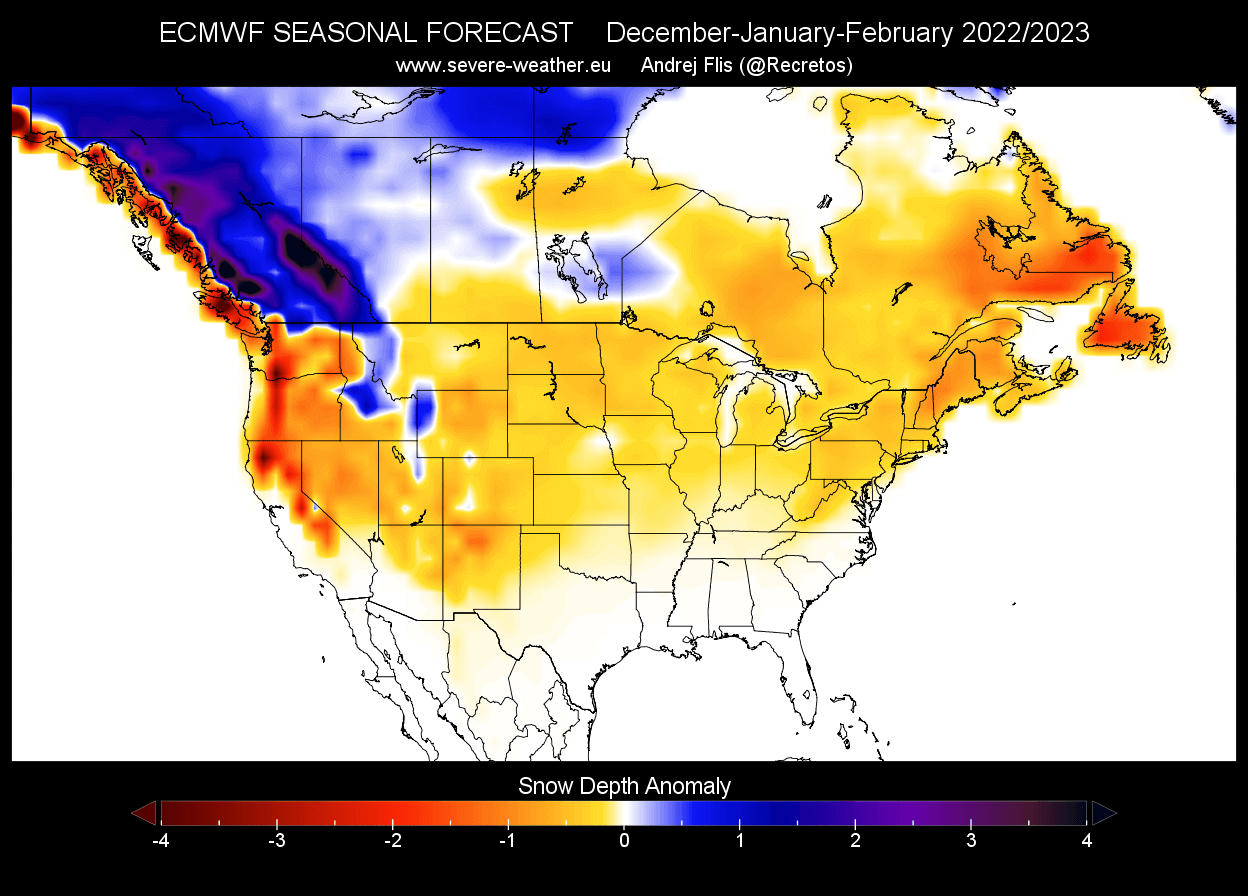
First, looking at the seasonal average, we see below-normal snowfall over much of the continent. Some small areas in central Europe hint at normal to above-average snowfall.
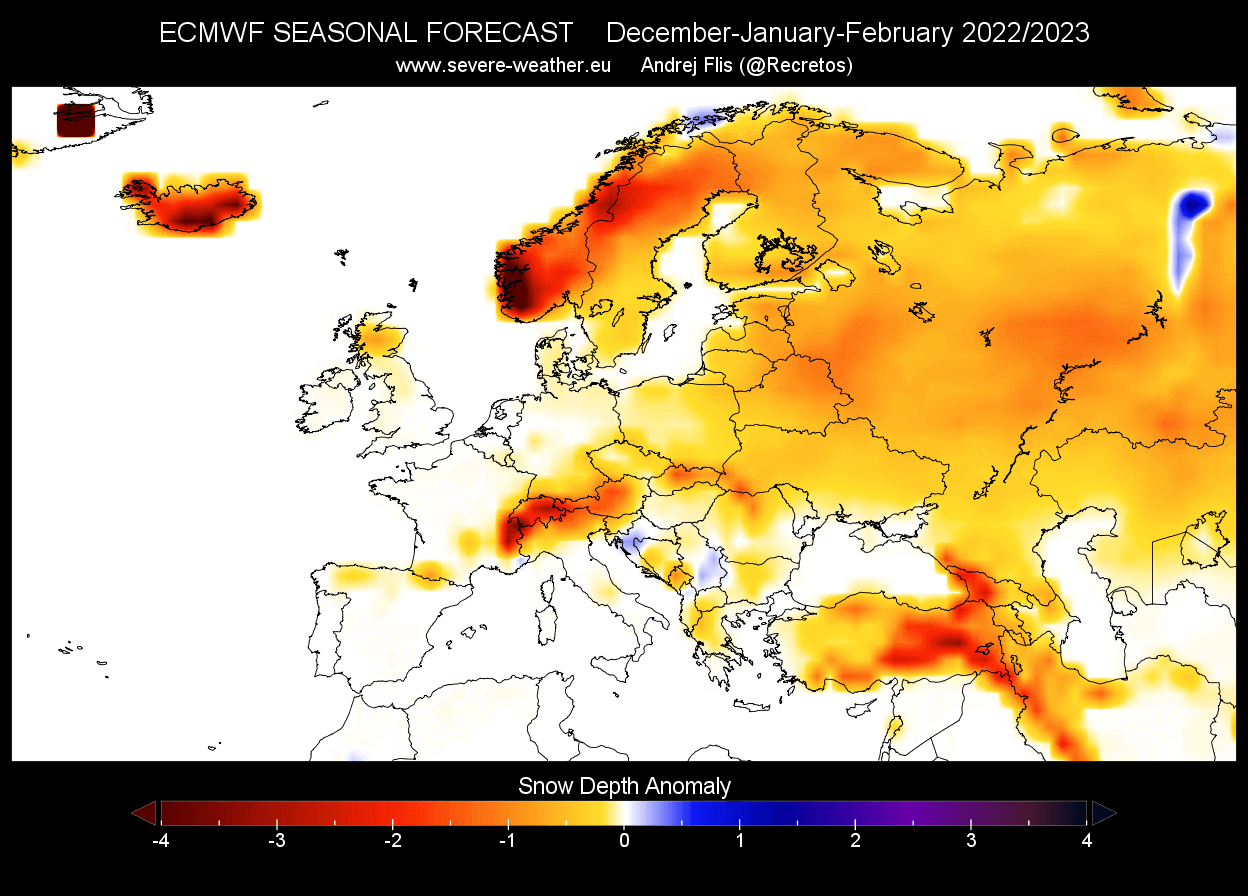
The December snowfall forecast shows strong negative anomalies. The pattern seems under the influence of a high-pressure system, as the forecast does not permit a lot of widespread snowfall scenarios and snow accumulation.

In the January forecast, there is a small improvement. Most of Europe is forecast to have less snow depth by mid-winter, but certain central and western Europe areas do show more snowfall.

The February snow depth forecast shows some more potential for increased snowfall in parts of central Europe. But most of the other parts are forecast with less snowfall the final Winter month.

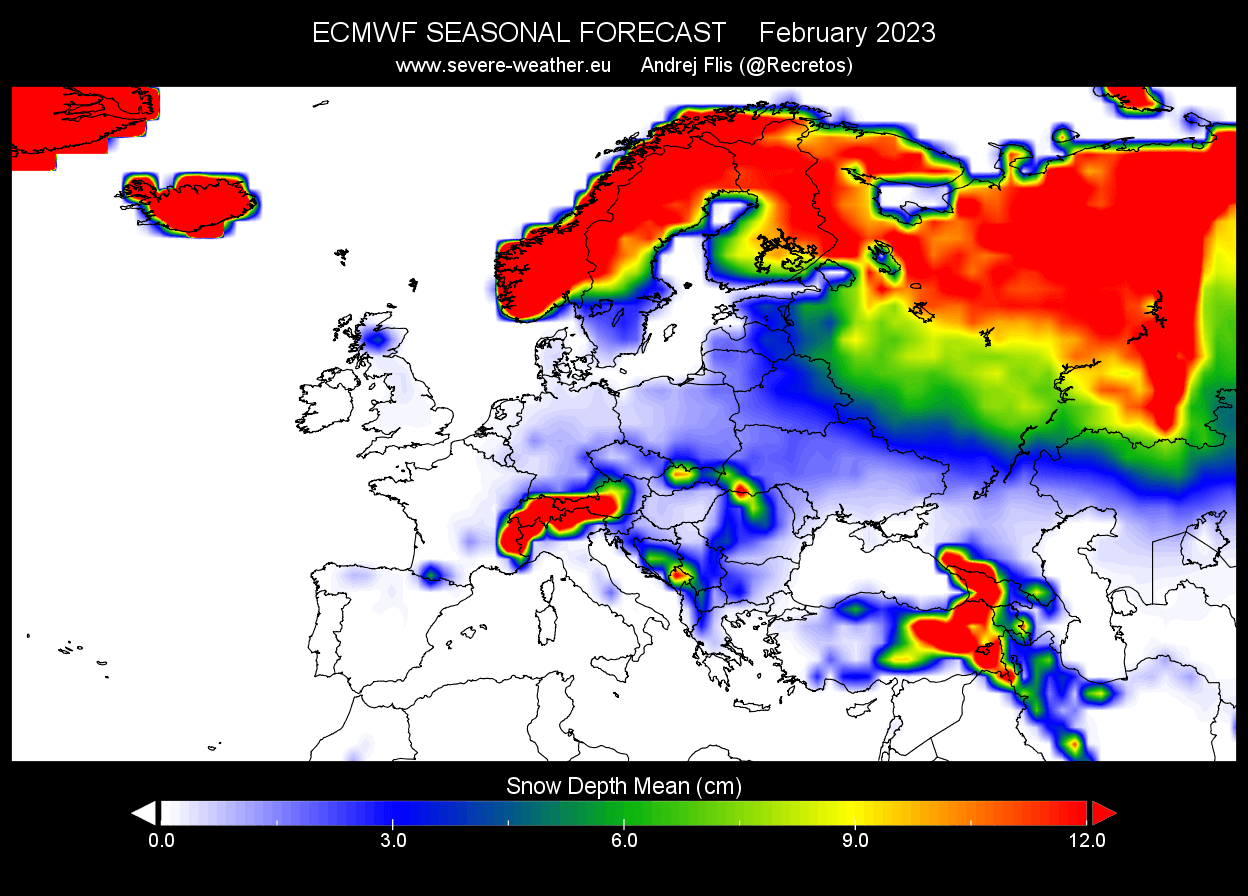
But anomalies can only tell us so much. In the next image below, you can see the raw mean snow depth for February, which is the last winter month. You can see that despite negative anomalies across most of Europe, there is still snow cover over the continent. So even if the forecast calls for less snow, that does not equal to no snow.
NORTH AMERICA ECMWF SNOWFALL PREDICTION
Over North America, we see a similar forecast, with most of the country having below-average snow depth over the entire Winter average. Except for the far northwest and western Canada. It is also perhaps surprising to see, as the Midwest and the far northeast, typically get more snow in a La Nina winter.
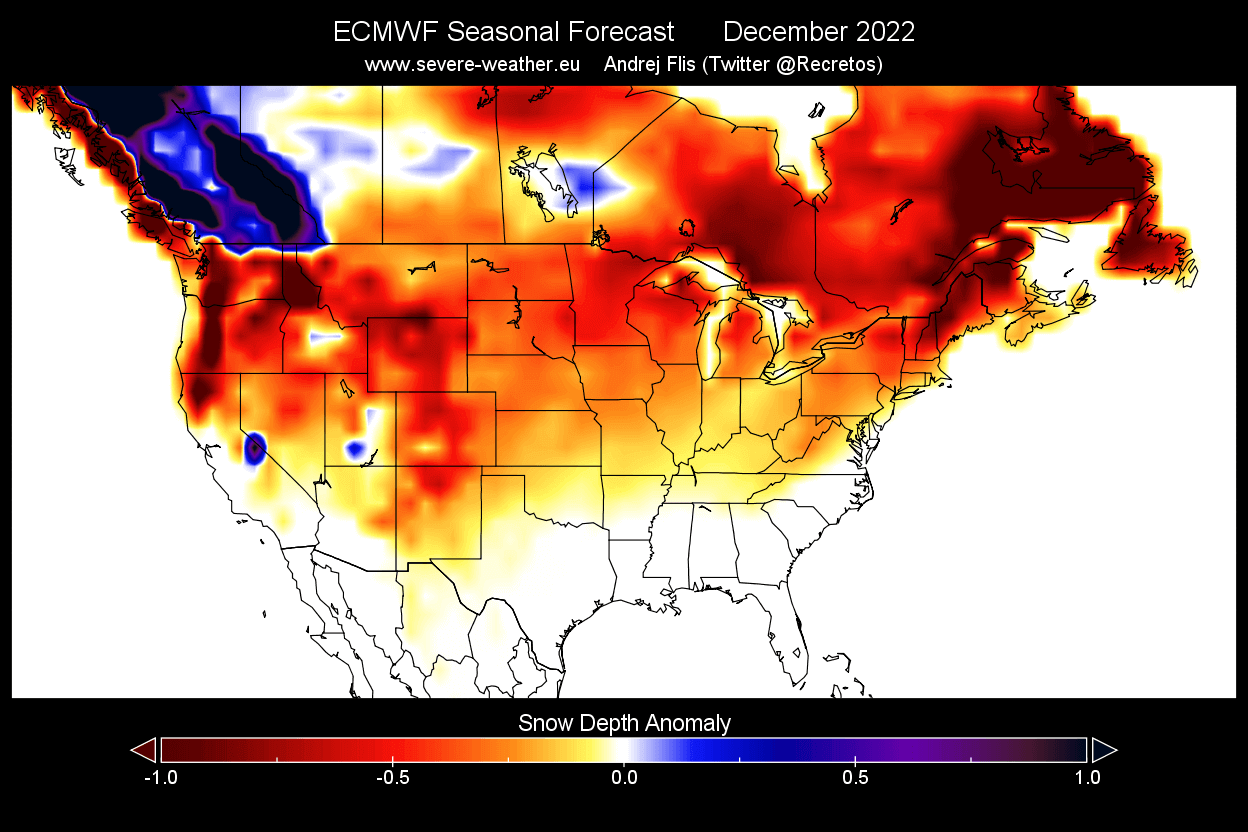
The December snow depth forecast shows less snow cover over most of the United States and Canada. One exception is far western Canada and small parts of the northwestern United States.
January snow depth forecast shows more snowfall expanding over from far western Canada into the northwestern United States. But the lack of snowfall over the Midwest and parts of the northeastern United States is surprising in a La Nina winter forecast. That is why we use more models to analyze the snowfall potential.

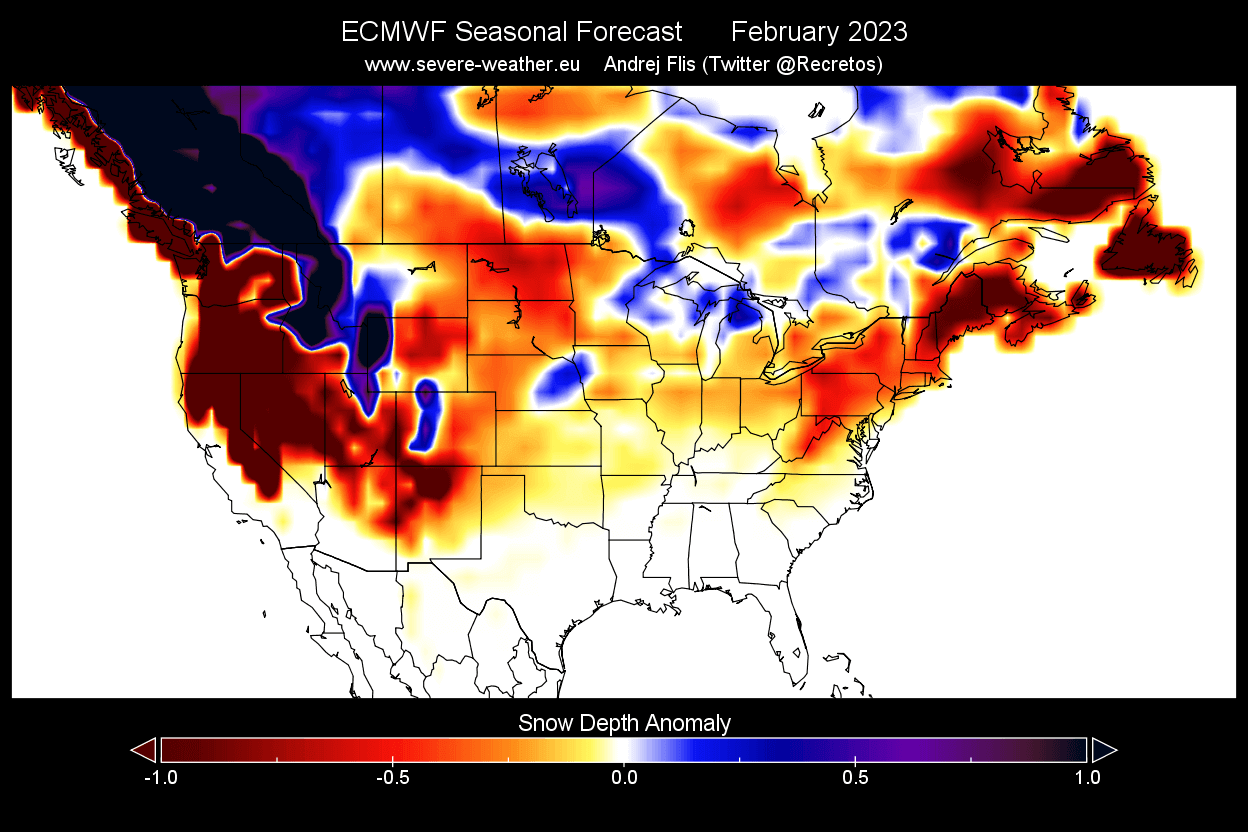
The February snow depth forecast shows some increased snowfall potential over the northwestern United States and expanding over western and southern Canada. However, we are seeing areas of increased snowfall over parts of the Midwest starting to appear.
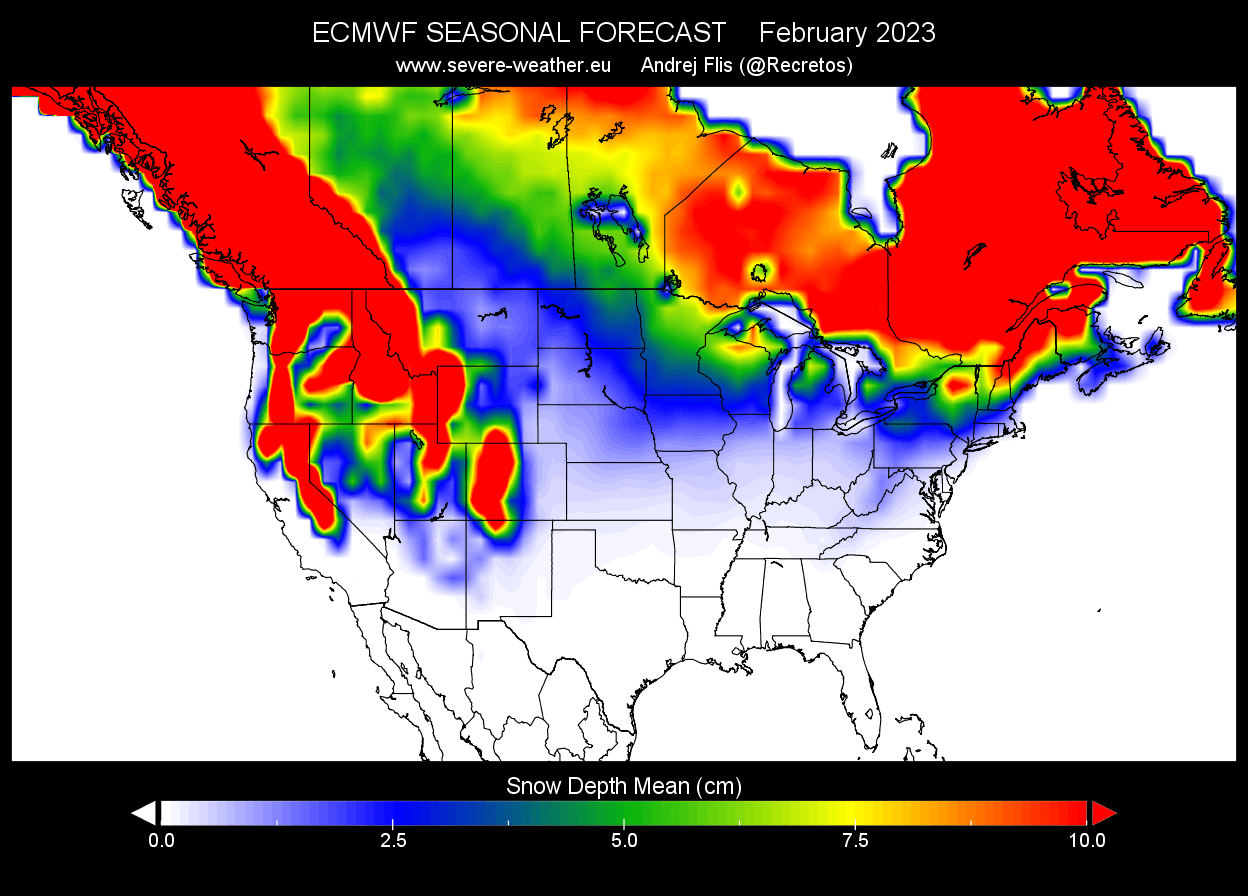
And also, for the United States and Canada, the mean snow depth forecast for February shows the snow cover expansion. It’s reaching down into the parts of the southern Plains and in a similar line towards the east. So while showing less snowfall than normal on average, there still is snow on the ground to be expected in those areas.
UKMO WINTER 2022/2023 SNOWFALL FORECAST UPDATE
Long-range weather forecasting is tricky, as there are a lot of factors that impact seasonal climate. We are only looking at trends and probabilities, but still, the variation is key. The more forecast data you can look at, the better idea you can get about the weather expected. Or sometimes, you can get even more confused.
As you can never trust a single forecast model, we decided to always use the UKMO long-range forecasting system along the ECMWF. It is developed by the United Kingdom Met Office, which is where the initials UKMO come from.
First, looking at the seasonal average for Europe, we can see another weak snowfall forecast, similar to the ECMWF. Most of the continent is forecast to have less snowfall than normal, except for far northern Europe. UKMO uses a different parameter than the ECMWF but correlates directly with snowfall also.

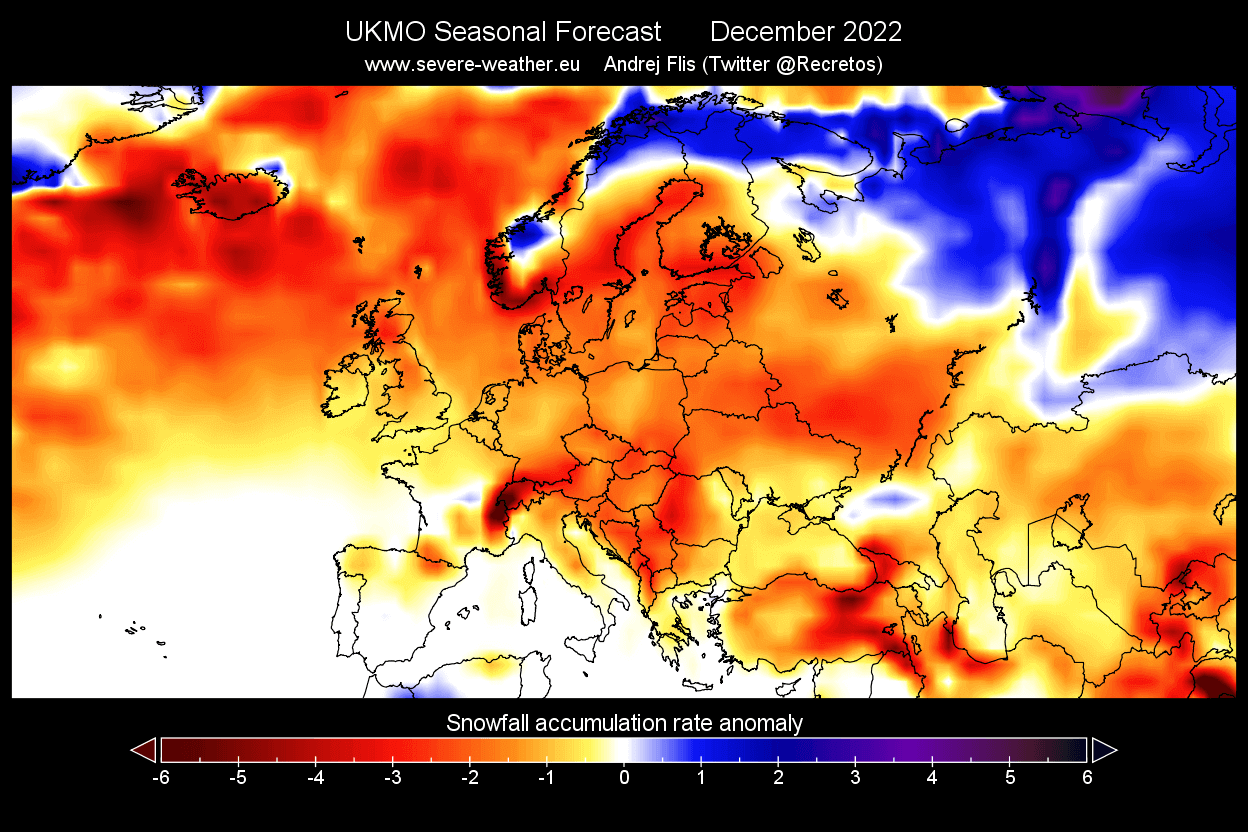
The December snowfall forecast shows stronger negative anomalies, just like the ECMWF. This agreement in both models gives more confidence for this scenario.
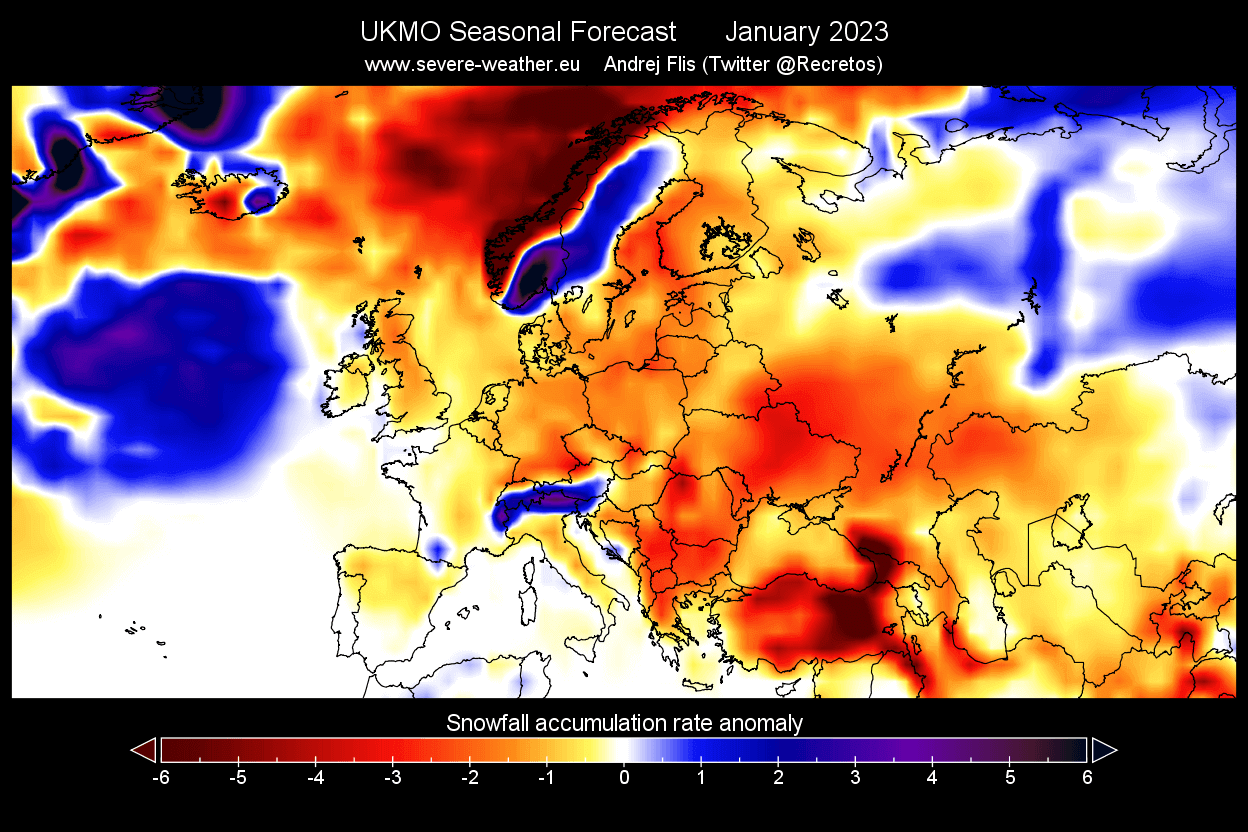
The January snowfall forecast shows more potential in higher parts of central Europe, similar to the ECMWF. This shows that precipitation is available, but the temperatures are not cold enough for snow accumulation in the lowlands.
The February snowfall forecast indicates some potential over the western parts of Europe. But otherwise, the rest of the continent shows less snowfall than normal for this month, expert further up over the north.

NORTH AMERICA UKMO SNOWFALL PREDICTION
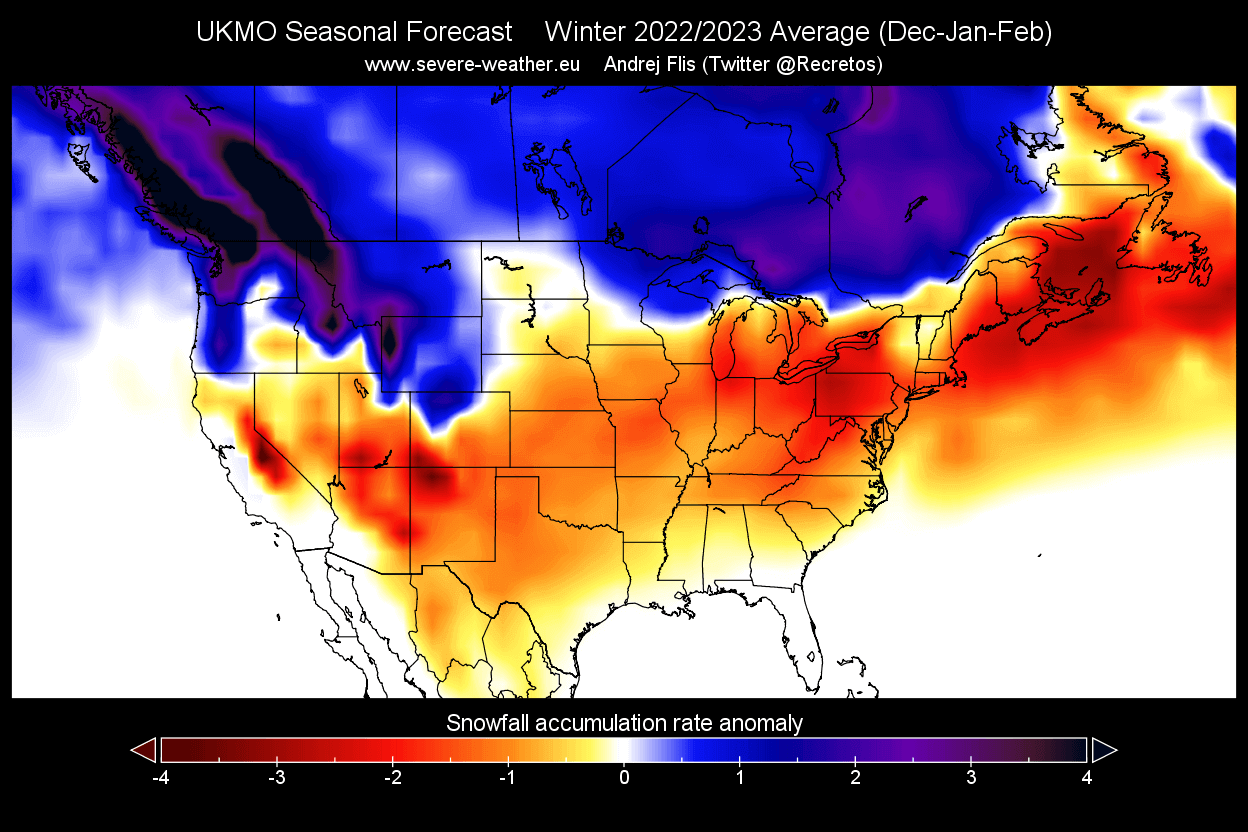
The average seasonal forecast for the United States and Canada shows a much more typical La Nina snowfall pattern. We see more snowfall over the northwest and the upper Midwest. As a result, more snow could be expected across the northern United States, as it still looks closer to a La Nina than the ECMWF.
The December snowfall forecast already shows this snowfall increase, especially over the northwestern United States. More snowfall can also be seen in parts of the Midwest. The rest of the United States is forecast to receive less snowfall than normal this month.
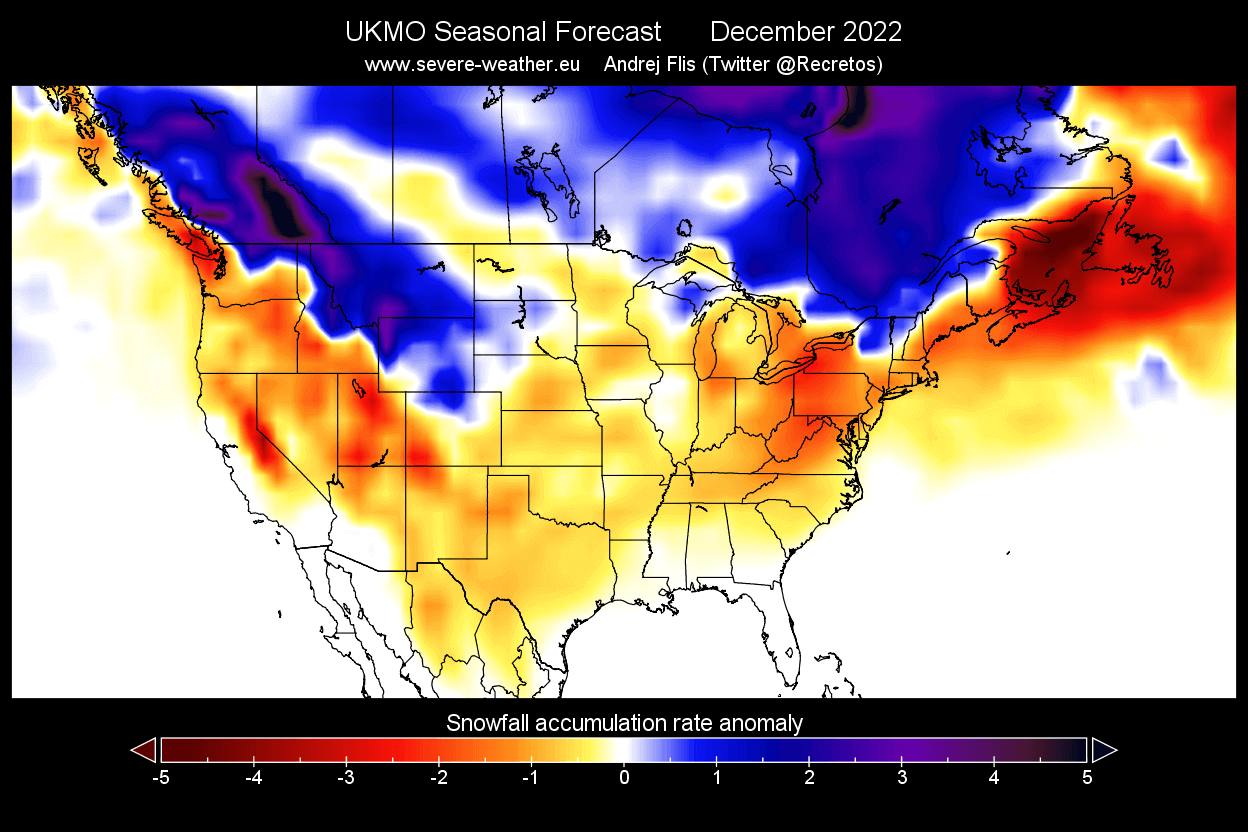
Canada, however, is forecast to have increased snowfall potential over much of the southern half. This is consistent with a weak/moderate La Nina active.
January snowfall forecast shows an even stronger pattern, with more snowfall over much of southern Canada and the northwestern United States. This looks much closer to an expected snowfall pattern in a La Nina winter. Parts of the Midwest also have more snowfall potential.
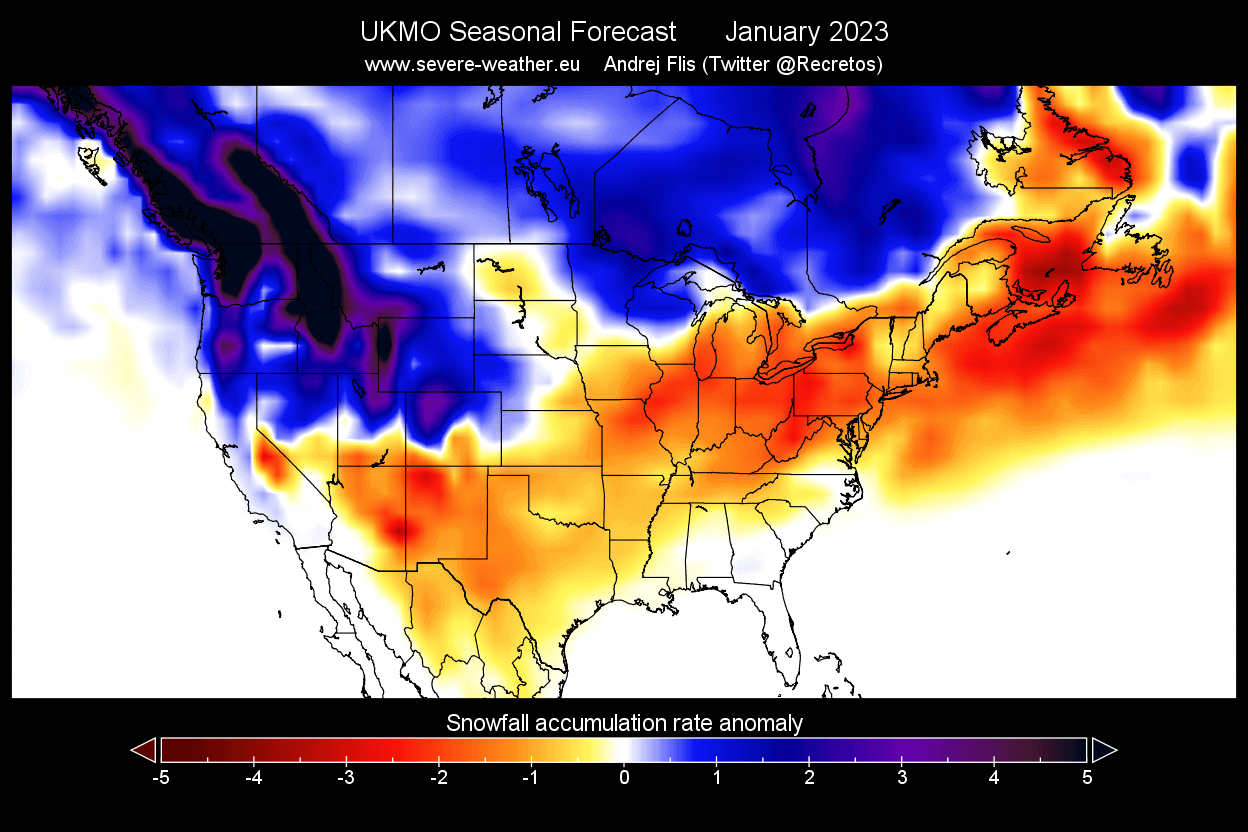
The rest of the United States is mostly below average, but there is an area of some snowfall hinted in the southeast.
The February snowfall forecast shows widespread reduced snowfall over much of the United States. This is mainly a result of warmer than normal temperatures expected in late Winter by UKMO. But the northwestern United States and upper Midwest have more snowfall, along with southern Canada.
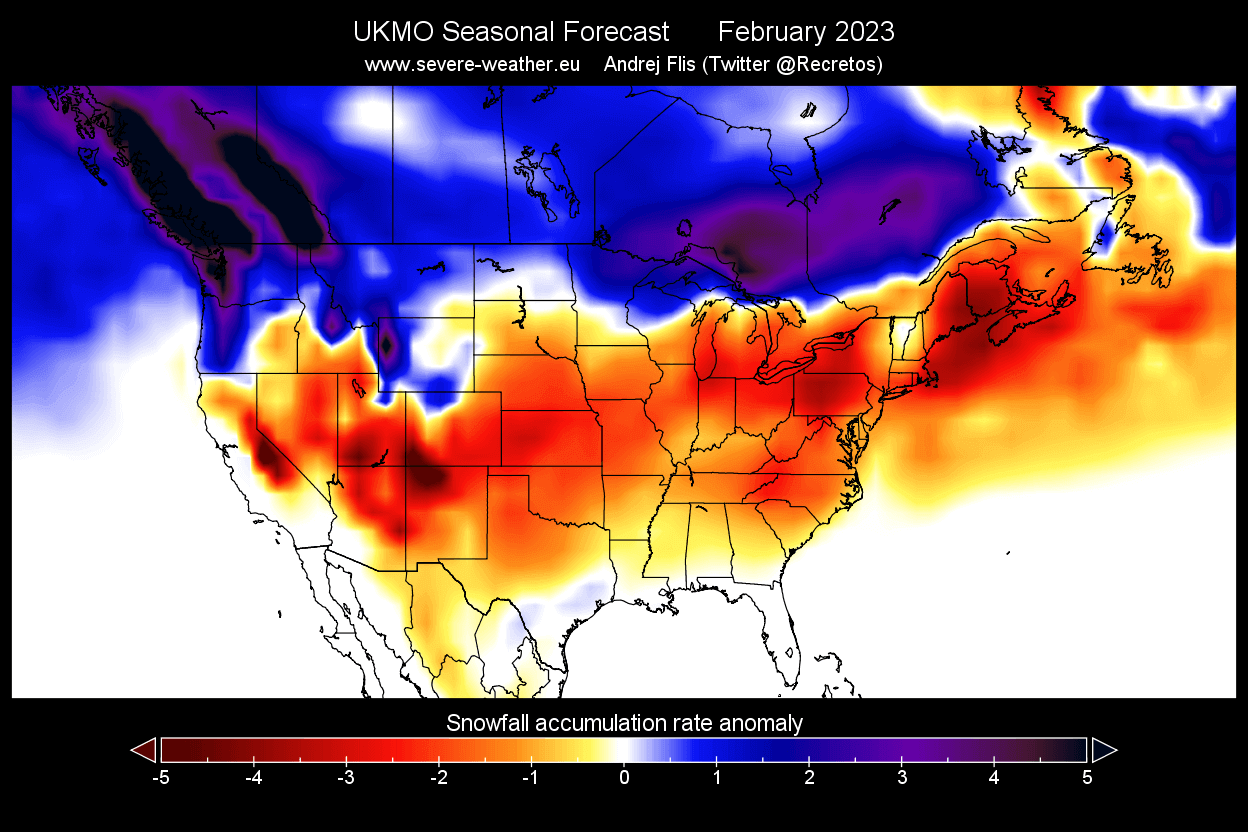
Interestingly, some hints of snowfall can be seen in the far southern United States. This is perhaps an unlikely scenario initially, but just one strong cold outbreak could bring some snowfall further into the south.
NOAA OFFICIAL WINTER 2022/2023 FORECAST
We can also track snowfall potential on normal temperature and precipitation Winter forecasts. The highest snowfall potential is usually in regions with colder temperatures and more precipitation.
This is can be seen in the NOAA’s official Winter 2022/2023 temperature forecast for the United States. It shows colder to equal temperature probabilities for most of the northern United States. The southern half of the country and the northeast have a higher probability of warmer than normal weather, as seen in the models above.
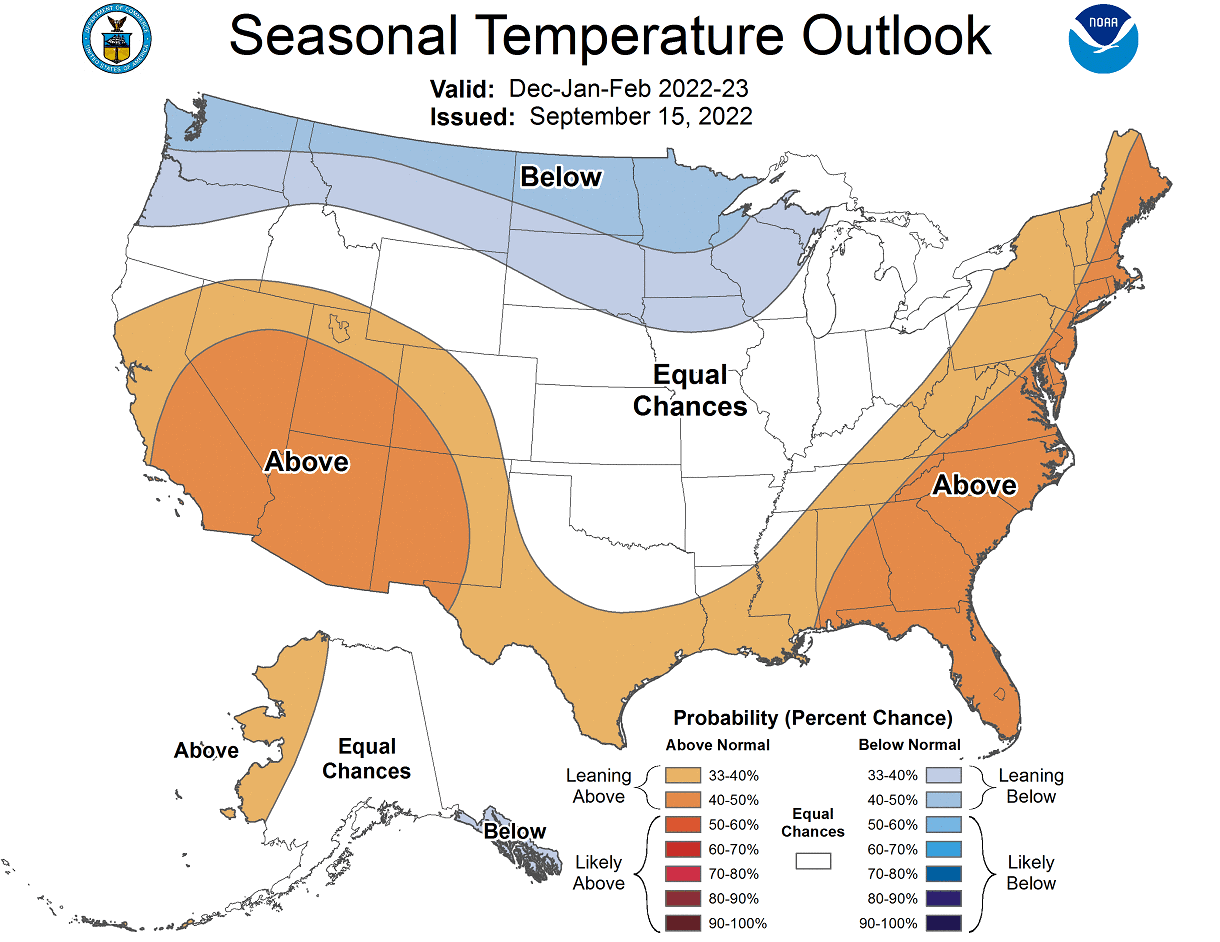
But take note of the trough of “average” temperatures probability extending into the lower Midwest. That can be interpreted as a potential route of winter cold air outbreaks and increased snowfall potential.
The UKMO snowfall forecast shows that scenario, and it is also hinted at in the historical data as a weather “battle zone” under the jet stream.
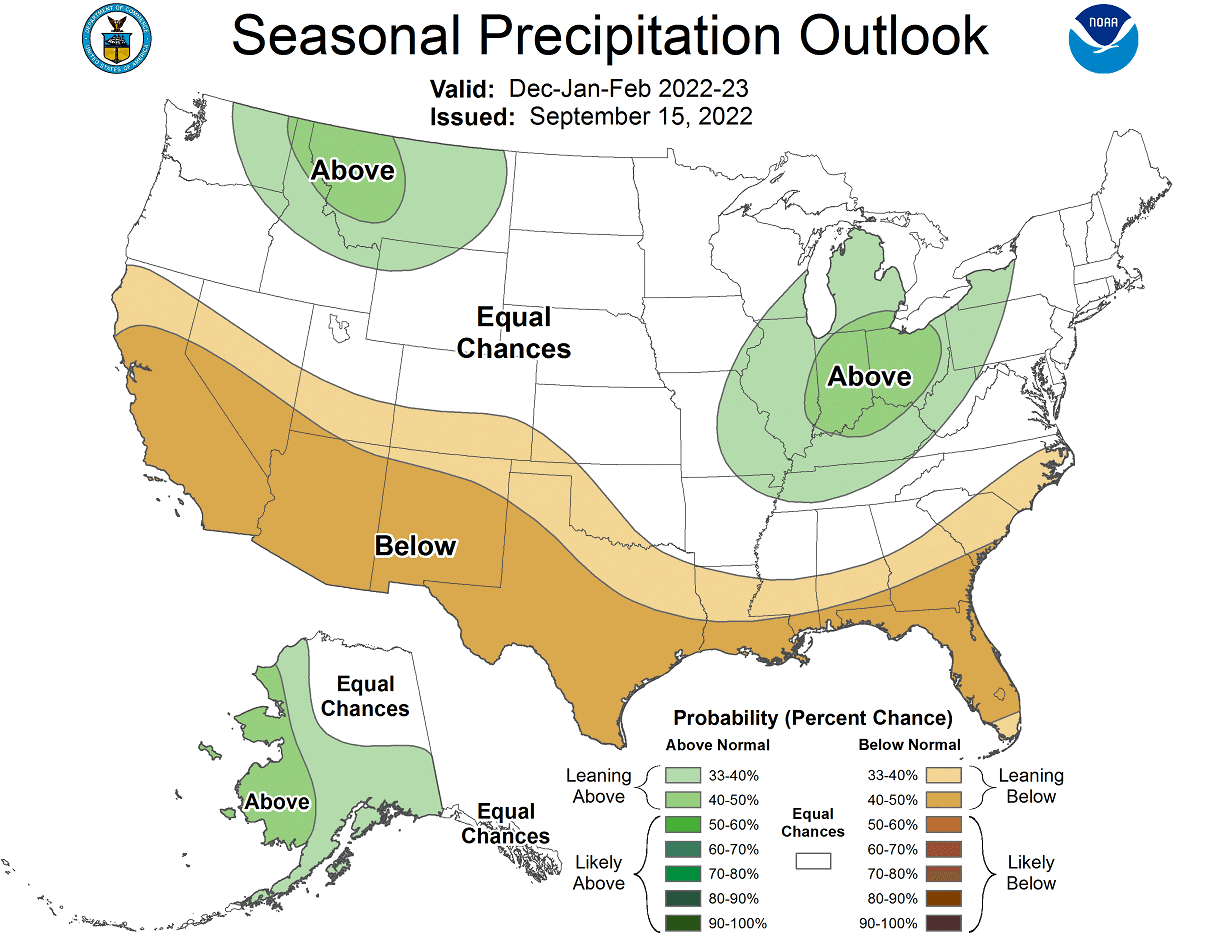
The official precipitation forecast is similar to the UKMO and the historical data. We see an equal-to-higher probability for more precipitation (and snowfall) over the northern half of the United States. The southern United States is forecast to have a drier winter season.
We will release our full Winter 2022/2023 forecast update later in October with additional data, so check back with us.
Also, we will keep you updated on other developing weather trends, so bookmark our page. Also, if you have seen this article in the Google App (Discover) feed, click the like button (♥) there to see more of our forecasts and our latest articles on weather and nature in general.
Don’t miss: