Rapid changes in the oceanic and atmospheric patterns have prompted NOAA to release an official La Niña watch. This means that La Niña is expected to emerge soon, bringing worldwide weather impacts in the second half of the year and especially during next Winter across the Northern Hemisphere.
Over the past years, La Niña and El Nino were mentioned in the same breath as seasonal weather. They go hand in hand, as these ocean anomalies are a key part of the ocean-atmosphere climate system.
We will first look at the latest cooling conditions across these ocean regions and look at the latest long-range development. Then, we will look at the Weather impact that La Niña will have from the 2024 Atlantic Hurricane Season to the next Winter of 2024/2025, based on data from the past 40 years.
ENSO AND GLOBAL WEATHER
These oceanic anomalies are found in the region called ENSO, which stands for “El Niño Southern Oscillation.” This is a region in the equatorial Pacific Ocean that periodically shifts between warm and cold phases.
ENSO significantly influences tropical rainfall, pressure patterns, and the complex relations between the ocean and the atmosphere. We can observe different large-scale pressure changes in the tropics with each phase.
The image below shows the ENSO regions across the tropical Pacific. Regions 3 and 4 cover the east and west tropical Pacific. This mainly gives us the idea of where to look to find these ocean anomalies and see what their state is.

Each ENSO phase influences the pressure and weather in the tropics differently. This affects the overall global circulation over time, changing the weather patterns worldwide.
The cold ENSO phase is called La Niña, and the warm phase is called El Niño. Besides the temperatures, one of the main differences between the phases is the pressure patterns that they produce, seen below as high (H) and low (L) pressure areas.
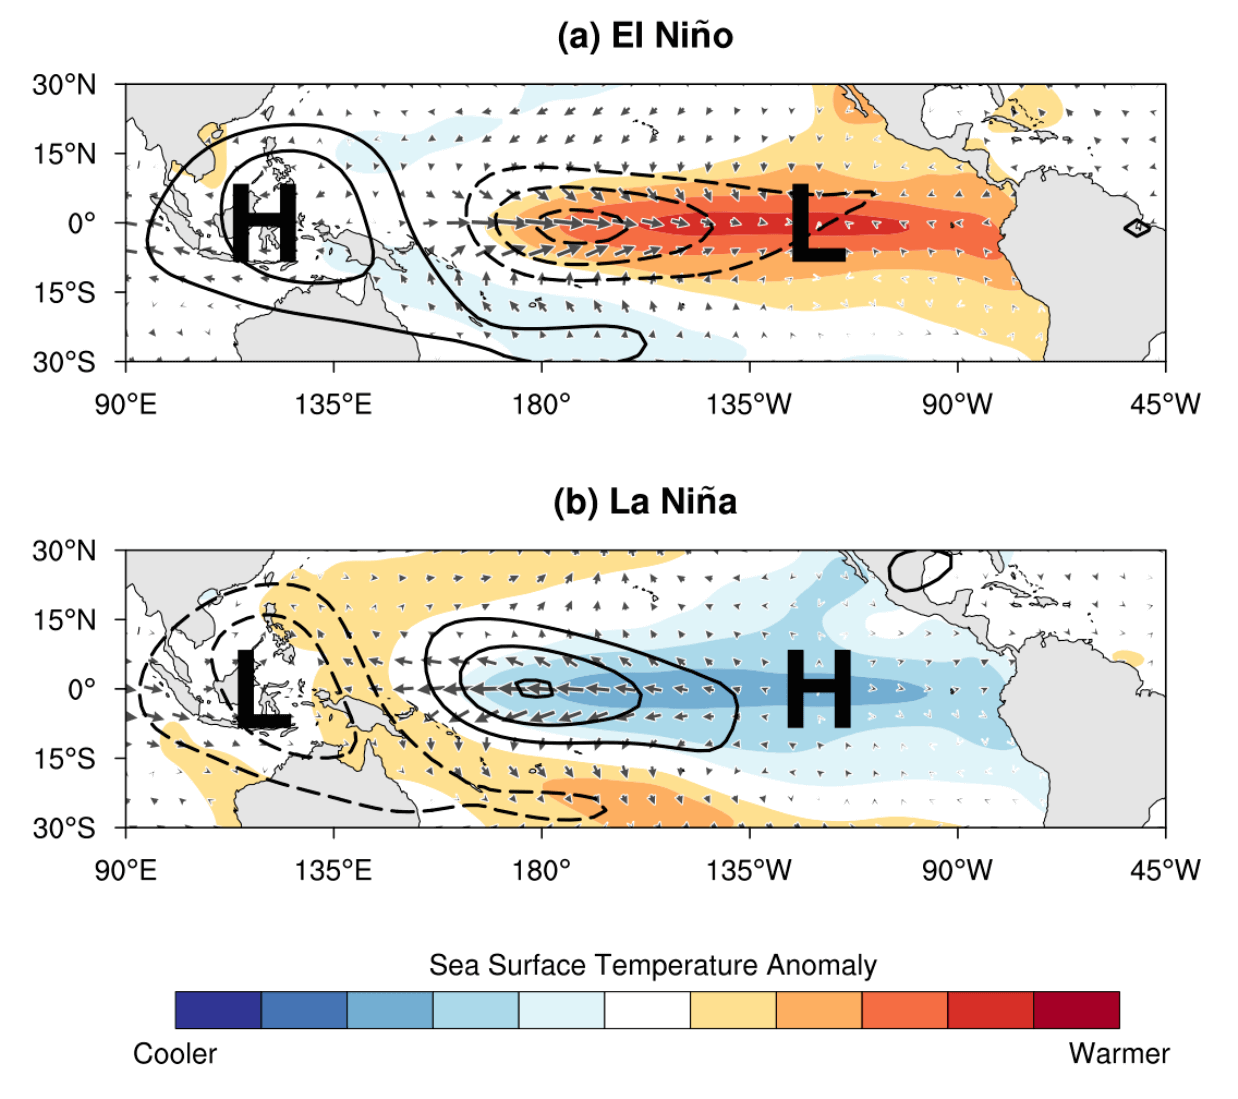
During an El Niño, like currently, the pressure over the tropical Pacific is lower, with more rainfall and clouds in this region.
But during a La Niña, the pressure over the equatorial Pacific is high, creating stable conditions and fewer clouds. These pressure changes translate into global circulation, affecting seasonal weather over both Hemispheres.
The following image below from NOAA Climate shows the typical circulation during a cold ENSO phase (La Niña). You can see that it changes both the surface and upper circulation.
Descending air in the eastern Pacific causes high pressure and stable/dry weather. At the same time, the air is rising in the western Pacific, causing frequent thunderstorms, low pressure, and a lot of rainfall.
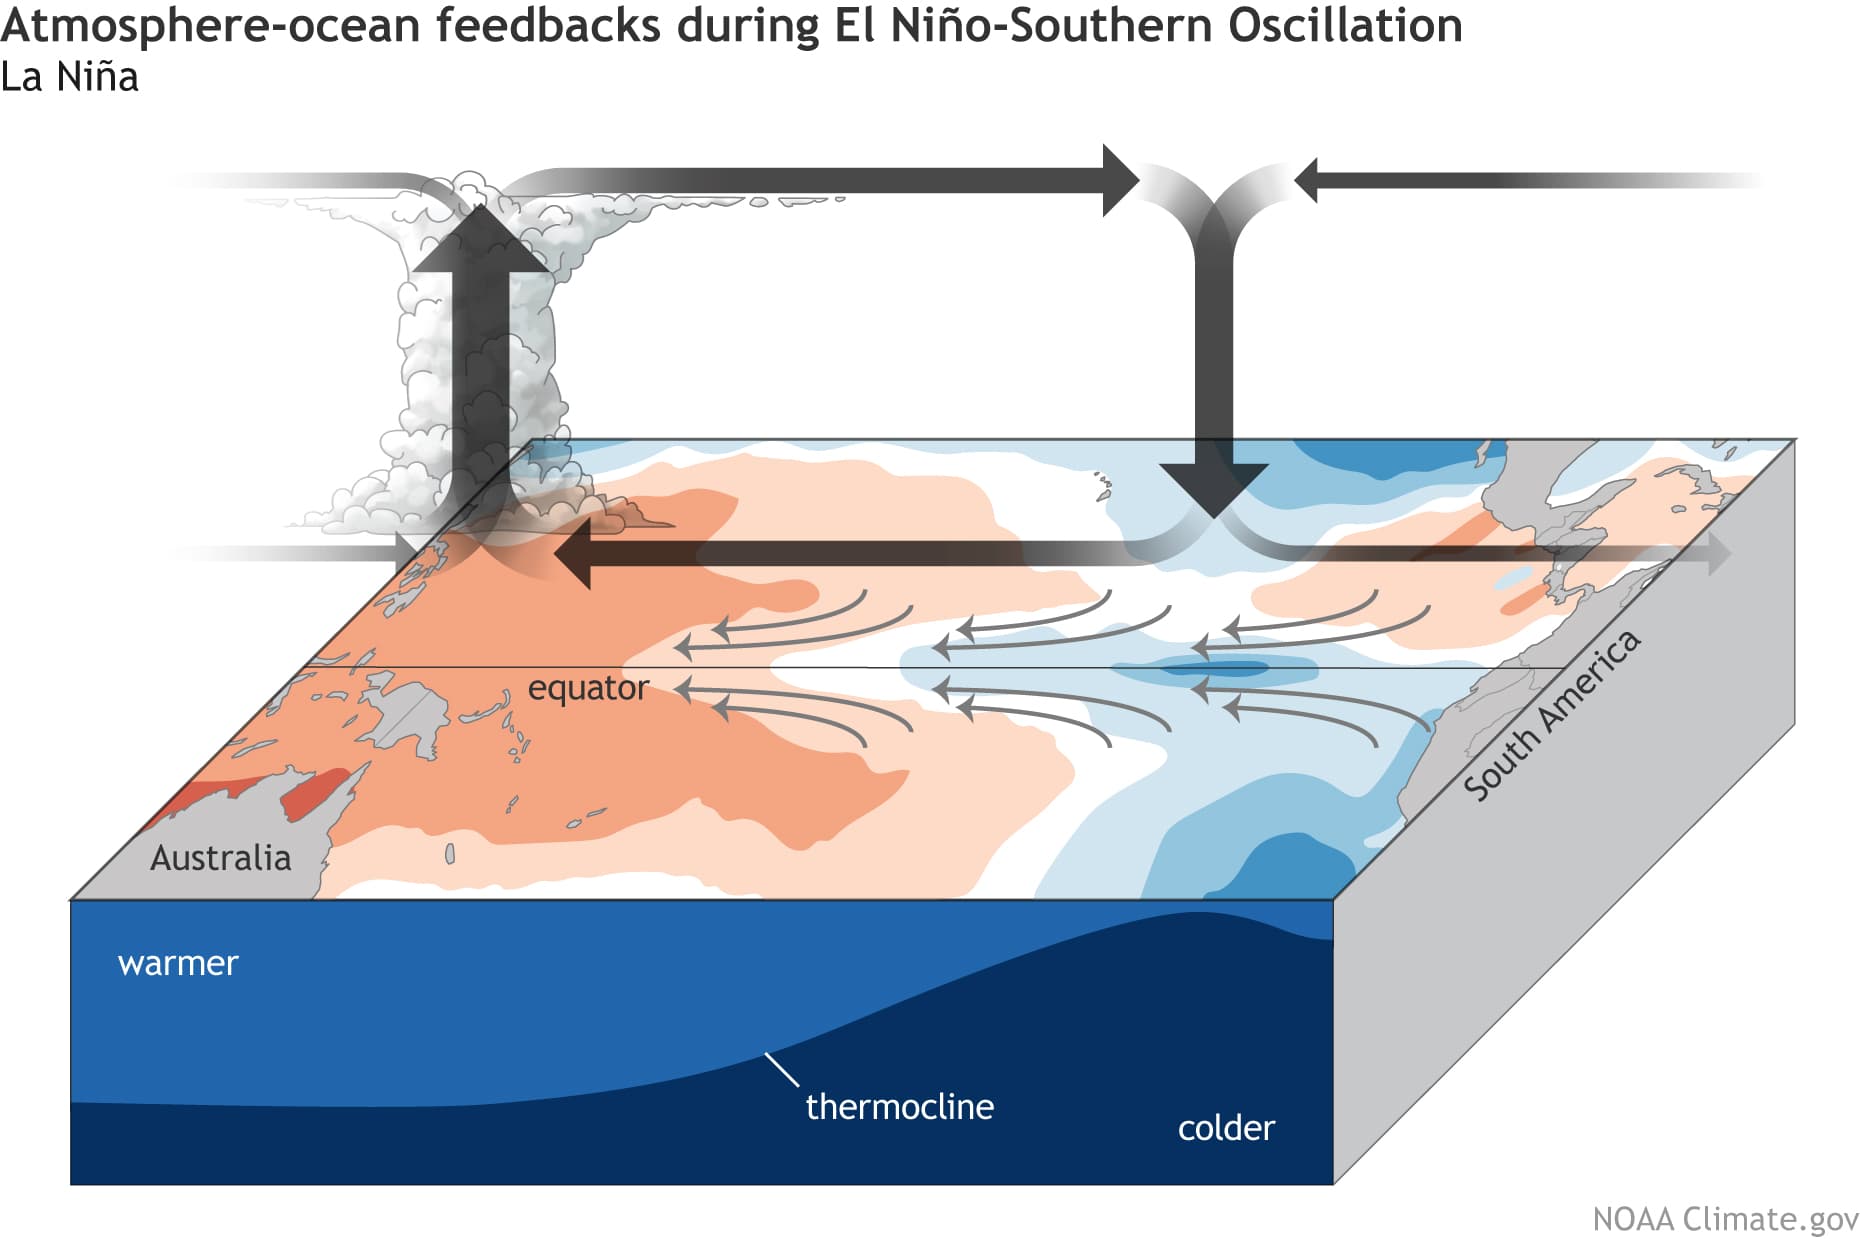
This way, ENSO strongly impacts the tropical rainfall and pressure patterns and thus impacts the ocean-atmosphere feedback system. Through this system, the ENSO influence is distributed globally.
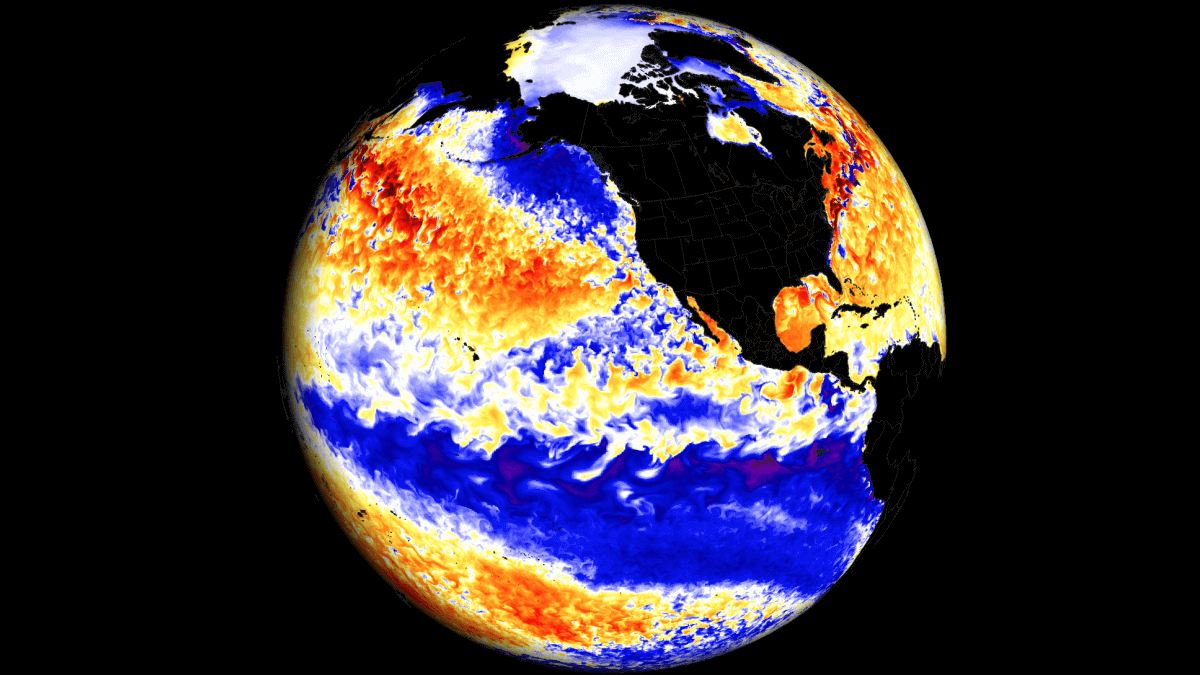
Below is the last La Niña event that occurred in the 2022/2023 season. You can see widespread cold ocean anomalies extending far across the tropical Pacific Ocean. This is how a La Niña typically looks like, while an El Niño event shows warm anomalies instead.
So, what is the current state of these ocean anomalies, and how do we know that a new La Niña is coming?
MAJOR OCEAN CHANGES STARTING
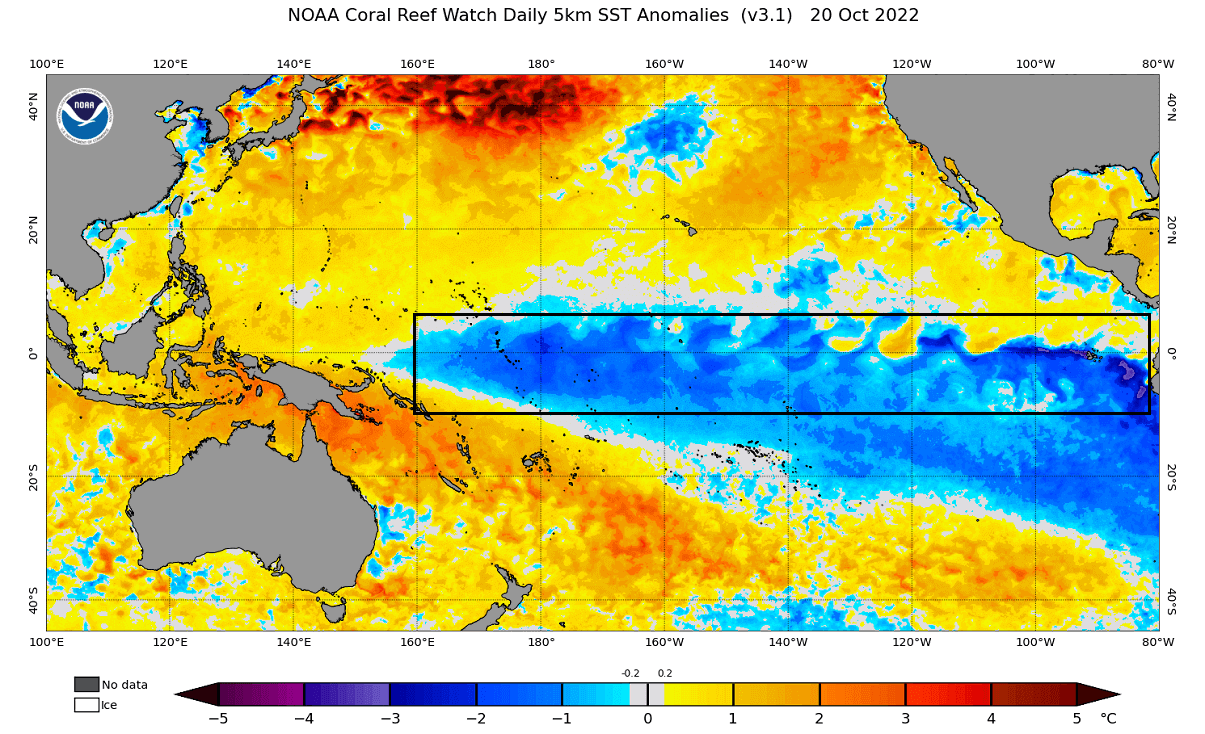
The latest ocean analysis below reveals the continued presence of warm ocean anomalies in the tropical Pacific. This is across the ENSO regions and shows the still active El Niño spanning almost the length of the tropical Pacific. But the anomalies are weakening, as just a month a go, the peak values were quite higher.

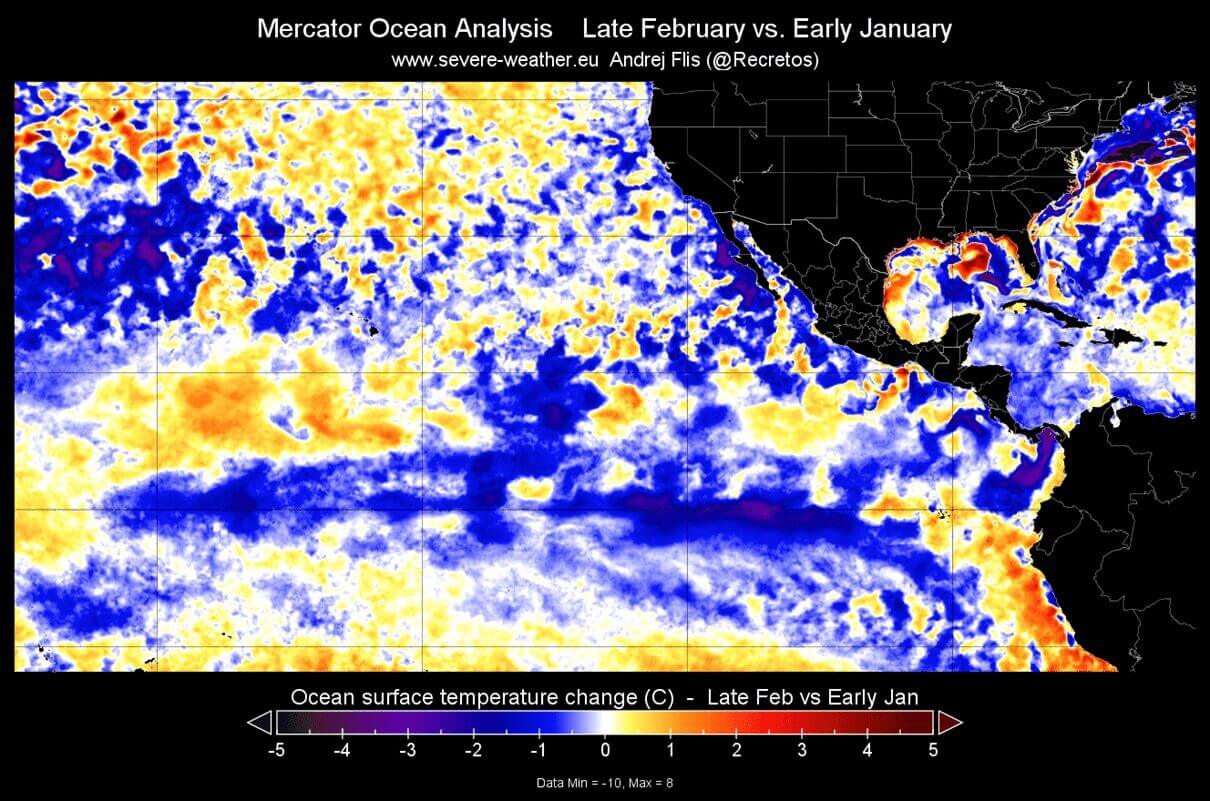
Below is the latest 60-day ocean temperature anomaly change. You can very clearly see the cooling ongoing across the entire ENSO region. Many parts in the eastern region have seen temperature drops of 2-3 degrees Celsius.
Another stronger (invisible) cooling process is also developing below the ocean surface. The image below shows the latest subsurface temperature anomaly compared to early January, just as in the previous image. You can see an obvious cooling trend, with a strong cold pool now rising to the surface.

Below is the ocean heat content analysis graph for ENSO regions. It shows the heat anomaly in the upper ocean layers. You can see a strong, warm anomaly during the El Niño phase. But a new cold wave is powering up with the upwelling process, bringing the heat content into negative values now in February.

As mentioned, this cold pool is rising to the surface with an upwelling process. Upwelling is a process when strong easterly winds push the surface waters towards the west, bringing up deeper, cooler waters to replace them. You can see this process simplified in the image below by weather.gov.

You can better see the latest upwelling in the video below, produced from NOAA subsurface data. It shows the ocean temperature anomalies for the past two months. You can see a rapid breakdown of the warm pool below the surface and the rise of the cold pool in the eastern ENSO regions.
In January, we saw a strong expansion of the cold pool towards the east. It has begun to erode the warm anomalies and is expected to reach the surface sometime in the next weeks.
Below is also the latest analysis of the ocean temperatures below the surface. You can see the warm anomalies are only left close to the surface, which is the last stand of the El Niño. But going just 30-40 meters (100-120ft) below the surface, we can find a large pool of colder ocean temperatures ready to emerge. Image by NOAA CPC.

A strong subsurface cold pool is the main pre-condition for a La Niña to develop. With the aid of the trade winds and ocean currents, these subsurface anomalies move from west to east, eventually coming to the surface over the eastern Pacific, starting a La Niña event.
The rapid subsurface temperature changes have prompted the Climate Prediction Center to issue an official La Niña watch, which is the cold phase of the ENSO. The latest outlook gives a greater than 50% chance of a La Niña impacting the Winter season of 2024/2025.

In their latest discussion, they write: “A transition from El Niño to ENSO-neutral is likely by April-June 2024 (79% chance), with increasing odds of La Niña developing in June-August 2024 (55% chance)…”
It means that the atmosphere will have to transition from one ENSO event to another at a relatively rapid pace. La Niña is expected to fully develop during Summer and exhibit its first weather impact as early as Fall 2024.
We will look more closely at the actual forecast trends below and also what are the first weather impacts that we can expect to see from the return of the La Niña.
LA NINA FORECAST 2024/2025
Before going into the forecast, let’s quickly look at the latest state. Below is the ENSO region anomaly data for the 2022-2024 seasons. Notice the rapid rise in ocean temperatures last year, as the El Niño was growing. The blue box is the last La Niña event, which occurred in the 2022/23 season.

The red box shows the latest values for the ENSO region in January, showing that El Niño has already reached its peak. Past El Niño event lines are gray, indicating that most El Niños in the past saw a rapid decline in the coming spring.
Below is a long-range forecast from different modeling solutions, and it shows the ocean temperatures in this region rapidly drop off the peak and into the negative territory. Overall, most models agree that major cooling is about to unfold in this region, with a La Niña fully active by the end of Summer.

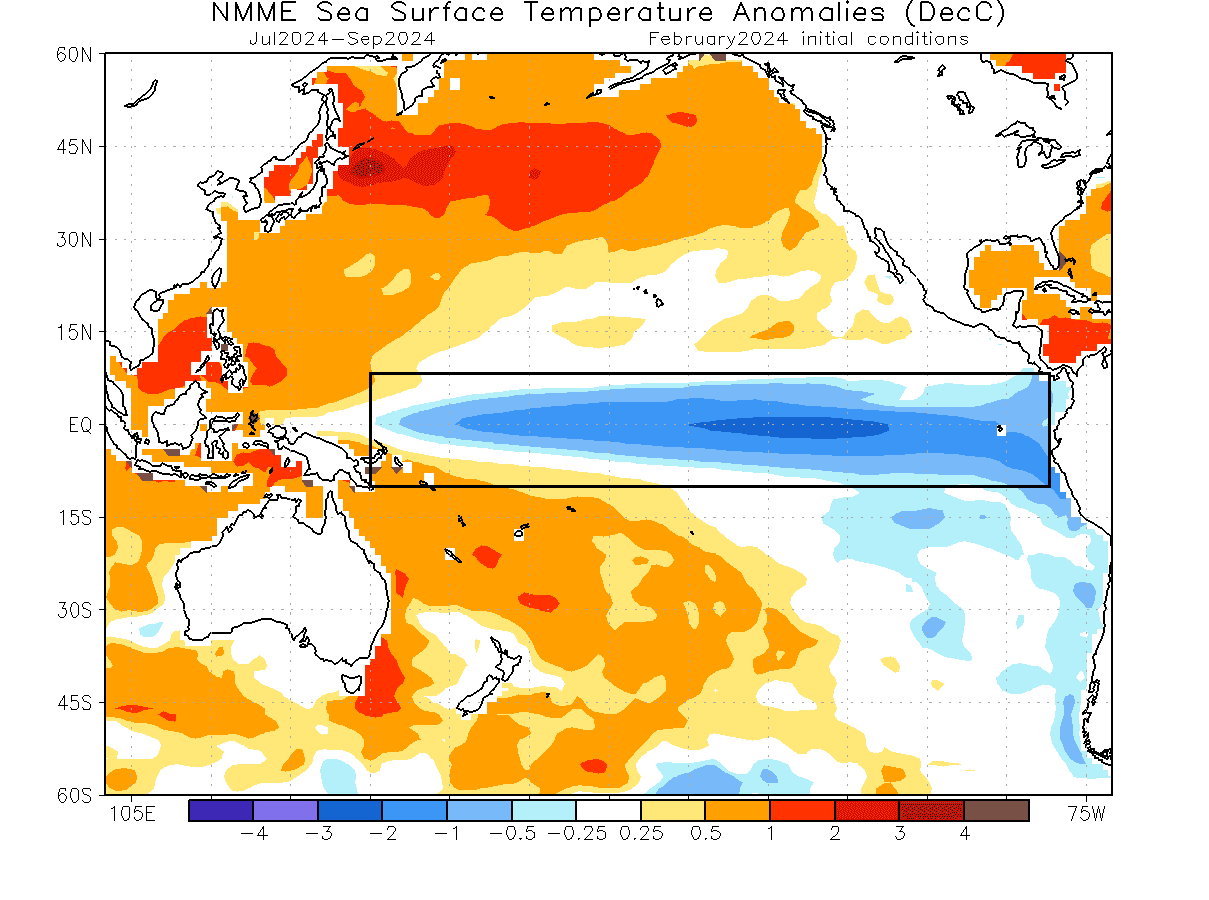
The ocean temperature forecast below is from the joint North American models (NMME). It shows the active La Niña phase in the July-September period. That is in agreement with other global forecasting solutions, having a healthy cold event as soon as in Summer.
Below is the global ocean temperature anomaly forecast from 8 major global modeling systems. The forecast period is late spring/early summer. You can already see cold ocean anomalies developing in the ENSO regions. Also note the Atlantic Ocean, where we see strong warm ocean anomalies.

The NOAA official probabilistic ENSO forecast also shows the El Niño rapidly weakening. The transition into a cold phase is unusually fast, with the La Niña mark already appearing for the June-August season. It is typical for a new phase to emerge in late summer/fall with seasonal pressure changes.

Looking below the ocean surface again, we have the October ocean forecast from CFS in the next image. You can see a large and healthy cold pool below the surface across much of the tropical Pacific Ocean. This signals that the La Niña will have a healthy core below the surface to last through the Winter season 2024/2025.

But if a La Niña event actually starts as early as Summer, when can we expect to see the first impacts on the seasonal weather, from pressure to temperature and precipitation?
The first weather impacts from the 2024 La Niña event are likely to be seen with the 2024 Atlantic Hurricane Season.
FIRST SEASONAL WEATHER INFLUENCE
As the La Niña event greatly impacts the pressure and rainfall patterns in the tropics, it has a very distinct impact on the hurricane season.
It is well-known that La Niña influences the hurricane season, as it provides certain atmospheric conditions that favor an active season.
The image below shows La Niña’s influence on the Atlantic hurricane season. The main effect is weaker upper-level winds over the main development region. This creates lower wind shear over the tropical Atlantic. It means that the tropical systems are much more free to strengthen and last longer.

Lower shear also means the tropical systems can organize more rapidly and have less interference. Combined with warmer-than-usual oceans for more energy, it supports easier development and stronger tropical systems.
The latest ocean temperature forecast from the North American NMME system below shows the active cold anomalies in the ENSO region. But in the tropical Atlantic Ocean, the forecast shows much above-average ocean temperatures.

An active cold ENSO phase means less wind shear and more atmospheric instability over the Atlantic development region. Combined with already warmer-than-normal ocean temperatures in the Atlantic, it is a perfect scenario for a strong and active hurricane season.
We can track the activity by looking at the precipitation forecast from the same NMME model. It does not tell us the number of tropical systems but can show us where more/fewer systems will pass over.

You can see a very obvious trail of more precipitation across the tropical Atlantic, curving up into the Gulf of Mexico, across Florida, and up along the east coast of the United States. It can signal more tropical systems, with favorable conditions to support strengthening and longevity.
We will release a more detailed look at the hurricane season in the near future when more data and forecasts are available. But early signs point towards a very active season.
But the next major weather influence of the La Niña is, of course, during the winter seasons.
COLD ENSO AND WINTER WEATHER
We are in the first months of the year, so there is no long-range forecast available for the 2024/2025 winter. And rightfully so, as it would be pretty meaningless at this range. But, we can look at the past influence that La Niña has had on winters and thus get a basic idea of what it means for the next winter.
Typically, the first influence of these ocean anomalies can be seen in the jet stream. The jet stream is a large and powerful stream of air (wind) at around 8-11km (5-7mi) altitude.
Historically, a strong blocking high-pressure system in the North Pacific is the most typical effect of a cold ENSO phase (La Niña). That usually redirects the polar jet stream down over the northern United States.
You can see that jet stream re-positioning in the image below, which shows the usual position of the jet stream during La Niña winters. Also, it shows the resulting weather patterns over the United States and Canada.
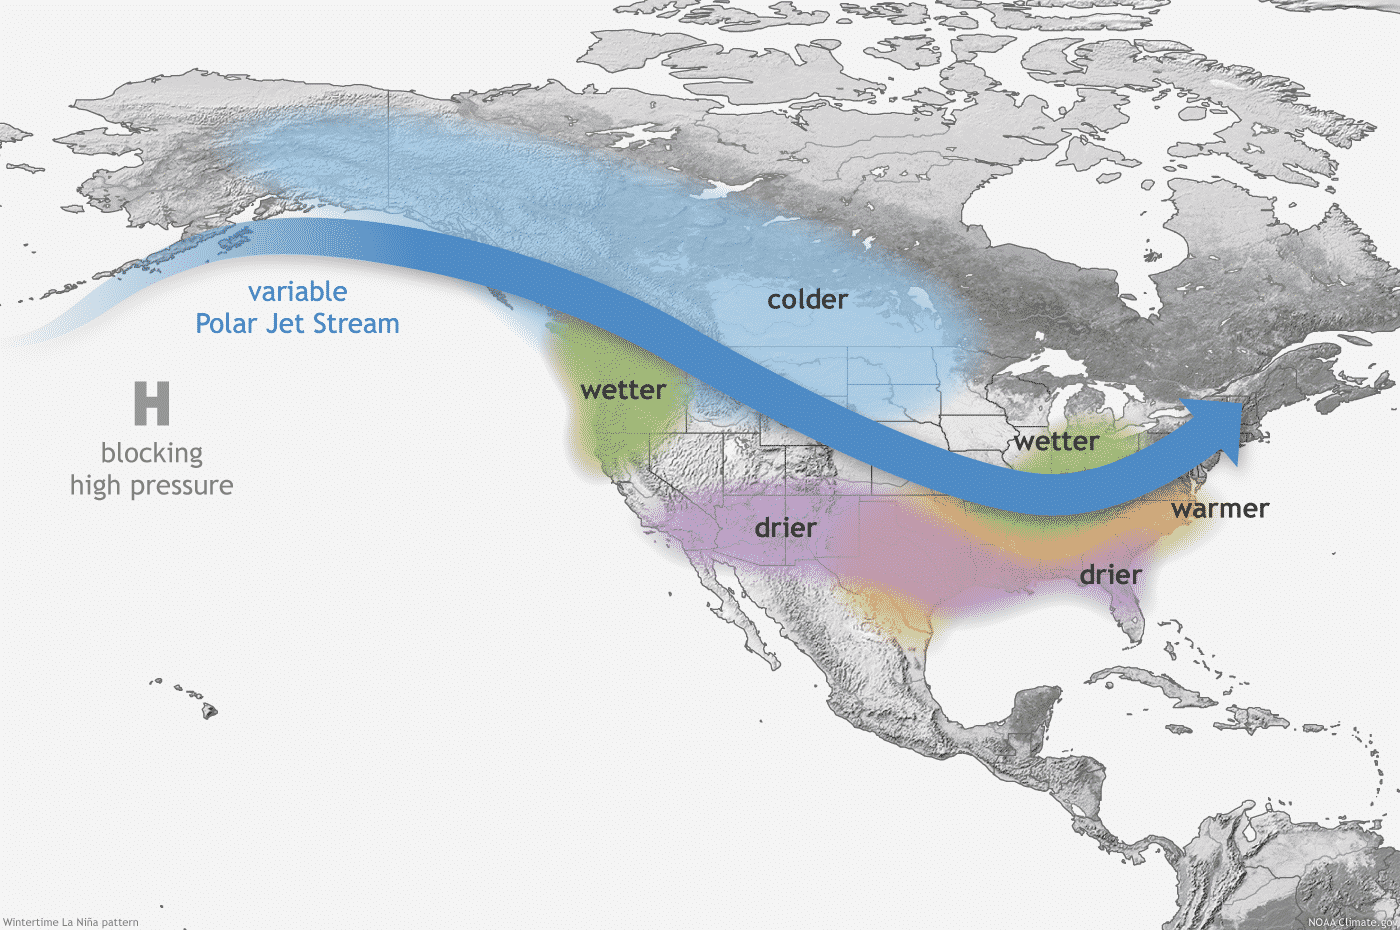
The jet stream shift brings colder temperatures and low-pressure systems from the polar regions down into the northern and northwestern United States and warmer and drier weather to the southern parts.
In the northern United States and southern Canada, cold events are more frequent with more precipitation, as the jet stream directs the low-pressure systems that way. But that can lock out the southern United States, creating warmer and more stable winter weather with less snow and cold fronts.
The image below shows the average pressure pattern during the La Niña winters in the past 40 years. You can see a strong high-pressure system in the North Pacific and a low-pressure area over Canada and the northern United States. Europe also shows lower pressure than normal across the central and southern parts.
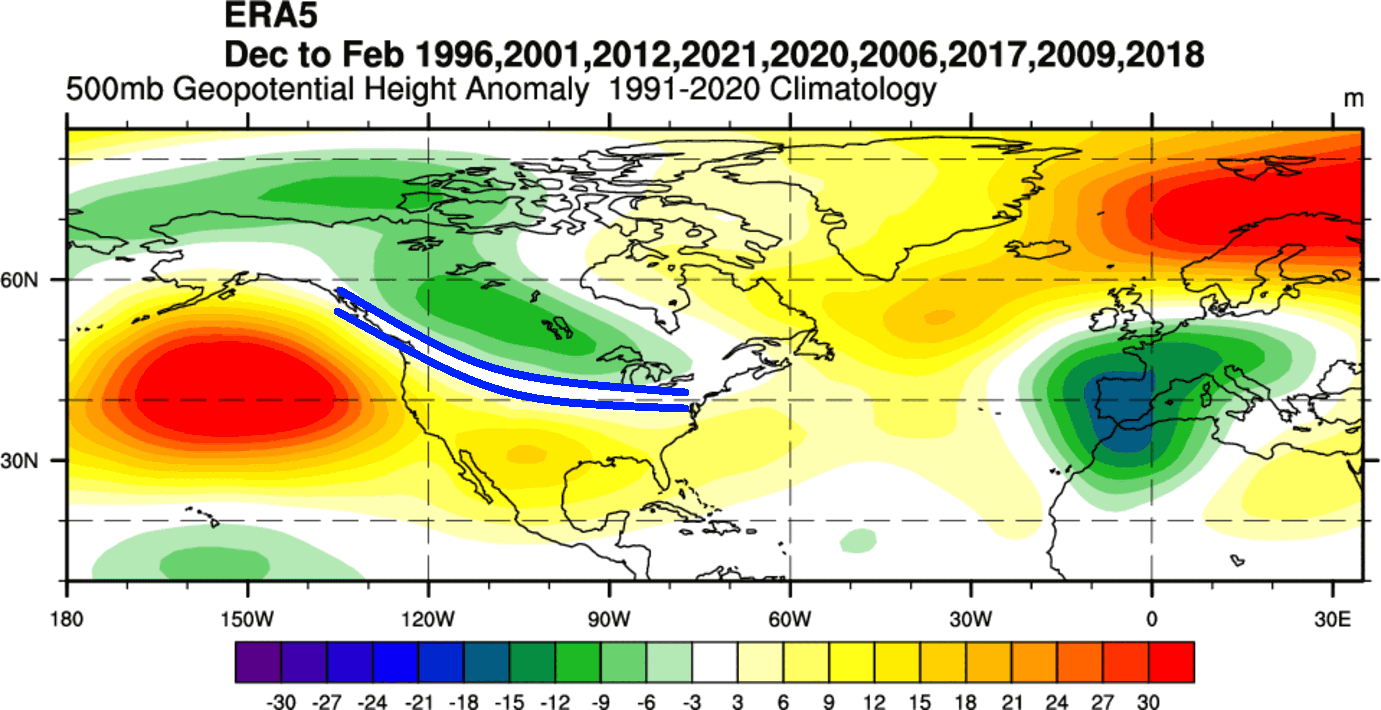
A strong high-pressure system in the North Pacific starts the development of a low-pressure region over Alaska and western Canada. That curves the jet stream downwards between the two pressure systems, marked by the blue lines.
Looking at the temperature pattern for the same winters as above, we can see the cold anomaly area under the jet stream in western Canada and the northwestern United States. A cooler area extends over the Midwest and down into the south-central plains. Image by NOAA Physical Sciences Laboratory (PSL).
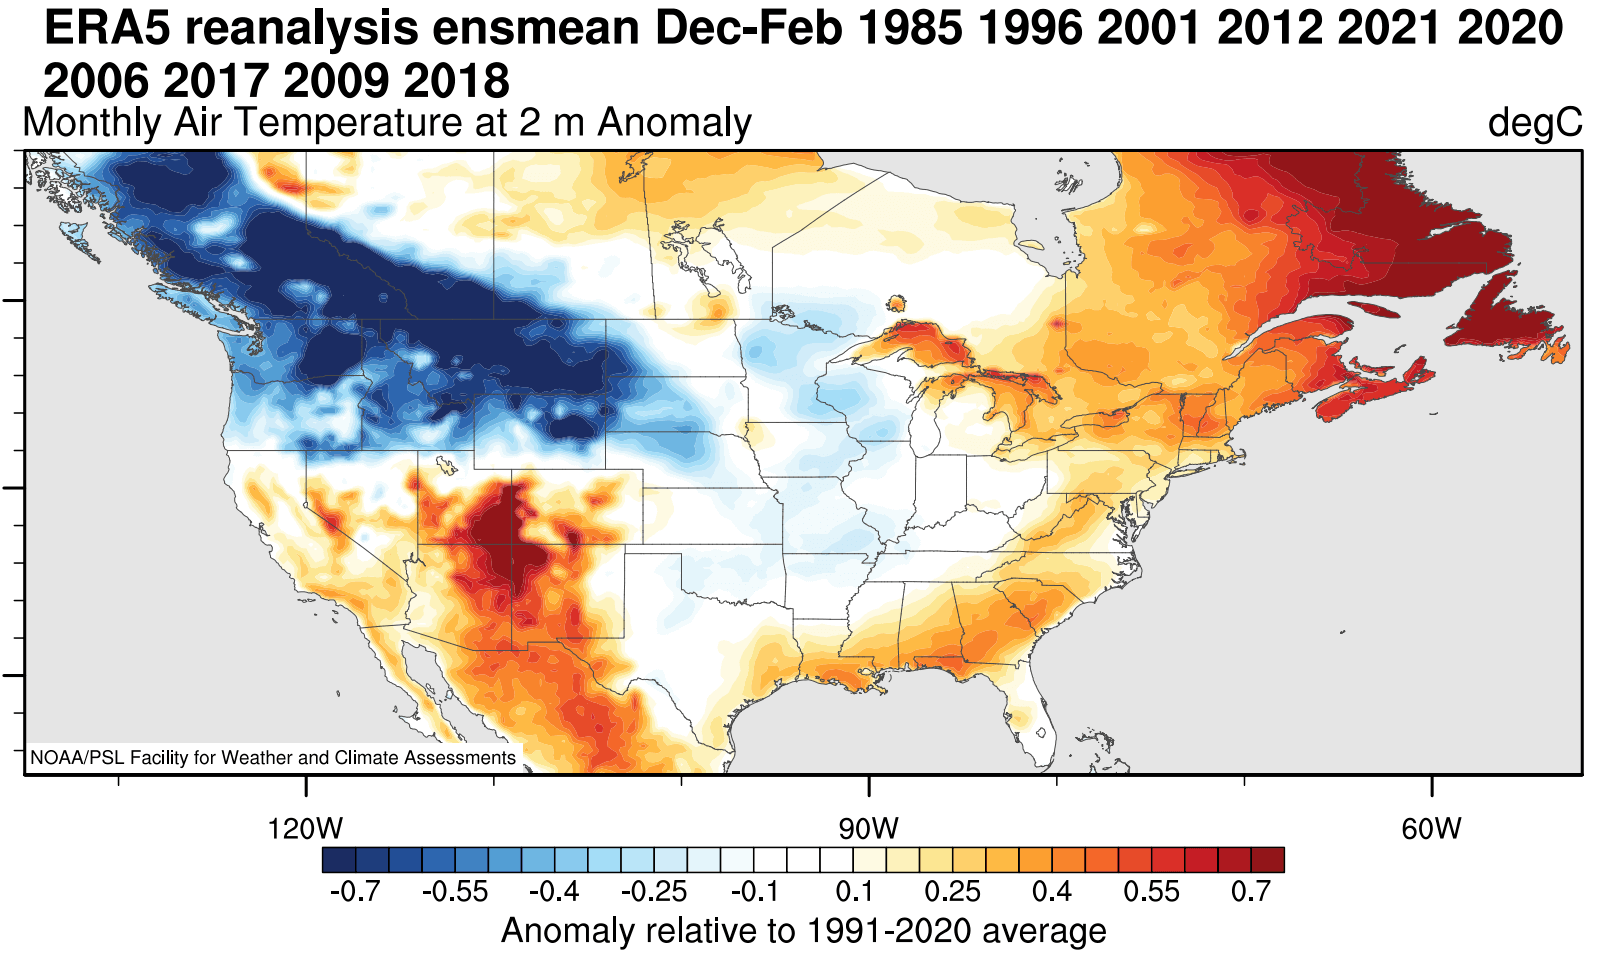
Warmer than normal weather and mild winter conditions are typically over the southwestern United States, eastern United States, and Canada. The main winter weather dynamics are usually in the Midwest and the central United States.
Precipitation-wise, La Niña winters are usually drier than normal over the southern and southeastern United States. La Niña produces a weaker subtropical jet stream and less moisture for the east. More precipitation is typically found over the northwestern United States, the Great Lakes, and parts of the northeastern United States.

But what about snowfall? The past data shows that the jet stream from La Niña also changes the snowfall potential over North America as the pressure systems take a different path.
The colder air is more easily accessible to the northern United States, which increases the snowfall potential when moisture is available. The graphic below by NOAA-Climate shows the average snowfall pattern for La Niña Winters, as is expected for the 2024/2025 season.

Besides the northwestern United States and the Midwest, we can see more snowfall potential over the northeastern United States and eastern Canada.
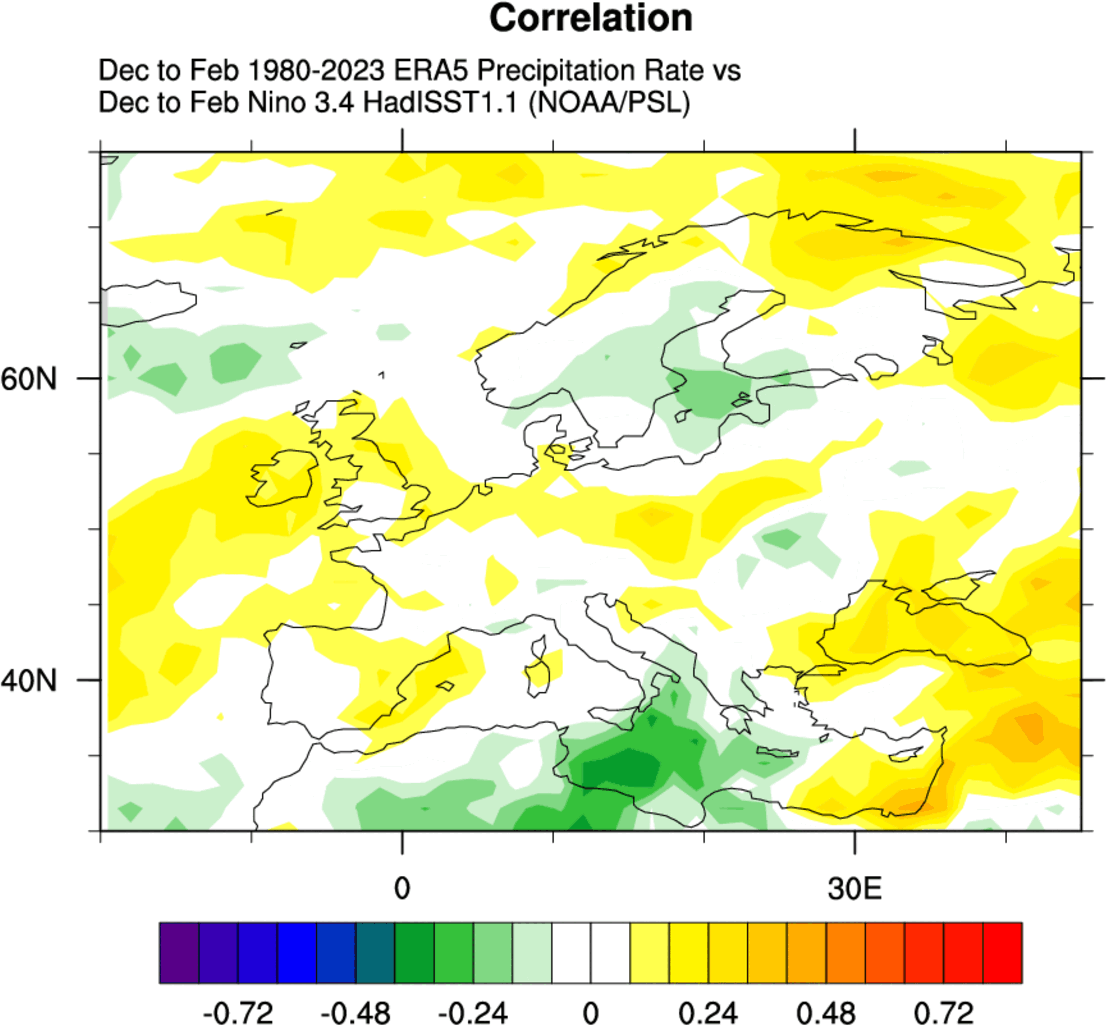
The connection between the ENSO regions and Europe is much more complex and noisy, as the continent is further away from the source region. Still, we can look at some signals that can be found in the data, but it is much less direct.
Looking at winter temperatures, there is a weak La Niña signal for lower temperatures than normal across much of central and western Europe due to the low-pressure area over these regions and the high-pressure area to the north.

Looking at precipitation, we have a much more noise in the signal, as expected. But generally, there is less precipitation across mainland Europe during a La Niña winter and more precipitation over the south and parts of the north.
This is all just based on past La Niña events, and we know that no two such events are completely the same. It does show that these ocean anomalies can have a profound influence on weather patterns, and the 2024/25 weather season will likely be no exception.
We will keep you updated on the global weather development and long-range outlooks, so make sure to bookmark our page. Also, if you have seen this article in the Google App (Discover) feed, click the like button to see more of our forecasts and our latest articles on weather and nature in general.
See more: