Winter Weather patterns over the Northern Hemisphere are a combination of different drivers. New data and studies show that a larger October snow cover is also one of these drivers. It impacts the Polar Vortex more directly, thus potentially having a long-term effect on winter weather over the United States and Europe.
The atmospheric circulation is very delicate and complex, so larger anomalies can create a strong imbalance in the flow. A larger snow extent in Fall can destabilize the Polar Vortex, helping to create a more disrupted (colder) Winter pressure pattern.
First, we will quickly recap the Polar Vortex and how it works. Then you will see how exactly a larger snow cover in October brings more snow and cold to the United States and Europe in the Winter. Also, we will analyze the current state of the snow extent and how large it will get this month.
LOW AND HIGH POLAR CIRCULATION
As we head into autumn, the polar regions start to cool. Less energy reaches the North Pole as the Sun gets lower. But as the polar temperatures drop, the atmosphere further to the south is still warmer as it continues to receive light and energy from the Sun.
This causes a strong global pressure difference between the polar and sub-tropical regions, and a large low-pressure (cyclonic) circulation starts to develop across the Northern Hemisphere. It extends from the surface layer far up into the Stratosphere. This is known as the Polar Vortex.
Below is a 3-dimensional image of the Polar Vortex, extending from the lower levels up into the Stratosphere. The vertical axis is greatly enhanced for better visual presentation. You can see what the actual winter structure of the Polar Vortex looks like.

The upper (stratospheric) part is more circular and symmetrical as it spins higher above the ground and has little interference. But the lower structure of the polar vortex is much more uneven and disrupted. That is due to the influence of the terrain/mountains and strong pressure systems acting as obstacles in the flow.
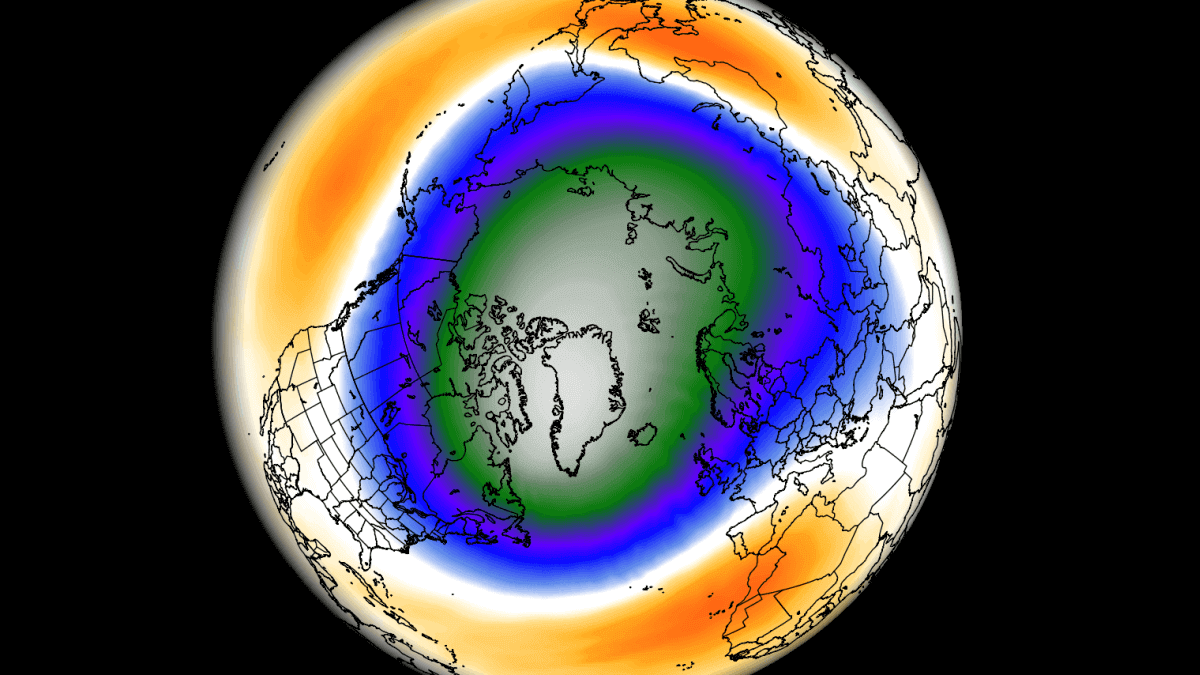
The image below shows the high-altitude Polar Vortex at around 30km/18.5miles in the middle Stratosphere during Winter. It is typically circular, with the temperature in its core reaching down to -90 celsius (-130F).
The stratospheric “jet stream” is typically found in the outer edge, also called the surf zone. Winds are very important when talking about the polar vortex, as they are usually the first to show that something is changing in the polar vortex.
To summarize, the Polar Vortex behaves like a very large cyclone, covering the whole north pole down to the mid-latitudes. It is connected through all levels of the atmosphere, from the ground up, but has different shapes at different altitudes.
We monitor any Polar Vortex activity because it can have weather implications across the entire Northern Hemisphere. Especially during the winter season, and that is regardless if it is weak or strong.
A strong Polar Vortex usually means strong polar circulation. This usually locks the colder air into the Polar regions, creating milder conditions for most of the United States and Europe.
In contrast, a weak Polar Vortex can create a weak jet stream pattern. It has a more challenging time containing the cold air, which can now escape from the polar regions into the United States and/or Europe. Image by NOAA.

To put the Polar Vortex into perspective, we produced a high-resolution video below from NASA data, showing the vortex spinning over the Northern Hemisphere in the Stratosphere at the 30mb level (22km/14miles altitude).
And the most important thing to take away from the video should be that the Polar Vortex is not just one winter storm or a cold outbreak that moves from the Midwest into the northeastern United States.
The Polar Vortex is a large cyclonic area spinning over the entire Northern Hemisphere, from the ground up to the top of the Stratosphere and beyond, reaching over 50km/31miles altitude. It plays a major role in weather patterns and circulation across the Northern Hemisphere.
SNOW COVER FROM OCTOBER TO WINTER
But even before we get to Winter, the activity around the Polar Vortex is very important. Many factors can have an effect in the long term. There is one special way that the Fall weather patterns below in the lower levels can impact the Polar Vortex in the long run.
Fall weather can influence the Polar Vortex by building an extensive snow cover over Siberia. Multiple studies have proved that the snow cover extent in October over Siberia affects the weakening of the stratospheric polar vortex at a later period.

A stronger winter high-pressure system can develop over the region due to snow cover. The stronger high-pressure area then affects the polar vortex, as it helps to send more vertical energy up into the Stratosphere.
In the image below, you can see the vertical wave activity example. First, the energy goes upwards into the Stratosphere, which impacts the polar vortex, which then affects the polar circulation back down, changing the weather patterns.
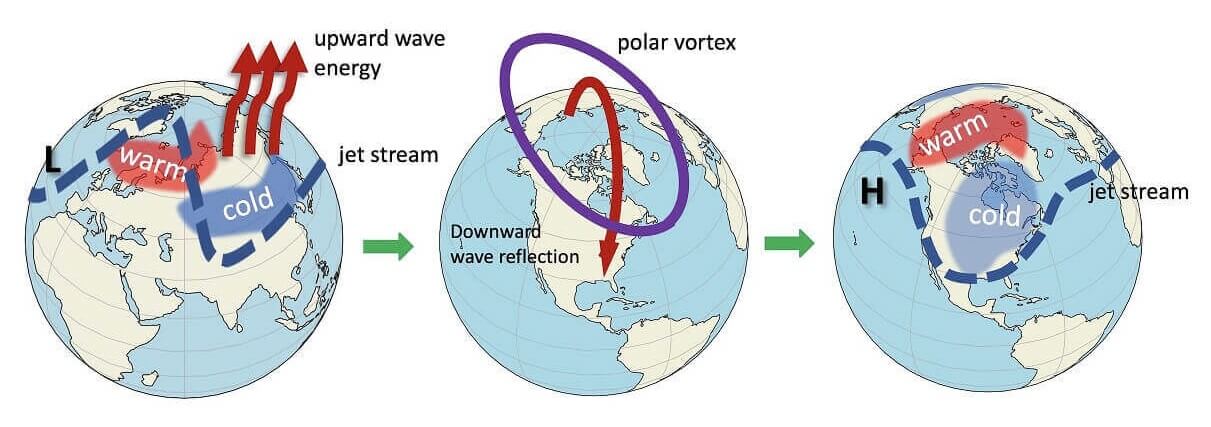
This example above is more appropriate for Winter when the pressure systems are strongest and much more energy is in the flow. As a result, the response downward from the polar vortex is also amplified.
A weaker polar vortex naturally means weaker polar circulation and a greater chance of cold air outbreaks over the United States and Europe during Winter. Below you can see the basic schematic of the changing polar vortex circulation.

The next image below shows the snow cover extent for Eurasia and North America in October, compared to the stratospheric polar vortex strength in December, measured by the strength of the stratospheric polar jet. Years are in order by the highest Eurasian October snow cover on the left and lowest on the right.

Looking at the graph above, we can take the top 5 snow cover years and compare the following winters to the lowest 5 snow cover years. Top 5 years with the highest October snow extent are 1976,2014,2016,2002, and1968. The years with the lowest October snow extent were 1988, 1987, 1980, 1991, and 1994.
Starting with the low snow extent years, we have produced a pressure pattern composite of all following winters. We can see a strong polar circulation, with a dominant low-pressure area in the polar regions. High pressure is seen over the United States, western Canada, and Europe.
Looking at the resulting temperature anomalies, we can see the cold air is locked up high in the polar regions. Warm anomalies are present in the central and northern United States and Europe.
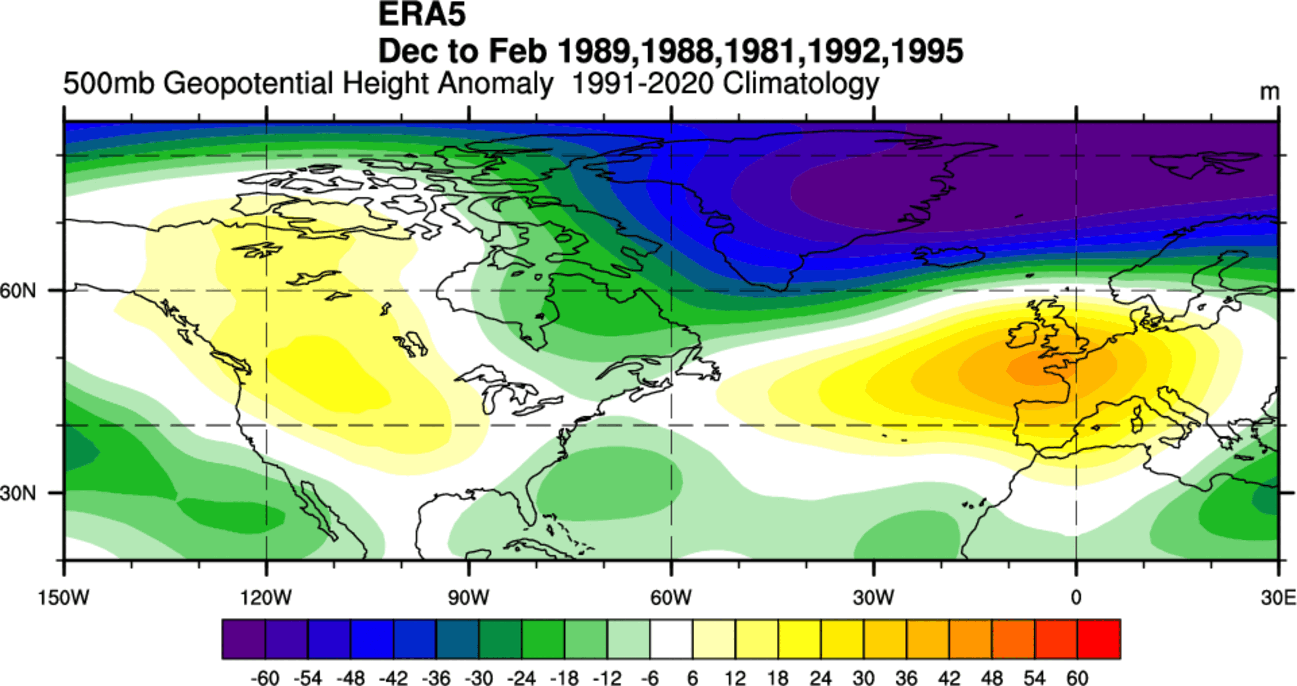
In contrast, we have the winter pressure composite for the 5 winters following the highest Fall snow extent. You can see an almost opposite pattern: high pressure over the polar regions and disrupted circulation. Low-pressure areas span from the United States to Europe.

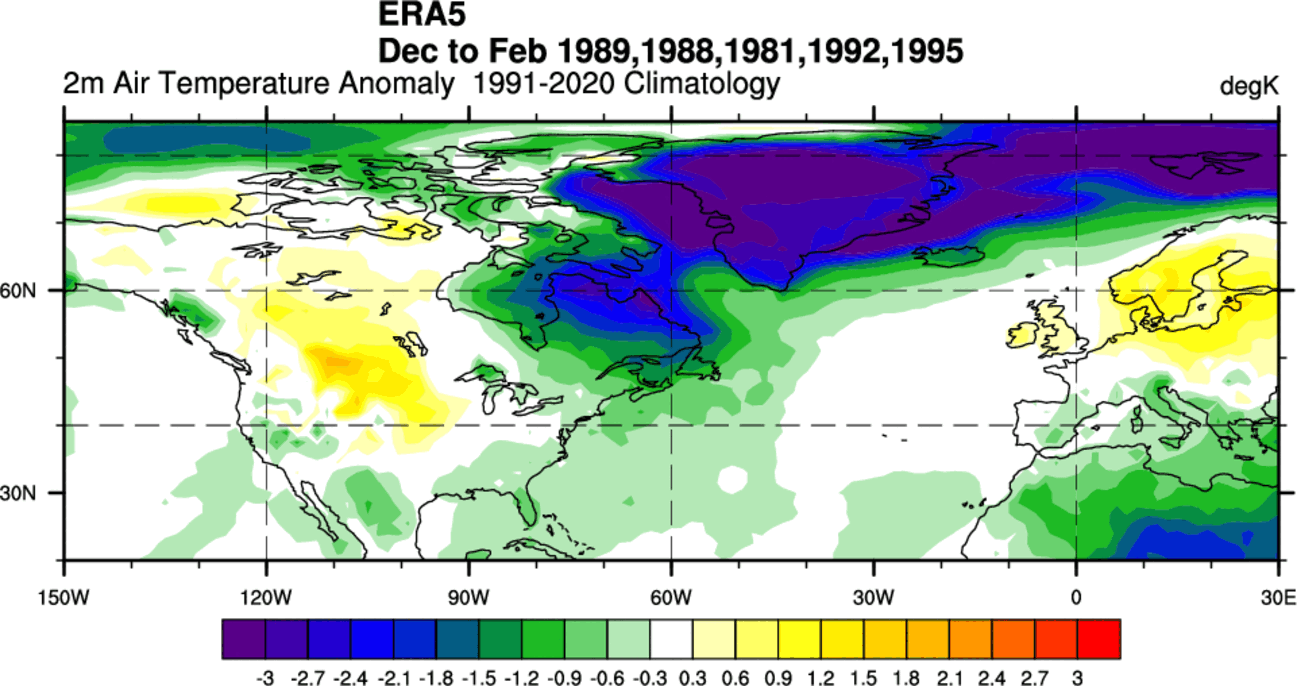
The winter temperature anomalies from this pressure pattern are quite different, with the colder air now being released into the mid-latitudes. We can see cold air over much of the northern and eastern United States and Europe.

From this, you can see that having a larger Fall snow extent can actually mean a colder Winter and more snowfall over the United States and Europe. So, having a large October snow extent should be on your bucket list if you are a colder winter weather fan.
So, where does this difference actually come from? As mentioned, the October snow extent can have an effect on the winter Polar Vortex, which can change the circulation across the Northern Hemisphere.
WINTER POLAR VORTEX VARIATION
Using the same 5 highest and lowest Fall snow extent years, we will also look at the stratospheric Polar Vortex and its circulation. We normally use the 10mb pressure level (30km/18.5miles altitude) to represent the stratospheric layers.
First, looking at the Winter Polar Vortex following low Fall snow extent years, we can see that it is stronger/deeper than normal. This also means stronger coupling with the lower levels, producing stable circulation and locking the colder air into the polar regions.

On the other hand, looking at the high snow extent years below, we can see a higher pressure tendency in the stratosphere. This means a weaker Polar Vortex and, with coupling, a weaker lower circulation. Such a pattern helps to unlock the cold air out of the polar regions at the surface.
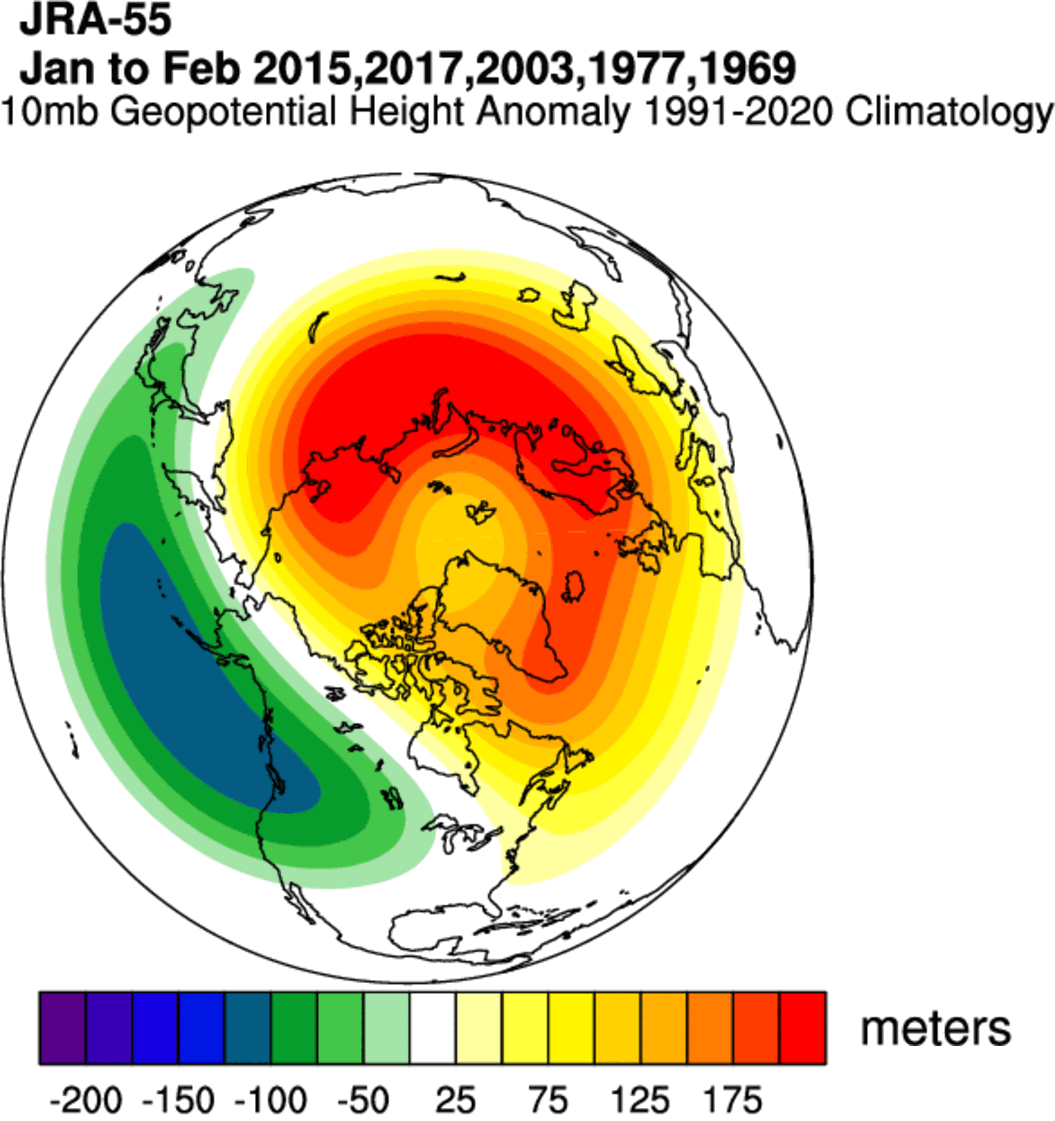
Looking at the stratospheric temperatures for the same years, we can see a strong warming tendency around and over the polar regions. This further shows the weakening process of the Polar Vortex in the stratosphere in Winters following a high Fall snow extent.

But the strength of the global circulation is not measured just by pressure and temperature but also by the winds. As mentioned before, we use wind speeds to monitor the state/health of the polar vortex. So below, we will compare two images with vertical wind patterns for low and high snow extent years.
First, look at the zonal (west-east) wind anomalies for winter after the low Fall snow extent below. You can see stronger zonal winds from the stratosphere (top) to the near-surface levels at the bottom. This means stronger circulation and a stronger jet stream.

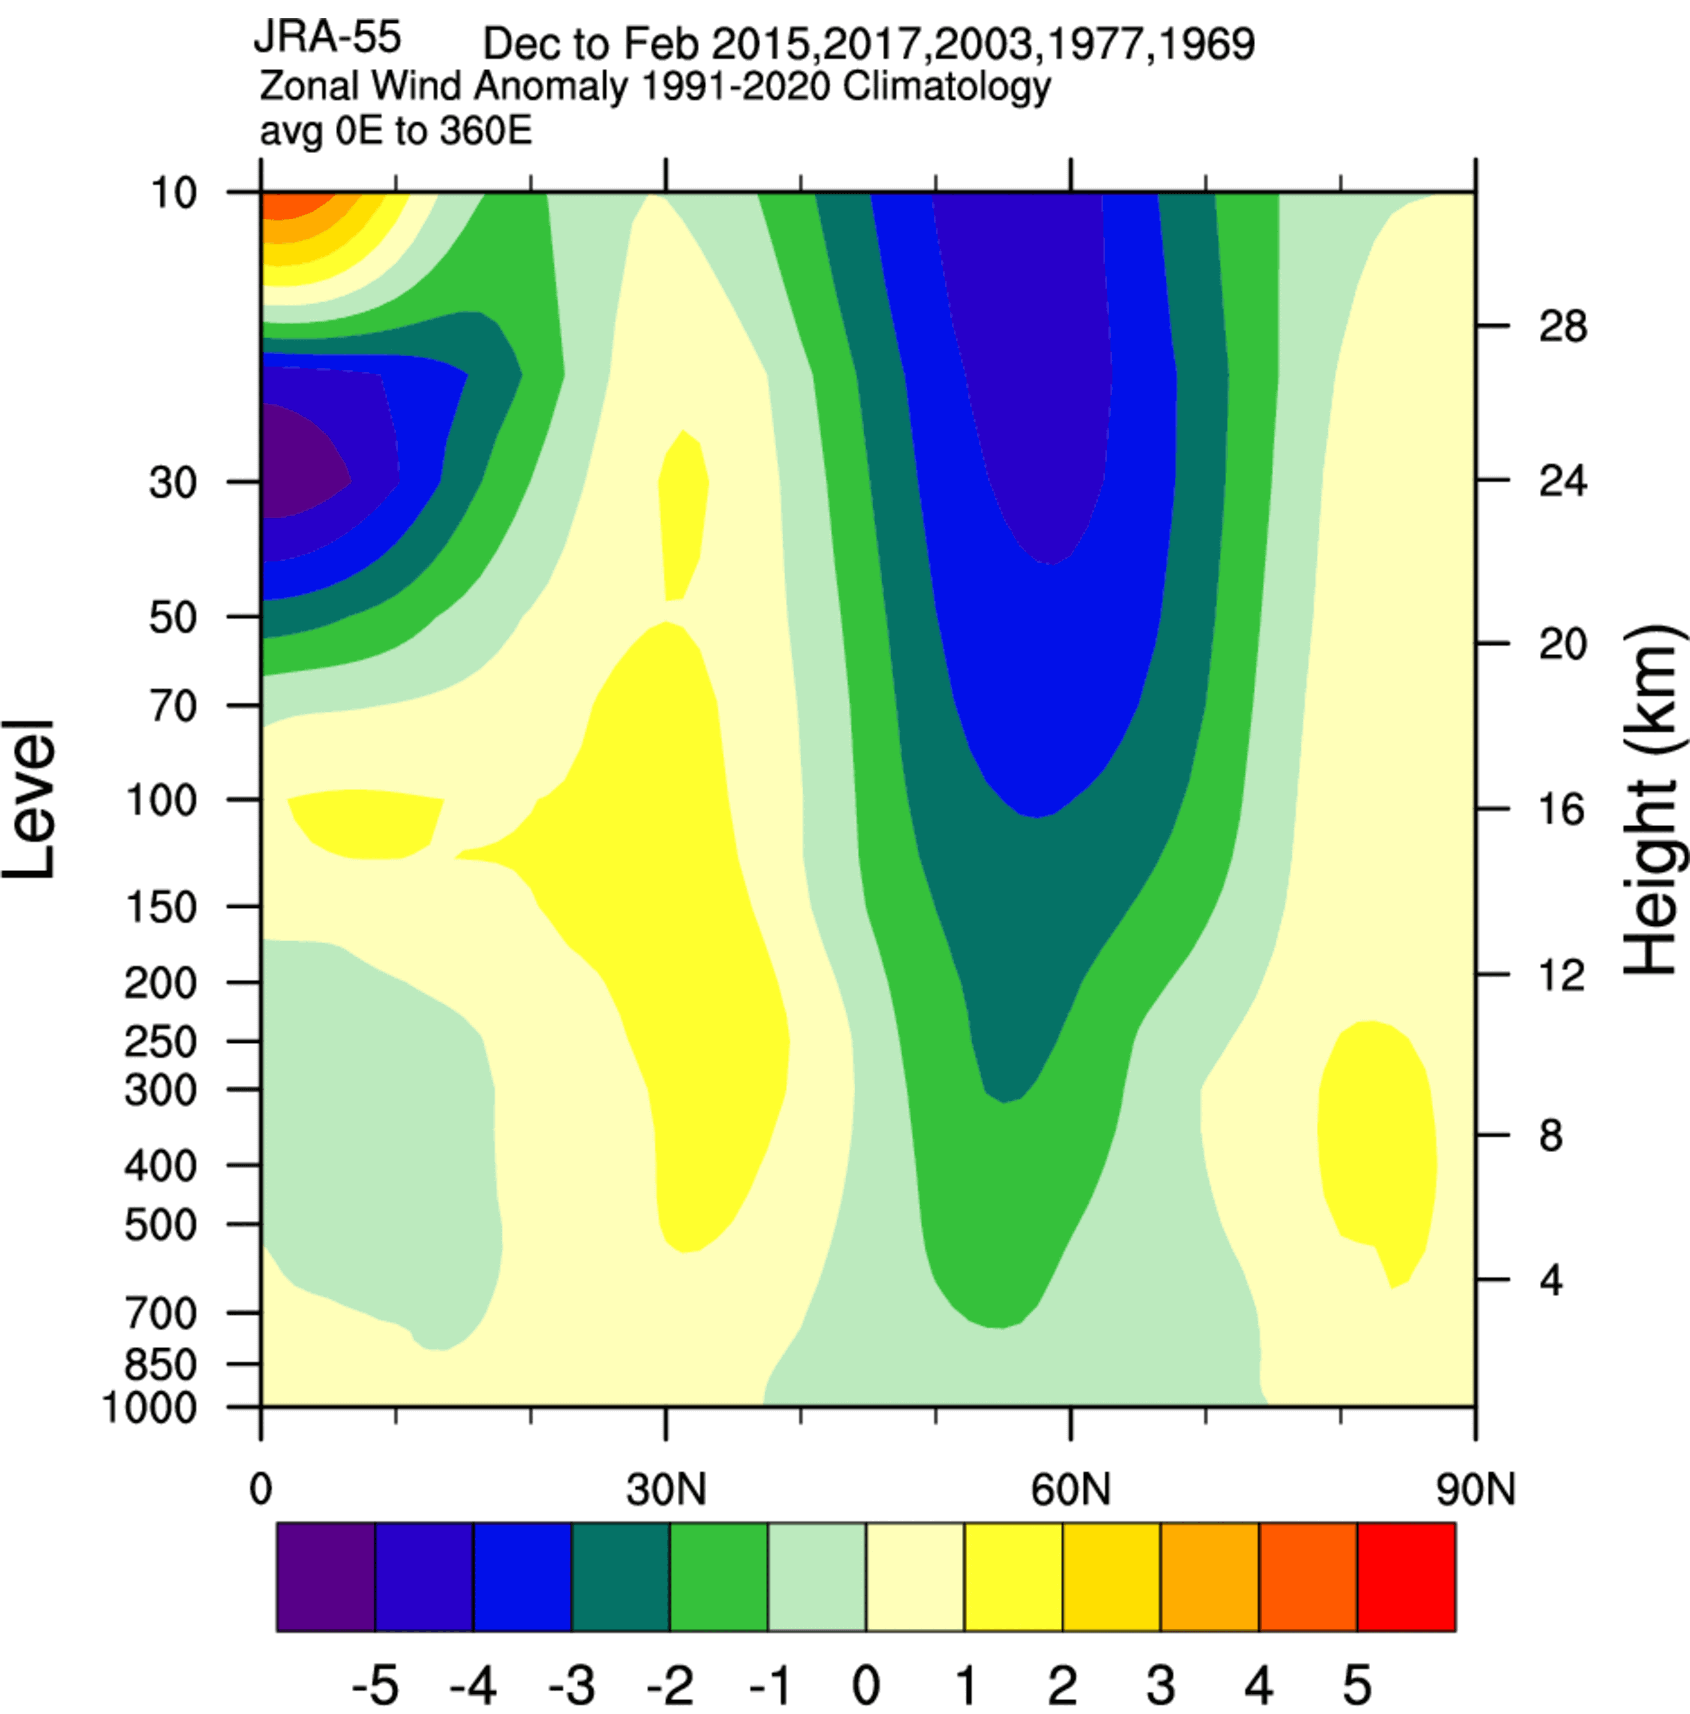
In contrast, looking at the high-snow extent years below, we can see an almost opposite pattern. Weaker zonal winds span from the stratosphere down to the surface. This indicates a weaker jet stream pattern, weaker circulation, and a more “unlocked” pattern for cold air in the United States and Europe.
So now that we know what a difference the Fall snow extent can make in the circulation and weather, what is the current data? And what does the snowfall forecast show for the rest of the month?
SNOW EXTENT ANALYSIS
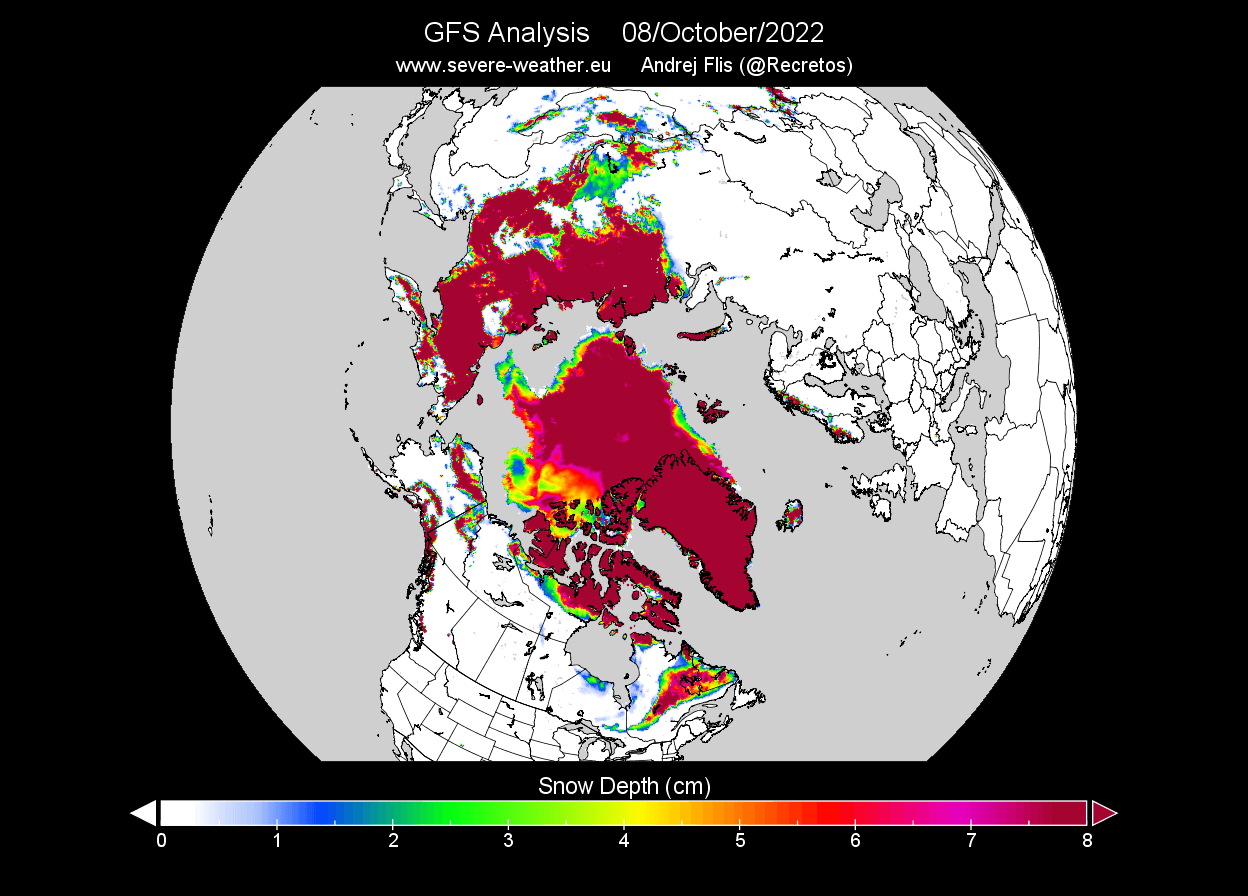
Below is the high-resolution snow depth analysis from the United States GFS model, run by the NCEP. It shows the area of the Northern Hemisphere covered by snow. We can see a decent extent over Siberia but a slightly lower extent over North America.
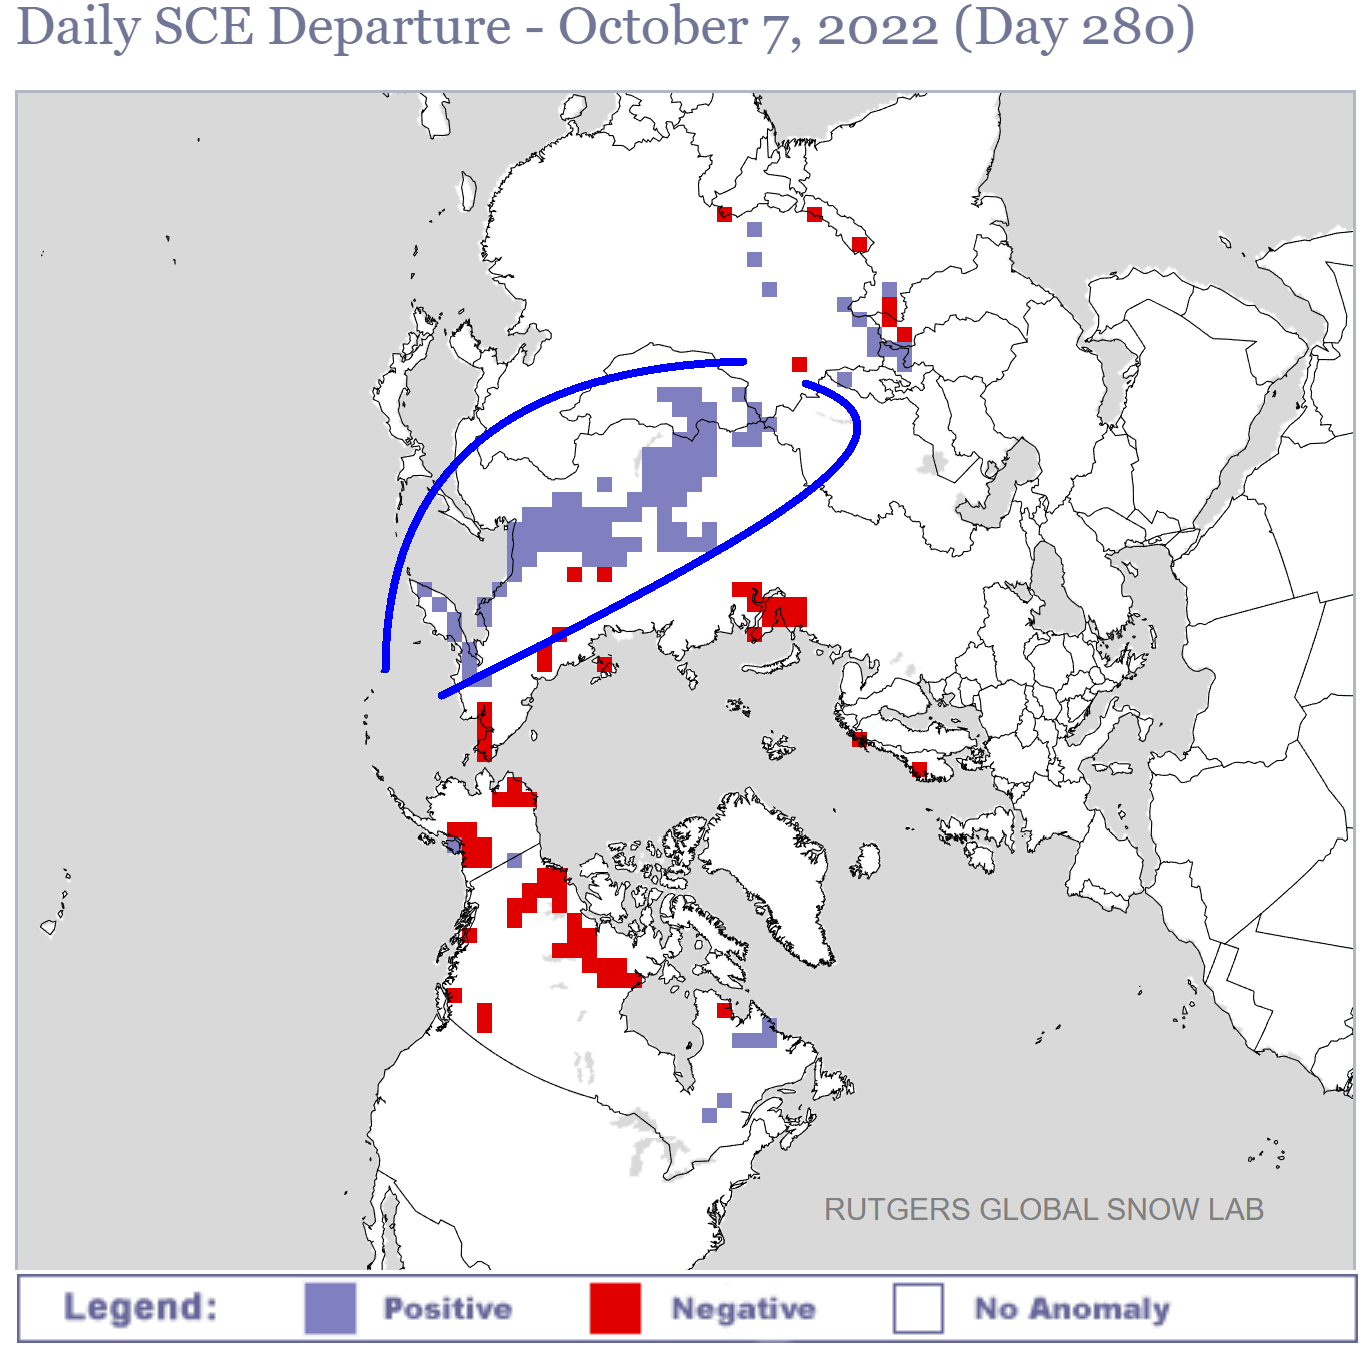
We can see that if we look at Rutgers‘s snow cover anomaly analysis. It shows the snow cover from normal over the Northern Hemisphere. There is a large anomalous area of increased snow cover over Siberia, also seen in the analysis above.
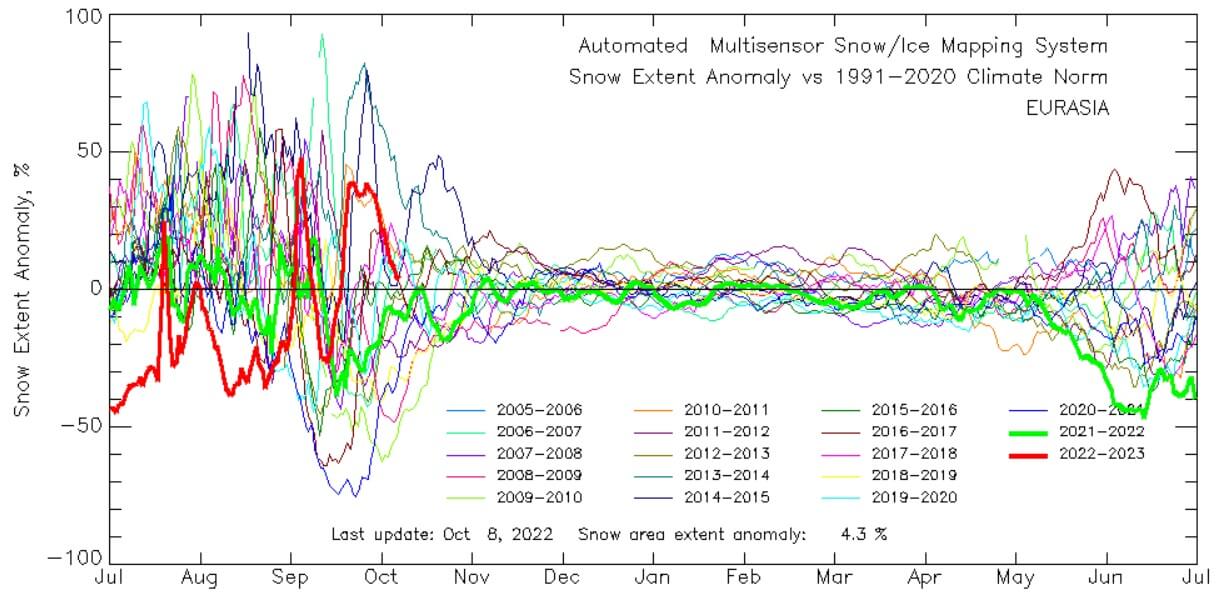
Currently, we are already seeing more snowfall than usual over Siberia. The graph below shows that the extent of snow cover over Eurasia is just over 7 million square kilometers, running above average for this time of year.

The next image below shows the Eurasian snow extent area anomaly. The latest data point shows a +4.3% larger than normal snow area extent. It is currently running around 10% larger than this time last year.
WEEKLY SNOWFALL FORECAST
But what about the forecast? Before we look at the forecast, we have to look at the weather patterns that support more snowfall, producing a larger area extent.
The image below shows the October pressure pattern for the top 5 Eurasian snow extent years. You can see a high-pressure area in/over the polar circle, with low-pressure areas below it. This pattern produces the largest snow area extent in Fall.

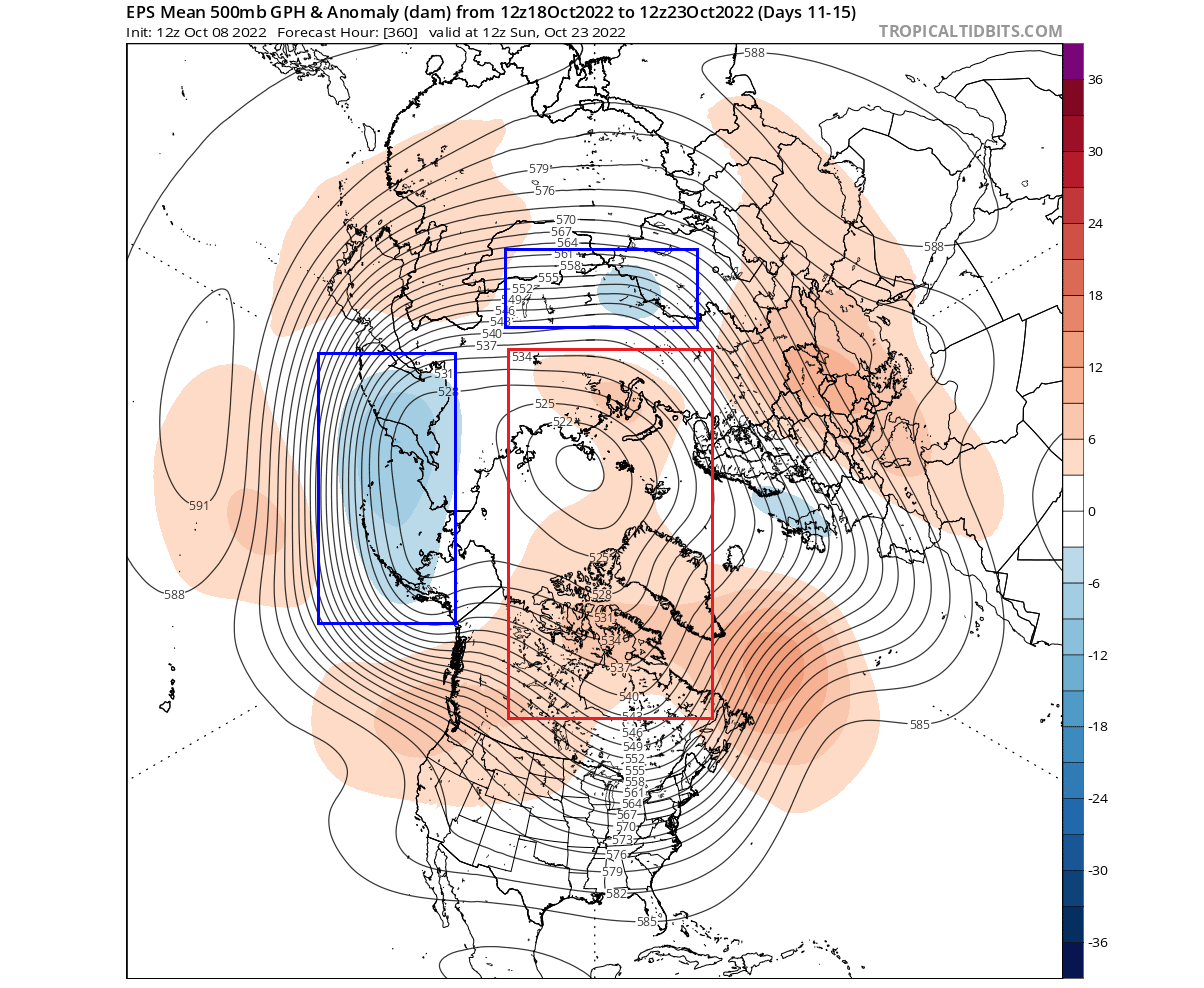
Looking at the 10-15 day pressure anomaly forecast, we can see a similar pattern developing over the Northern Hemisphere. A high-pressure anomaly remains over the polar regions, with low-pressure areas surrounding it.
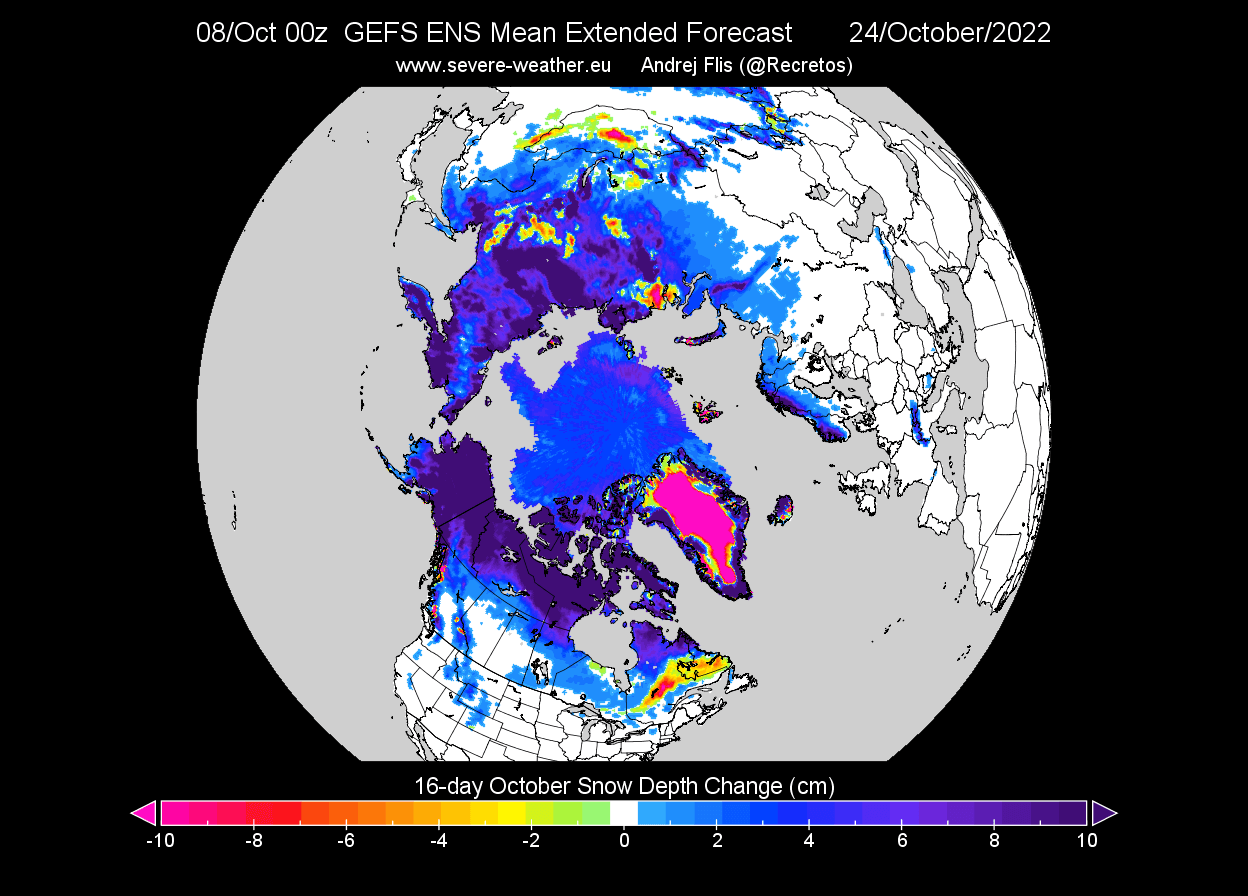
Looking below at the 16-day snowfall change forecast, we can see a substantial increase in snow depth and extent. Blue colors indicate snowfall and snow depth increase. All areas from North America to Siberia will expand the area covered by snow.
This is due to the supportive pressure pattern. But looking ahead at the extended range for the late month, we can see this pattern remaining. A high-pressure anomaly over the polar circle and a low-pressure area next to it over eastern Siberia.

The extended snowfall forecast confirms the positive pressure pattern trend, further increasing the snow cover over Eurasia. We can also see a large expansion over North America, with snowfall down into the northwestern United States and parts of the upper Midwest.

But, what we cannot see from this forecast, is the departure from the normal extent for this time of the year. We will be able to see the anomalies from the analysis once available, which will give us a more definitive idea of the potential role/impact of this year’s October snow extent.
But what does the long-range forecast show for early Winter and the Poplar Vortex, and are there any hints of potential snow extent impacts?
EARLY WINTER 2022/2023 STRATOSPHERIC ANOMALY
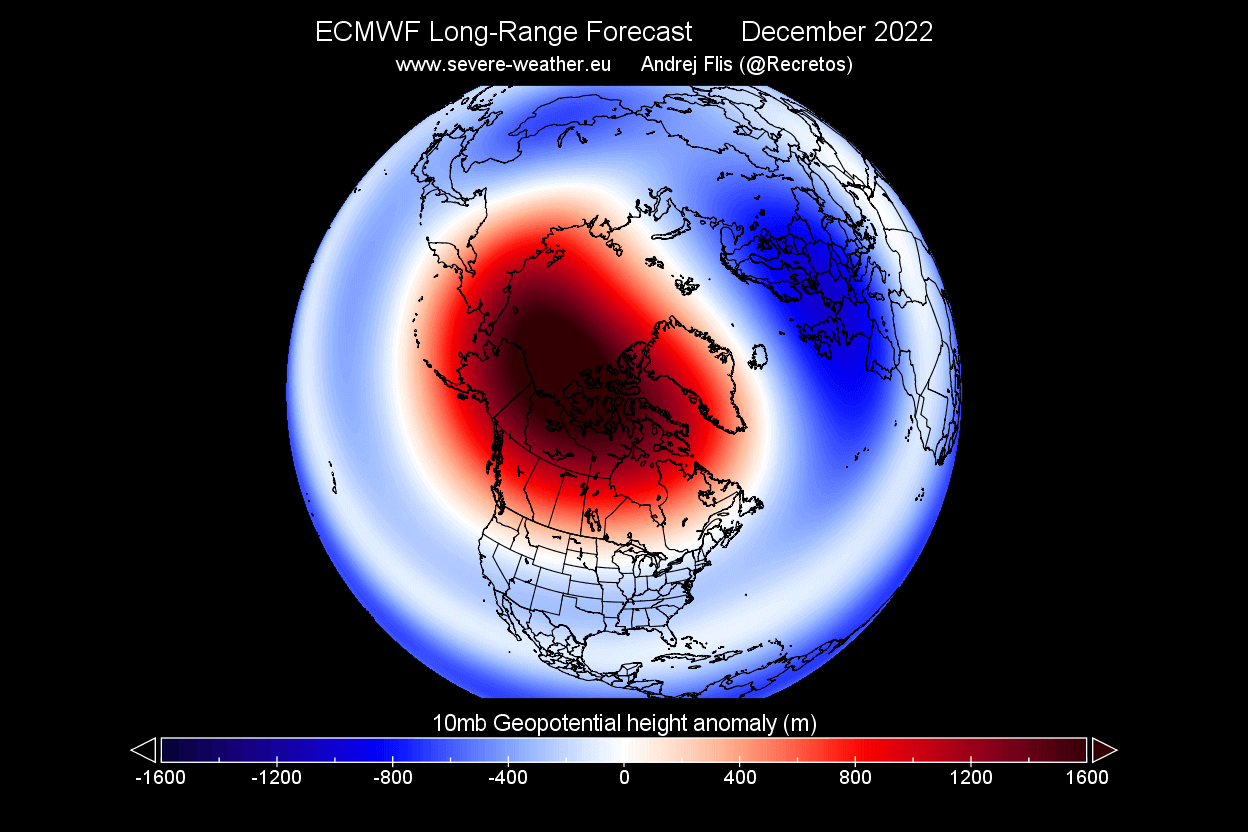
Going directly to the stratospheric pressure anomaly forecast for December, we can see an unusual pattern. We can see a higher pressure forecast, indicating a weaker-than-normal Polar Vortex and a weaker polar circulation.
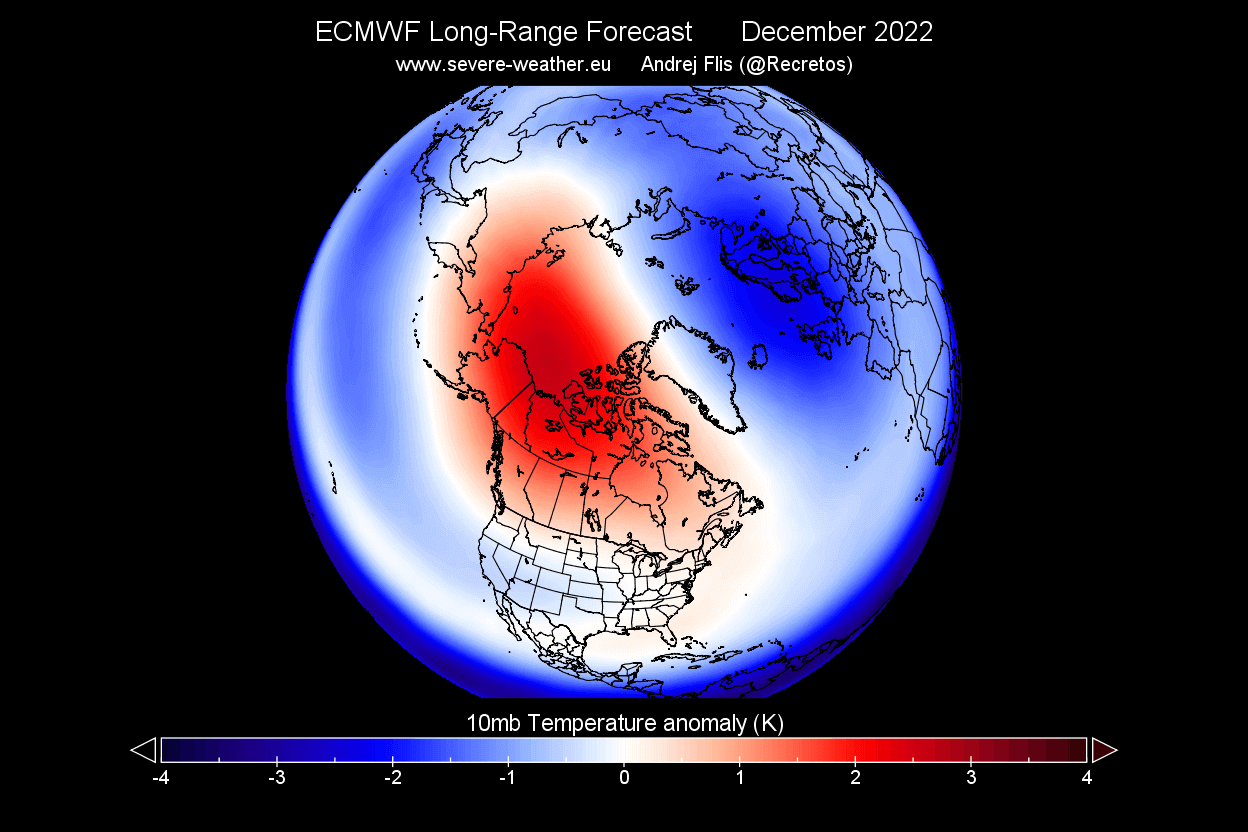
The temperature anomaly forecast for the stratosphere also shows higher temperatures over the western half of the polar circle. This forecast indicates potential disruptions events for the Polar Vortex in early Winter 2022/2023, also creating an unstable surface pressure pattern.
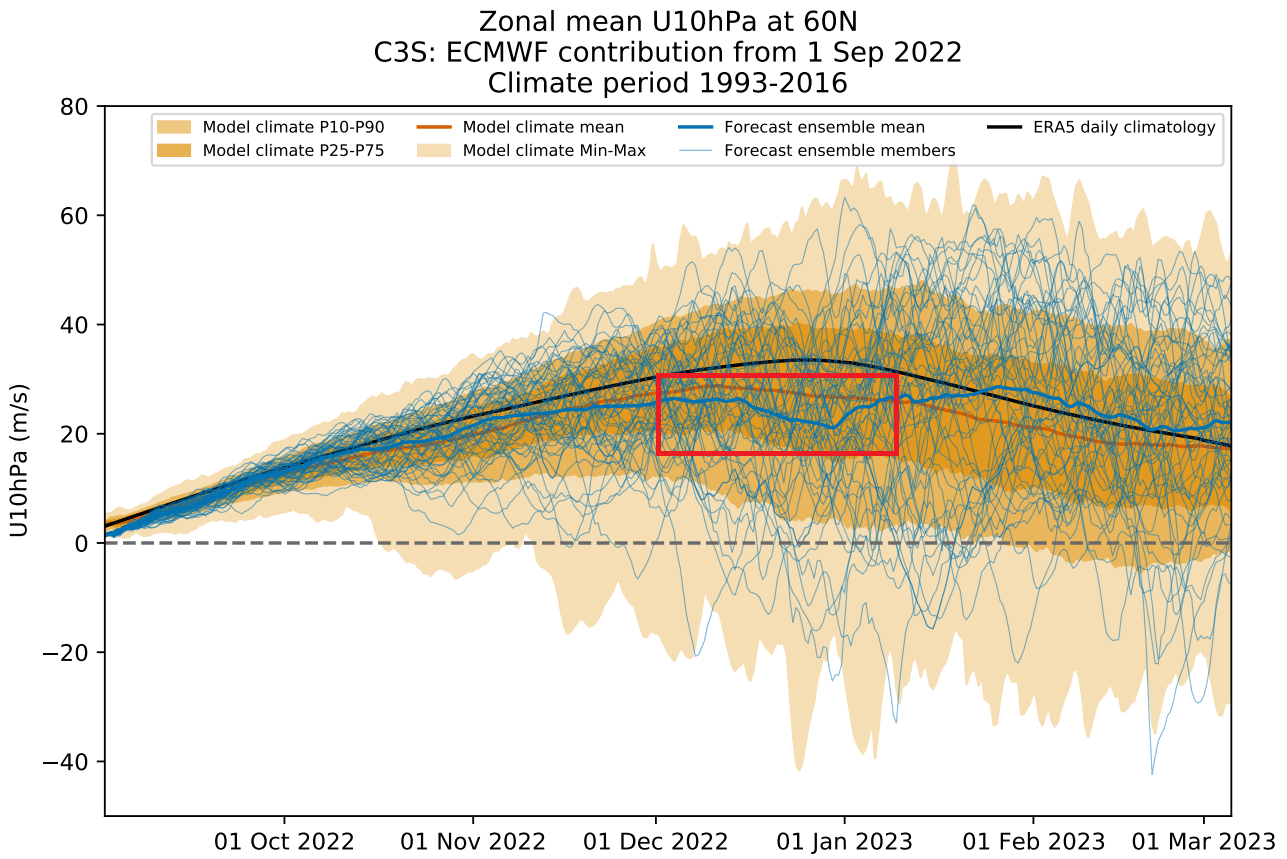
Below is the ECMWF forecast for the 10mb stratospheric zonal winds. It shows a reduction in the stratospheric wind speeds in December. As winds are directly related to the strength of the Polar Vortex, we can see this as a signal for a weakening of the Polar Vortex.
Finally, looking at the surface pressure anomaly forecast for late Fall and early Winter 2022/2023, we can actually see the impacts that are expected with weaker polar circulation. You can see a high-pressure anomaly around the polar circle, especially the North Atlantic and the North Pacific.
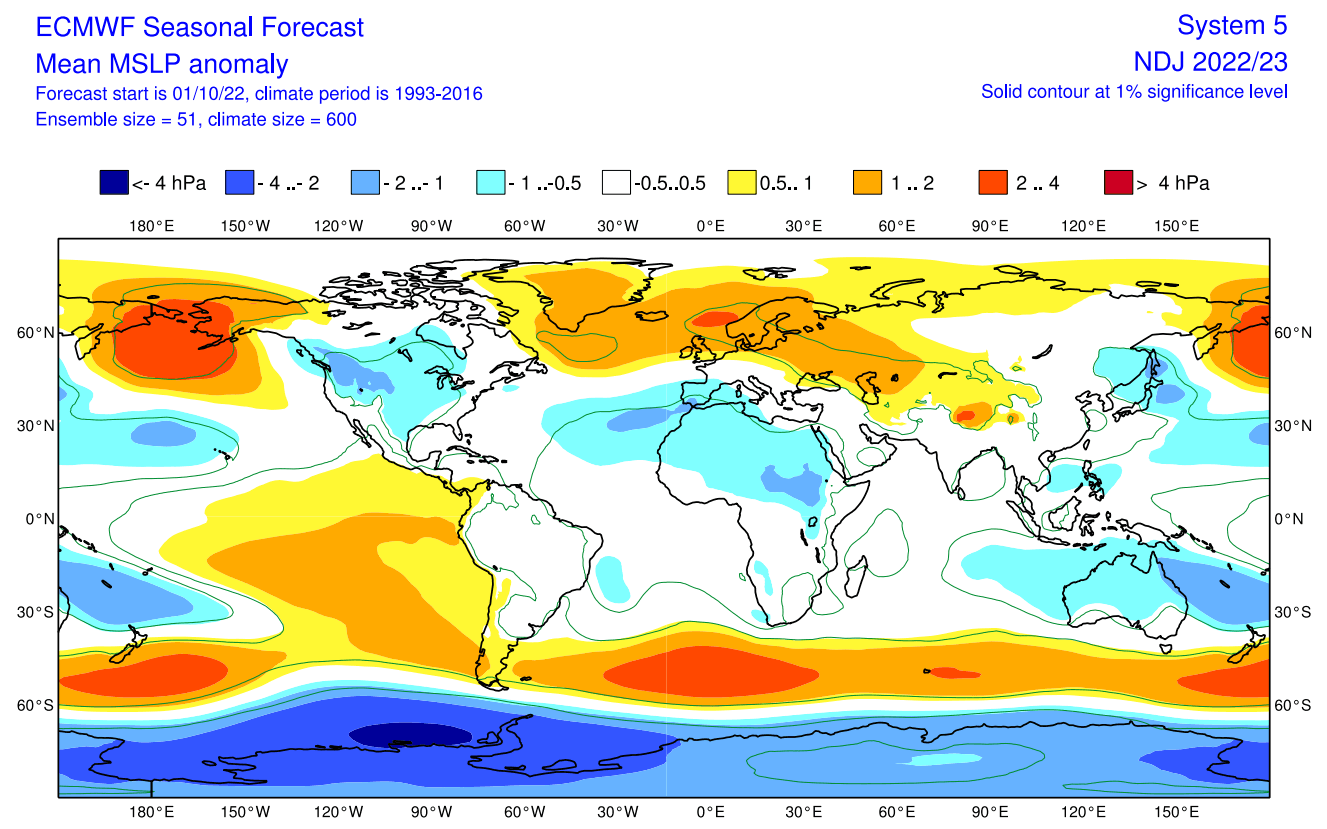
This negative NAO pattern also promotes low pressure over the United States and western Europe. If you remember the typical high snow extent pattern, this is very similar to those years, so we can assume that the October snow cover extent could play a role in this pattern development.
POLAR VORTEX AND WEATHER SUMMARY
To summarize, there is one main thing to take away from this development. As data shows, increased October snow cover over Siberia leads to a stronger high-pressure system over the regions.
That high-pressure system helps to send more vertical energy into the Stratosphere during Winter. That energy can weaken and disrupt the Polar Vortex and the polar circulation.
If the Polar Vortex enters Winter in a weaker state, it is more susceptible to a full collapse event. As pressure systems get stronger and more energy goes upwards into the Stratosphere, it can reach a point where the Polar Vortex can completely collapse.
That is called a Sudden Stratospheric Warming event and means a strong warming event of the Stratosphere and a following collapse of the Polar Vortex.
The image below shows the average temperature 0-30 days after an SSW event. It shows that most of the United States, along with Europe, is typically colder than normal. Note: This is an average of several events, and individual results may vary.

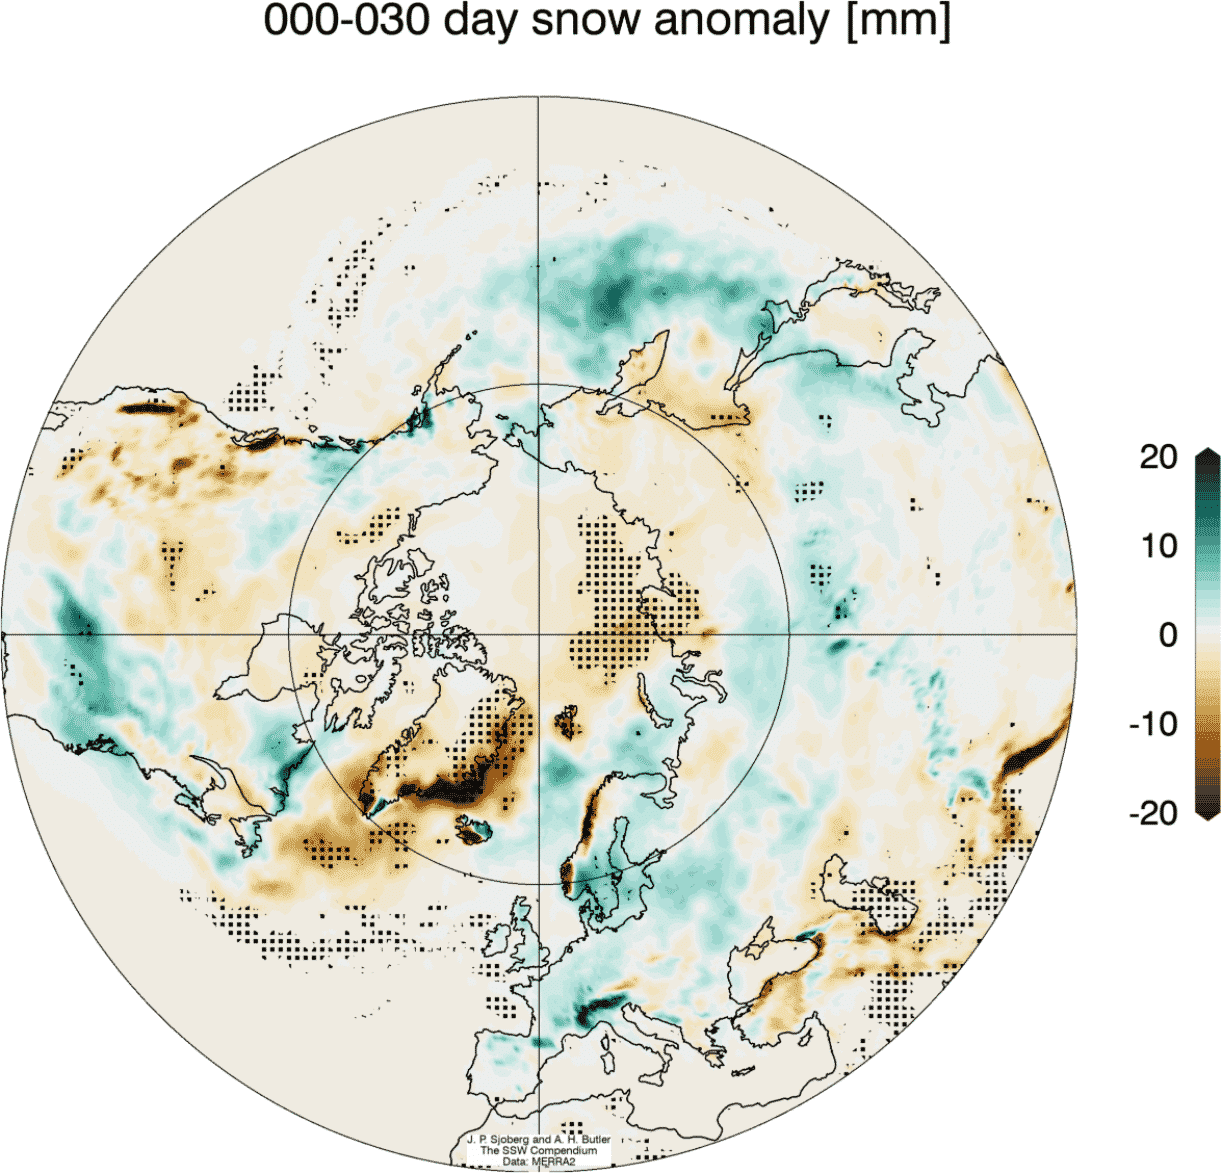
Looking at snowfall, we can see above-average snowfall over much of the eastern United States and Europe after a Polar Vortex collapse event. Again, this is an expected response, as typically, after major stratospheric warming, the colder air has an easier path towards the south and into these regions.
So as you can see, having a strong or weak Polar Vortex can significantly change Winter weather in the United States, Canada, and Europe. For this reason, we closely monitor the weather patterns and all activity surrounding the Polar Vortex.
We will keep you updated on the global weather pattern development for the coming seasons, so make sure to bookmark our page. Also, if you have seen this article in the Google App (Discover) feed, click the like button (♥) there to see more of our forecasts and our latest articles on weather and nature in general.
Don’t miss: