La Nina is now cooling down for the upcoming Winter season. Cold anomalies are emerging in the eastern tropical Pacific as trade winds intensify. Latest forecasts show the La Nina to remain active and stable going into Winter 2022/23, bringing along a wide palette of weather effects.
La Nina was mentioned many times over the past seasons, in the same breath as seasonal weather forecasts. They go hand in hand, as these ocean anomalies are a key part of the ocean-atmosphere climate system.
We will first analyze the latest cooling conditions across these ocean regions and look at the latest long-range development. Finally, you will see just how strong of an influence these oceanic anomalies can bring on a seasonal scale, especially for the upcoming Winter 2022/2023.
ENSO GLOBAL WEATHER MANAGEMENT
ENSO stands for “El Niño Southern Oscillation.” This is a region in the equatorial Pacific Ocean that periodically shifts between warm and cold phases. Typically there is a phase change around every 1-3 years.
ENSO significantly influences tropical rainfall, pressure patterns, and the complex exchange between the ocean and the atmosphere. We can observe large-scale pressure changes in the tropics with each developing phase.
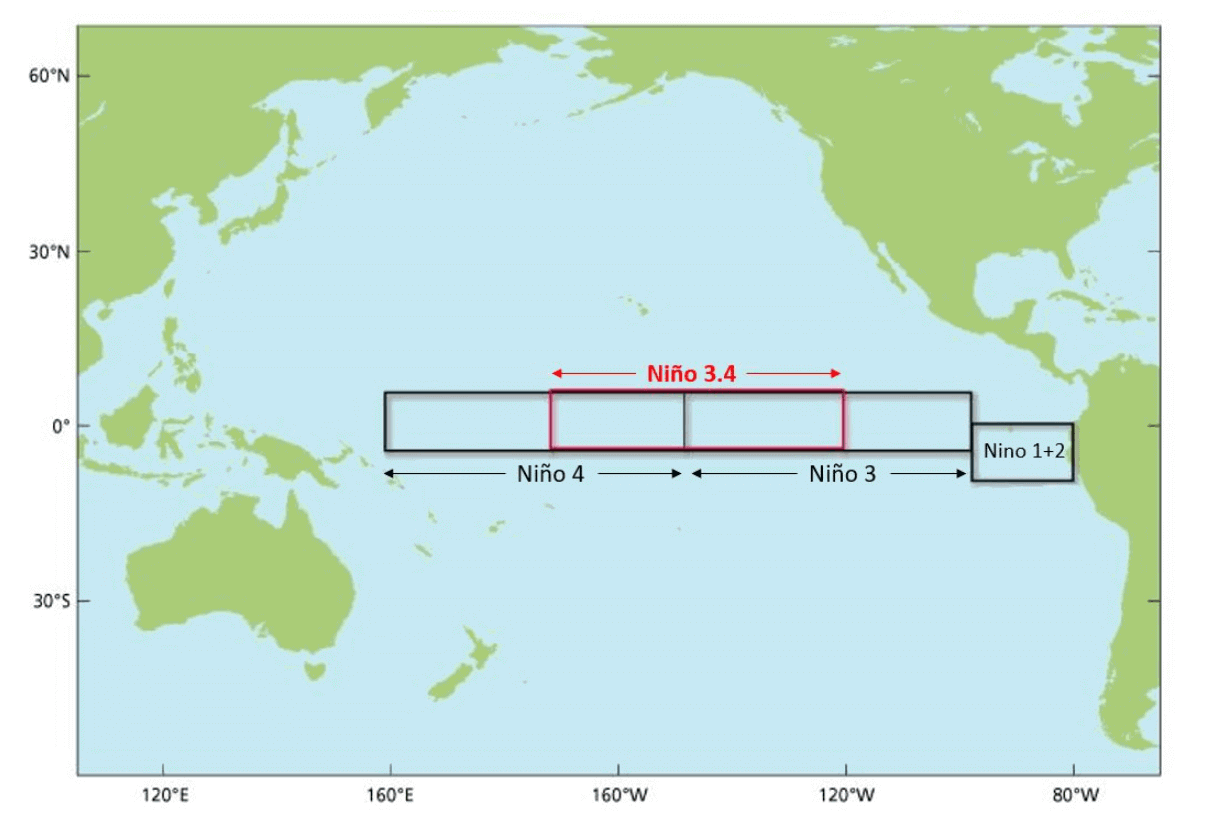
The image below shows the ENSO regions across the tropical Pacific. Regions 3 and 4 cover the east and west tropical Pacific. The main area is a combination of regions 3 and 4, seen in the image as the Nino 3.4 region.
Each ENSO phase influences the pressure and weather in the tropics differently. This affects the overall global circulation over time, changing the weather patterns worldwide.
Each phase (cold/warm) usually develops between late summer and early Fall and typically lasts until spring. But some events can last up to two years.
The cold ENSO phase is called La Nina, and the warm phase is called El Nino. Besides the temperatures, one of the main differences between the phases is the pressure patterns they develop, seen below as high (H) and low (L) pressure zones.
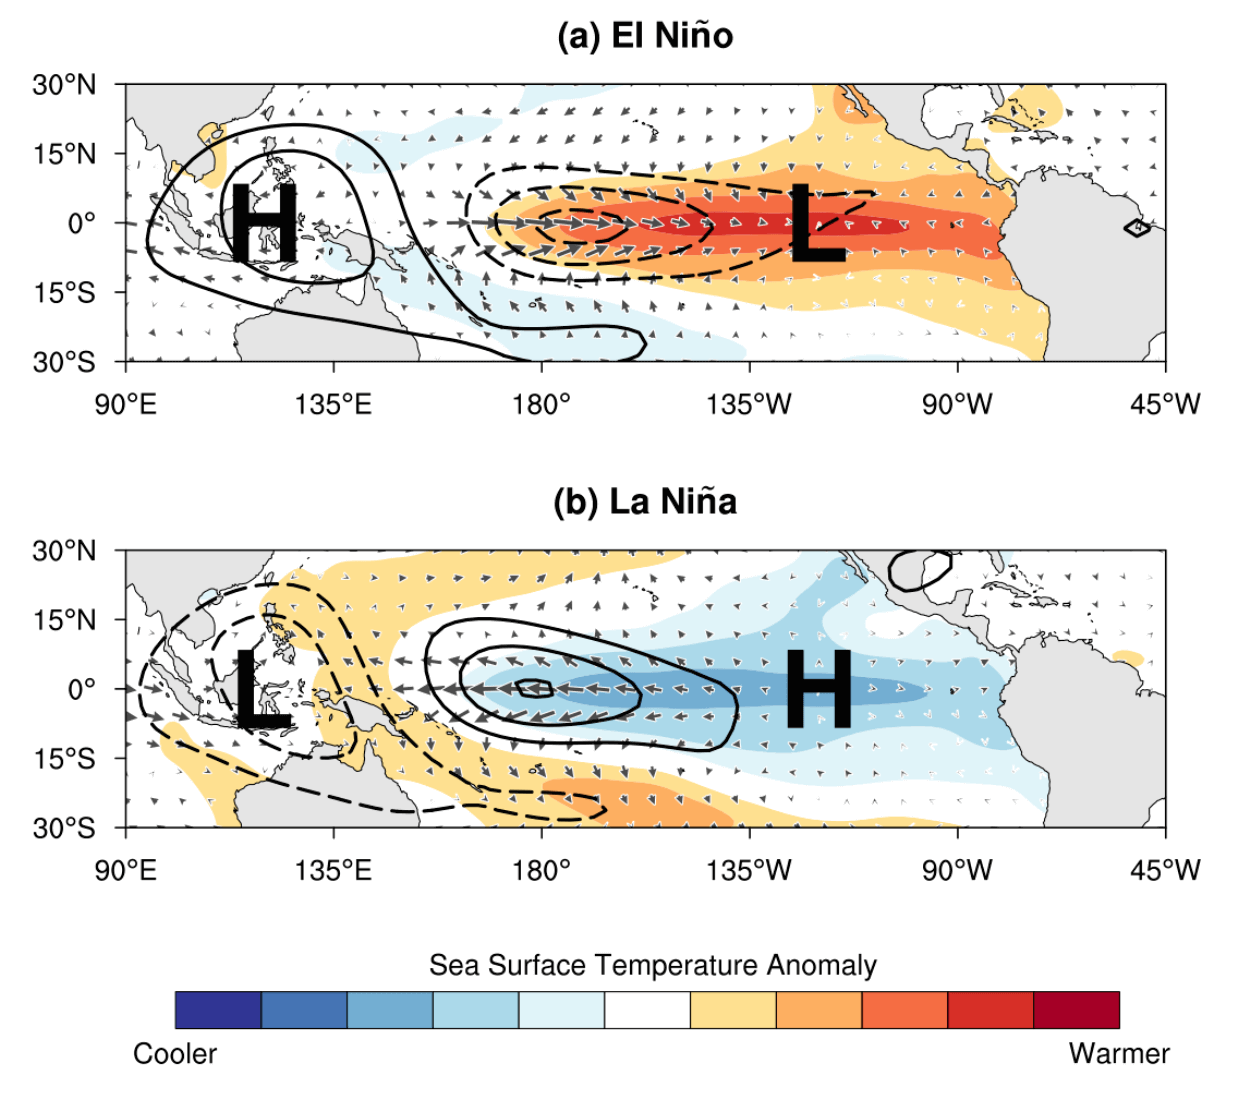
During an El Nino, the pressure over the tropical Pacific is lower, with more rainfall and storms in this region.
But during a La Nina, the pressure over the equatorial Pacific is high, creating stable conditions and less convection. These pressure changes translate into global circulation, affecting seasonal weather over both Hemispheres.
The following image below from NOAA Climate shows the typical circulation during a cold ENSO phase (La Nina) which is currently active.
Descending air in the eastern Pacific causes high pressure and stable/dry weather. At the same time, the air is rising in the western Pacific, causing frequent thunderstorms, low pressure, and a lot of rainfall.
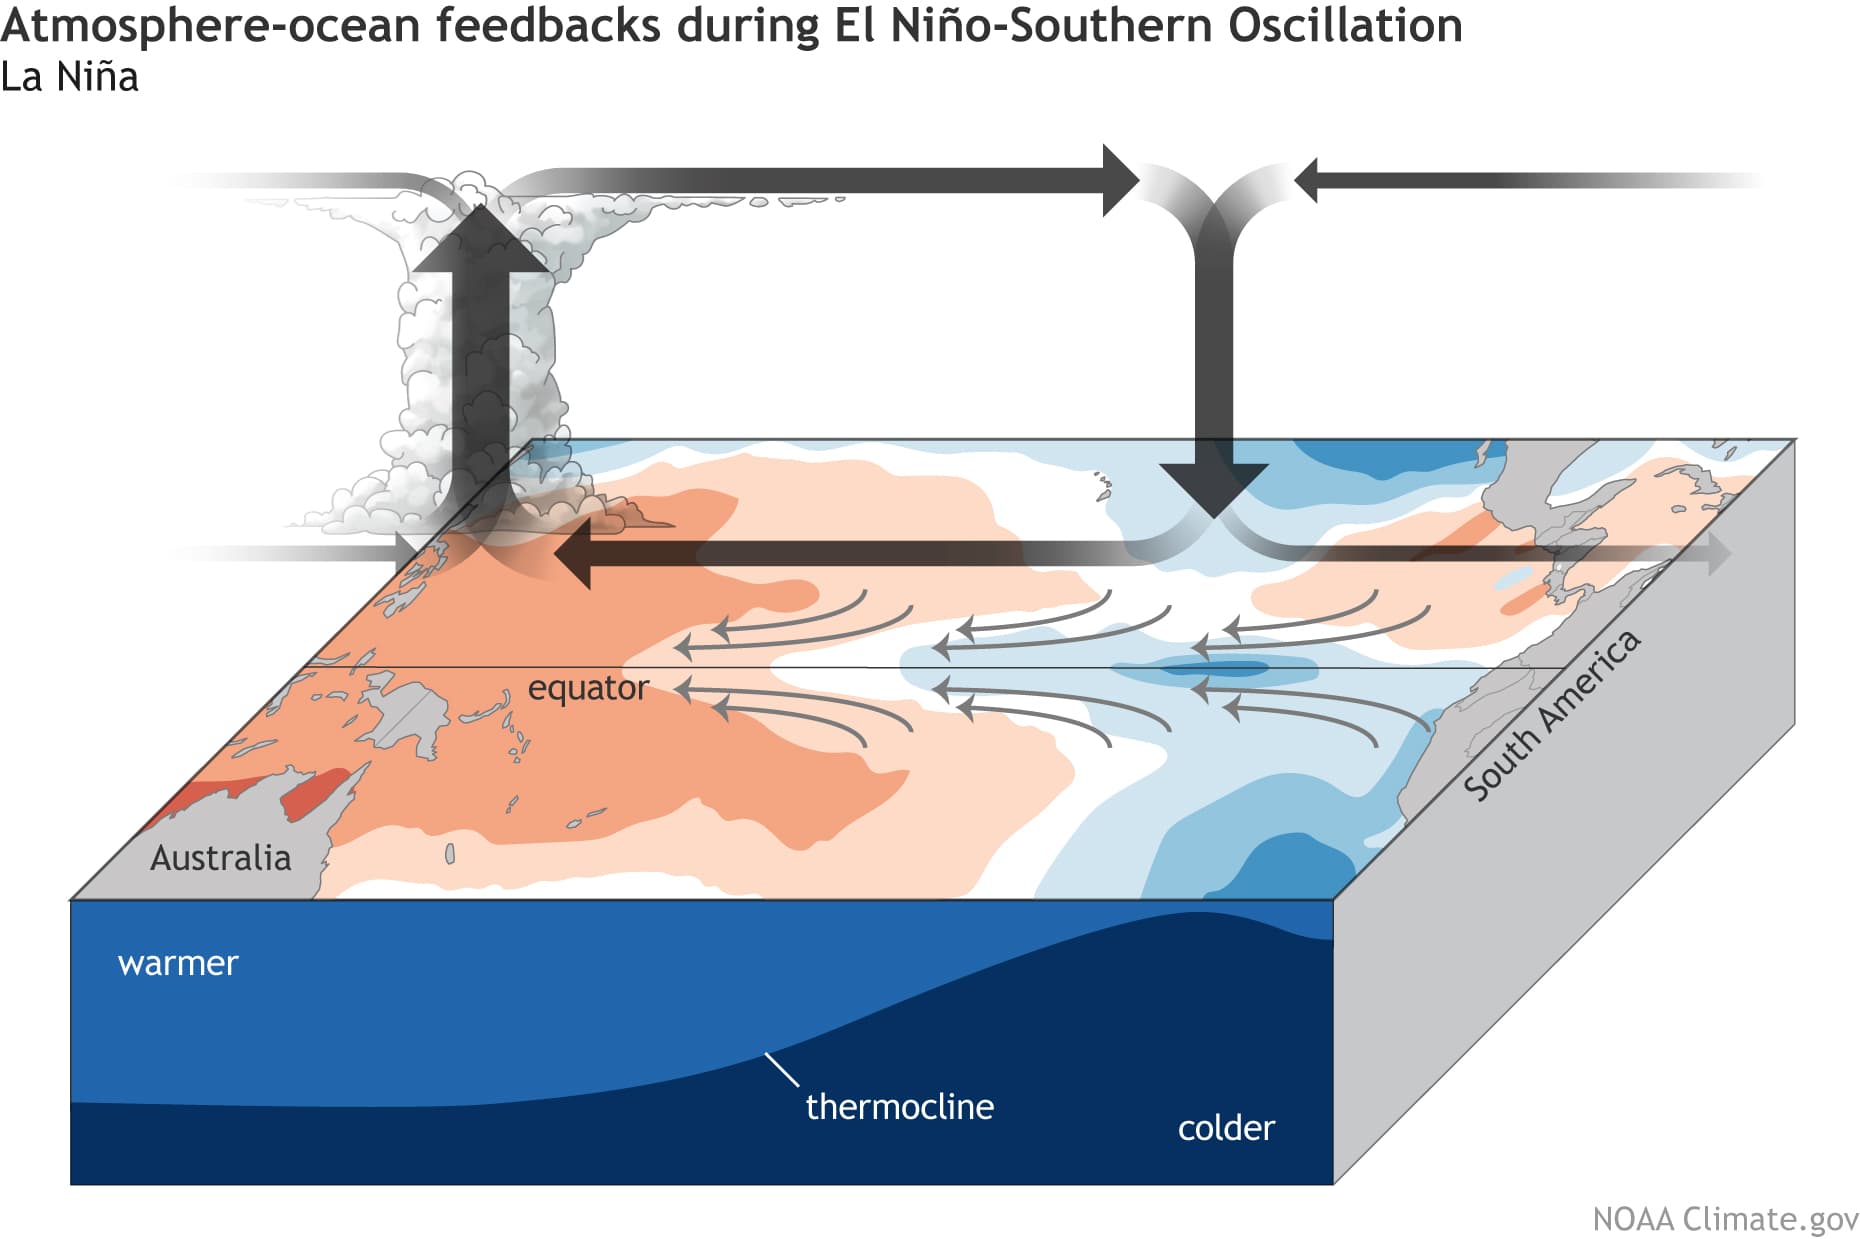
This way, ENSO strongly impacts the tropical rainfall and pressure patterns and thus impacts the ocean-atmosphere feedback system. Through this ocean-atmosphere system, the ENSO influence is distributed globally.
We usually observe a global shift in pressure patterns during the emergence of an ENSO phase, but it is more influential during the peak of its phase.
But why does ENSO even shift between cold and warm phases? There is no simple answer, but we can say that it results from a complex relationship between pressure, winds, and ocean currents.
GLOBAL WINDS AND PRESSURE
Global trade winds usually start or stop a certain ENSO phase by overturning the ocean surface layers and altering the ocean currents and temperature.
What are the trade winds? Trade winds are steady and persistent winds, blowing towards (and along) the Equator in both Hemispheres. The image below shows a simplified map of the prevailing global winds, with tropical trade winds in yellow and red.

When these easterly winds get stronger, they tend to cool the ocean surface as they start pushing the water from east to west. This pushes warmer surface waters towards the west but brings deeper (colder) waters to the surface to replace them.
This process is much better seen in the video animation below, showing ocean temperature anomalies from June to October 2022.
ENSO cooling restarted in August as the cold waves develop across the equatorial Pacific. But it picked up in September as the easterly trade winds intensified.
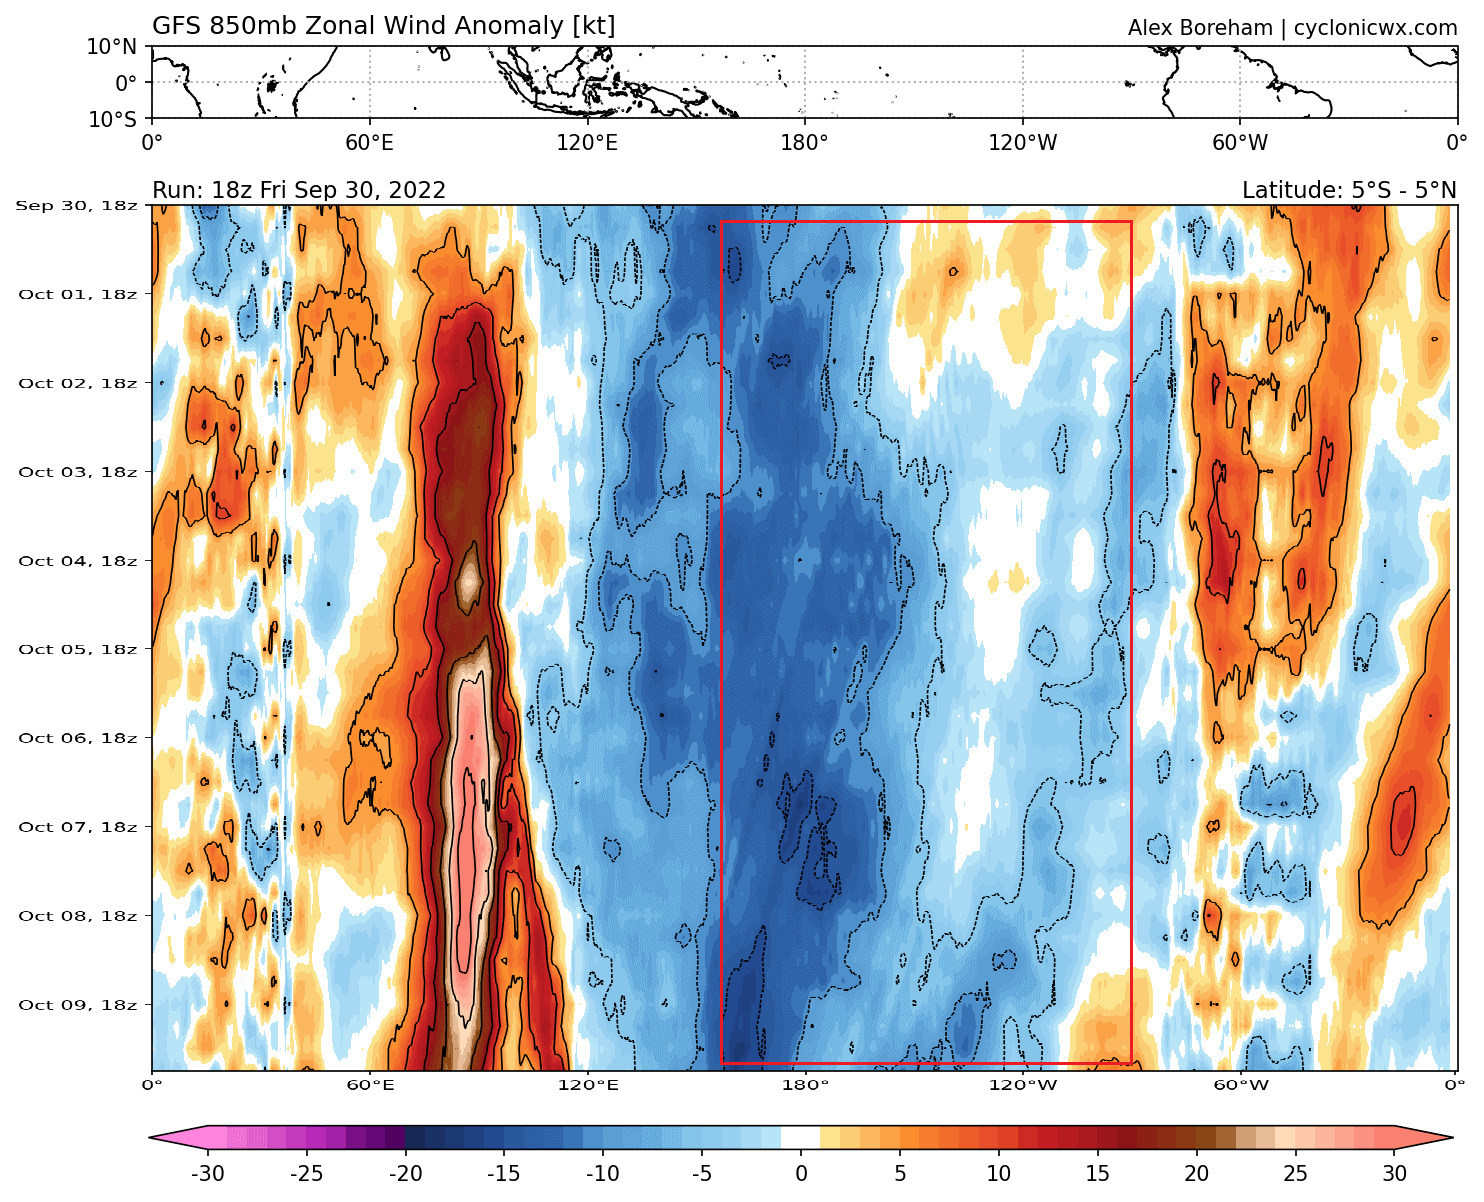
The image below shows the latest trade wind anomalies in tropical regions. We can see stronger than average easterly trade winds in negative values (blue). Strong trade winds prevail in the tropical Pacific across all ENSO regions, driving the ocean cooling process.
But the key here is not just in the winds, as they are driven by pressure changes. Instead, the ENSO phase directly responds to an atmospheric pressure change called the Southern Oscillation Index (SOI).
The Southern Oscillation Index or SOI represents the difference in air pressure measured at Tahiti (French Polynesia) and Darwin (Australia). The image below shows the location of the two pressure zones that are important for ENSO.

Positive SOI values mean the pressure over the Tahiti side is higher than over Darwin in Australia. This corresponds to stronger easterly trade winds, supporting La Nina conditions.
But during an El Nino, we see lower pressure in the eastern Pacific, over Tahiti, and higher pressure over Darwin. This produces a negative SOI value and weaker trade winds, which means less ocean surface cooling.
On the latest SOI analysis below, we can see persistent positive values with a strong recent burst. Such data further supports stronger trade winds and ocean cooling in the ENSO regions, sustaining and further cooling the La Nina towards Winter 2022/2023.

But how does this latest burst of positive SOI reflect in the ocean temperatures across the ENSO regions?
LA NINA COOLING DOWN FOR WINTER
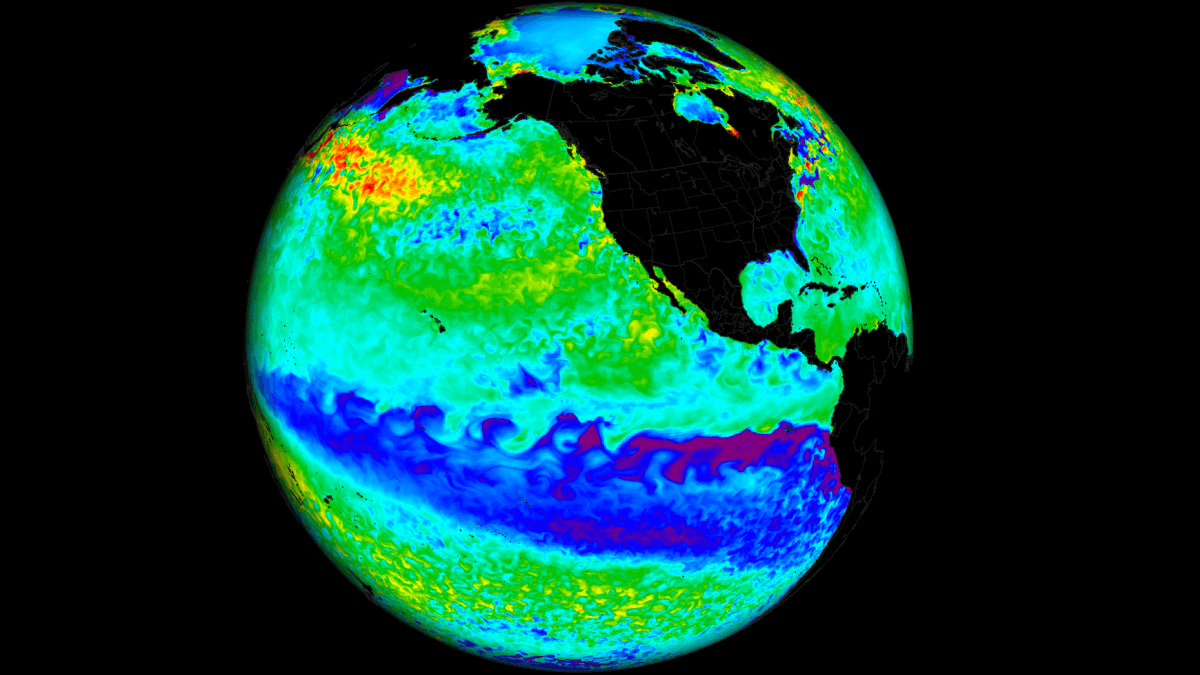
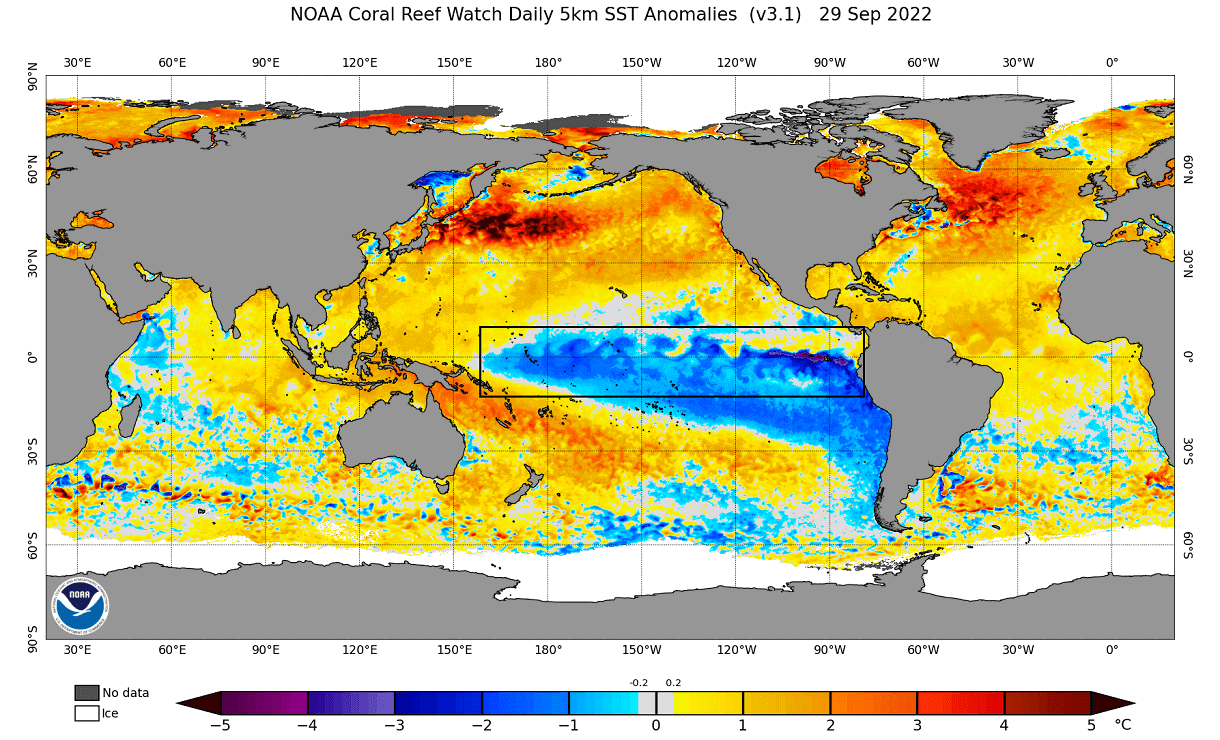
The latest global ocean analysis reveals the strong presence of cold ocean anomalies in the tropical Pacific. This is across the ENSO regions and shows the active La Nina, spanning almost the entire length of the tropical Pacific.
Below, you can see the anomaly data from the past years across the ENSO region. You can see the first La Nina event in 2020 and a second-year La Nina in late 2021, lasting through the Winter. A third-year event is forecast to last over the Fall and Winter 2022/2023.
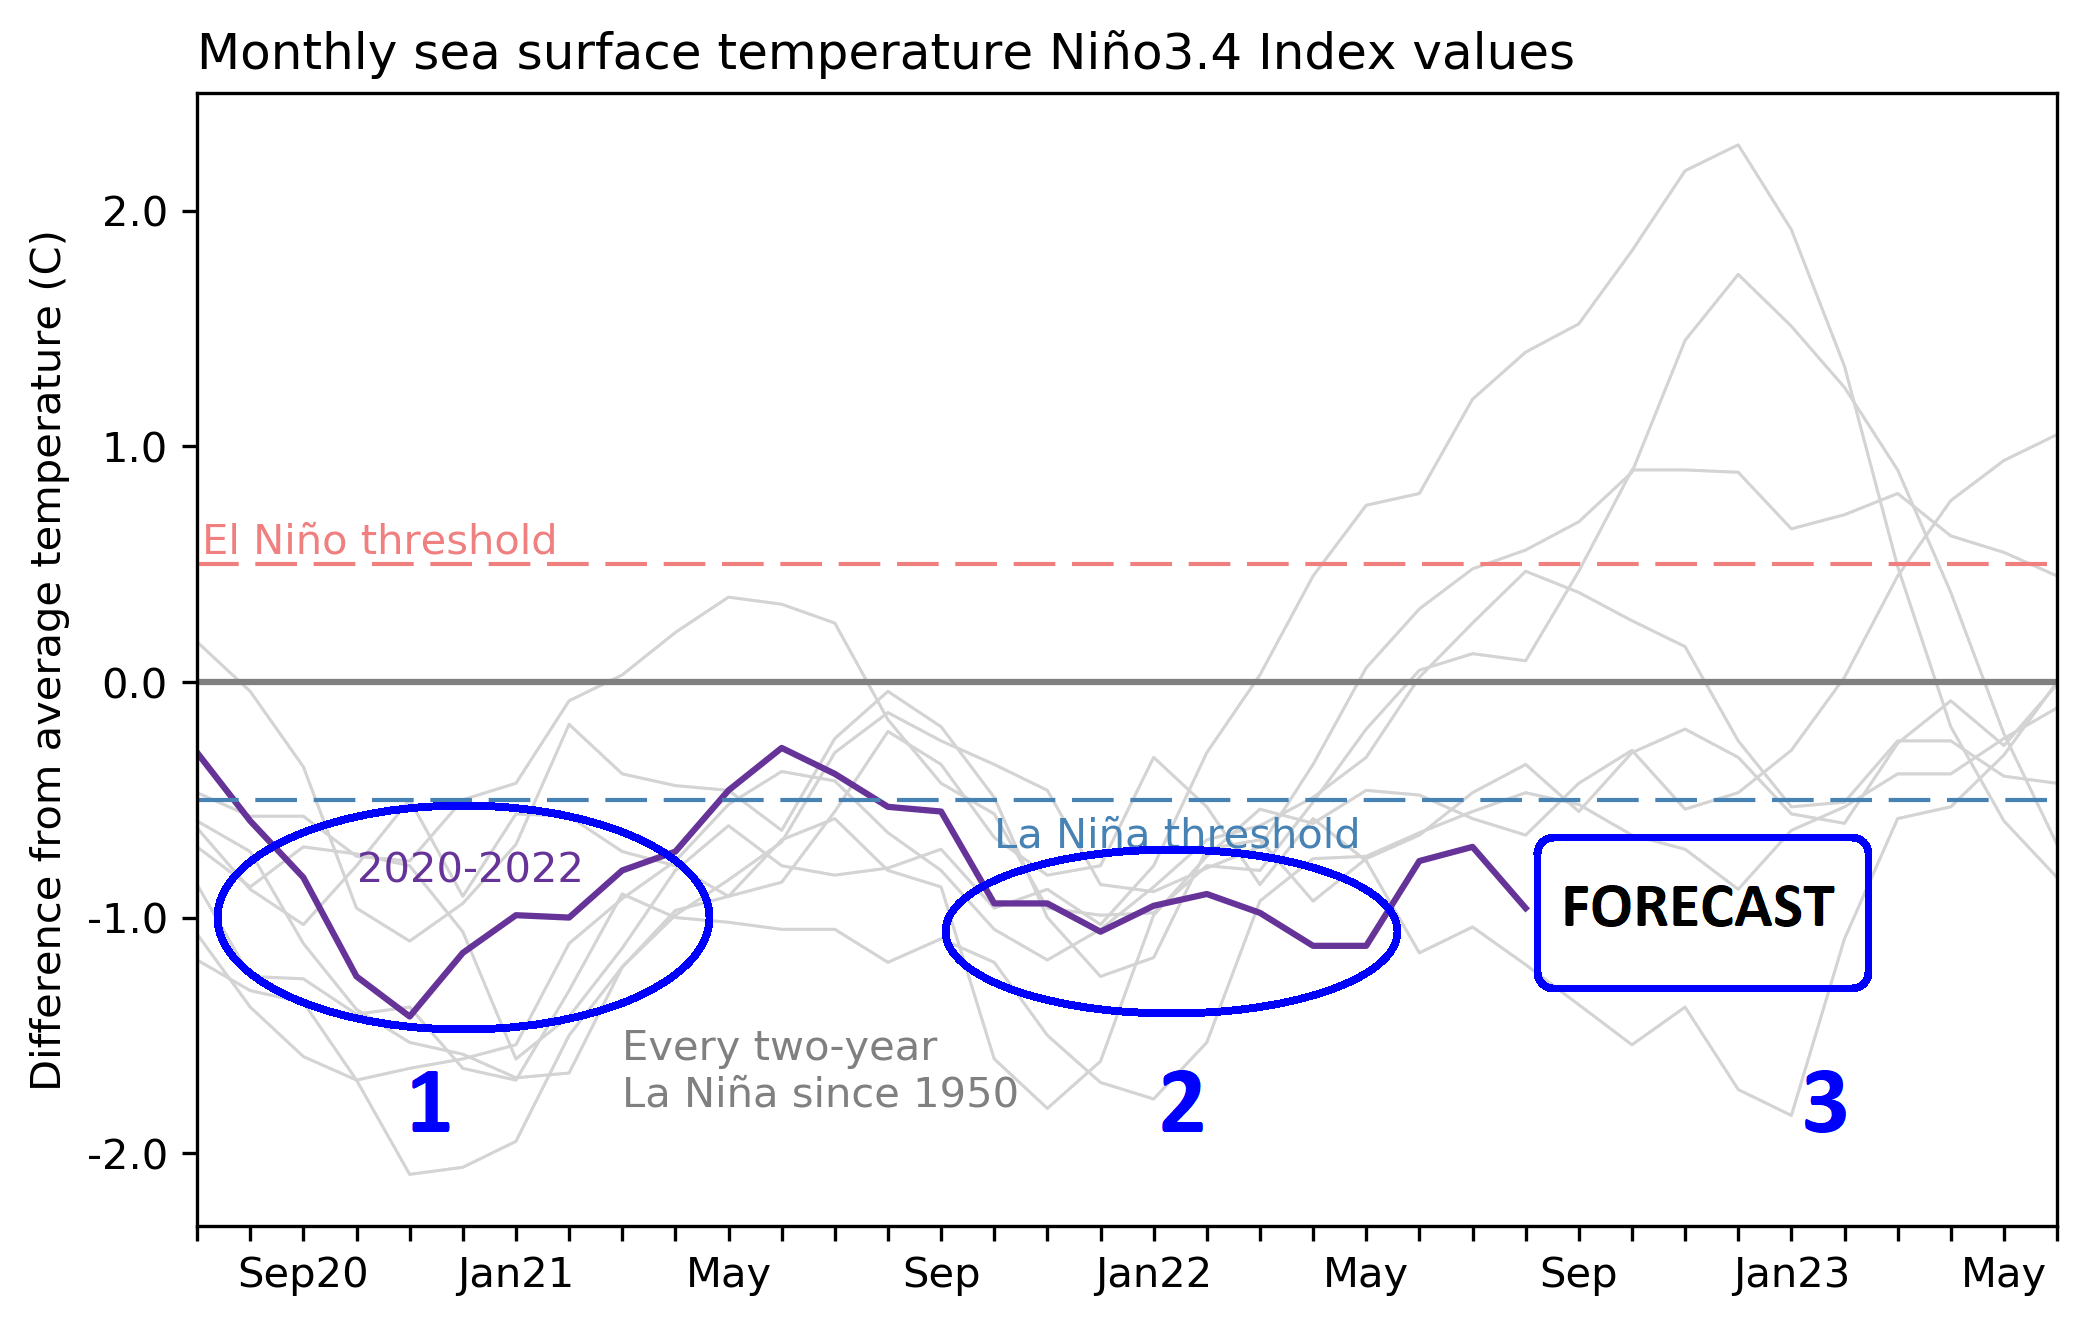
But as the image shows, the pressure and wind patterns change across the tropical regions every summer. This means a change in the trade winds and a seasonal weakening of the cold ENSO phase.
But the process reverses going into Fall. You can see this on the graph below, which shows the temperature anomalies in the ENSO 3.4 region from mid-July to the start of October. Cooling intensified in late summer, pushing the anomalies well below the La Nina threshold (-0.5 degrees).

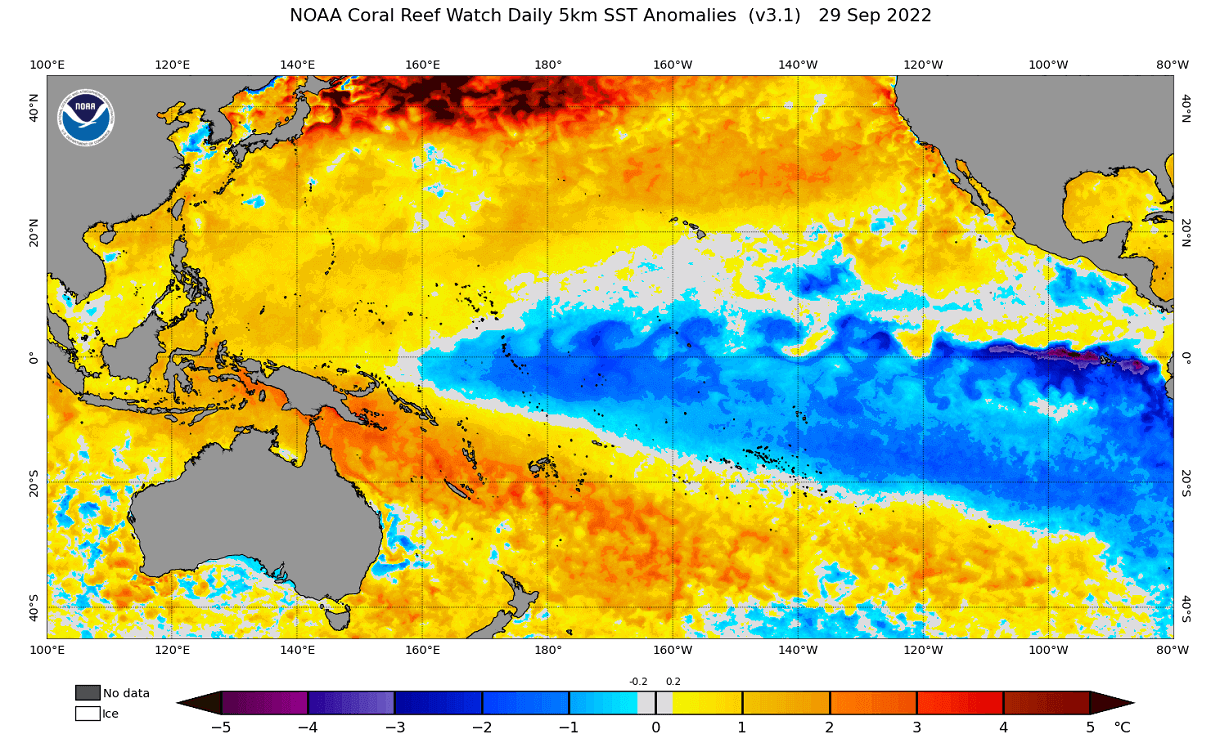
Looking more closely at the latest analysis of the ENSO regions below, you can see the strongest cold anomalies returning in the eastern region. Overall, La Nina looks in a healthy state, with cold anomalies spanning far across most of the tropical Pacific.
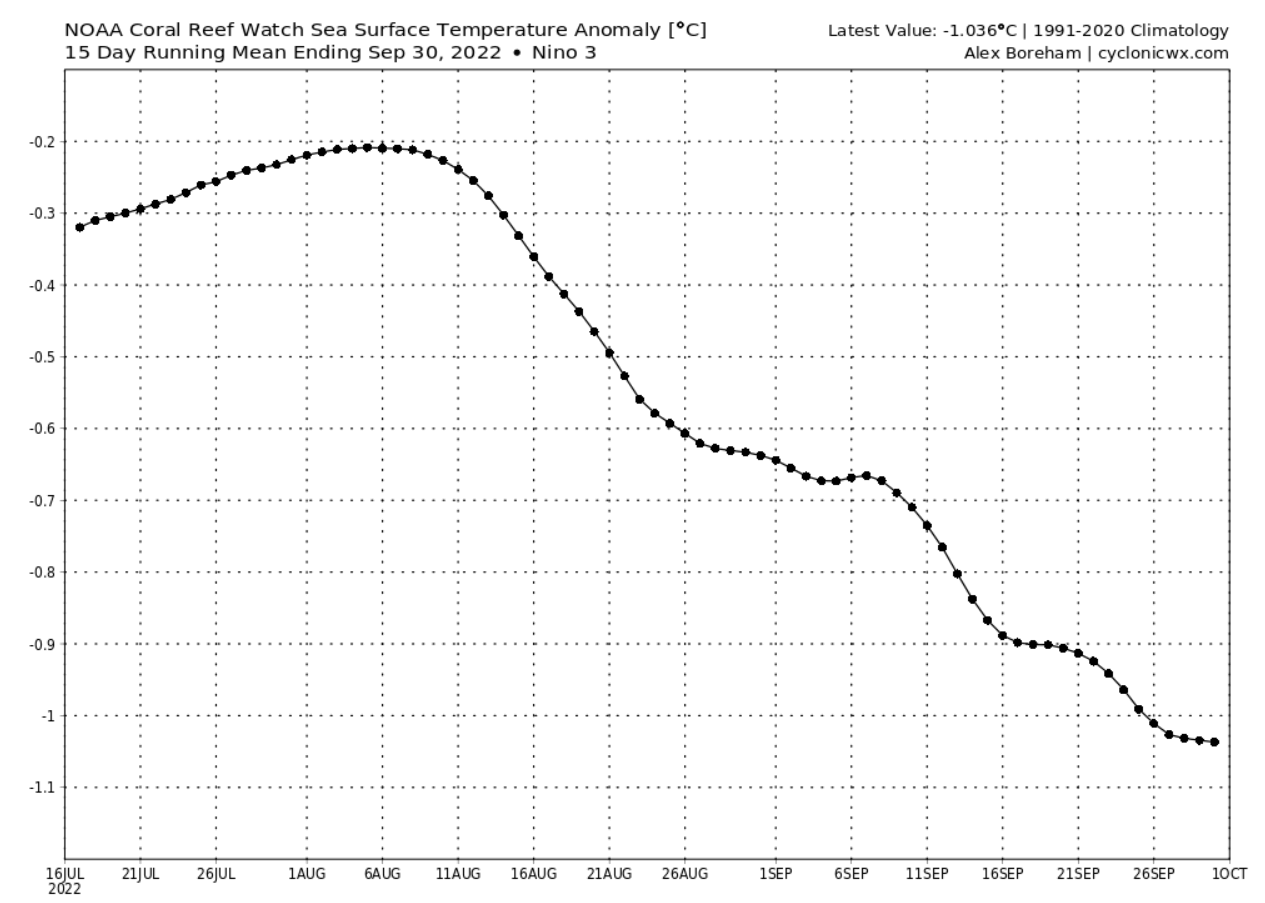
The graph below focuses on the eastern ENSO 3 region. You can see that we are now in a strong cooling episode since early August. This is a result of the easterly trade winds intensifying in late Summer.
We have the ocean analysis from mid-July below when La Nina was at its weakest. You can see some warm anomalies across the eastern regions due to an emerging oceanic Kelvin Wave below the surface.

Below we have the latest 7-day ocean temperature anomaly change. You can very clearly see the cooling ongoing in the eastern ENSO regions. Some areas have seen temperature drops over 3 degrees celsius in the past 7 days.

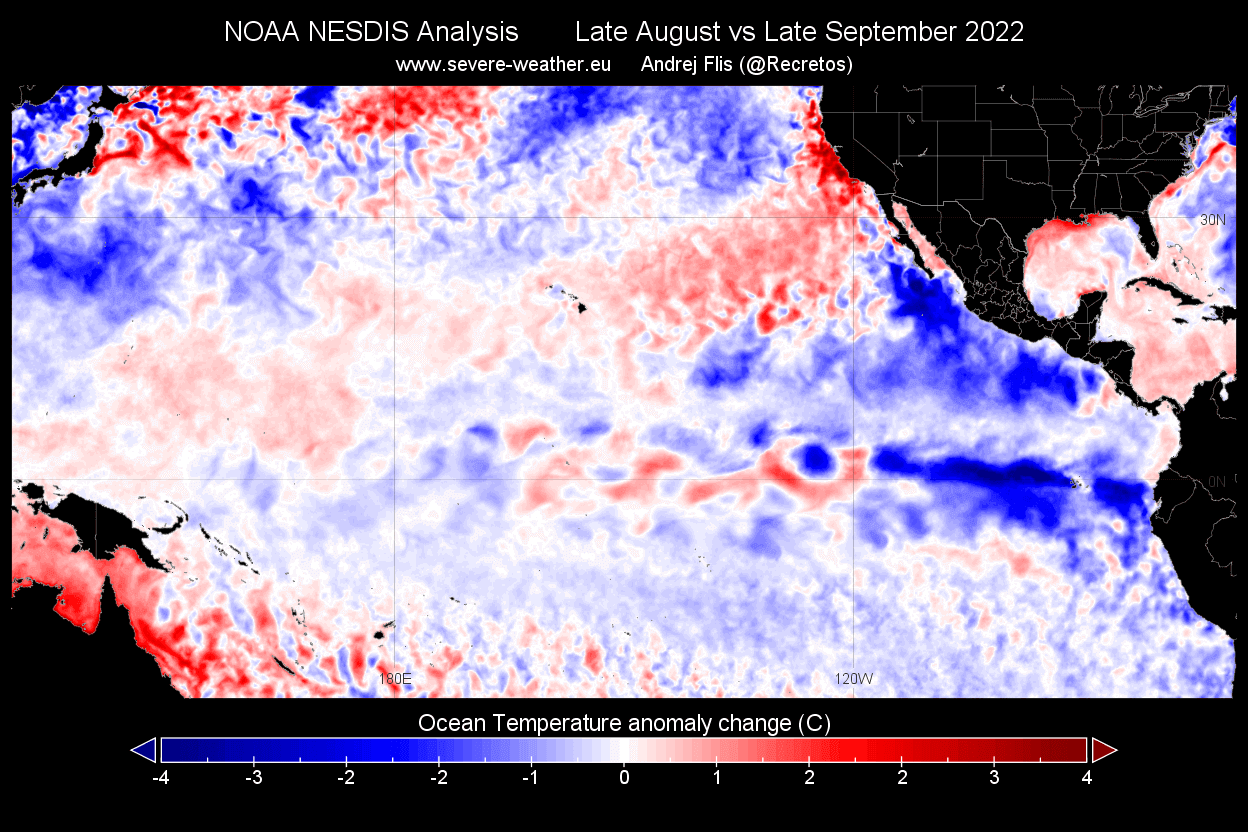
The next image below compares late September and late August ocean anomalies. It reveals much cooler waters across the eastern ENSO regions in late September, as the trade winds have amplified lately, as also seen earlier as a positive SOI (Southern Oscillation Index) burst.
Looking at the ocean currents below, the image actually shows just the west-to-east component of near-surface ocean currents. With this, we can track the response to trade winds. We can see strong westward/easterly (blue) motion, which promotes upwelling and cooling of the ocean surface.

THE ANOMALY BELOW THE OCEAN SURFACE
But perhaps a stronger (invisible) process is developing below the ocean surface. The image below shows the latest temperature anomalies by depth across the tropical Pacific Ocean. Despite some warm anomalies on the surface in Summer, there was a strong pool of cold anomalies below the surface.
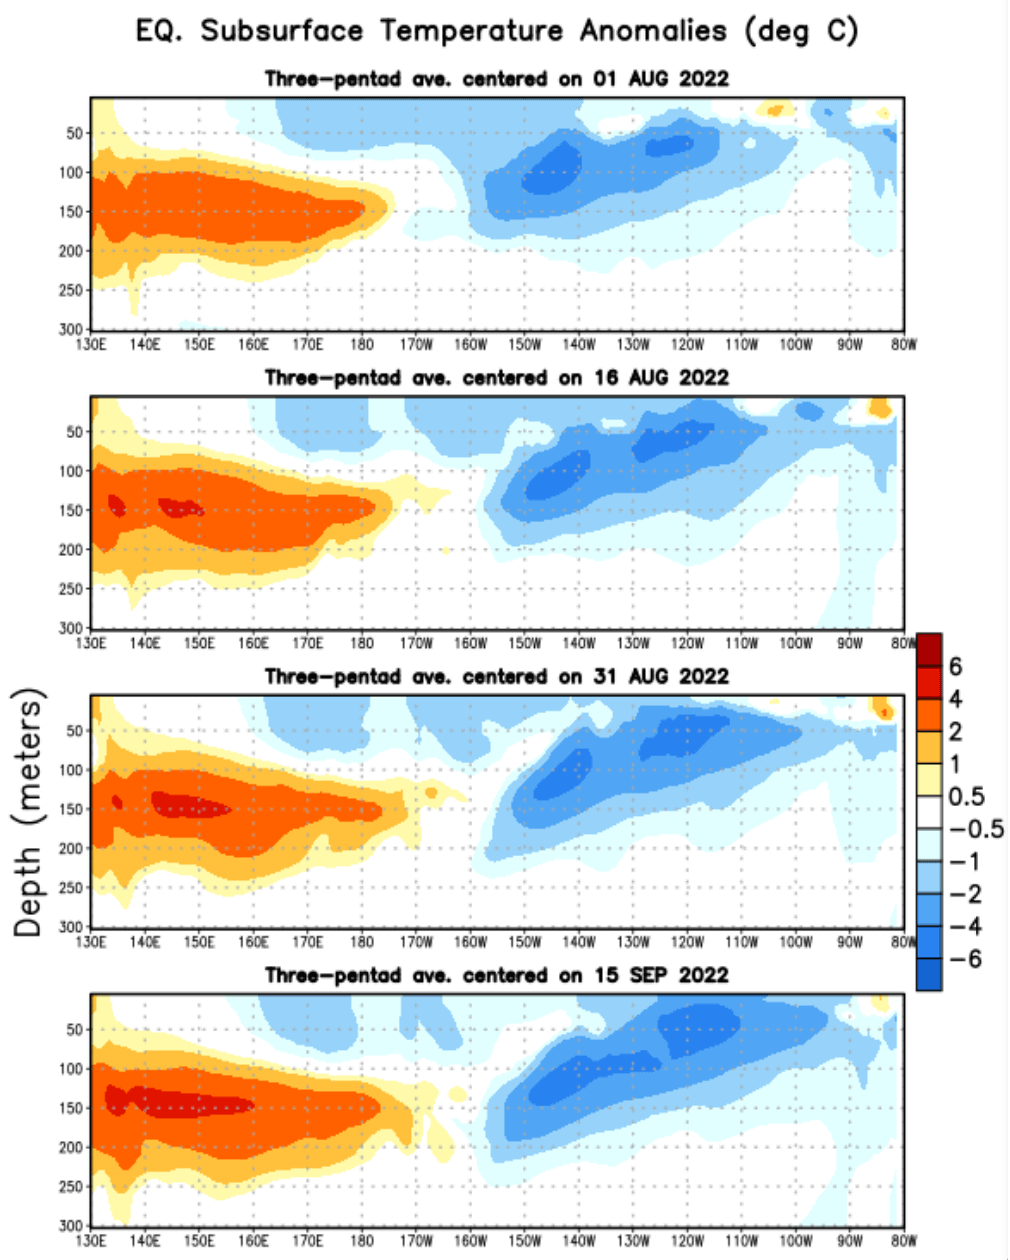
This cold pool is starting to rise to the surface in an upwelling process. As mentioned before, that process is when strong easterly winds push the surface waters towards the west, bringing up deeper, cooler waters to replace them.

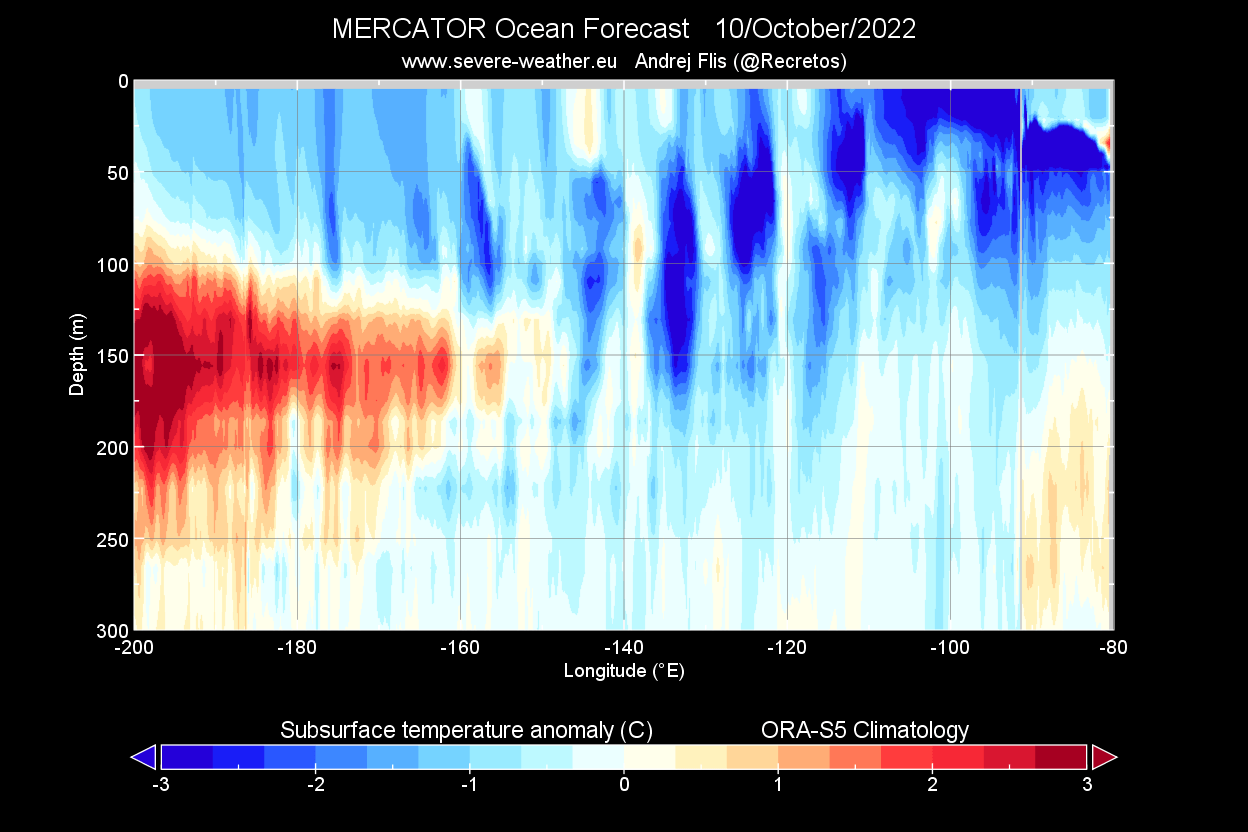
But looking now at the latest high-resolution depth analysis under the ENSO regions, we see colder than normal temperatures below the surface rising in the east. These cold anomalies are causing the fast temperature drop in the eastern ENSO regions.
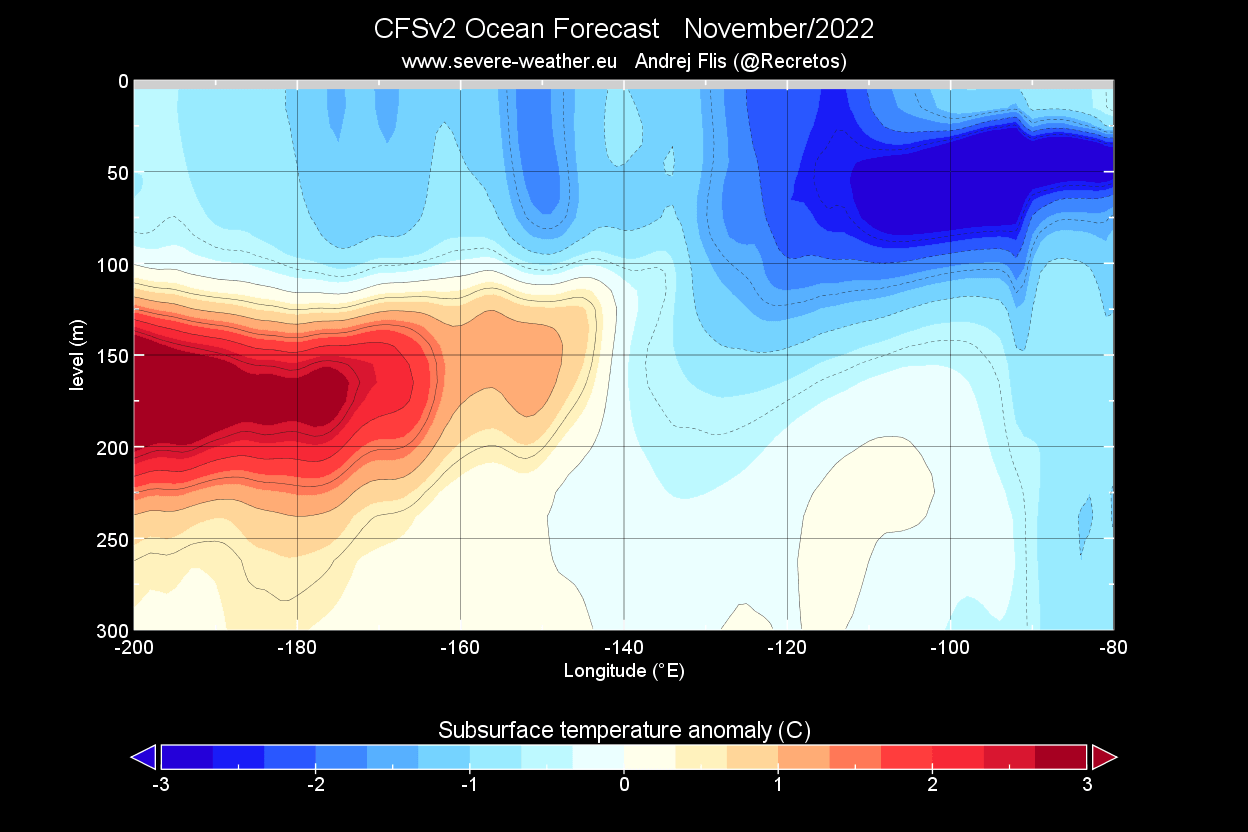
Looking ahead at the November ocean forecast from CFS, we can see the cold pool being healthy and stable below the surface in the east. This signals that the La Nina will have a healthy core below the surface to last through the Winter season.
The ocean heat content is also one way to look at the whole ENSO region’s phase strength. It considers the water temperatures at depth, not just at the surface.
And below, we can see the ocean heat content analysis graph for ENSO regions. The cold subsurface anomalies have weakened into early Summer, with the Kelvin Wave below the surface. But a new cold wave is powering up with the upwelling process.

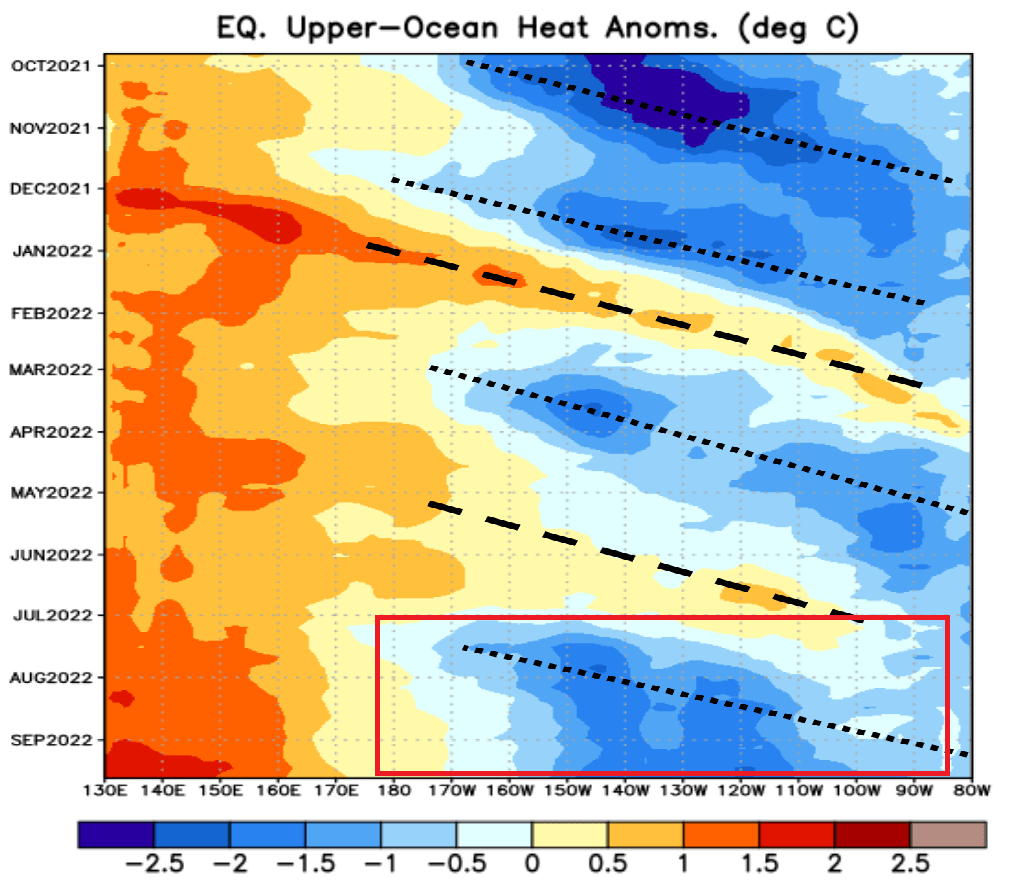
You can see the whole process better in the image below. It shows the upper ocean heat anomalies across the tropical Pacific regions. We can see the warm Kelvin wave peaking in June, but it got quickly replaced by the cold pool, driven by the strong trade winds and the upwelling process.
The subsurface cooling was forecast and is a key part of keeping the surface La Nina conditions active into Winter 2022/2023.
You now understand the current state of La Nina and how it got to this point. So it’s time we look at how it is expected to evolve further into the year and how it will impact our Winter weather.
ENSO SEASONAL OUTLOOK
We will focus on the ENSO evolution through the Fall and Winter seasons. It will help us to understand the scale of the potential influence of La Nina on weather patterns.
The ocean temperature forecast from the joint North American models (NMME) shows the active La Nina phase over most of Winter. That is in agreement with other global forecasting solutions. It is forecasting a healthy La Nina from late Fall into late Winter.

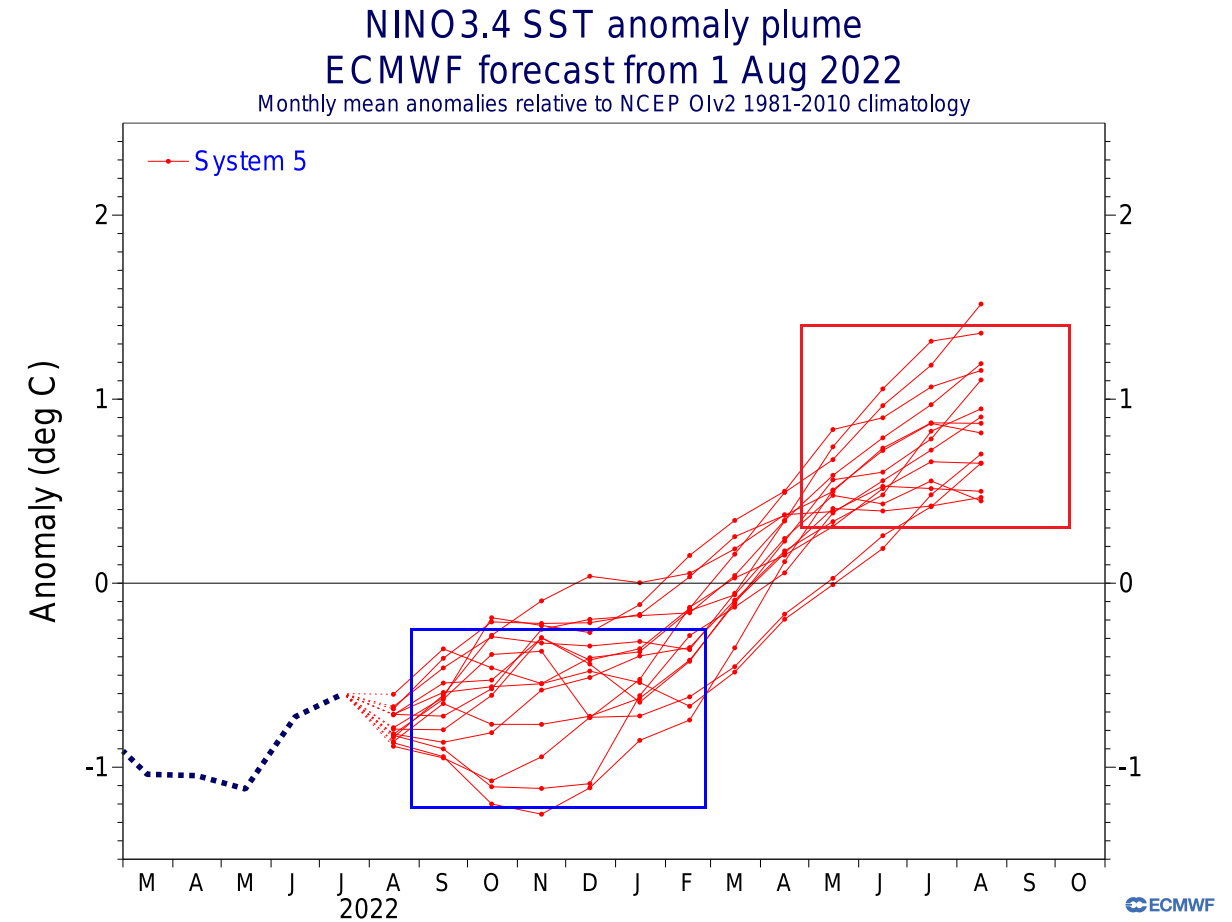
The analysis and ensemble forecast below from ECMWF shows the forecast of the central ENSO region. The La Nina conditions (below -0.5) will prevail over the Fall and Winter. But a weakening of the La Nina is expected for next Spring, with a warm phase possible later in the year.
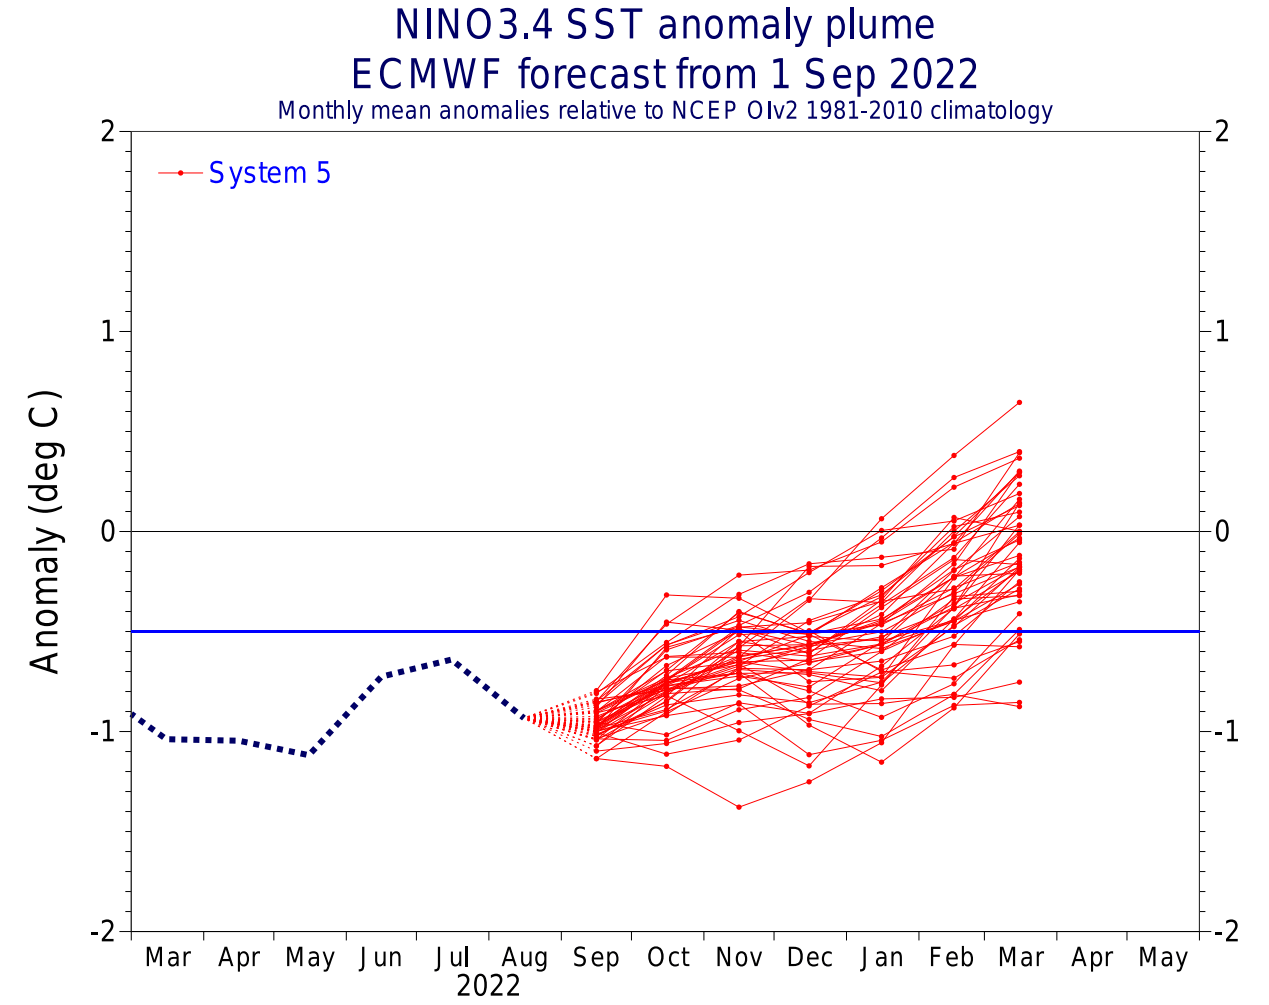
Below we have an analysis/forecast graphic by ECMWF, which shows the long-range forecast of the main ENSO region. The La Nina will remain active over the Fall and Winter. But a weakening of the cold phase is expected for early next year, with an El Nino possible later in the year.
The ENSO forecast from the United States CFSv2 is similar. It shows the current cold anomalies to sustain over the Winter. It shows a breakdown of the La Nina in Spring, ending its unusual 3-year period.

The IRI official probabilistic ENSO forecast also shows the current La Nina lasting over Fall and Winter 2022/23. It is typical for a new phase to emerge in late summer/fall with seasonal pressure changes. But for now, neutral conditions are expected for next year.

But how does a La Nina event actually impact the seasonal weather, from pressure to temperature and precipitation?
COLD ENSO SEASONAL WEATHER
Typically, the first influence of these ocean anomalies can be seen in the jet stream. The jet stream is a large and powerful stream of air (wind) at around 8-11km (5-7mi) altitude.
Historically, a strong blocking high-pressure system in the North Pacific is the most typical effect of a cold ENSO phase (La Nina). That usually redirects the polar jet stream down over the northern United States.
The image below shows the average pressure pattern during the La Nina winters in the past 40 years. We can see a strong high-pressure system in the North Pacific and a low-pressure area over Canada and the northern United States. Images by NOAA Physical Sciences Laboratory (PSL).

A strong high-pressure system in the North Pacific promotes the development of a low-pressure region over Alaska and western Canada. It curves the jet stream downwards between the two pressure systems, marked by the blue lines.
Looking at the temperature analysis for the same winters as above, we can see the cold anomaly area under the jet stream in western Canada and the northwestern United States. A cooler area extends over the Midwest and down into the south-central plains.

Warmer than normal weather and mild winter conditions are typically over the southwestern United States, eastern United States, and Canada. The main winter weather dynamics are usually in the Midwest and the central United States.
Precipitation-wise, La Nina winters are usually drier over the southwestern United States. Drier conditions are also found in the southeastern United States, as La Nina produces a weaker subtropical jet stream and less moisture for the east. More precipitation is typical over the northwestern United States, the Great Lakes, and parts of the northeastern United States.

But of course, what about snowfall? The historical data shows that the jet stream from a La Nina also changes the snowfall potential over North America as the pressure systems take a different path.
The colder air is more easily accessible to the northern United States, which increases the snowfall potential when moisture is available. The graphic below by NOAA-Climate shows the average snowfall pattern for La Nina Winters, as expected this season.
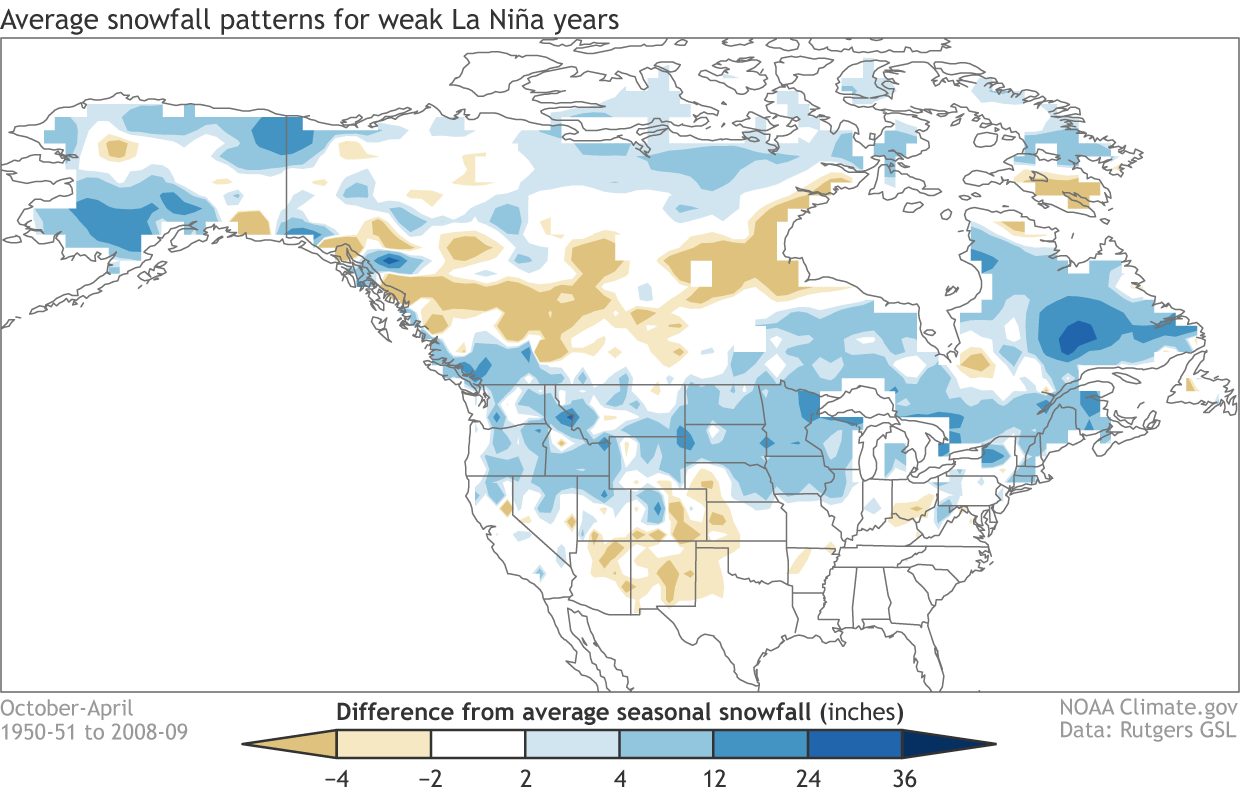
Besides the northwestern United States and the Midwest, we can see more snowfall potential over the northeastern United States and eastern Canada.
But what does the actual forecast data show for the upcoming Winter season? We will look at some simple forecast data for North America, as that is where the ENSO Winter influence is strongest, compared to Europe, which does not experience a direct weather change from the La Nina.
LA NINA WINTER 2022/2023 MODEL FORECAST
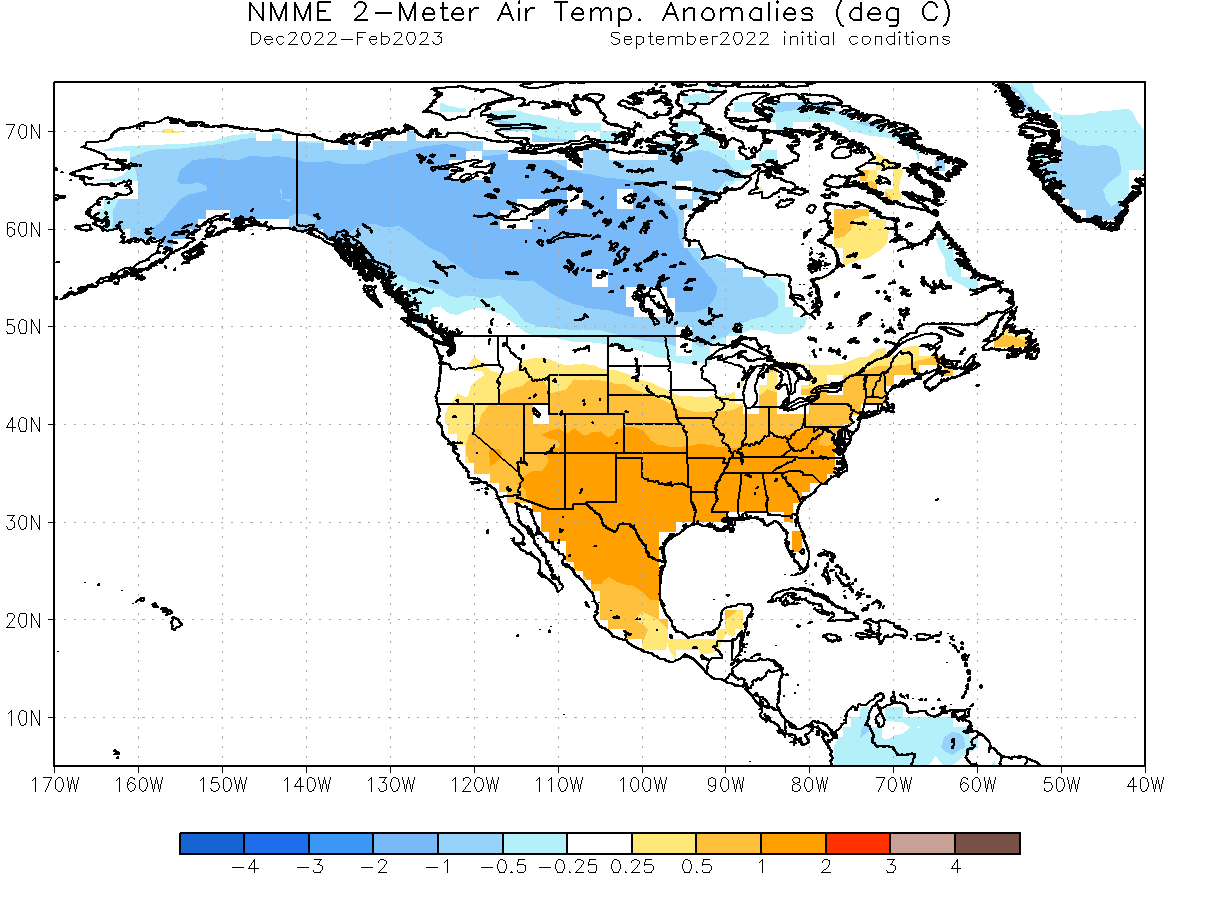
We already looked at the NMME forecast earlier above. NMME stands for North American Multi-Model Ensemble. It is a special forecast combined from several different North American long-range models.
Looking at the pressure anomaly forecast, you can see a strong high-pressure system in the North Pacific, typical for Winter with an active La Nina. A low-pressure system is over Canada, shifting the jet stream down over the northern United States.

The temperature forecast for North America reflects this jet stream pattern. You can see colder temperatures over the northern United States and most of Canada. Warmer temperatures are forecast south of the jet stream in most central and southern United States.
You can see a similar pattern in the precipitation forecast below, where more precipitation is forecast over the northern half of the United States and much of Canada. Drier Winter is expected over the southern United States and parts of far northern Canada.
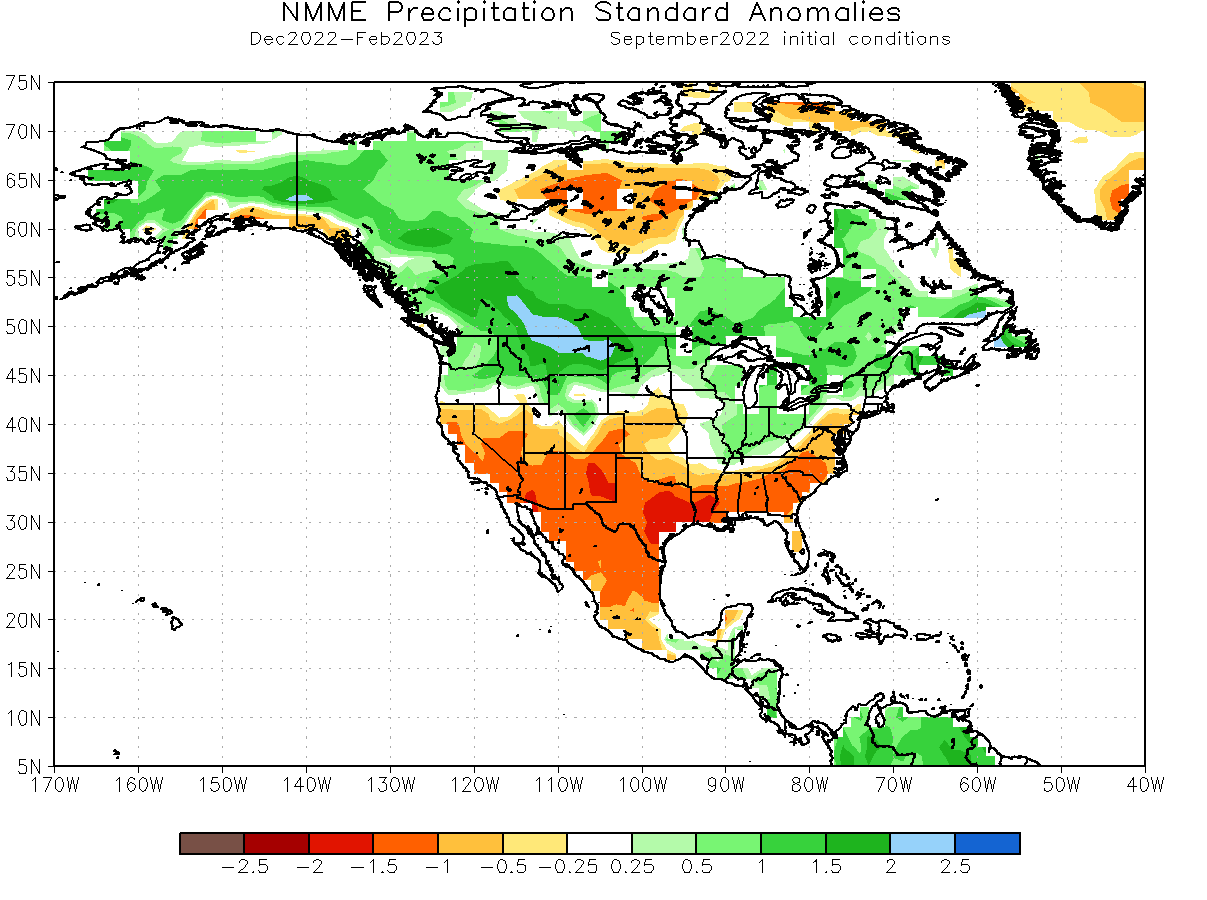
Overall this shows a very textbook La Nina winter to unfold, having a “double character” over the United States, from colder to the north to warmer over the south.
NOAA OFFICIAL WINTER 2022/2023 OUTLOOK
Below is NOAA’s official Winter 2022/2023 temperature forecast for the United States. It shows the temperature probability, with colder chances higher in the northern United States. As seen in the models above, the southwestern part of the country and the east coast have a high probability of warmer than normal weather.
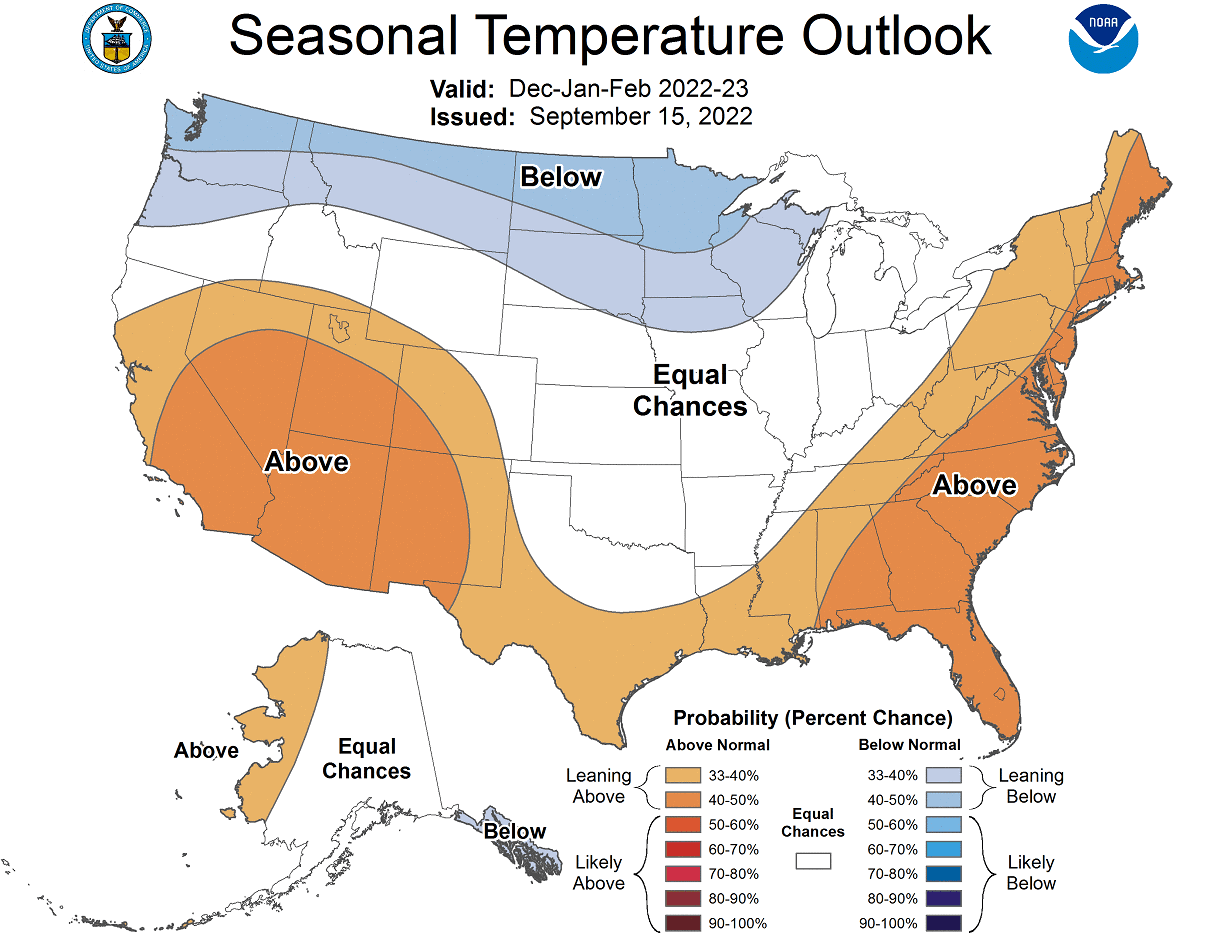
But take note of the trough of “equal” temperatures probability extending down low into the southern Plains. That can be interpreted as a potential route of winter cold air outbreaks down from the Midwest.
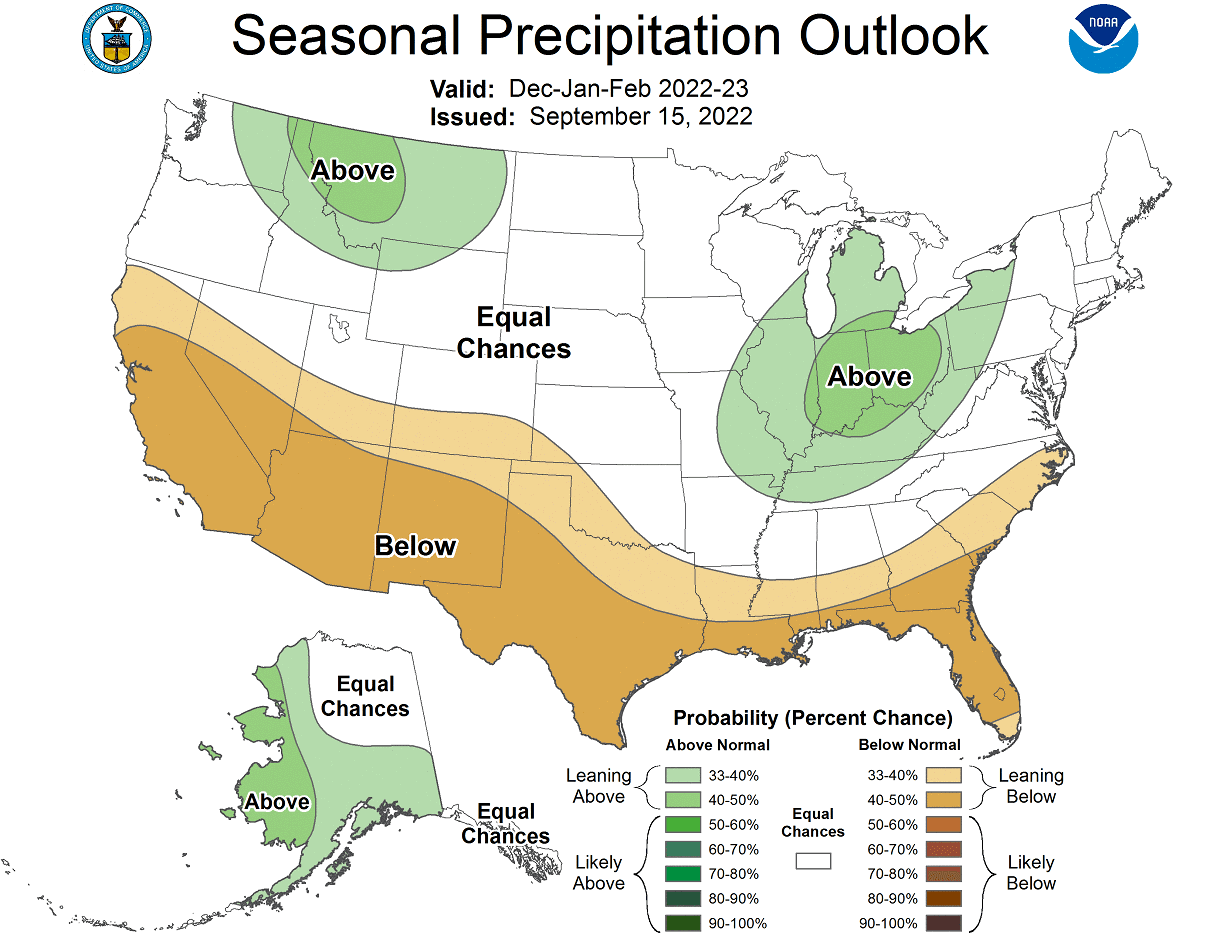
The official precipitation forecast is also similar to the North American models above. You can see an equal-to-higher probability for more precipitation (and snowfall) over the northern half of the United States. The southern United States is forecast to have a drier winter season.
We will keep you updated on the global weather development and long-range outlooks, so make sure to bookmark our page. Also, if you have seen this article in the Google App (Discover) feed, click the like (♥) button to see more of our forecasts and our latest articles on weather and nature in general.
SEE THE FULL WINTER 2022/2023 FORECAST: