Seasonal weather depends strongly on the state of the global Oceans. We are currently observing four main oceanic regions worldwide, which hold significance for future weather development in the Fall and especially the Winter season.
During summer, ocean anomalies tend to evolve with the seasonal changes in pressure patterns. Then, going into Fall, their influence grows, usually peaking during the Winter season.
You will learn which are currently the four main ocean regions that have known historical impacts on seasonal weather. We will look at their current state, the forecast development, and the known historical influence on the Fall-Winter season.
OCEAN AND THE ATMOSPHERE
Oceans play a significant role in the Earth’s climate system, covering over 70% of the planet’s surface. But how are the ocean and the atmosphere connected?
In the image below, you can see the air-sea interaction. This interaction is rather complex, but you can see a two-way system with many small and large-scale factors.

And the key here really is the word “two-way.” For example, we sometimes look at the ocean anomalies and how they will influence our long-term weather, while the weather also influences the ocean anomalies.
The tropical trade winds are a vital connection between the oceans and the weather. They can mix the ocean surface layers, altering the ocean currents and temperature. Changes in ocean surface temperatures can mean changes in precipitation and pressure distribution.
But what are the trade winds? The trade winds are steady and persistent, blowing towards (and along) the Equator in both Hemispheres. The image below from Weather.gov shows a map of the prevailing global winds, with tropical trade winds in yellow and red.
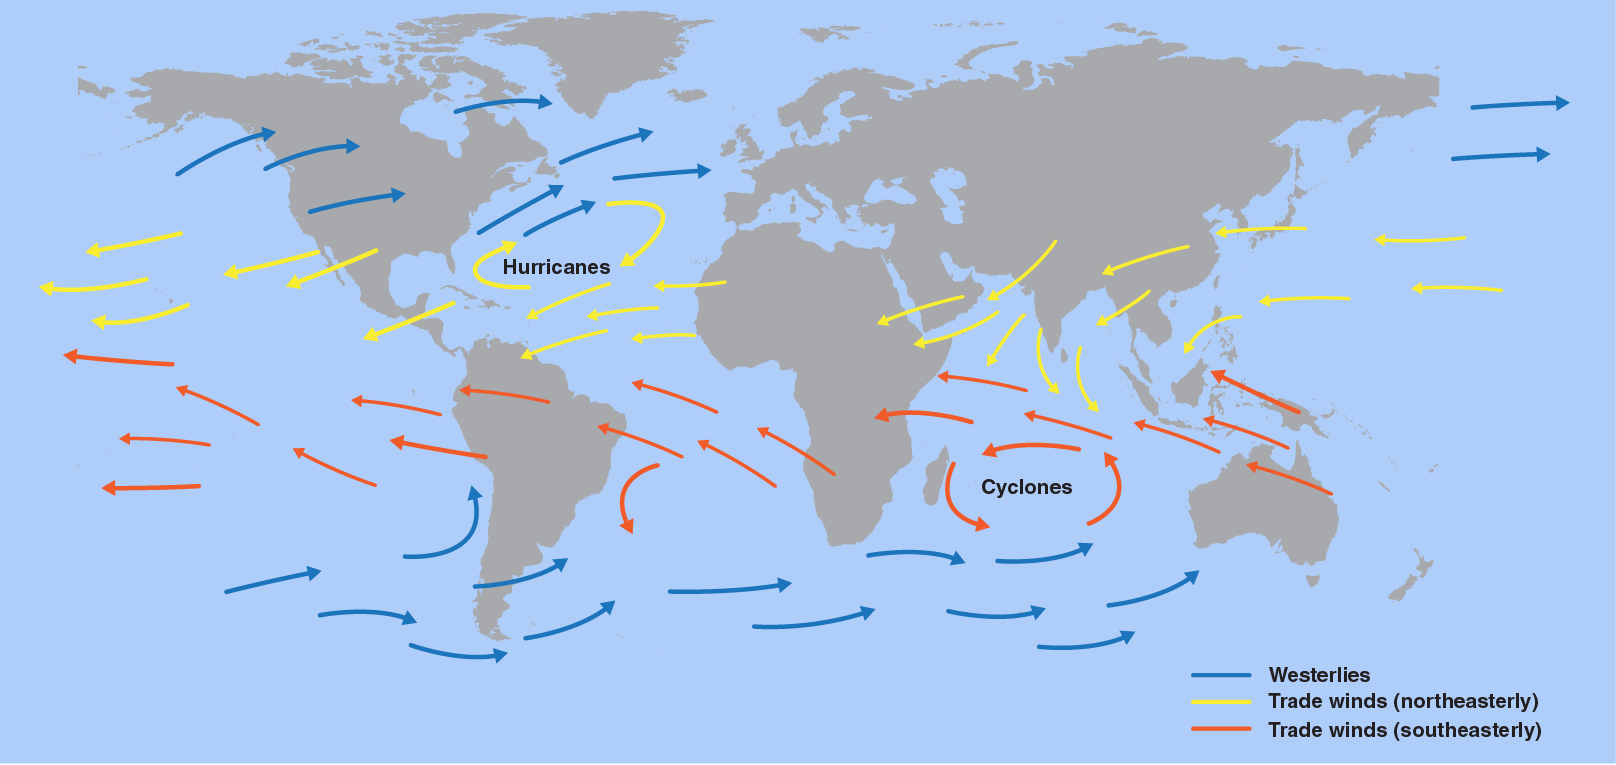
Depending on their strength and direction, they can create strong temperature anomalies on the ocean surface.
So it is very important to note that while the oceans can play their climate role directly, they are also changing due to the weather patterns.
Knowing this, we can look at some ocean anomalies and analyze their development. The anomalies can tell us the background state of the global circulation and what patterns to expect, based on historical data of previous such events.
Several oceanic regions across the world hold significance in one way or another. We can have monthly, seasonal, or decades-long anomalies in the oceans. They can sometimes tell us a small part of what is to come in the future.
Looking at the latest ocean anomalies, we have marked four main global regions that we are currently watching. Each has its role and significance in different areas and time scales.
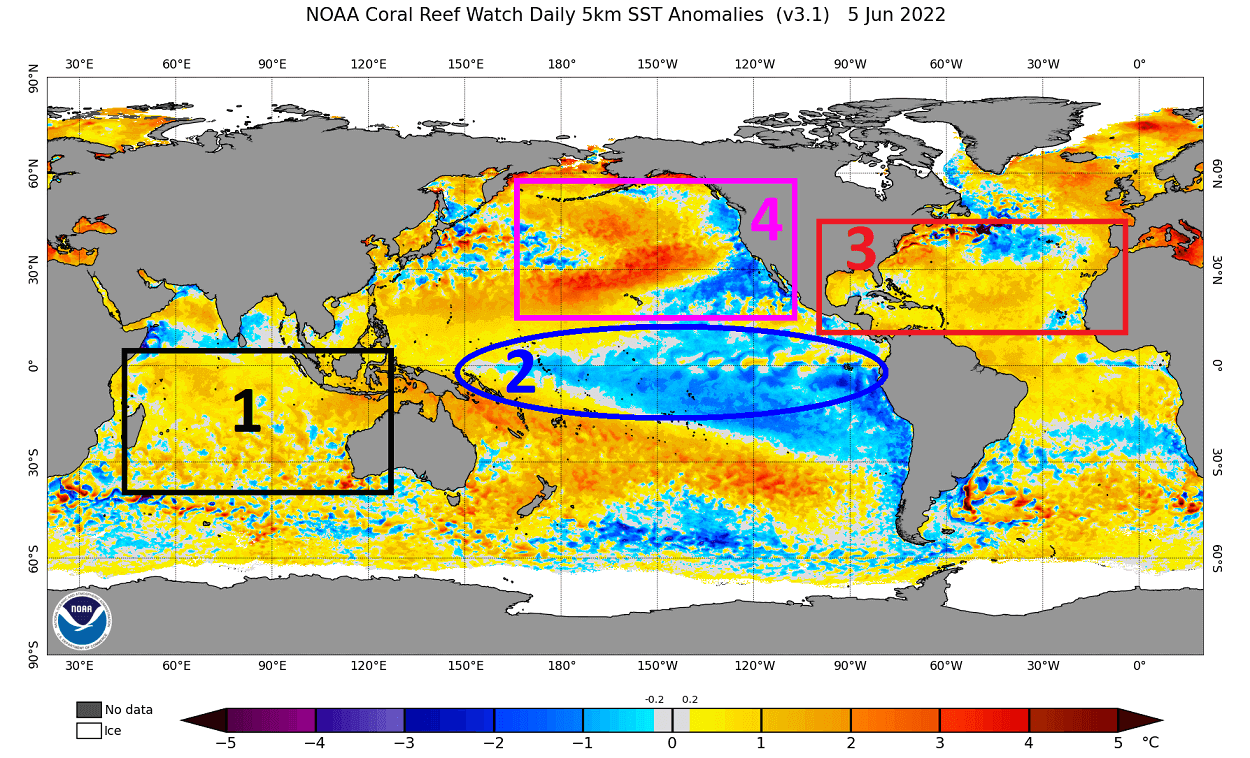
Image by NOAA Coral Watch
Region 1 is the Indian Ocean Dipole or IOD. It is an oscillation based on the temperature difference between the east and west Indian oceans.
Region 2 is the El Nino Southern Oscillation or ENSO. This is one of the most well-known ocean oscillations strongly influencing seasonal weather development.
Region 3 is the Atlantic Main Development Region or simply MDR. It is important mainly during the Atlantic hurricane season, as it provides an energy source for tropical systems.
And region 4 is the Pacific Decadal Oscillation or PDO. This region is important for its interaction with the seasonal weather patterns over North America.
We will cover these regions with basic information, analysis, and forecasts. And also, we will look at the historical pattern associated with these anomalies and what they can tell us for the 2022/2023 cold season.
ENSO GLOBAL WEATHER PATTERN
We will start with ENSO, as it is central in this story and connected with all other regions in some shape or form.
ENSO is short for “El Niño Southern Oscillation.” This is a region of the equatorial Pacific ocean that changes between warm and cold phases. Typically there is a phase change around every 1-3 years.
ENSO significantly influences tropical rainfall patterns (storms) and the complex exchange between the ocean and the atmosphere. With each new developing phase, we can observe large-scale pressure changes in the tropics. After some delay, these changes affect the circulation over the rest of the world.
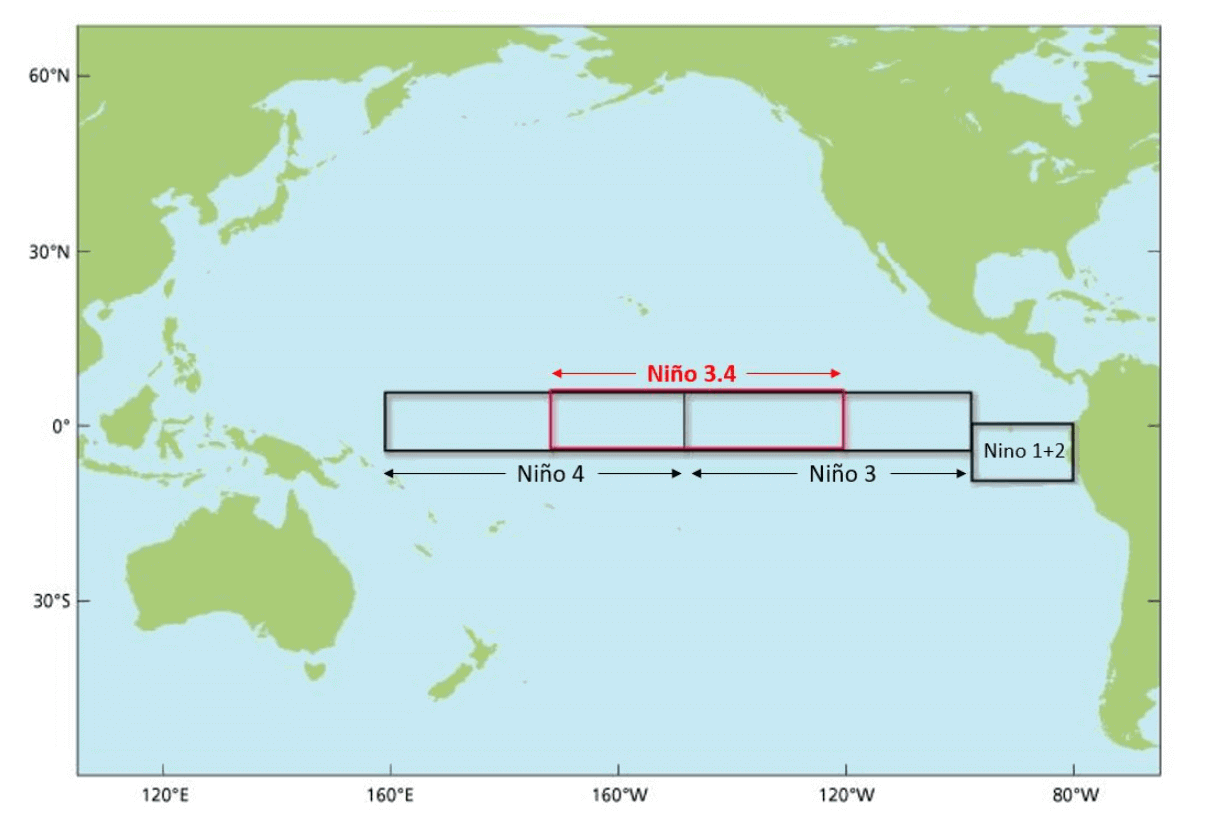
The image below shows the ENSO regions in the tropical Pacific. Regions 3.4 combines regions 3 and 4 and is the basis for analysis and forecasting.
Each phase (cold/warm) usually develops between late summer and early Fall and typically lasts until next summer. But some events can last even up to two years.
The cold ENSO phase is called La Nina, and the warm phase is called El Nino. We are currently in a La Nina phase, lasting for two whole years and entering its 3rd year, which is rare.
The image below from NOAA Climate shows the typical circulation during a cold ENSO phase (La Nina). Air descends in the eastern Pacific, causing stable and dry weather. At the same time, the air is rising in the western Pacific, causing low pressure and a lot of rainfall.
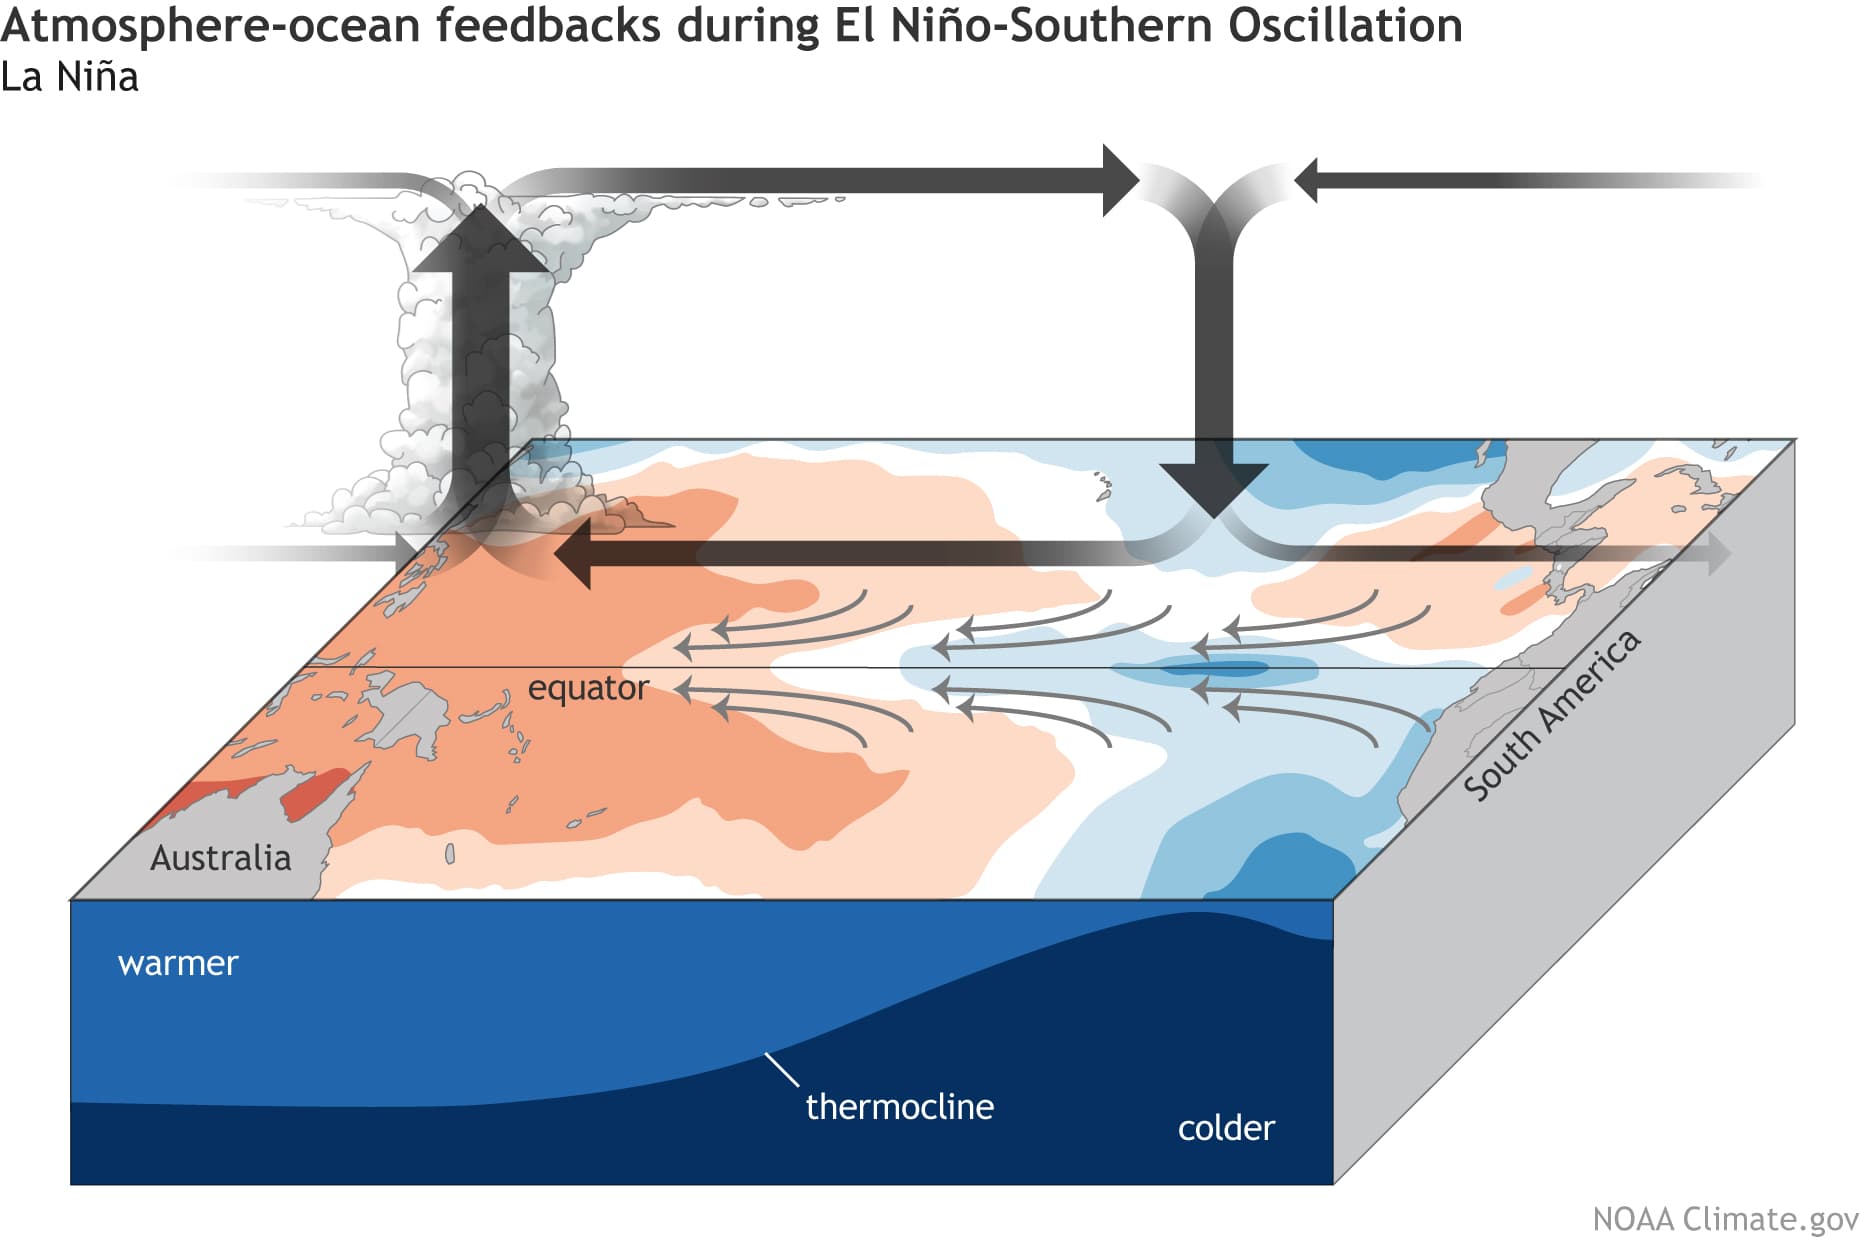
This way, ENSO significantly impacts the tropical rainfall and pressure patterns and thus impacts the ocean-atmosphere feedback system. Through this ocean-atmosphere system, the ENSO influence spreads globally.
Below we have the latest analysis of the Pacific Ocean. We can see the cold anomalies over the marked ENSO regions. That is the currently active La Nina.
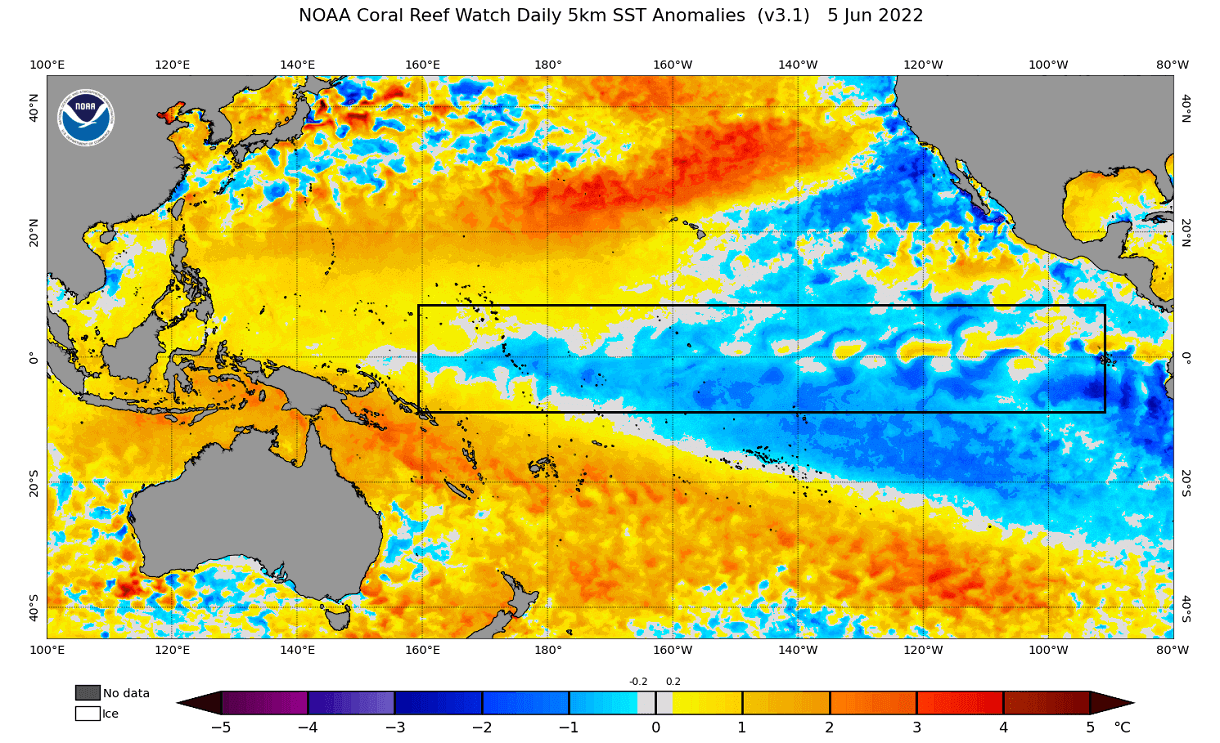
La Nina forms during strong trade winds, which can tell us a lot about the overall global circulation. This way, we can use these anomalies as an “indicator” to know the current state of the global climate system.
For a better idea of the ENSO development, we produced a video that shows the La Nina anomalies from last Winter to Spring.
The video below shows the cold ocean anomalies in the equatorial Pacific. Notice the “waveforms” across the region as trade winds push the surface waters west.
LA NINA FORECAST 2022
Below we have the ocean temperature forecast for late Summer and early Fall 2022 from the Copernicus site. It shows a continuing cold anomaly across the equatorial Pacific Ocean. This will push the La Nina into a rare 3-year event.
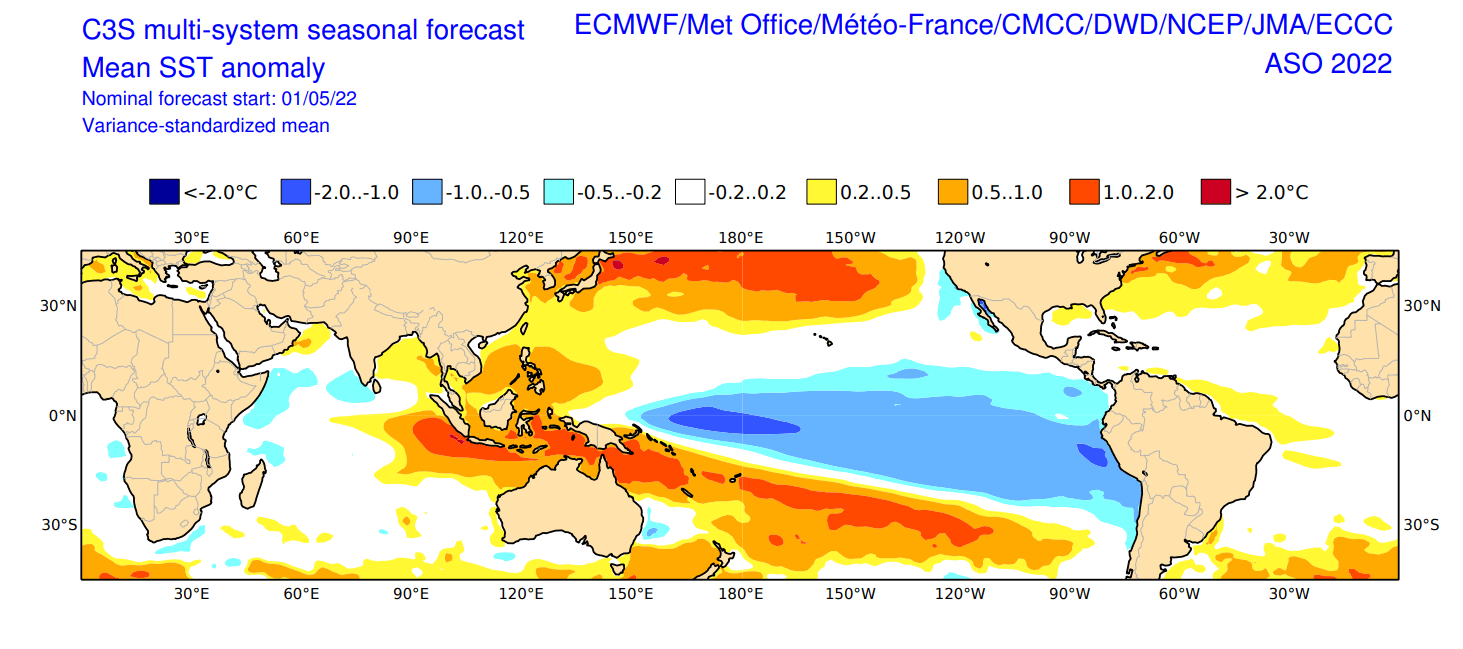
Image by Copernicus EU Project
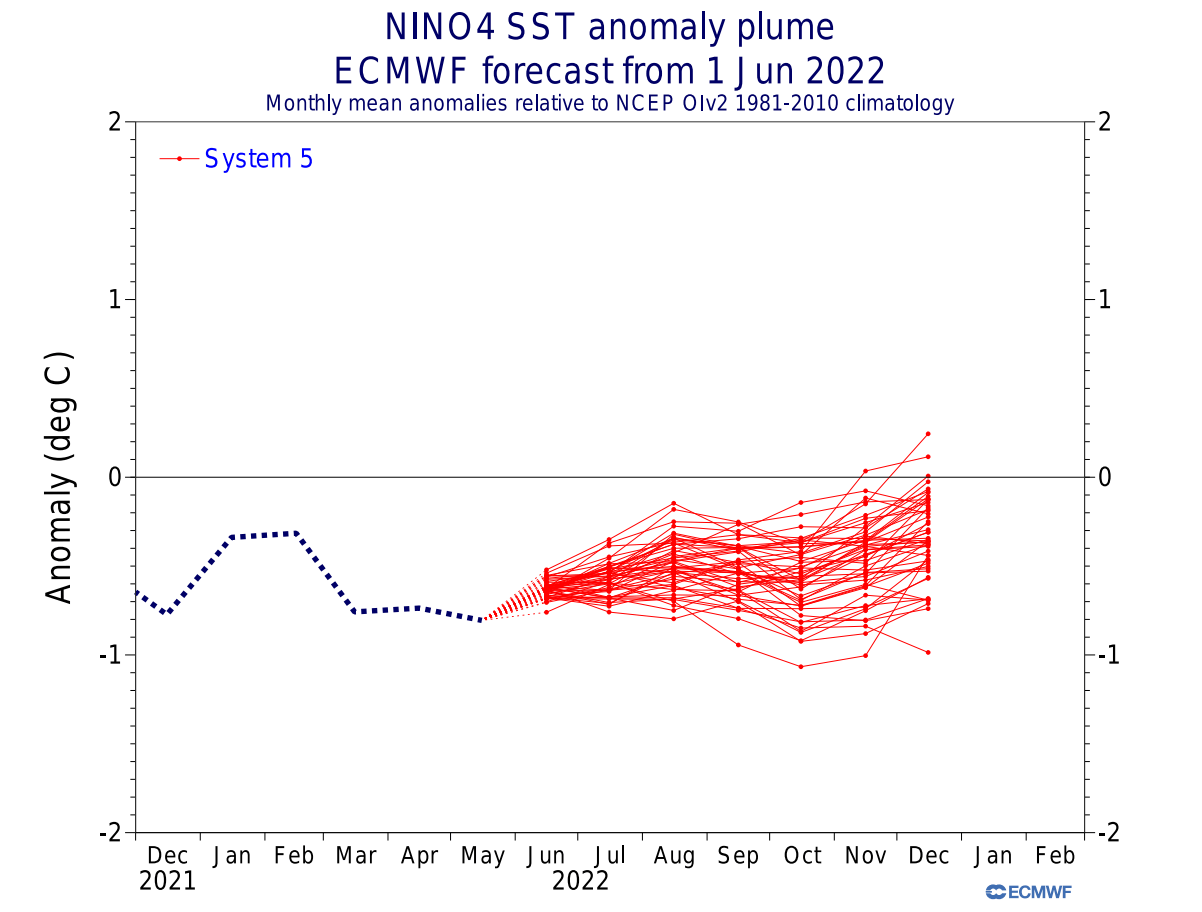
The ENSO analysis and ensemble forecast below from ECMWF shows the La Nina being present over the last Winter. On the forecast part, we see a sustained cold phase into the Fall and early Winter 2022/2023.
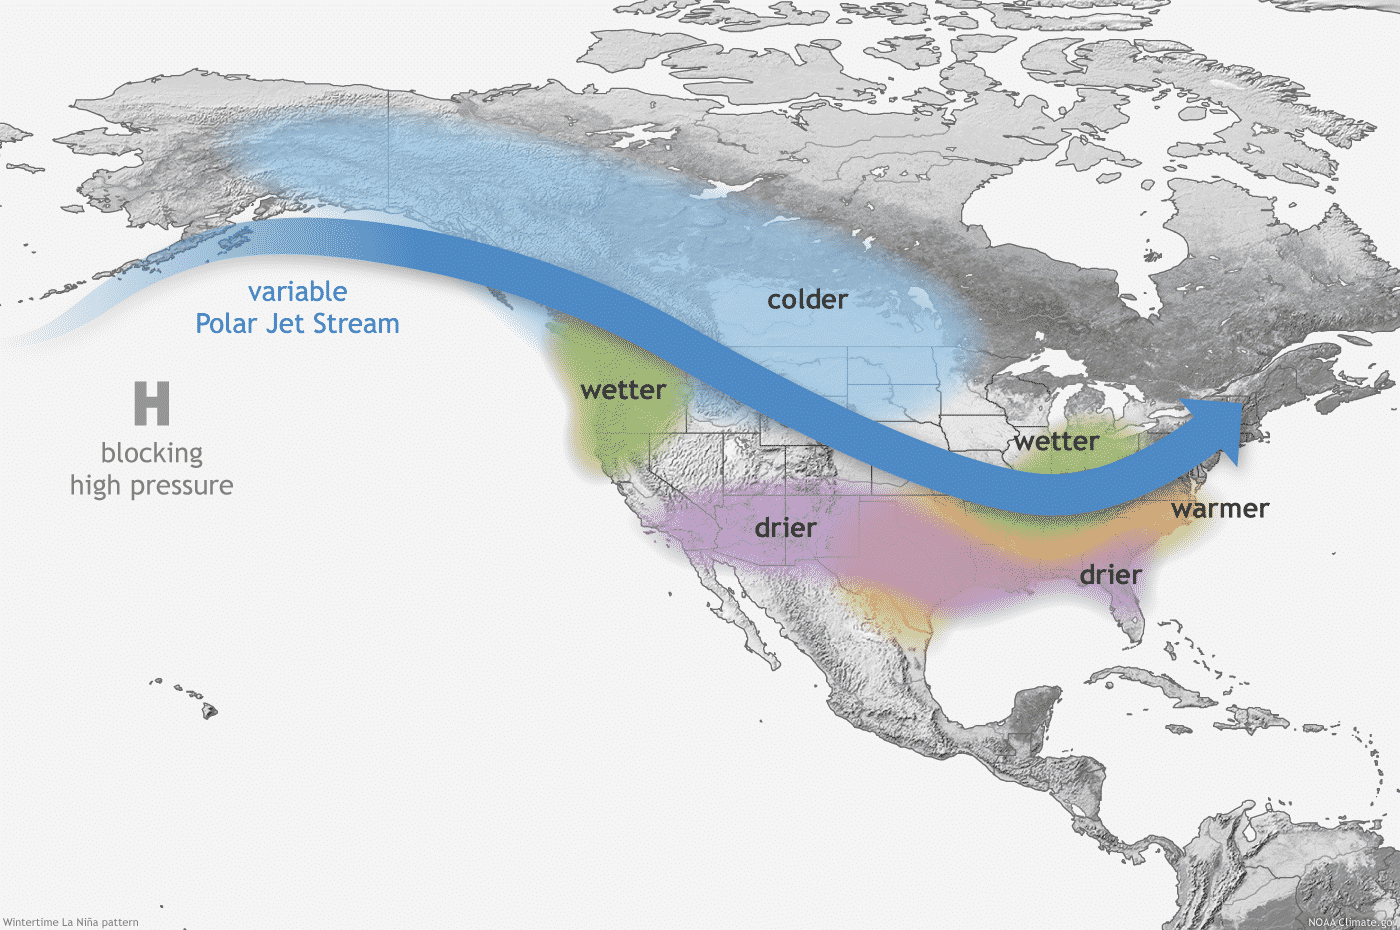
Below is an image showing the average winter pressure pattern, combining multiple La Nina winters. The main feature is a strong high-pressure system in the North Pacific and low pressure over western Canada.
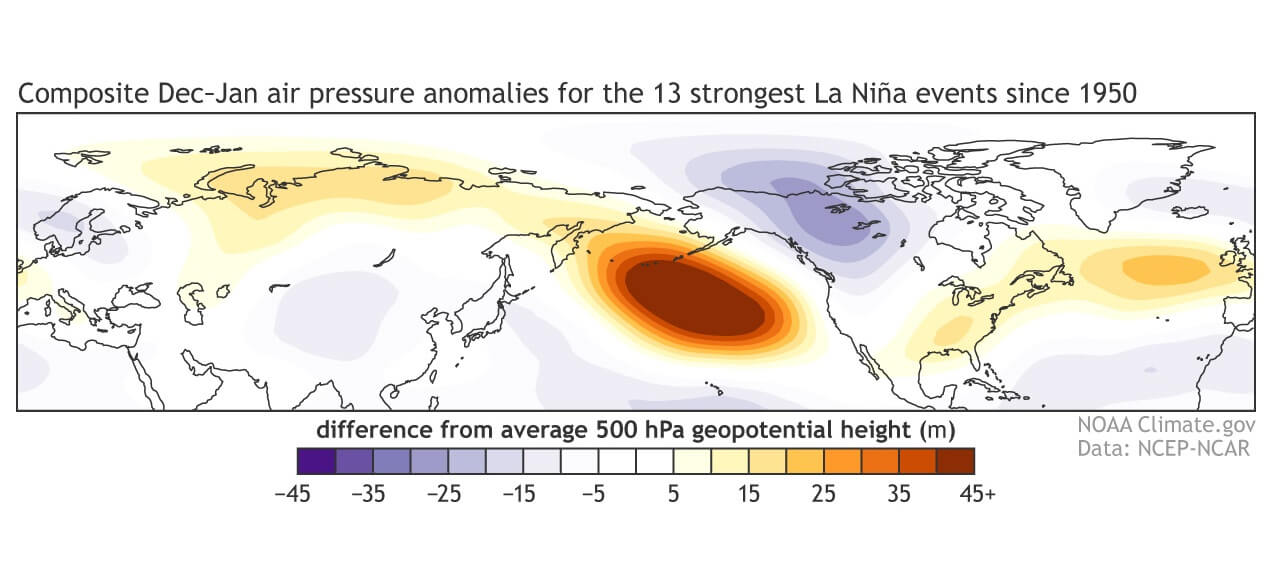
Looking closer at the La Nina cold season weather signature below, we can see its main feature, a persistent high-pressure system in the North Pacific. That usually shifts the jet stream from the northwestern United States down into the east, creating a “colder north/warmer south” weather pattern over the United States.
But we will publish a separate article for the ENSO and its seasonal influence, so we now move on to the next oceanic region, the PDO.
PACIFIC DECADAL OSCILLATION
As the name suggests, PDO is an ocean oscillation in the Pacific. More specifically, it covers the North Pacific Ocean, from the central regions to the west coast of North America.
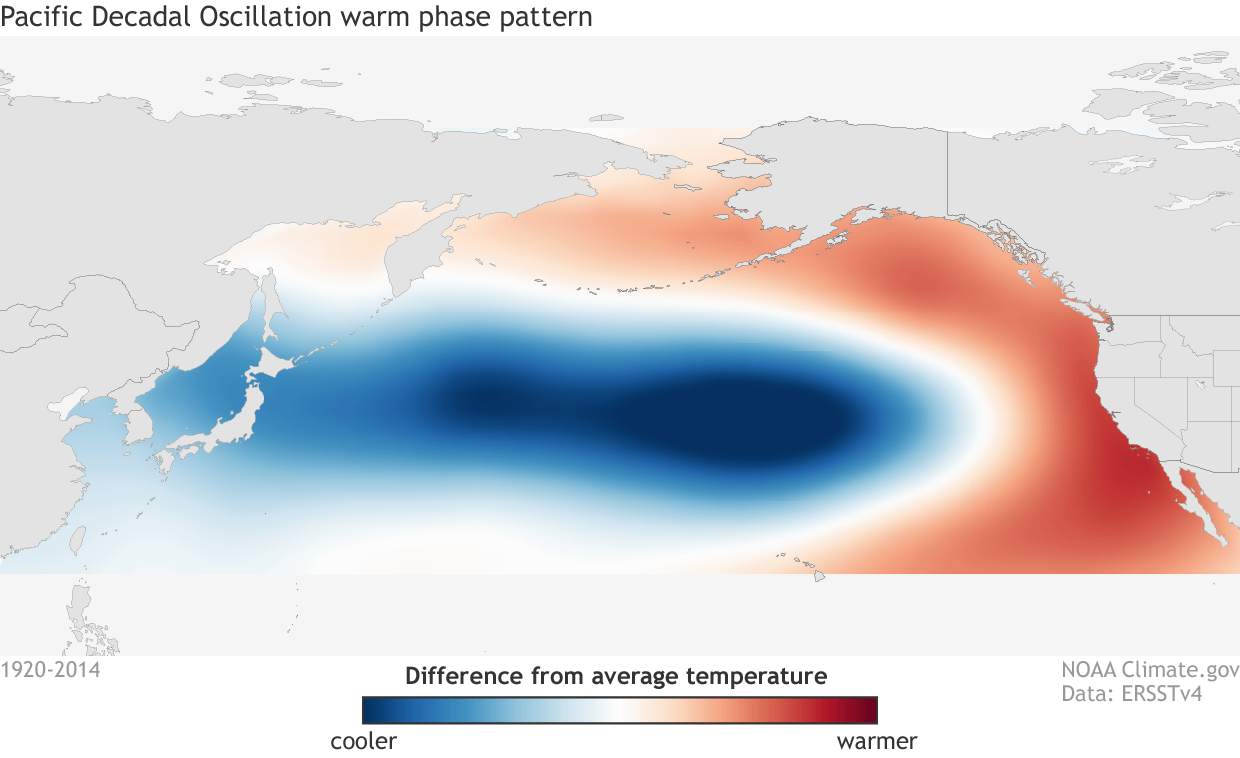
The Pacific Decadal Oscillation (PDO) is a term used to explain climatic events covering a large area of the Pacific Ocean over several decades. It has two phases, warm (positive) and cold (negative).
You can see in the image below what a typical PDO pattern looks like. It shows the positive (warm) phase. A horseshoe anomaly pattern along the west coast of North America tells us which phase is currently active.
But looking at the latest analysis, we can see an opposite pattern. This shows that the PDO is currently in the negative (cold) phase. It shows a typical cold west coast anomaly and a warm central region.

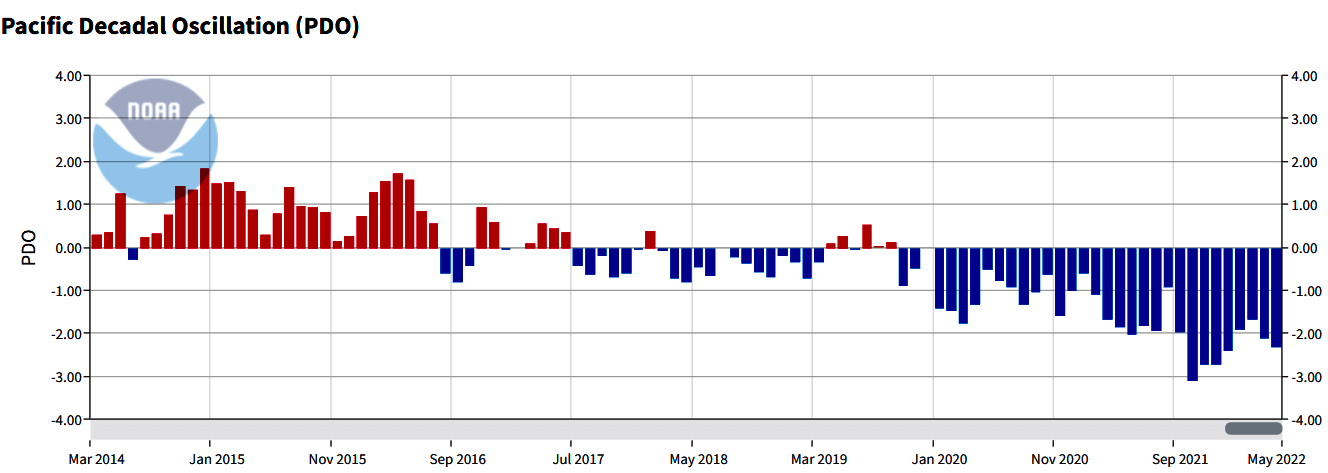
Below is an 8-year graph showing the PDO development since early 2014. You can see that the cold phase began powering up in early 2020. The graph also shows the transition process from one phase to another, which takes some time.
The seasonal forecast from the Canadian CanSIPS model shows the typical negative PDO pattern to remain into the Winter of 2022/2023. You can see the cold pattern along the west coast of North America and the warm central North Pacific region.
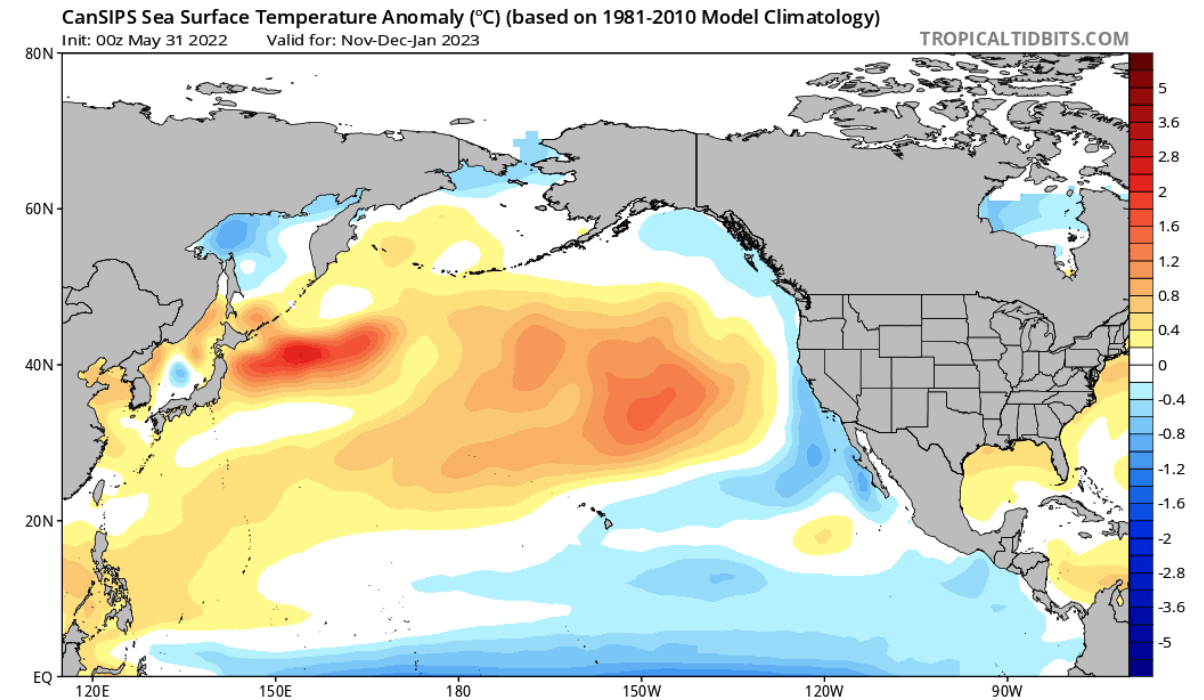
Image by Tropical Tidbits
COLD SEASON PDO INTERFERENCE
But what is the importance of PDO? First, the PDO is significant for the climate and seasonal weather patterns in the North Pacific and North America.
Below you can see the correlation between the pressure patterns and the negative PDO during the winter seasons in the past 40 years.
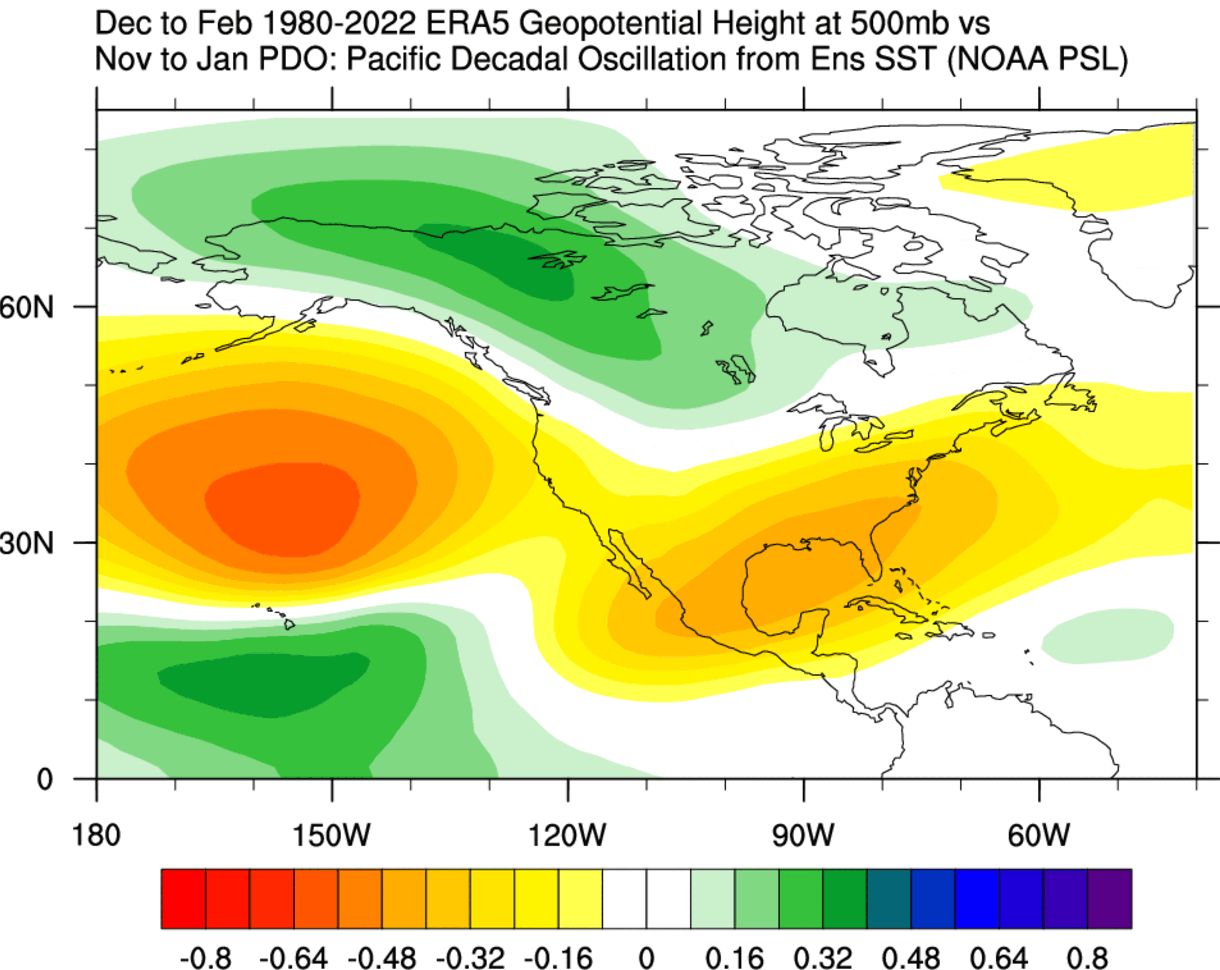
The signal shows that negative PDO supports a high-pressure system in the North Pacific and over the southeastern United States. But also a low-pressure area over western Canada and the northern United States.
PDO is very closely related to the ENSO, which we explained earlier. Though focused on different areas, both are connected and tend to give a similar atmospheric response in a specific phase (warm/cold).
Looking at the winter temperature signal, we can see the negative PDO signature in the Pacific Ocean. But North America had colder temperatures in the western and northwestern United States and western Canada. Over the southern and eastern nited States, the cold PDO favors warmer than average temperatures.
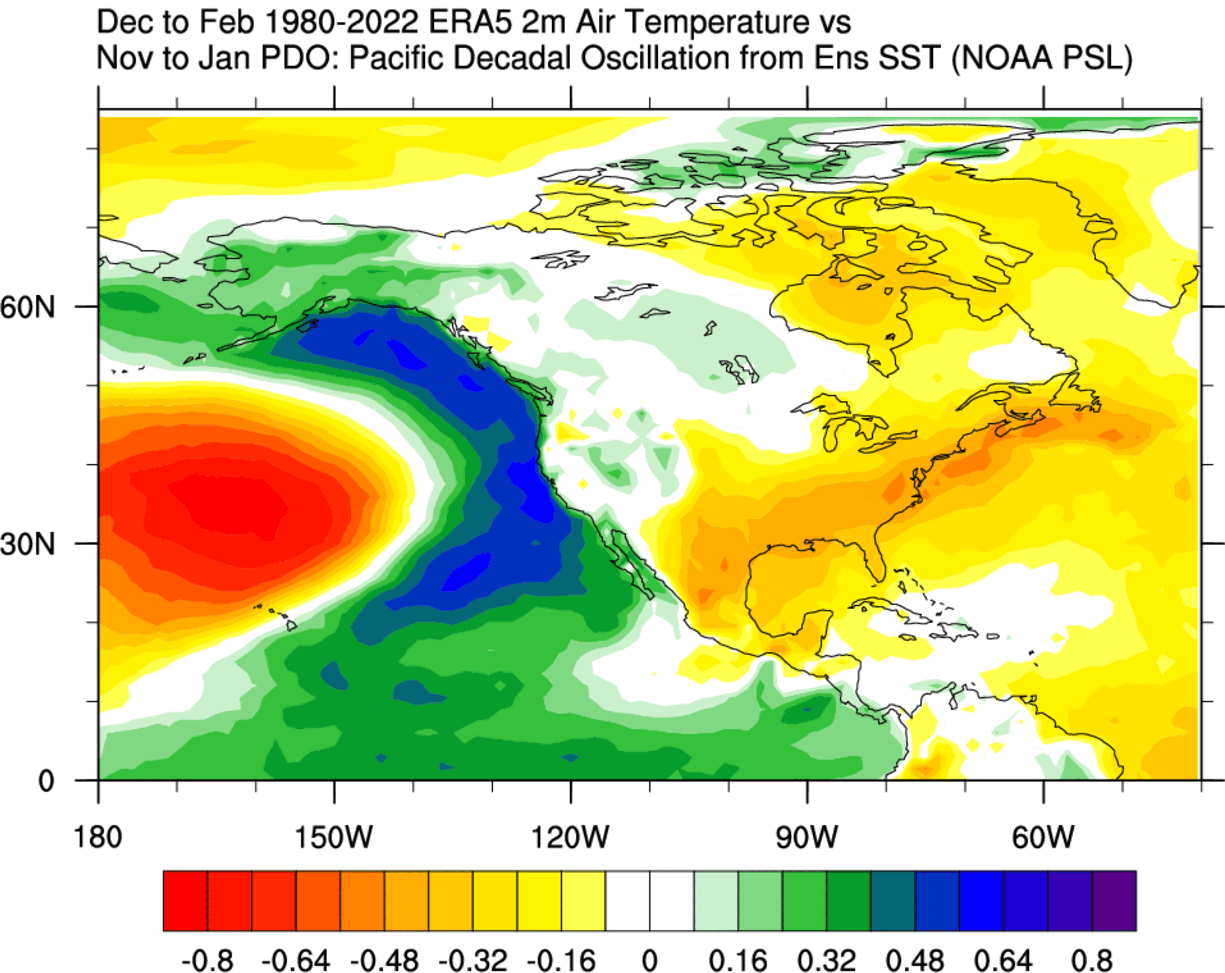
Image by NOAA PSL
Of course, this is not exactly how every cold PDO winter looks, as there are many other oceanic and atmospheric factors that shape a particular season. But we see the tendency or a trend that this particular influence might favor.
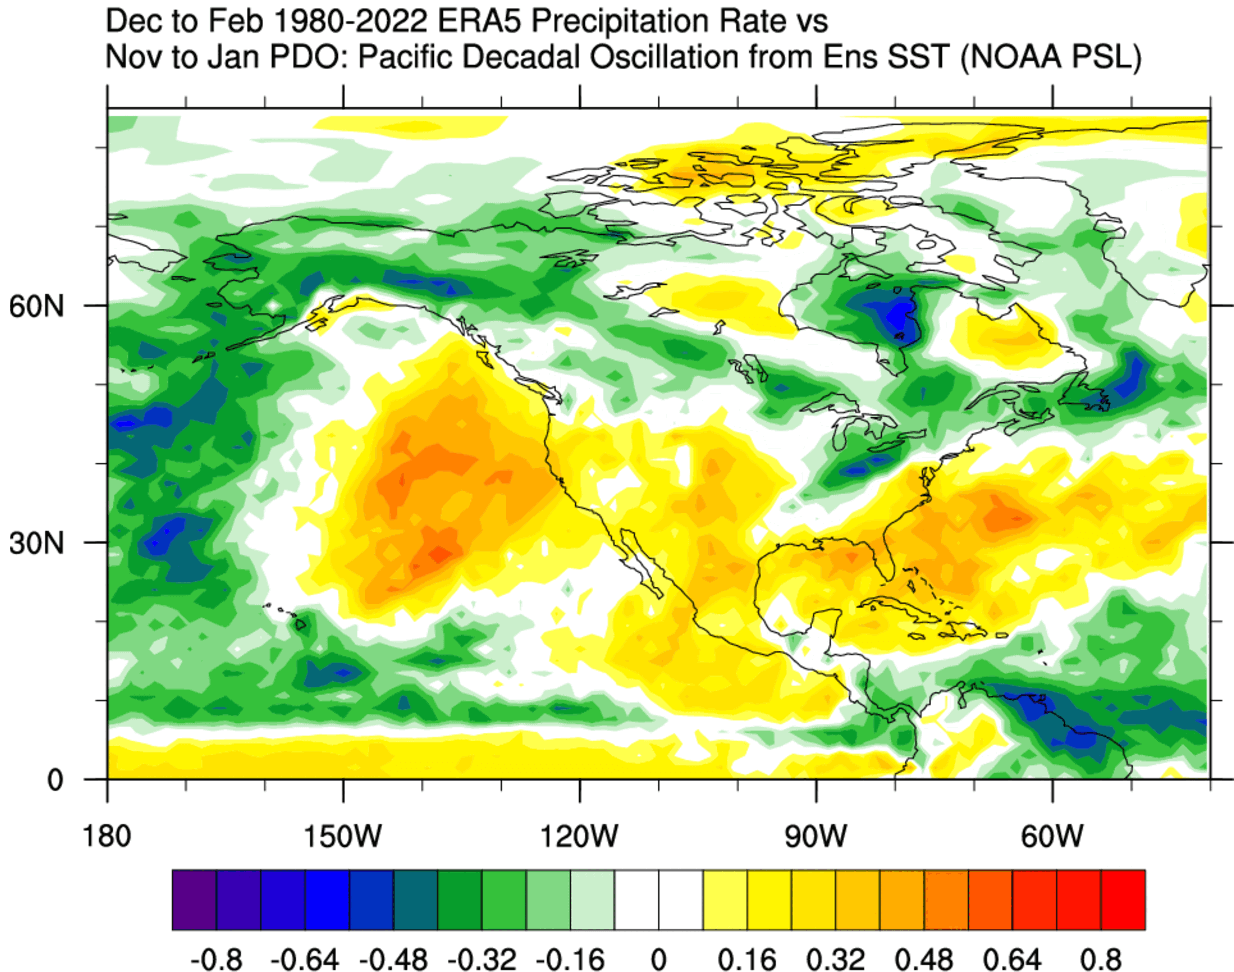
Perhaps more important than temperatures is the PDO influence on precipitation. In a cold phase, we tend to see less precipitation over the central and western United States. More precipitation is usually expected over the Ohio Valley and the northeastern United States.
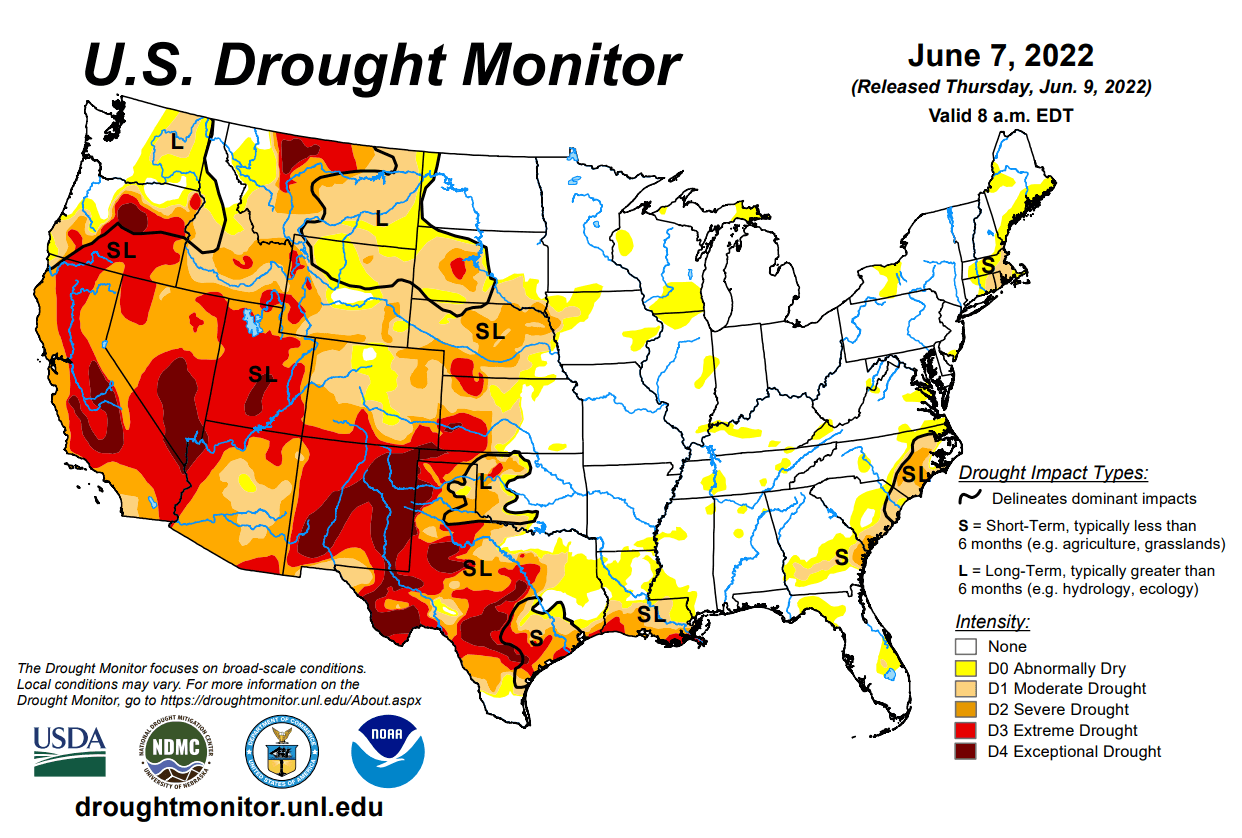
We have been in a negative PDO for over two years now. So looking at the United States drought analysis by NOAA, we can see the significant drought conditions over the western and the southwestern United States.
But PDO is not the only ocean anomaly with a “double” temperature anomaly pattern. As you will now see, there is another strong ocean anomaly that is connected with ENSO as well.
INDIAN OCEAN DIPOLE PATTERN
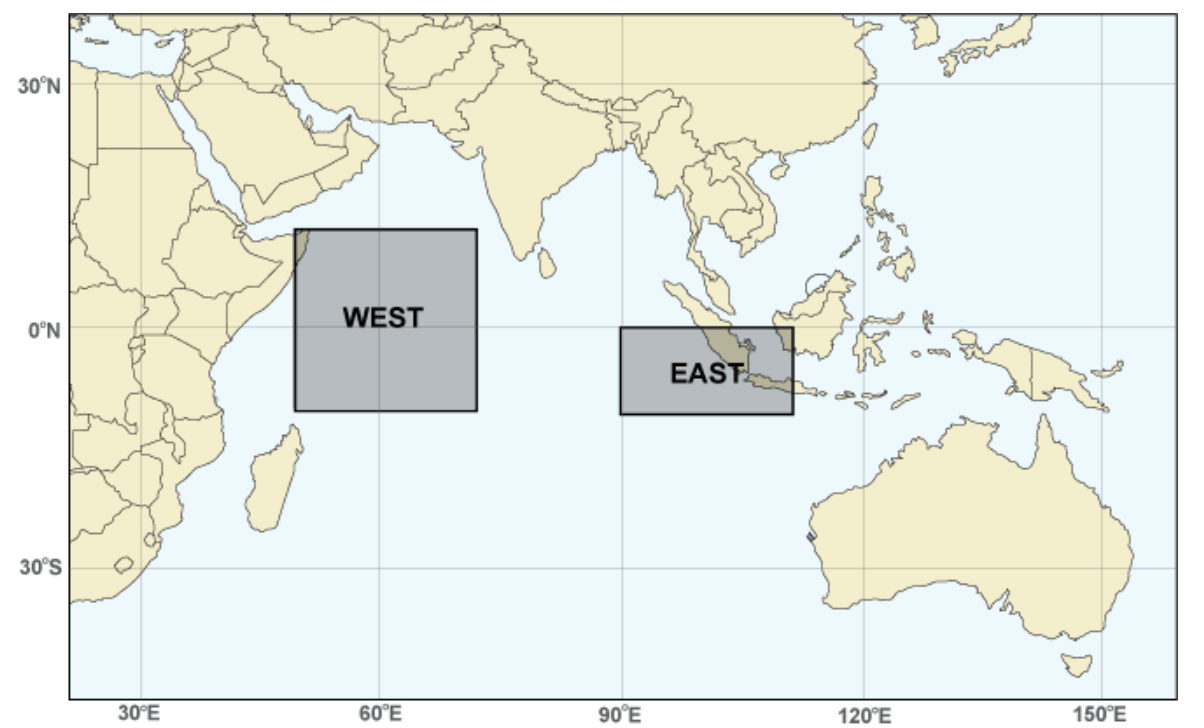
Indian Ocean Dipole (IOD) is found in the Indian Ocean, and consists of two poles, hence the name “dipole.” The east part is located around Indonesia, and the west part covers the western Indian Ocean.
The IOD is basically an imbalance in ocean temperatures between these two regions, east and west. Changes in temperatures between the regions occur due to the change in trade wind patterns. Thus, the IOD has two phases, positive and negative.
The image below shows a typical IOD pattern and a temperature difference between the east and west. This corresponds to a negative IOD event, with negative ocean anomalies in the western Indian Ocean.
The trade winds cool the west and warm the east Indian Ocean, changing the pattern of tropical convection and precipitation. Tropical convection favors warmer waters, so we see lower pressure, more rain, and storms in the east, where we have warmer waters. Image by NOAA Climate.
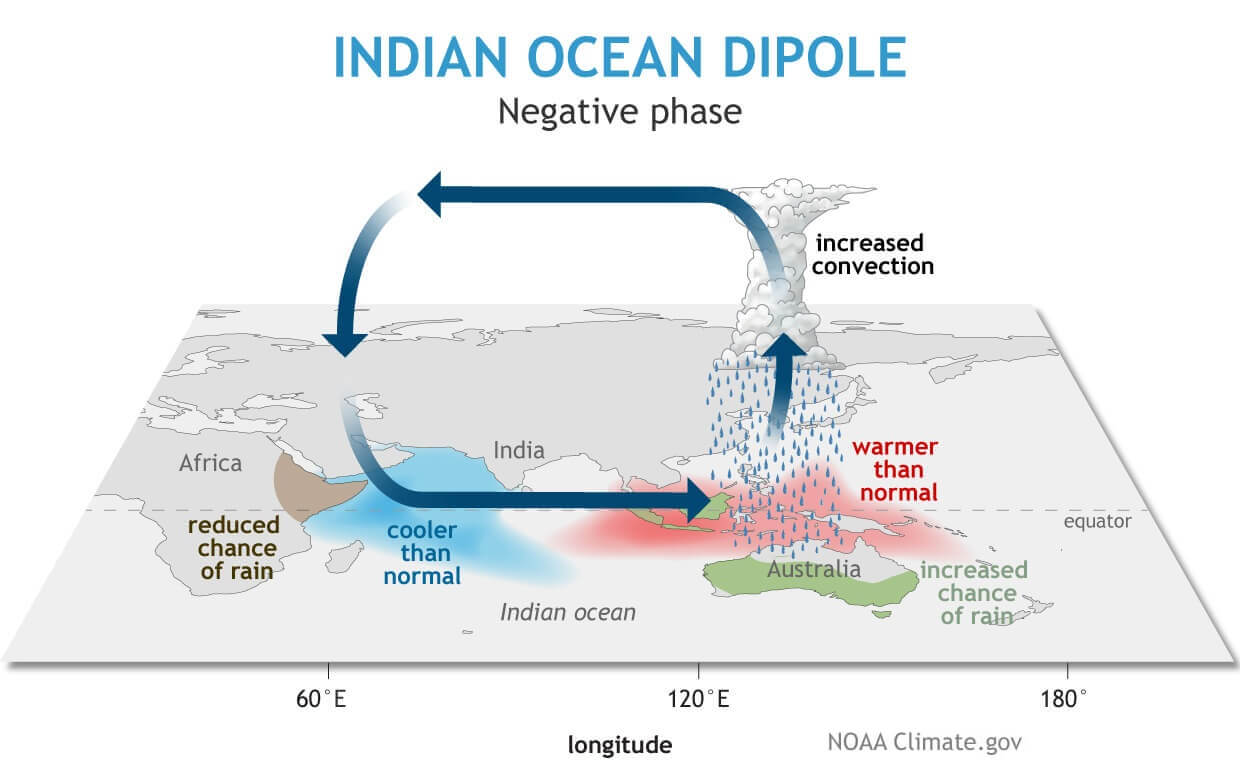
And we see the opposite in the west, where we have higher pressure, less rain and storms, and drier conditions across the region. The graphic above is a simplified depiction of a negative IOD event.
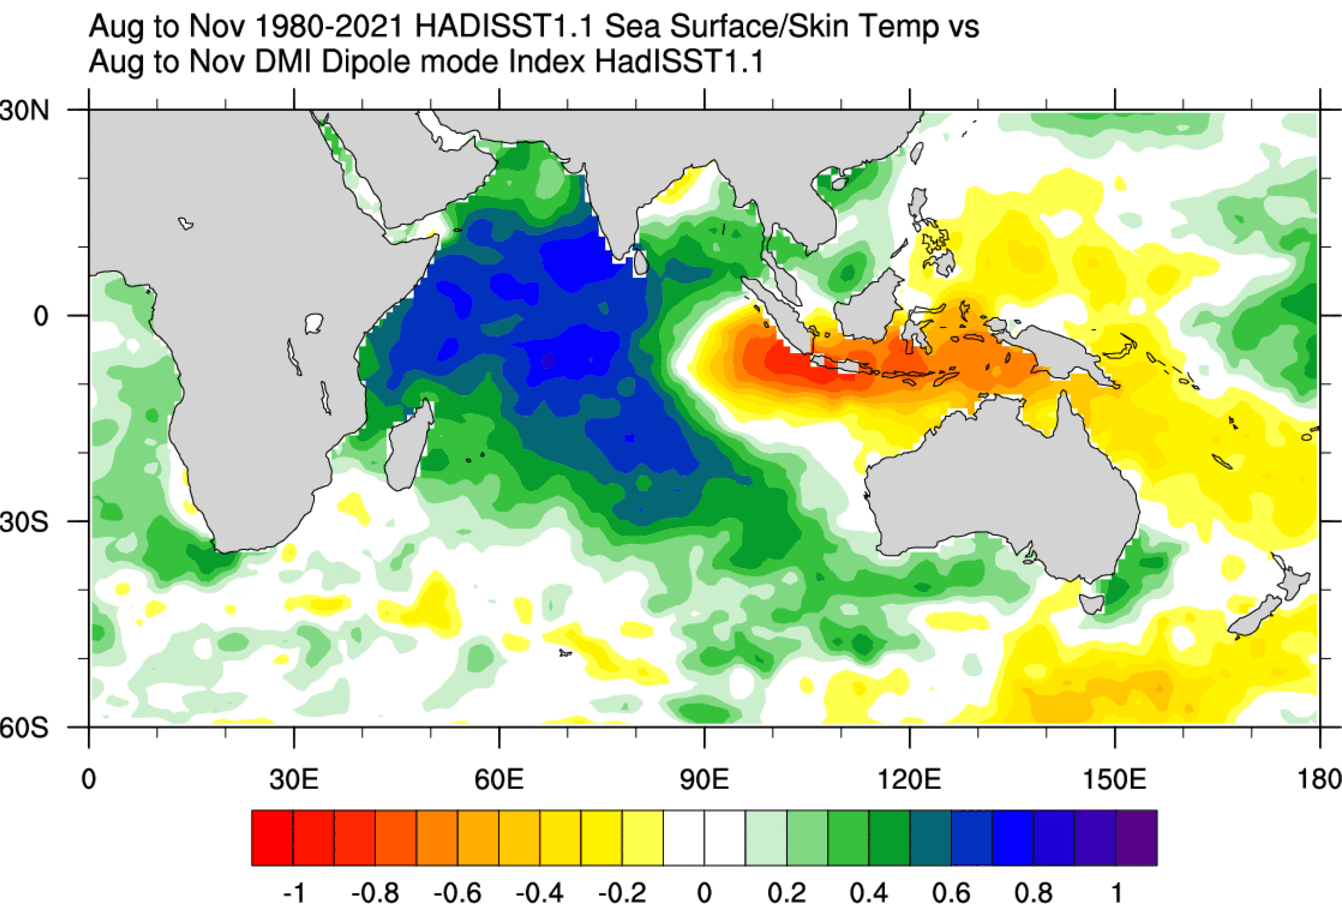
Looking at the data graph for the IOD, we can see a negative tendency in the past seasons. That is mainly related to the active cold La Nina in the ENSO regions.
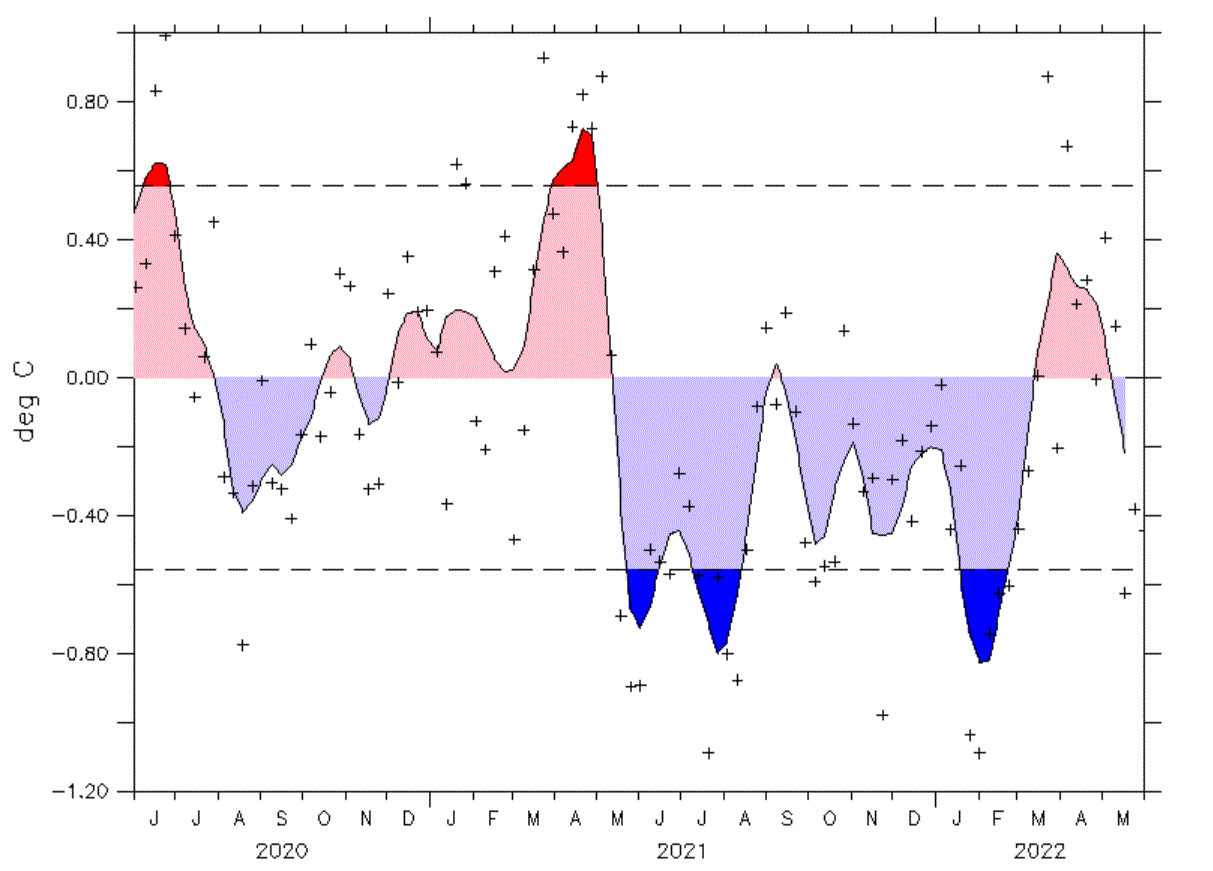
Image by NOAA
The latest ocean analysis shows a temperature difference between the eastern and western regions of the Indian Ocean. So you can see warmer anomalies in Indonesia. But in the western parts, we have weaker anomalies and some negative areas developing.
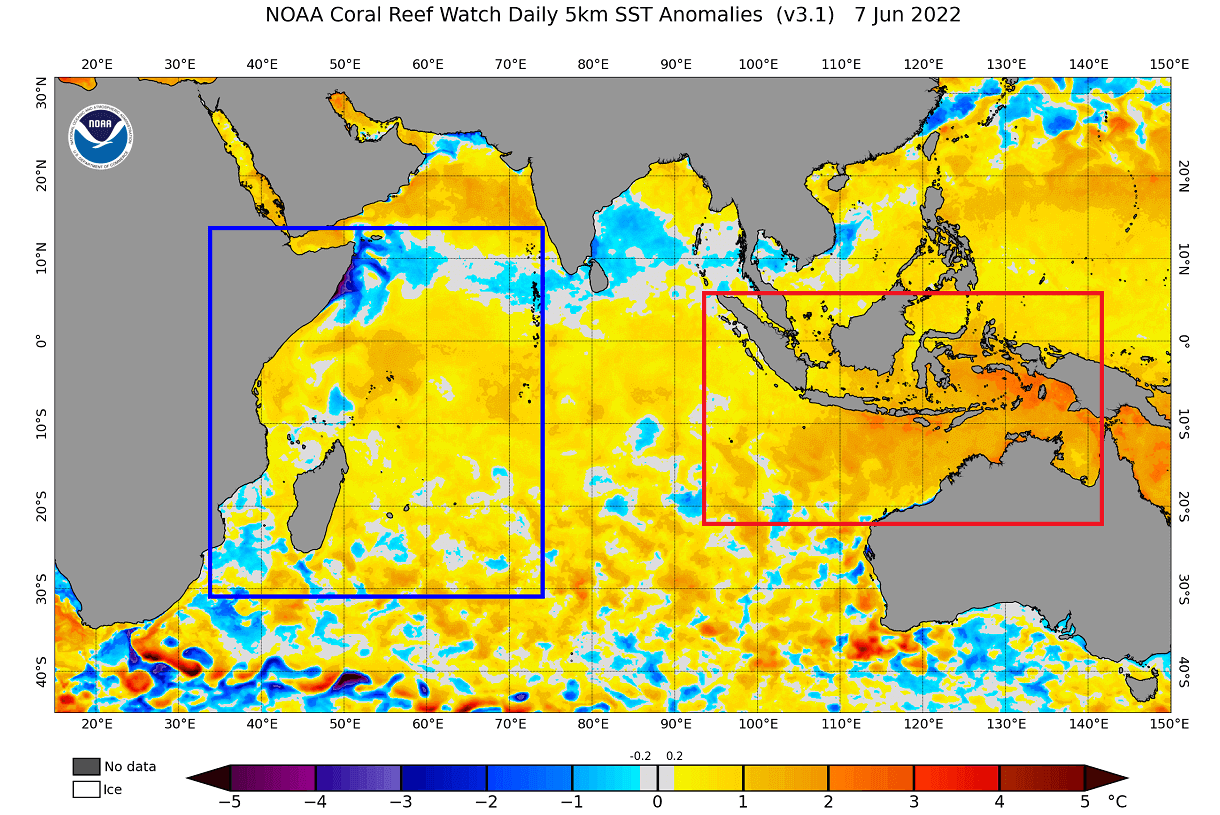
As we now know, when the eastern regions are warmer, that signals a negative IOD phase. So more warming in the east and cooling in the west is expected.
You can see this development in the ECMWF seasonal forecast below. A strong negative IOD phase is expected going into Fall, with the atmospheric interference expected to extend into Winter 2022/2023.

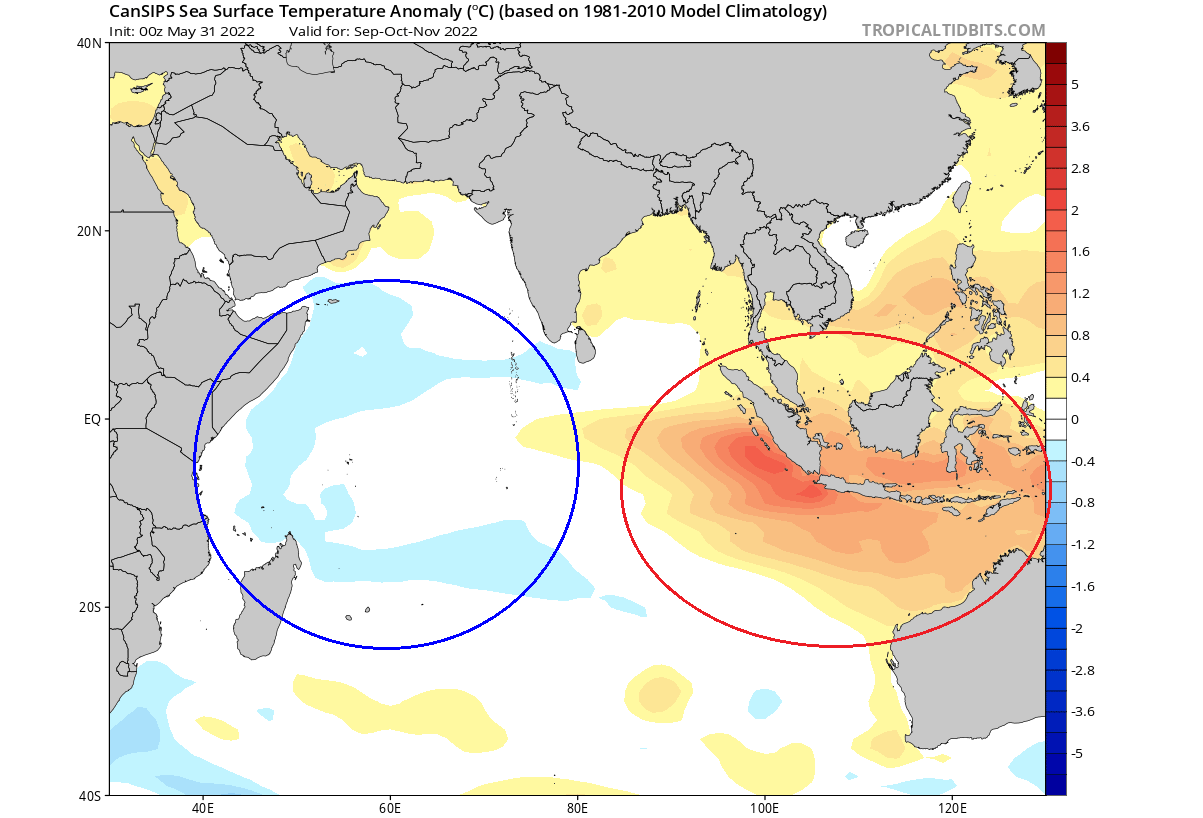
Looking also at the Canadian CanSIPS seasonal forecast, we can see the ocean temperature forecast for Fall 2022. Again, you can see warm anomalies in the east and cold anomalies in the west. This is a typical strong negative IOD pattern.
COLD SEASON IOD INFLUENCE
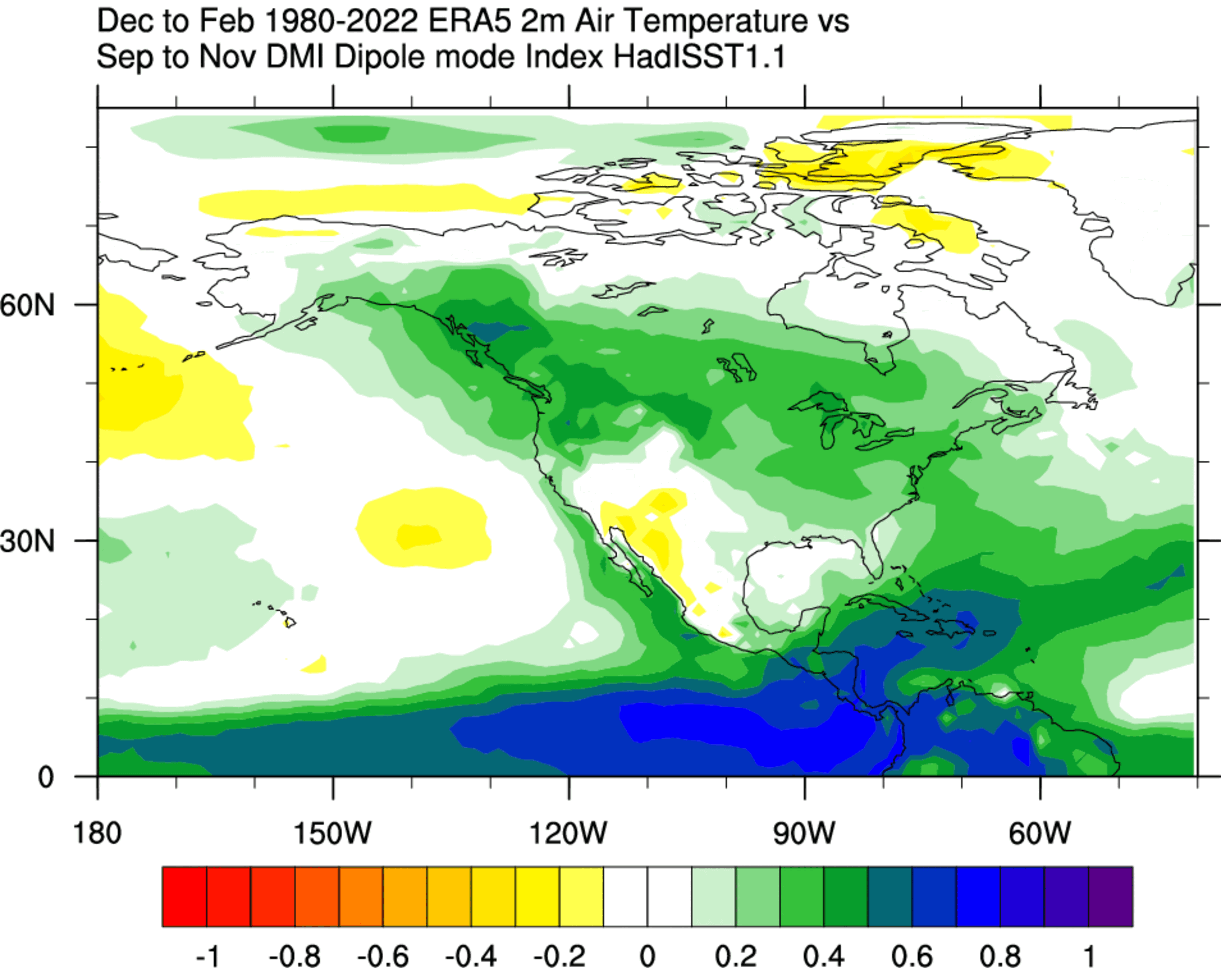
Of course, historically, it is important to know what a strong n negative IOD means for the cold season. Below we have a 40-year correlation between IOD and the 500mb geopotential height pattern in the winter season.
We can see strong negative anomalies over the tropics during a negative IOD, but that is not so important directly and correlated to other factors. For example, we can see a high-pressure area in the North Pacific and a low-pressure zone over Canada and the northern United States.

We can also see a high-pressure zone appearing in the North Atlantic, showing a negative NAO index setup. This pattern is close to negative PDO and ENSO (La Nina). Overall they all interfere with each other and impact the cold season climate.
Below is the IOD winter temperature signal, focused on the Pacific and North America. A negative IOD supports colder temperatures over western and southern Canada and northern and eastern United States.
The negative IOD and PDO usually co-exist with a negative ENSO phase (La Nina). That means that their historical pattern can look similar.
But there is a region that has a much more direct impact on the weather development. The tropical Atlantic Ocean is a key factor during a hurricane season, which also depends on the active La Nina.
ATLANTIC MAIN DEVELOPMENT REGION
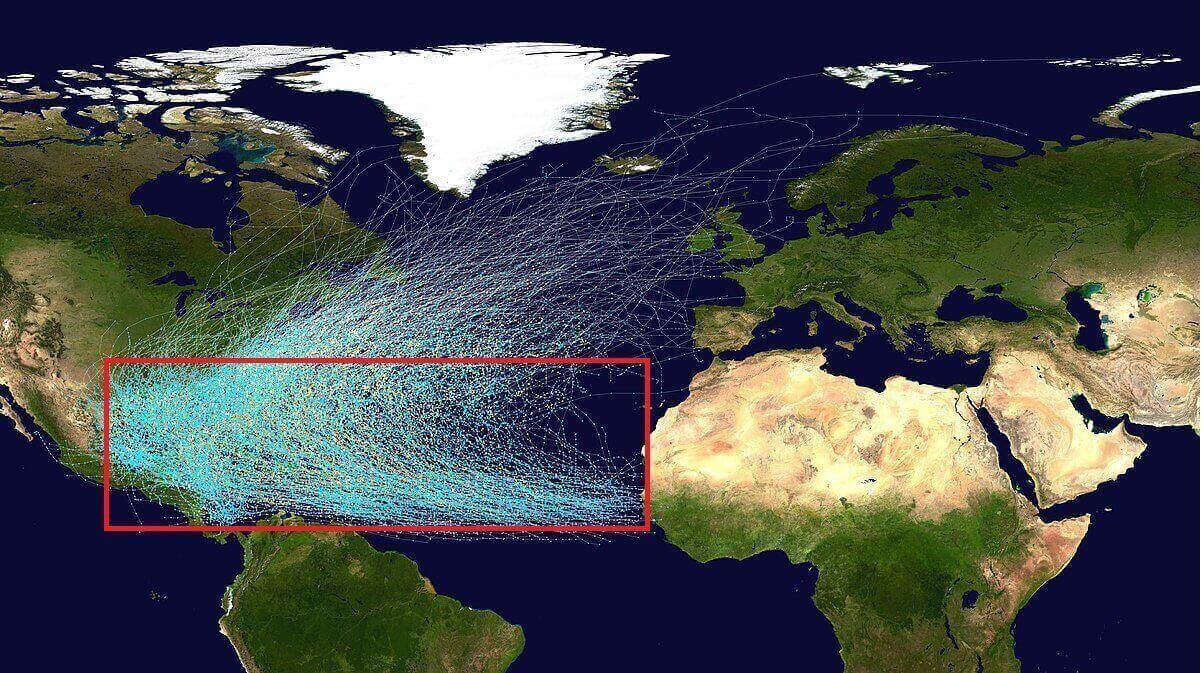
The Atlantic Main Development Region (MDR) covers the region of the Atlantic Ocean where most tropical systems form during the hurricane season.
In the image below, you can see the historical tracks of tropical systems in the Atlantic Ocean. The MDR is focused more on the north tropical Atlantic Ocean, but we have extended the area further west.
A warm ocean provides an energy source for tropical systems, influencing their strength and longevity. But, of course, that also depends on the atmospheric conditions, so we have to monitor both.
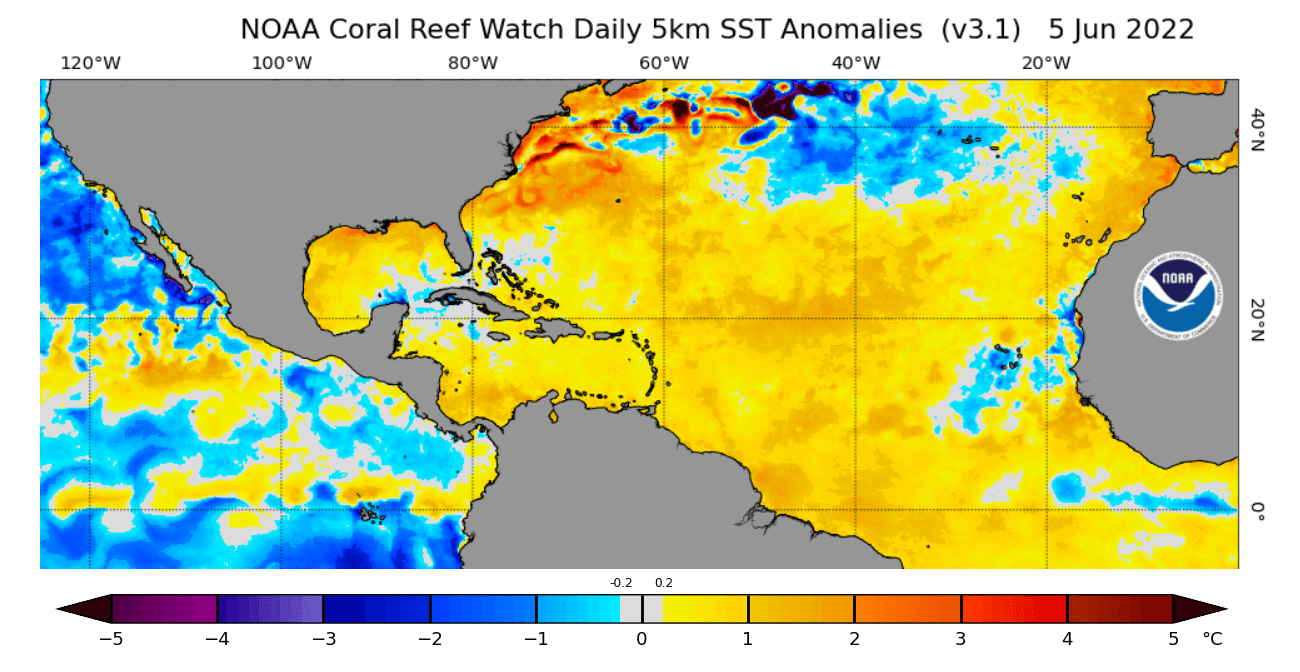
The latest ocean analysis shows mostly warmer than average ocean temperatures across the MDR. Warmer ocean temperatures here can provide an additional boost during the hurricane season, which is a sign of potentially more activity.
But we also have to consider the atmosphere. It is well-known that La Nina has an influence on the hurricane season, providing certain atmospheric conditions that favor an active season.
In the image below, you can see the schematic of La Nina’s influence on the Atlantic hurricane season. The main effect of the La Nina is weaker upper-level winds over the MDR; thus, the wind shear is lower, and the atmosphere is more unstable.
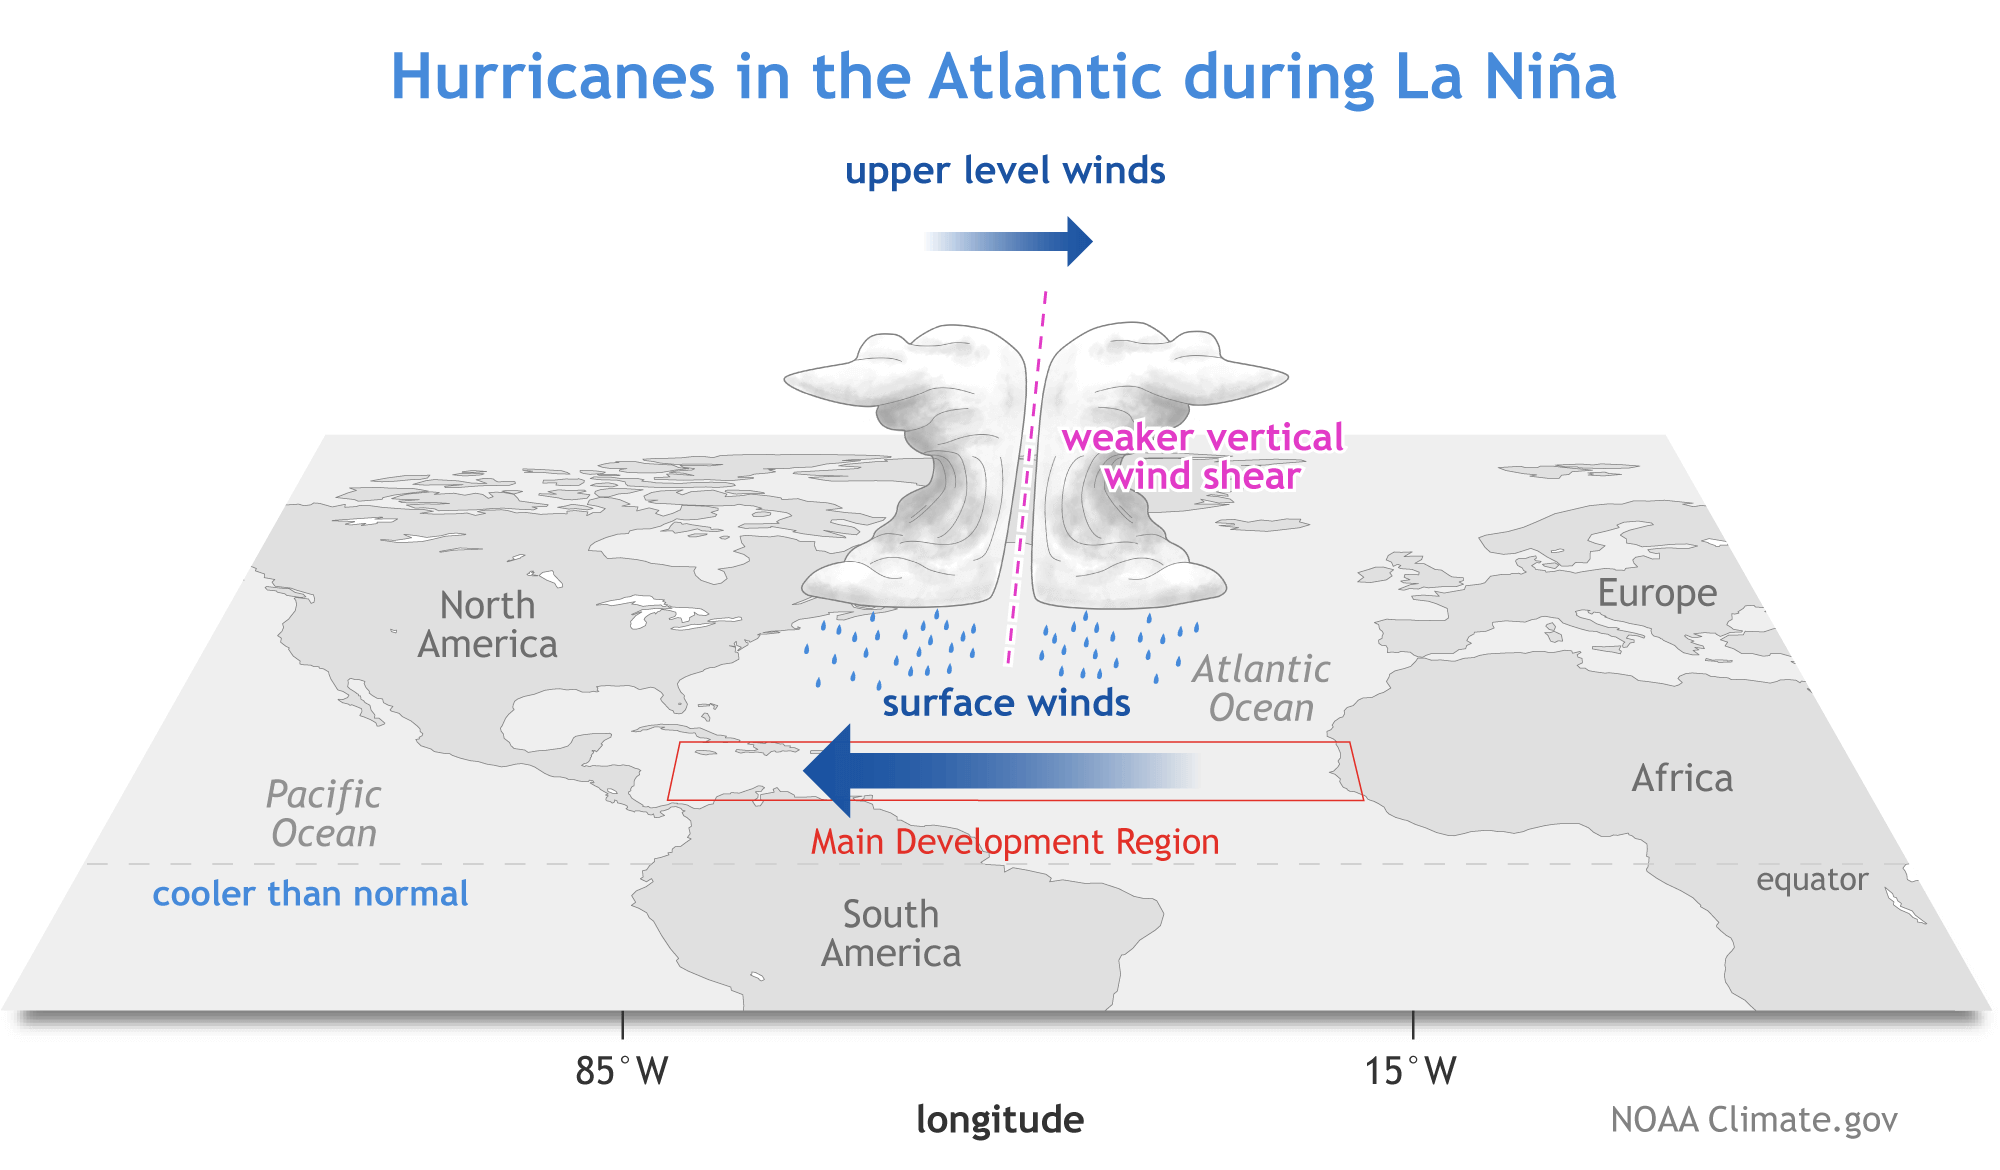
Lower shear means the storms can organize more rapidly and have less interference. Combined with warmer than usual oceans for more energy, it supports easier development and stronger tropical systems.
HURRICANE SEASON MDR FORECAST
The latest ocean temperature forecast from the North American NMME system shows the active cold anomalies in the ENSO region. But in the tropical Atlantic Ocean, the forecast shows warmer than normal temperatures.
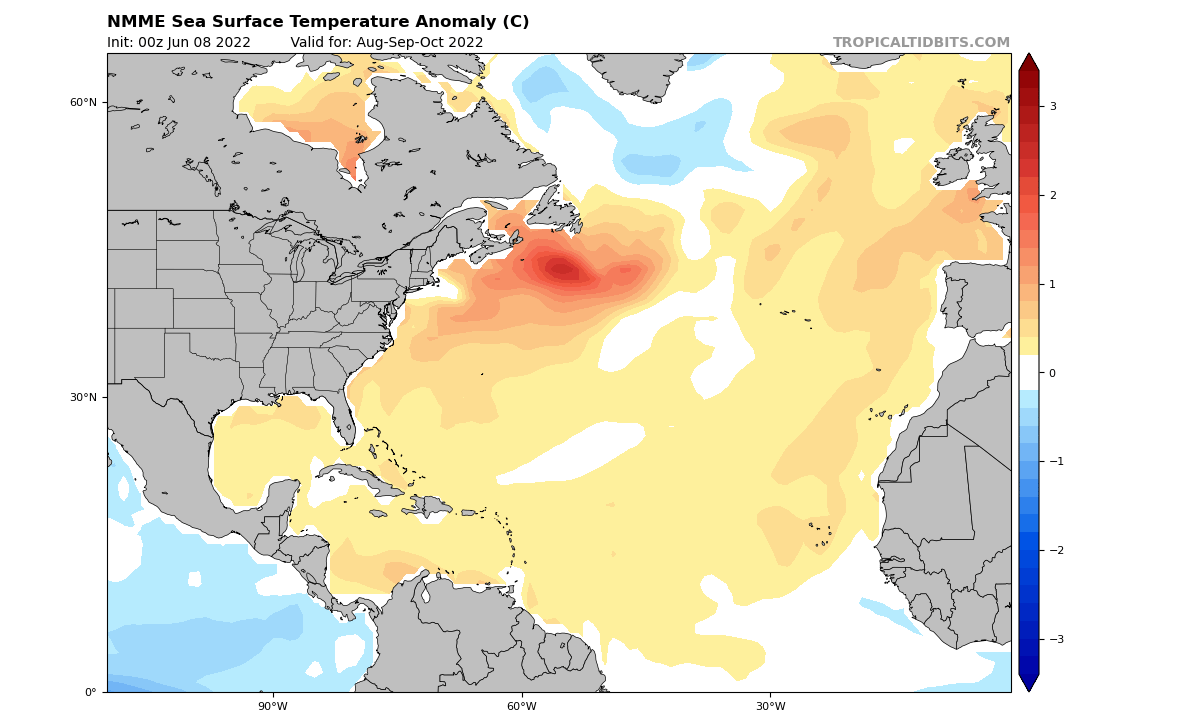
An active cold ENSO phase means less shear and more atmospheric instability over the MDR. Together with warmer oceans, we can expect an above-average activity during the hurricane season.
We can actually track the activity by looking at the precipitation forecast. This does not tell us the number of tropical systems but can show us where more/fewer storms will pass over.
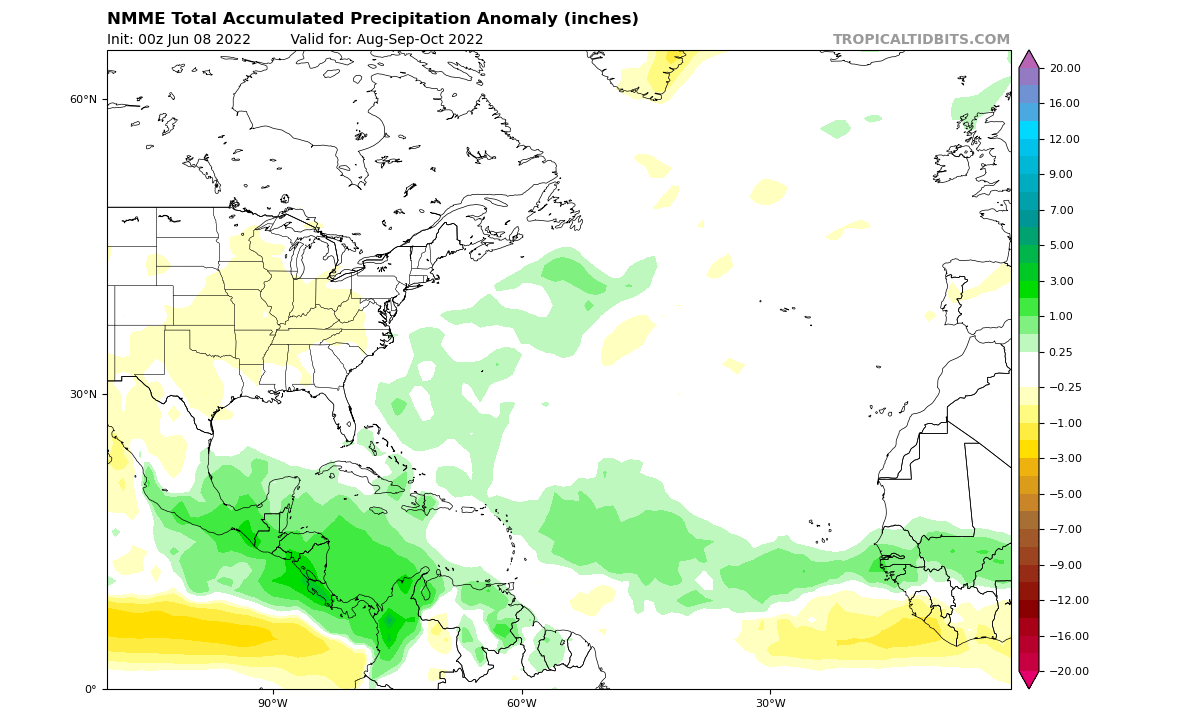
You can see a very obvious trail of more precipitation across the MDR, curving up along the east coast of the United States. This can signal more storms, with favorable conditions to support strengthening and longevity.
Looking at the actual ECMWF forecast for Accumulated Cyclone Energy (ACE), we see an above-normal forecast for the Atlantic hurricane season. This can mean either a higher number of medium-power systems or a few major hurricanes that can quickly boost ACE.
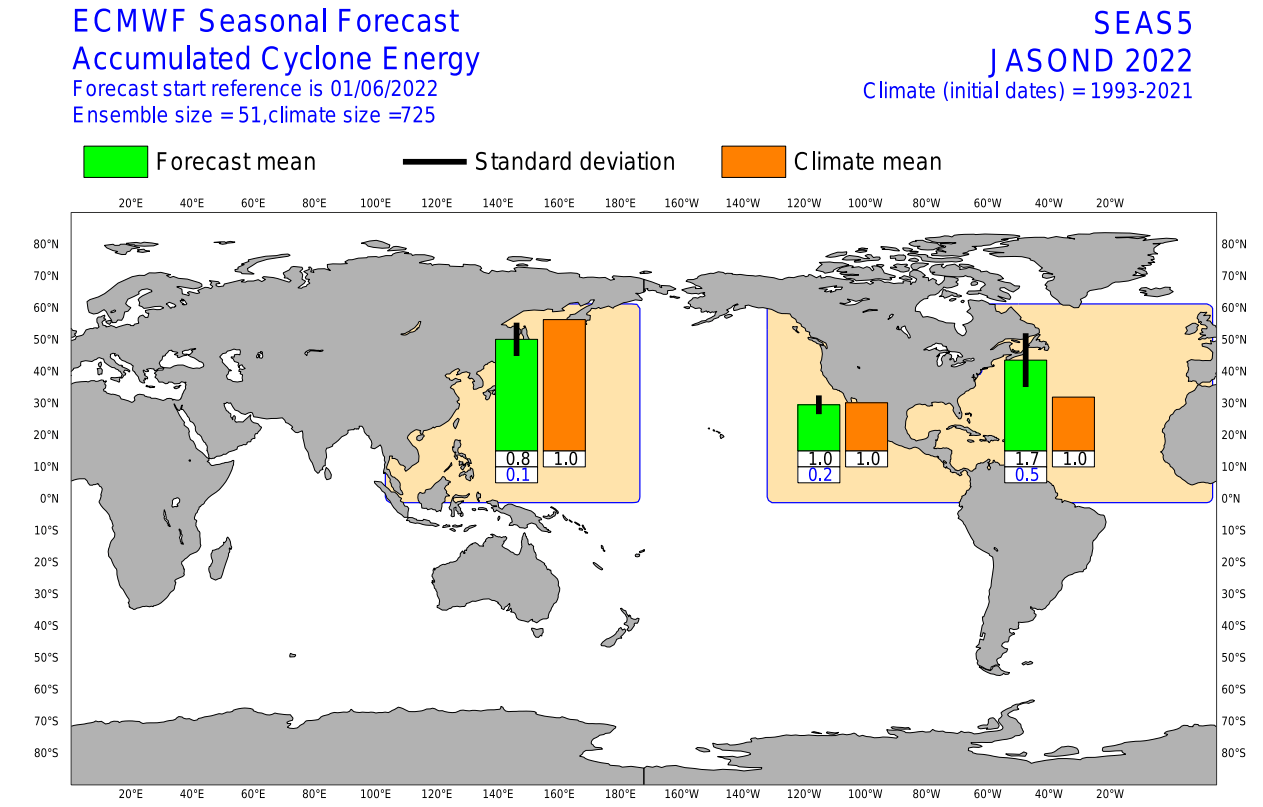
Image by ECMWF
Accumulated cyclone energy (ACE) is a metric that expresses the energy of a tropical cyclone during its lifetime. We can combine the total energy from all systems to compare different seasons and estimate their activity. But this does not mean much when it comes to landfalls.
A hurricane season with low total ACE can have 2-3 hurricane landfalls in the United States. On the other hand, a season with high ACE can have a higher number of storms that mainly stay out in the open waters.
A more direct forecast from ECMWF below shows enhanced activity in the Atlantic region. It also shows an increased frequency of tropical storm events along the east coast of the United States.
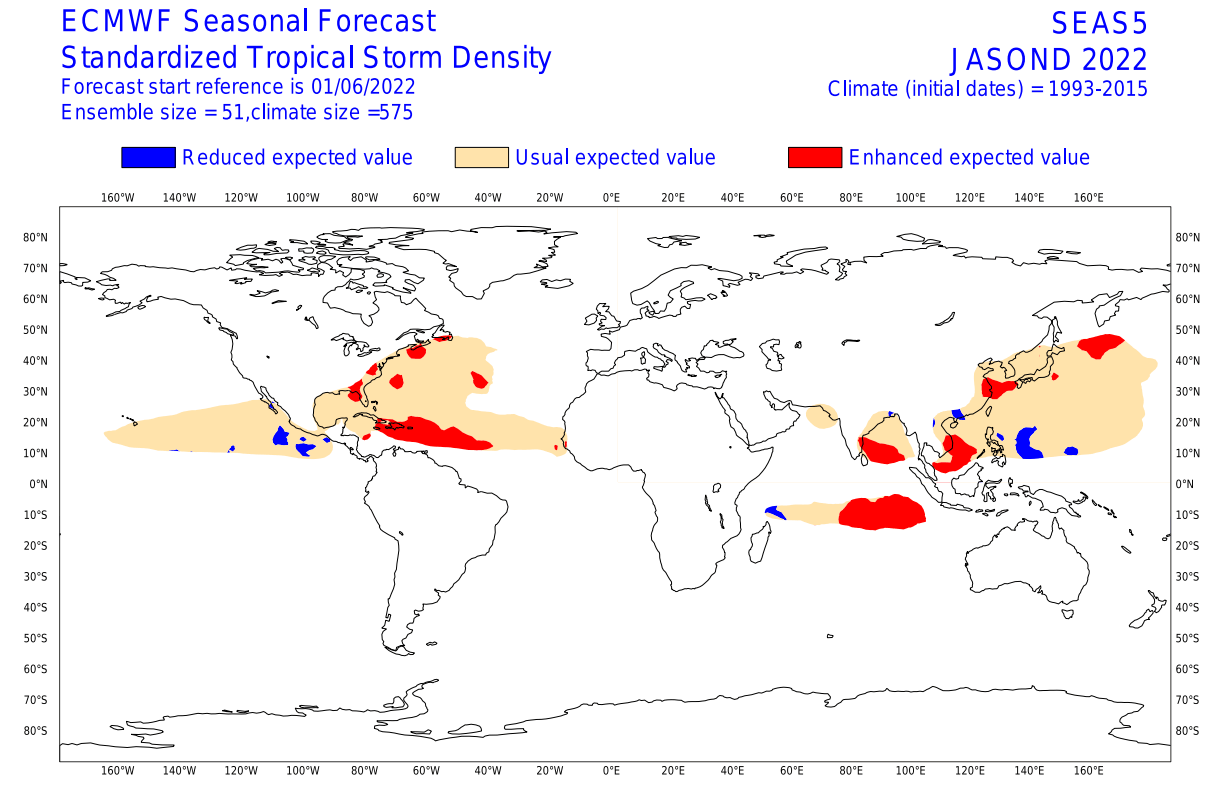
Image by ECMWF
Based on the state of the ocean and the atmosphere, we can see a potentially very active hurricane season. Historical data and seasonal model forecasts confirm this development, increasing the confidence for an active hurricane season.
It is impossible to say at this point how many landfalls we will see on the coast of the United States. But with a higher number of tropical systems, the chance of landfall increases.
We have published a dedicated Atlantic hurricane season forecast, which we will link at the bottom of the article.
ARCTIC OCEAN AND THE COLD SEASON
There is one more ocean that we haven’t mentioned yet. That is the Arctic Ocean. Despite being mainly frozen, it is still an ocean and an important piece of the climate puzzle.
The Arctic Ocean has known importance for the cold season. Research studies have shown a linkage between the abnormal Fall sea-ice melt and the changes in the polar jet stream. The prevailing idea is that the abnormal lack of sea-ice influences the winter polar vortex and thus the weather development.
A strong Polar Vortex usually means strong polar circulation. This usually locks the colder air into the Polar regions, resulting in milder seasonal conditions for most of the United States and Europe.
In contrast, a weak Polar Vortex can create a disrupted jet stream pattern. As a result, it has a harder time containing the cold air, which can now escape from the polar regions into the United States or Europe.
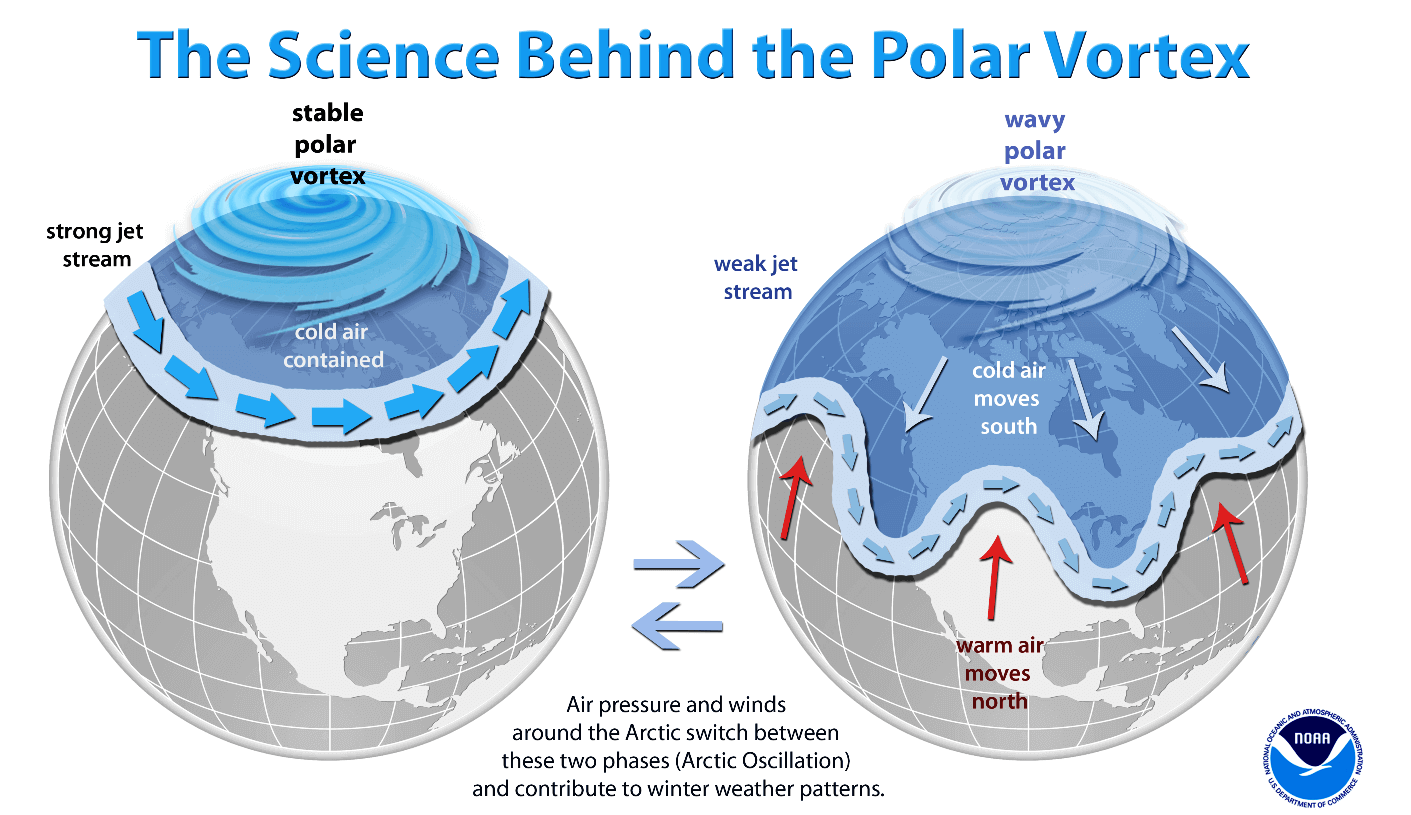
Image by NOAA Climate
Lack of sea ice in Fall has been linked to a weak polar vortex event, creating a weaker jet stream. That can cause more cold air outbreaks in the United States and Europe.
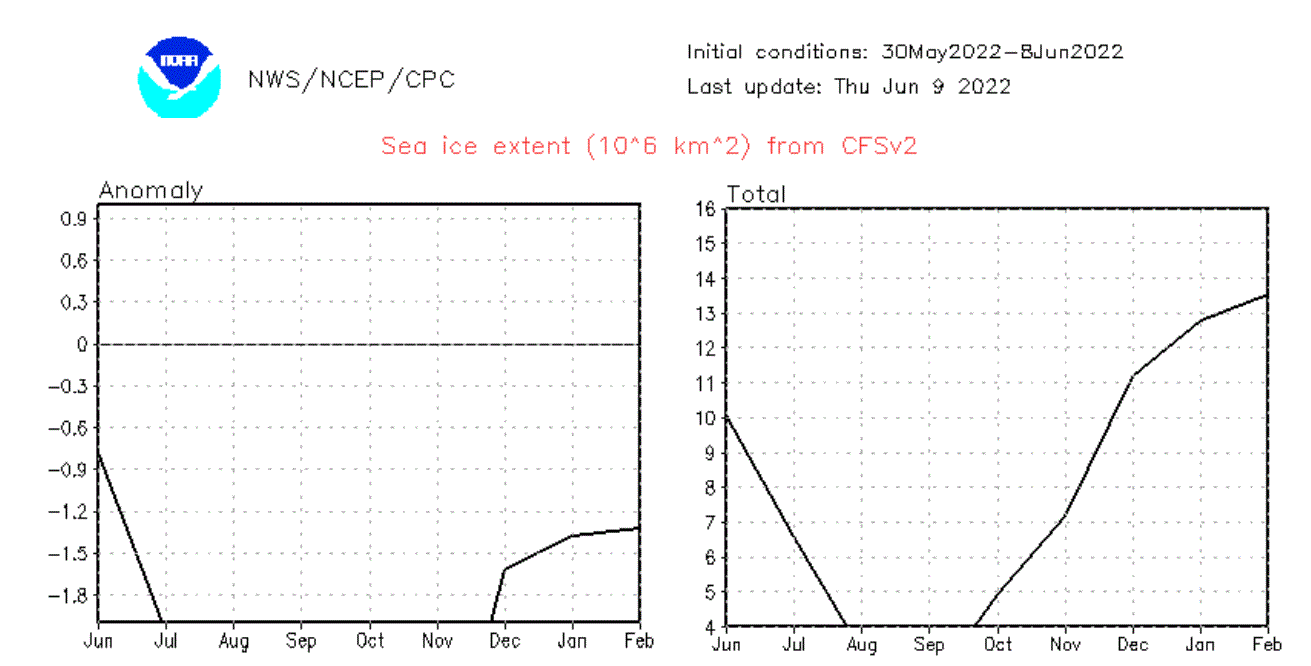
And below is the actual forecast of the Arctic sea ice concentration in September. September is when the sea ice area is at its lowest point. This forecast shows a very small sea ice area, which could be near the record low. So far, the lowest value was reached in September 2012, at just 3.4 million km².

Looking at the Arctic sea ice forecast graph, we can see the peak of the melt season at below 4 million km², nearing 2 million km². This would be an ultimate record, but this model is known to overdo the sea ice melt simulation.
We will keep you updated on the global weather development, so make sure to bookmark our page. Also, if you have seen this article in the Google App (Discover) feed, click the like (♥) button to see more of our forecasts and our latest articles on weather and nature in general.
SEE ALSO: