Strong cold anomalies are still being detected in the stratosphere over Southern Hemisphere. The anomalous cooling is caused by the large stratospheric water vapor cloud created by the January Hunga Tonga eruption. Cooling on this scale has not been seen in modern satellite records, with record cold temperatures detected in the southern stratosphere.
We will look at the latest temperature data in the stratosphere, how this cooling event unfolded, and how (if at all) it might impact the Weather on our side of the planet in the upcoming Winter 2022/2023.
But first, where is this “Stratosphere”, and why is it so important for weather development during the Winter season?
FROM THE CLOUDS TO THE STRATOSPHERE
All of the clouds (and our weather) are found in the lowest layer of the atmosphere, called the troposphere. It reaches up to around 8 km (5 miles) altitude over the polar regions and up to around 14-16 km (9-10 miles) over the tropics.
Above it, there is a much deeper layer called the stratosphere. This layer is around 30 km thick and is very dry. You can see the layers of the atmosphere in the image below, with the troposphere on the bottom and the stratosphere with the ozone layer above it.
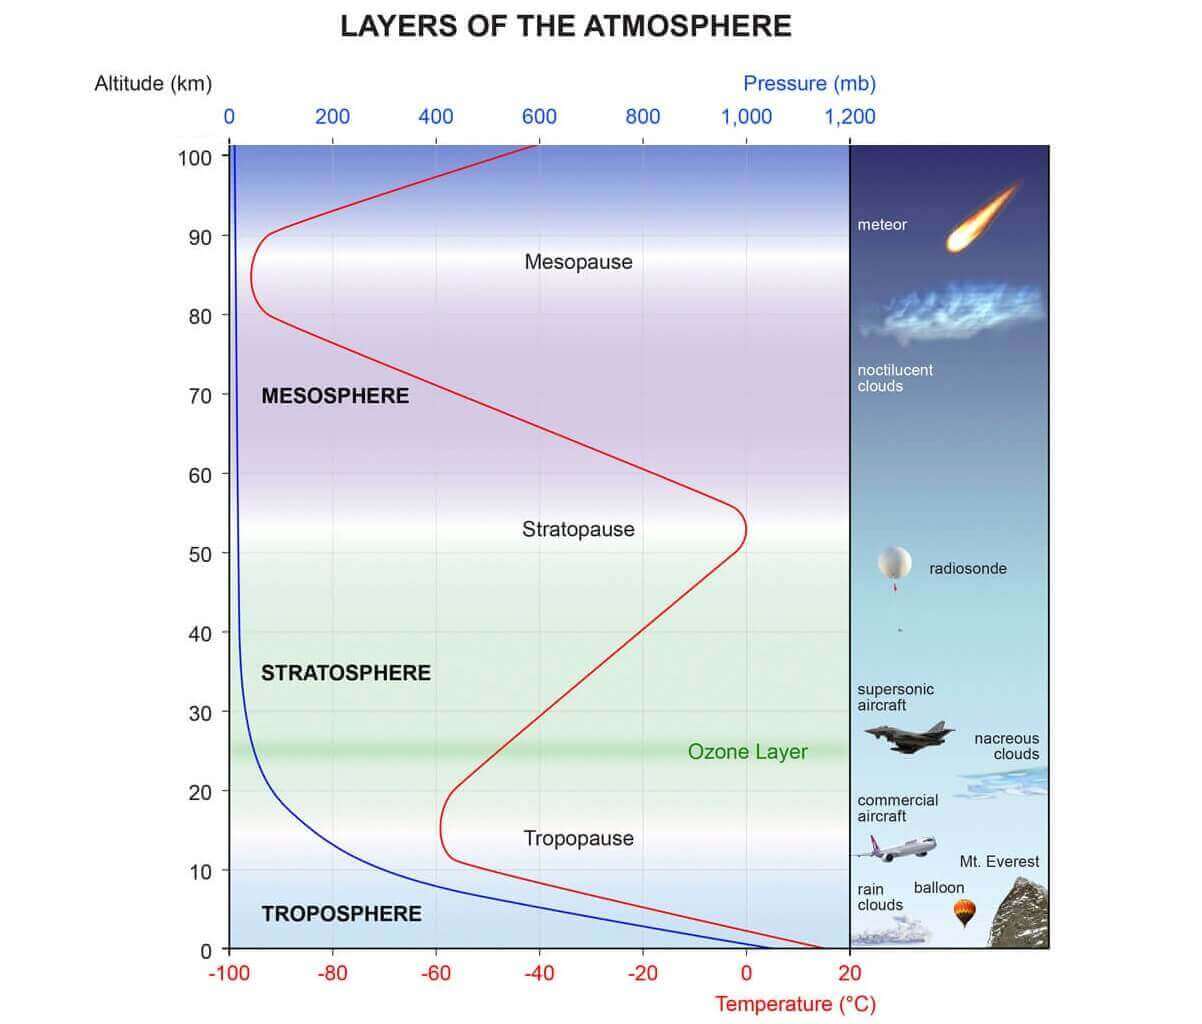
These layers are important because while our weather is in the lowest part of the atmosphere, it can be heavily modified by the impacts from above. Especially the stratosphere is known for its effects and changes regarding the Polar Vortex and the jet stream.
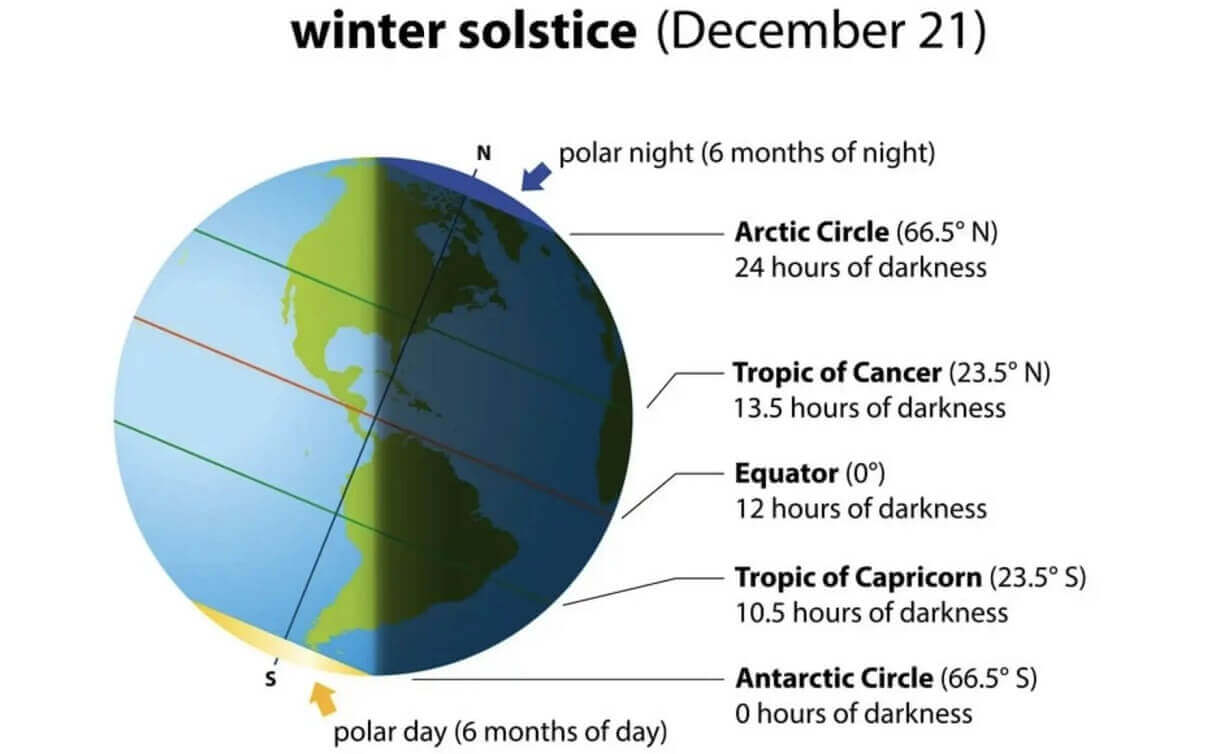
Every year as we head into autumn, the north pole starts to cool down. The atmosphere further south is relatively warm as it receives energy from the Sun, but the north polar regions receive much less over time. You can see the winter solstice below, as the polar regions receive little to zero solar energy.
The temperature contrast to the south increases as the temperature drops over the polar regions. In the stratosphere, the process is the same. As the temperature drops over the pole and the temperature difference towards the south increases, a large low-pressure (cyclonic) circulation start to develop across the polar stratosphere.
The image below shows a typical example of the Polar Vortex at around 30km/18.5miles altitude (10mb level) in the middle stratosphere during winter.
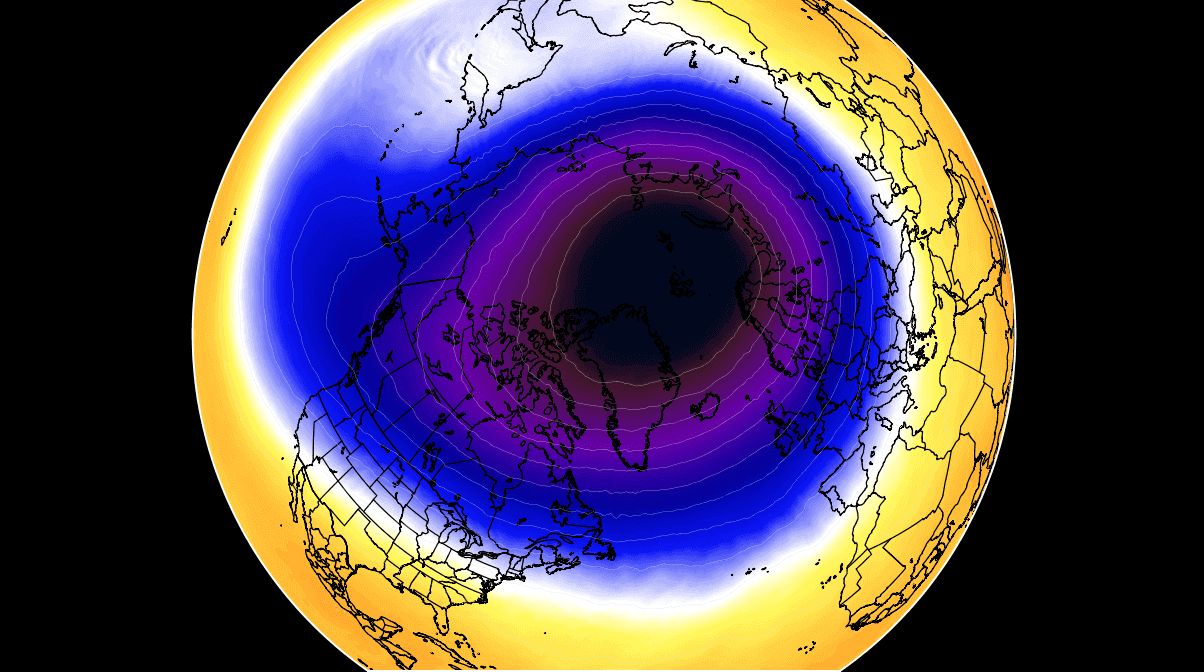
It is basically like a very large cyclone, covering the whole north pole, down to the mid-latitudes. So it is strongly present at all levels, from the ground up, but in different shapes.
We are typically focusing more on the Stratospheric Polar Vortex during the winter, as it plays a very important role in weather development throughout the season. It is known for its strong influence down from the stratosphere, changing or amplifying the winter weather.
But while we are more concerned with the stratosphere and the Polar Vortex of the Northern Hemisphere, a major cooling event is unfolding over the Southern Hemisphere on a grand scale.
WATER IN THE ATMOSPHERE
Strong volcanic eruptions can send different gasses and materials directly into the stratosphere. Depending on the type of particles and their amount, that can result in different regional and global atmospheric effects.
The submarine Hunga Tonga volcano in the South Pacific erupted violently on 15 January 2022. Tonga produced a massive volcanic plume that briefly reached 58 km (36 miles), touching the mesosphere. In the image below, you can see the large explosive column reaching into the mesosphere.
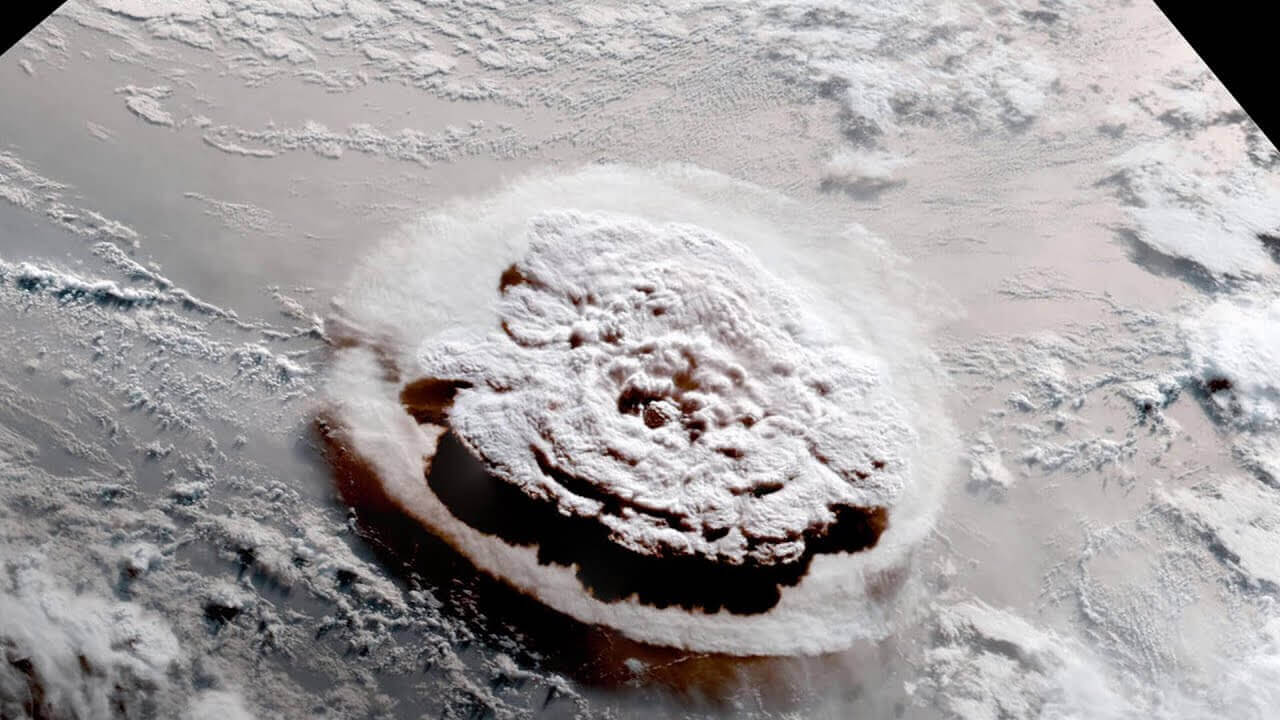
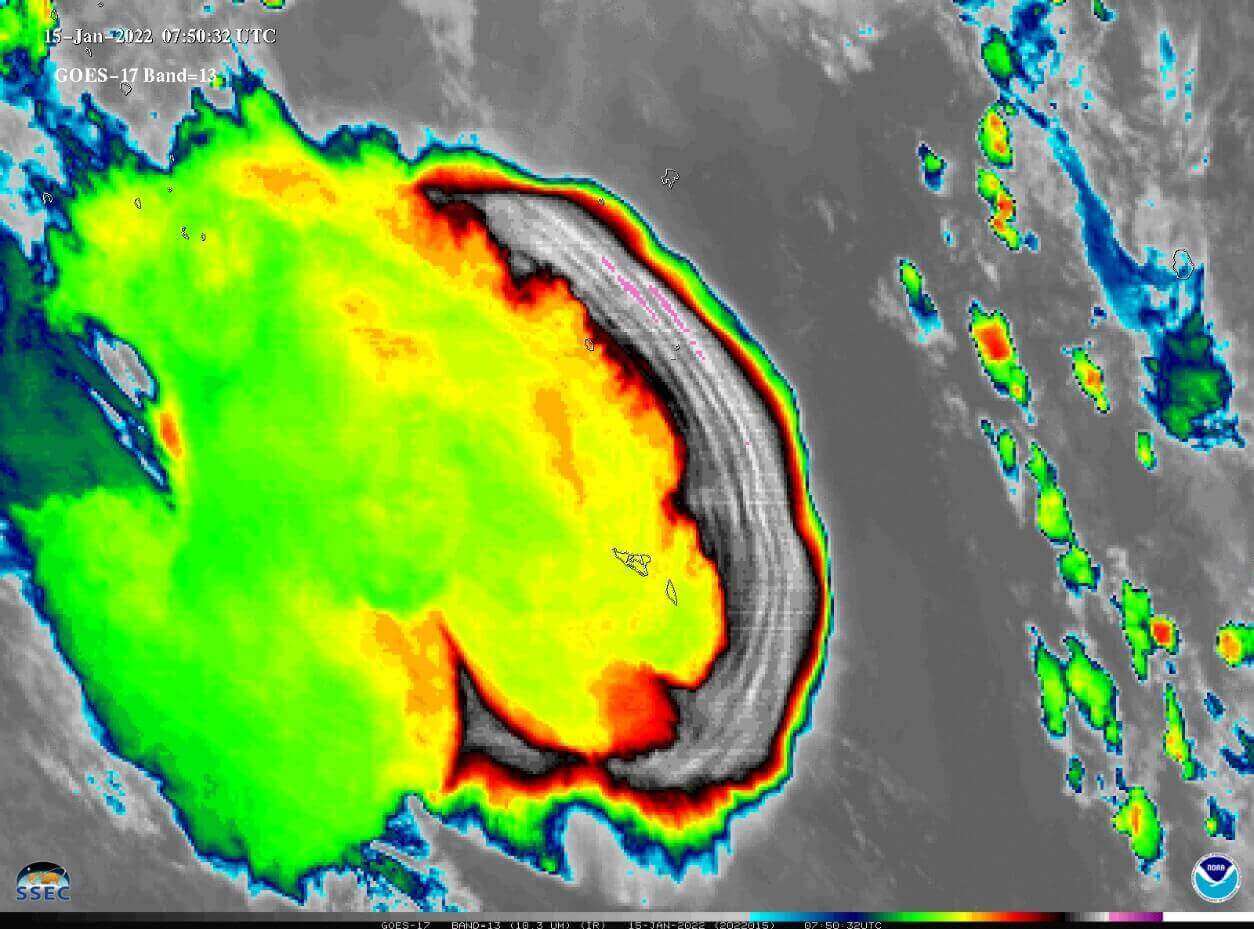
Below we also have the infrared satellite imagery of the eruption. We can see the warmer (green-yellow) cloud in the stratosphere and the colder (black-white) cloud lower down in the troposphere.
The eruption injected volcanic gases (sulfur) into the stratosphere and a large amount of water in the form of water vapor. The water volume in the plume was very high because the volcano is “submarine” (below the water level), erupting out of the ocean.
The video below shows the massive eruption sending water and volcanic particles into the stratosphere. This eruption was strong enough to send shockwaves around the entire planet several times over, detected by monitoring stations worldwide.
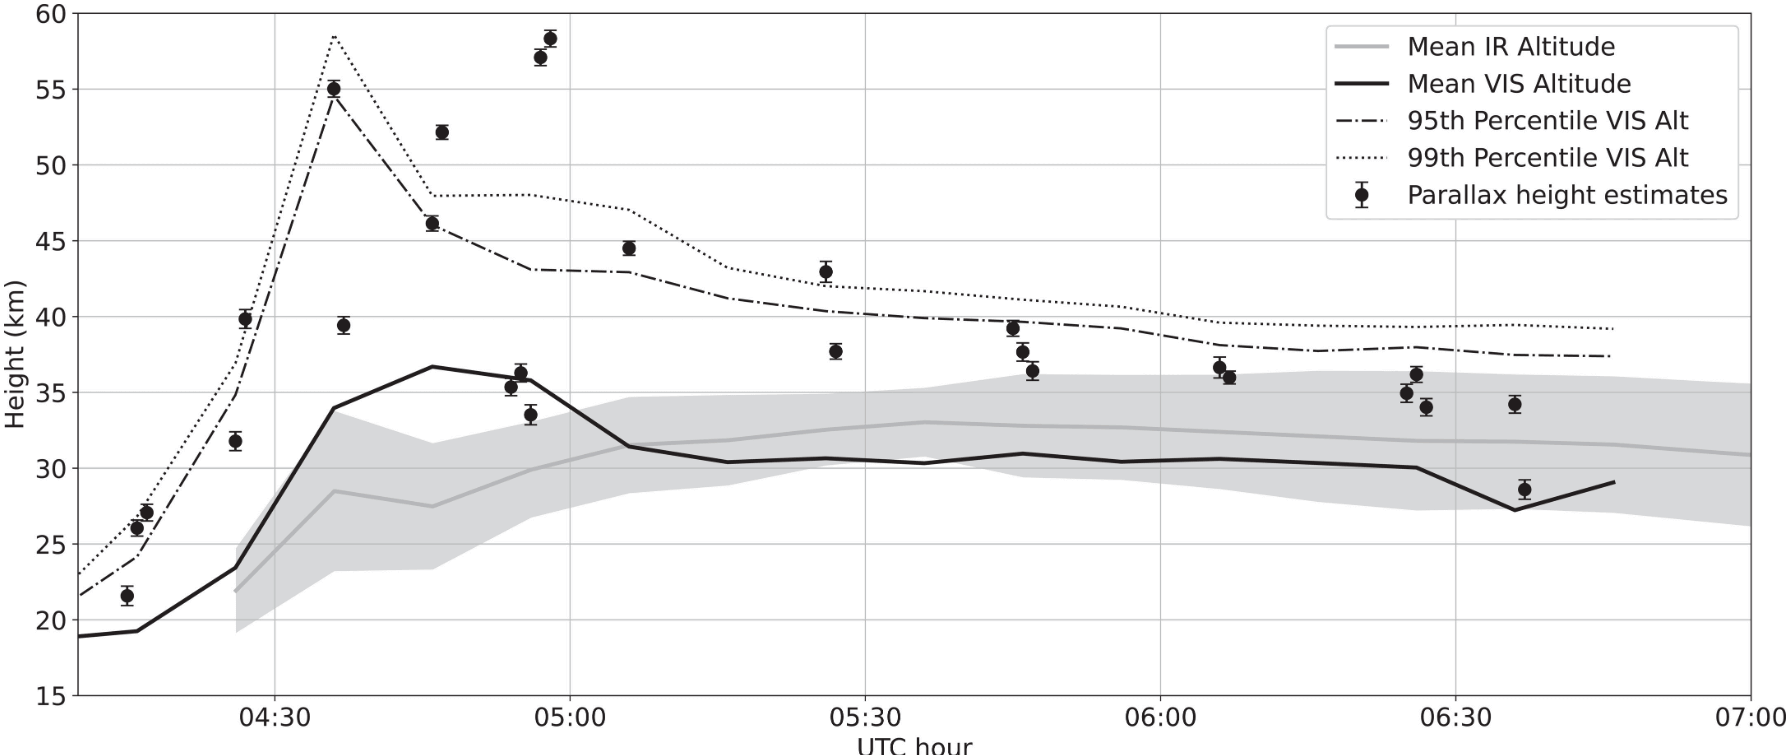
The maximum altitude of the eruption column was later analyzed to be around 57.5 kilometers (36 miles). In the image below, you can see the various layers of the atmosphere and the peak of the eruption column.
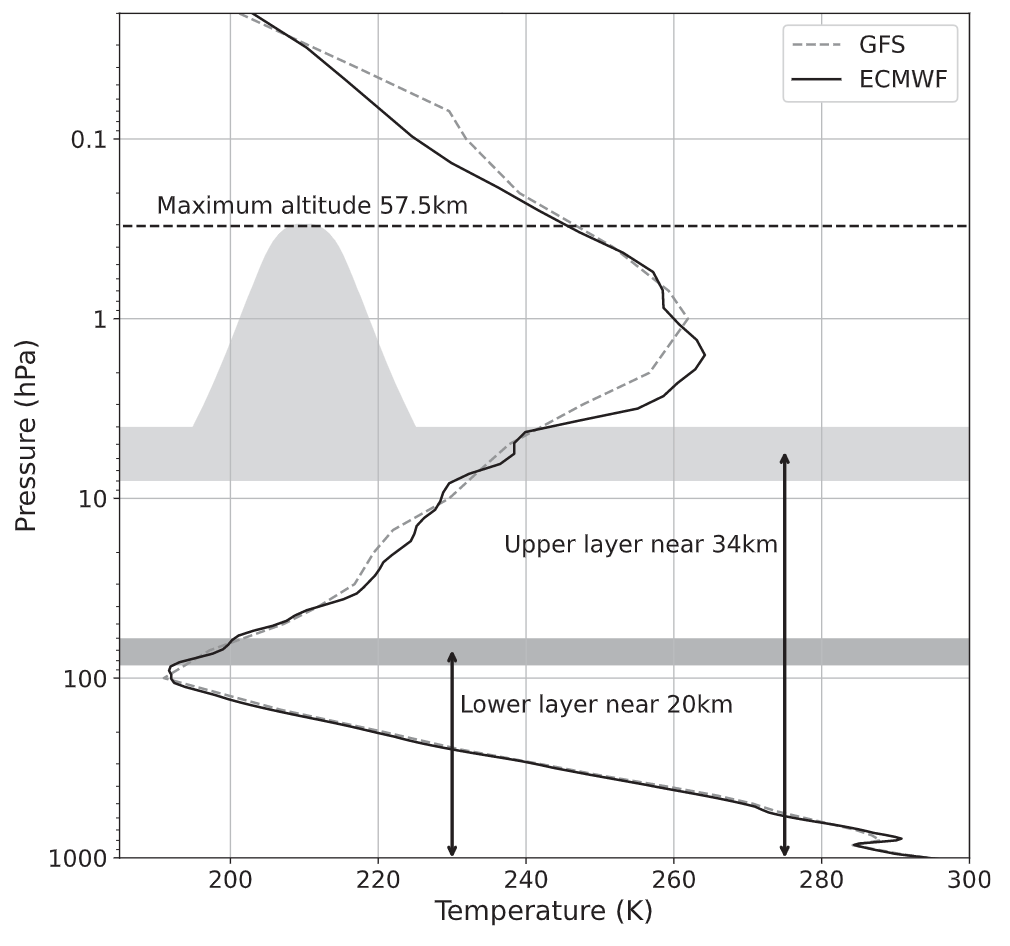
Combining multiple analysis systems, you can see that the eruption column reached a high altitude. But it also remained there for quite a while. After reaching the peak in the Mesosphere, the large volcanic cloud remained in the mid to upper stratosphere, circling the entire hemisphere.
Within this cloud, there were many different particles. The central particle to this story is Water Vapor (H2O).
WATER VAPOR CLOUD
Like sulfur, water vapor has a cooling effect, but not at the surface. Instead, it actually cools the stratosphere. It reflects the incoming solar radiation but also prevents the heat from escaping, thus actually warming the surface.
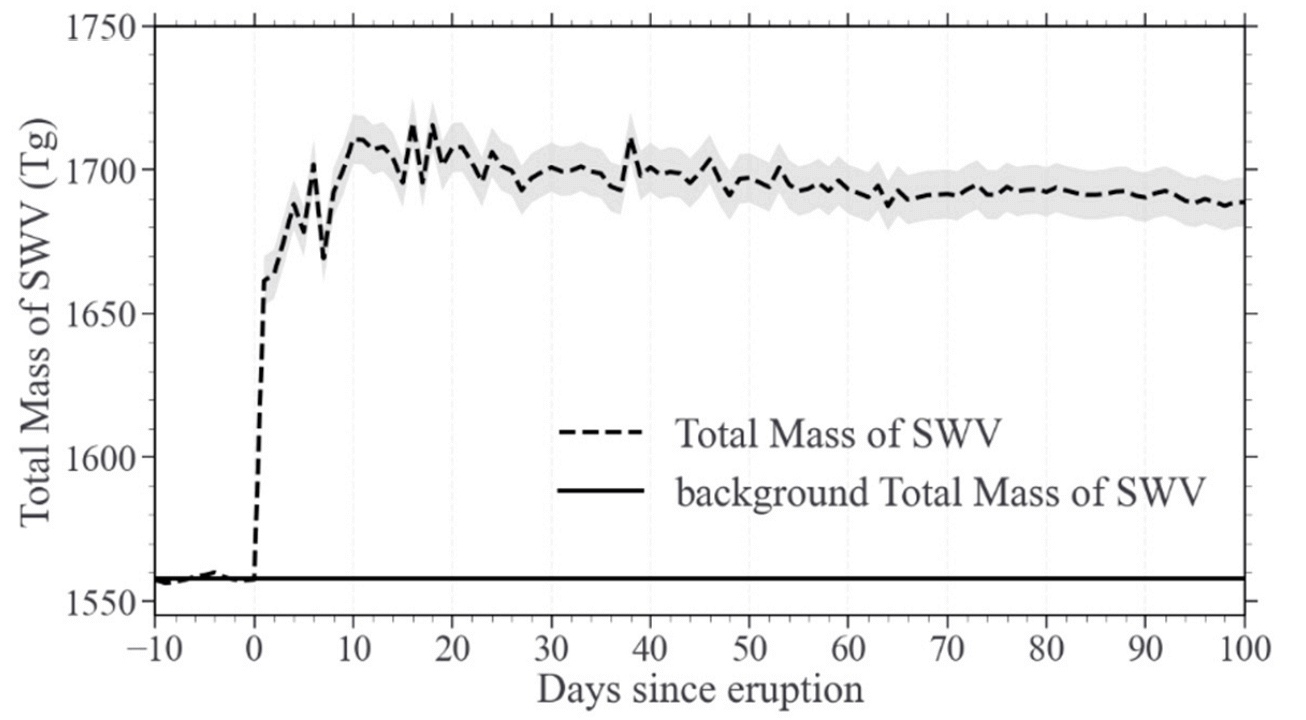
Following the eruption of Hunga Tonga, the total amount of water increased from a normal 1500 to over 1700 Teragrams, which is a 10% increase in total stratospheric water vapor content. This is a large amount, coming from just one event.
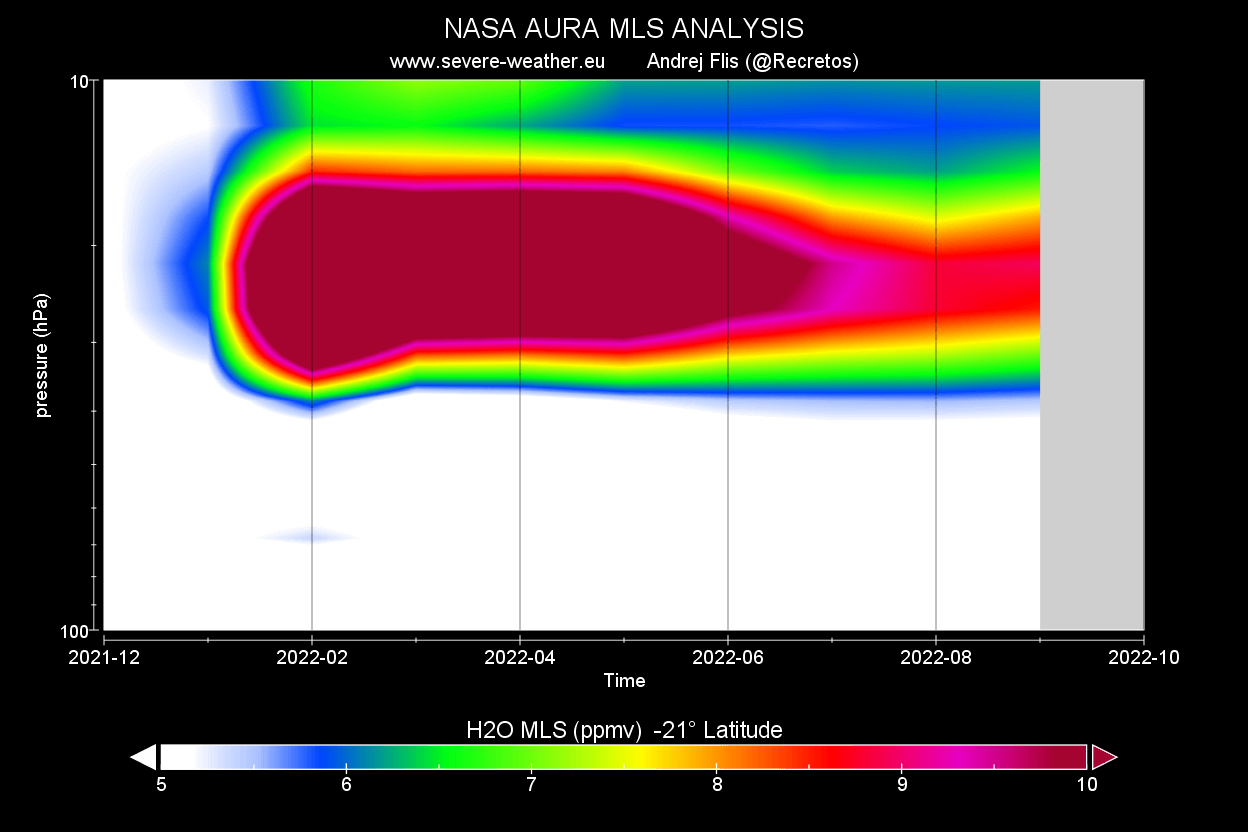
Looking at the vertical analysis, we can see the injected water vapor in the image below. The water vapor was injected into the mid and upper stratosphere, but the main concentration is between 20-30km (12-18 miles). The cloud still circles the globe to this day.
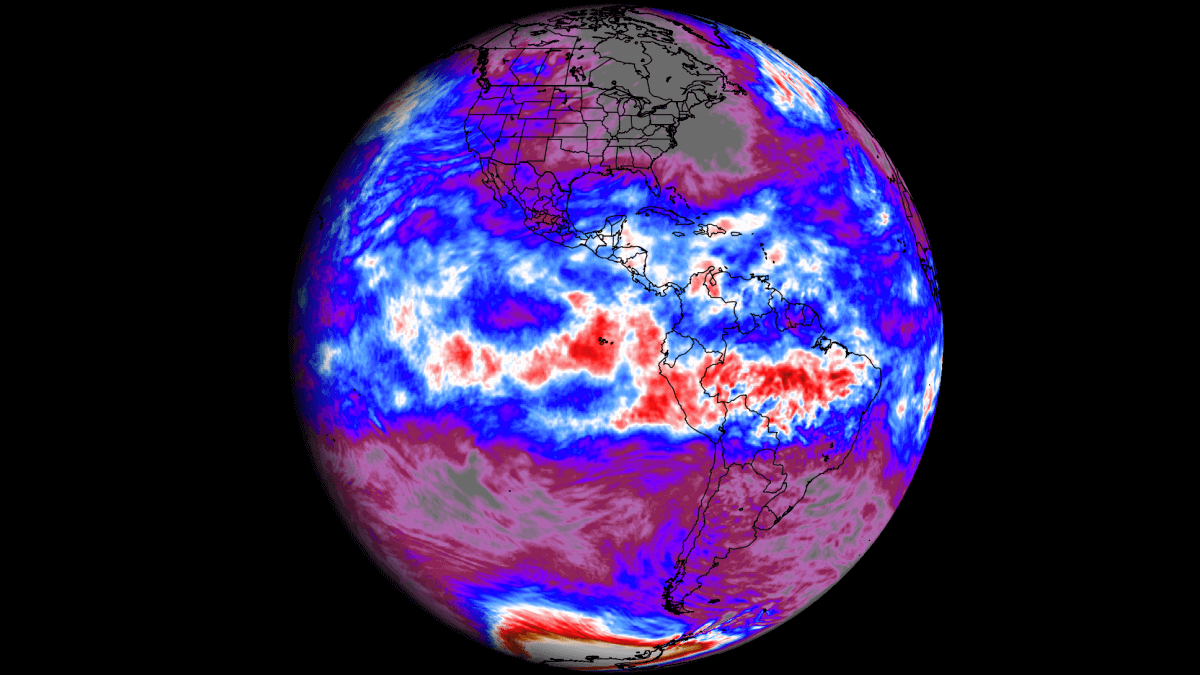
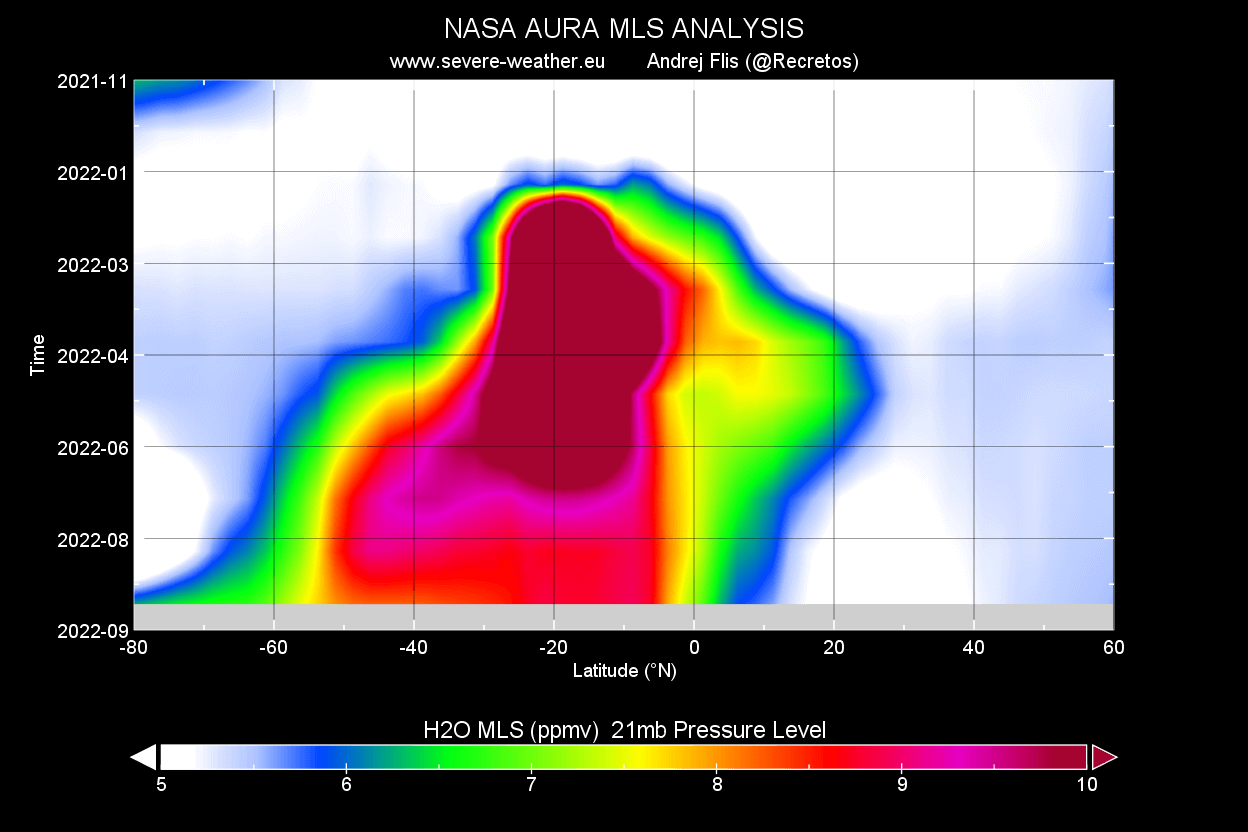
The next image below shows the water vapor at the 21mb pressure level (26km/16miles). You can see how it spread across the southern hemisphere, also reaching into the northern hemisphere.
Below we have the NASA analysis of the water vapor anomaly at around 26mb pressure level (24km/15mi). Again, you can see a significant increase following the eruption, spreading across the south and north hemisphere, still ongoing.
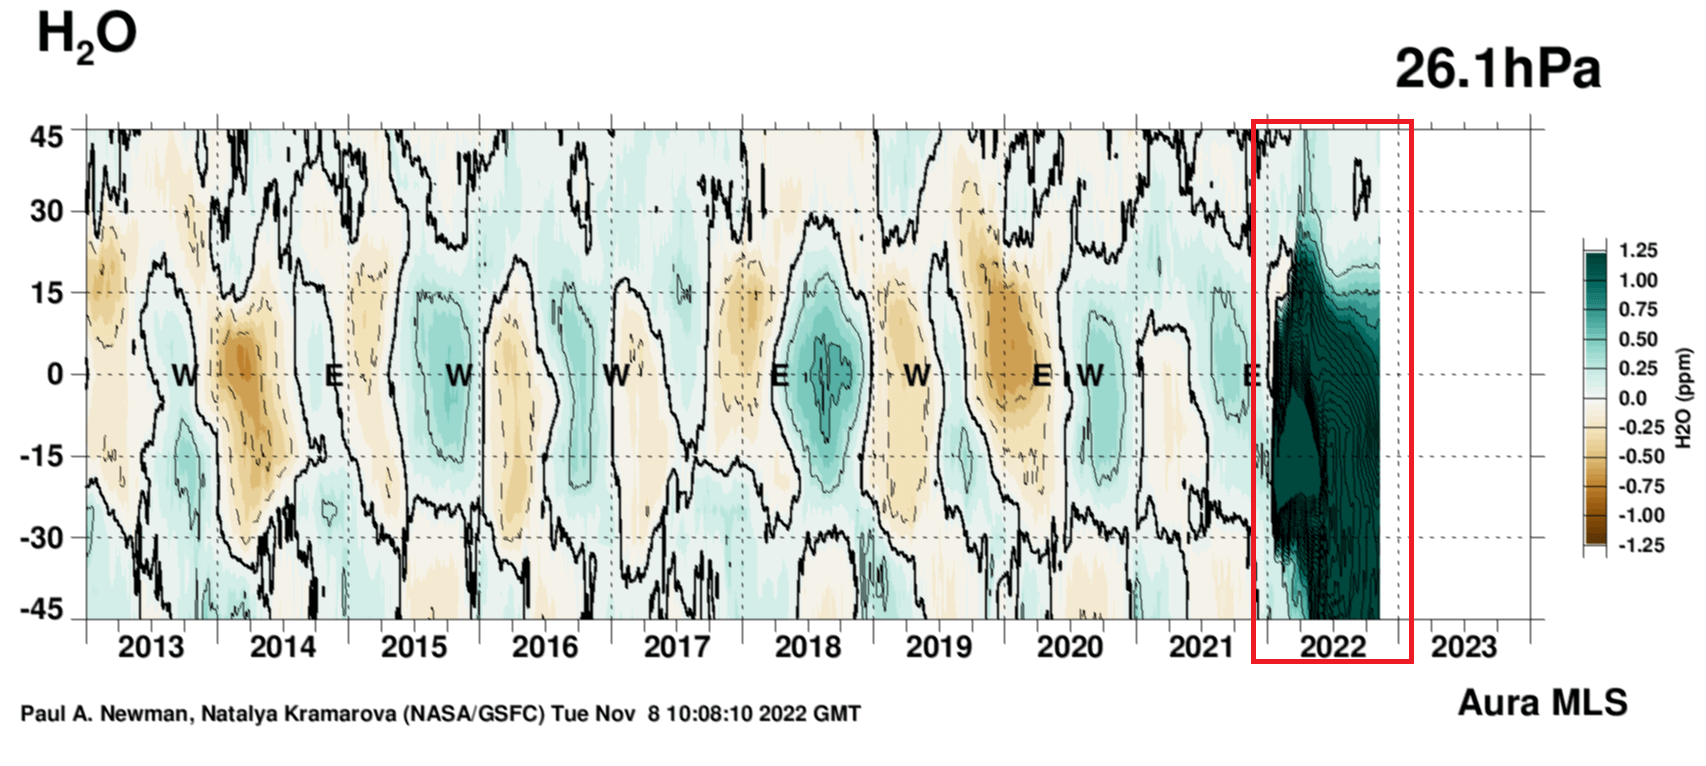
The large extent of this water vapor injection can be seen below in the combined NASA analysis. It combines several different water vapor observations over the years in the stratosphere. You can see the large spike from 2022 across the southern mid-latitudes, larger than anything seen in the past 40 years.
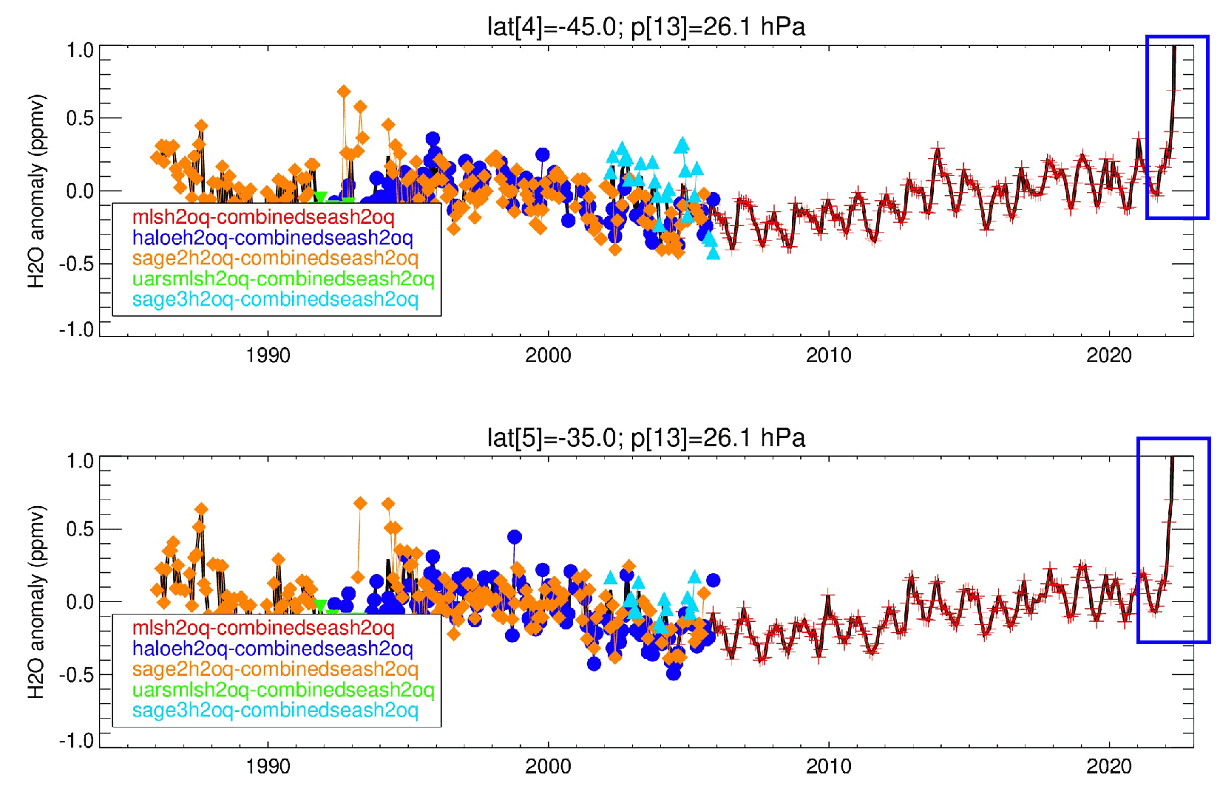
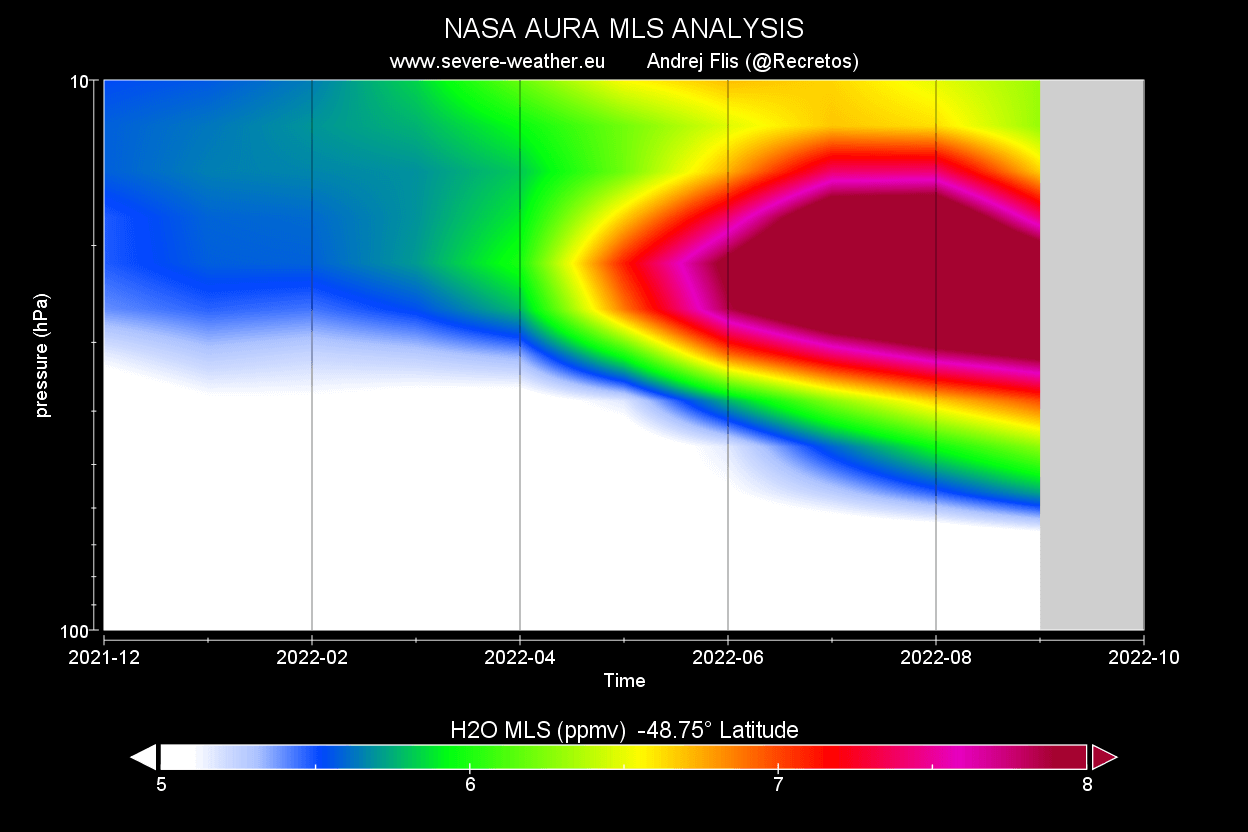
Going further to the south, however, you can see that the water vapor cloud peaked later. From July into September, the stratospheric water vapor cloud reached further toward the south pole.
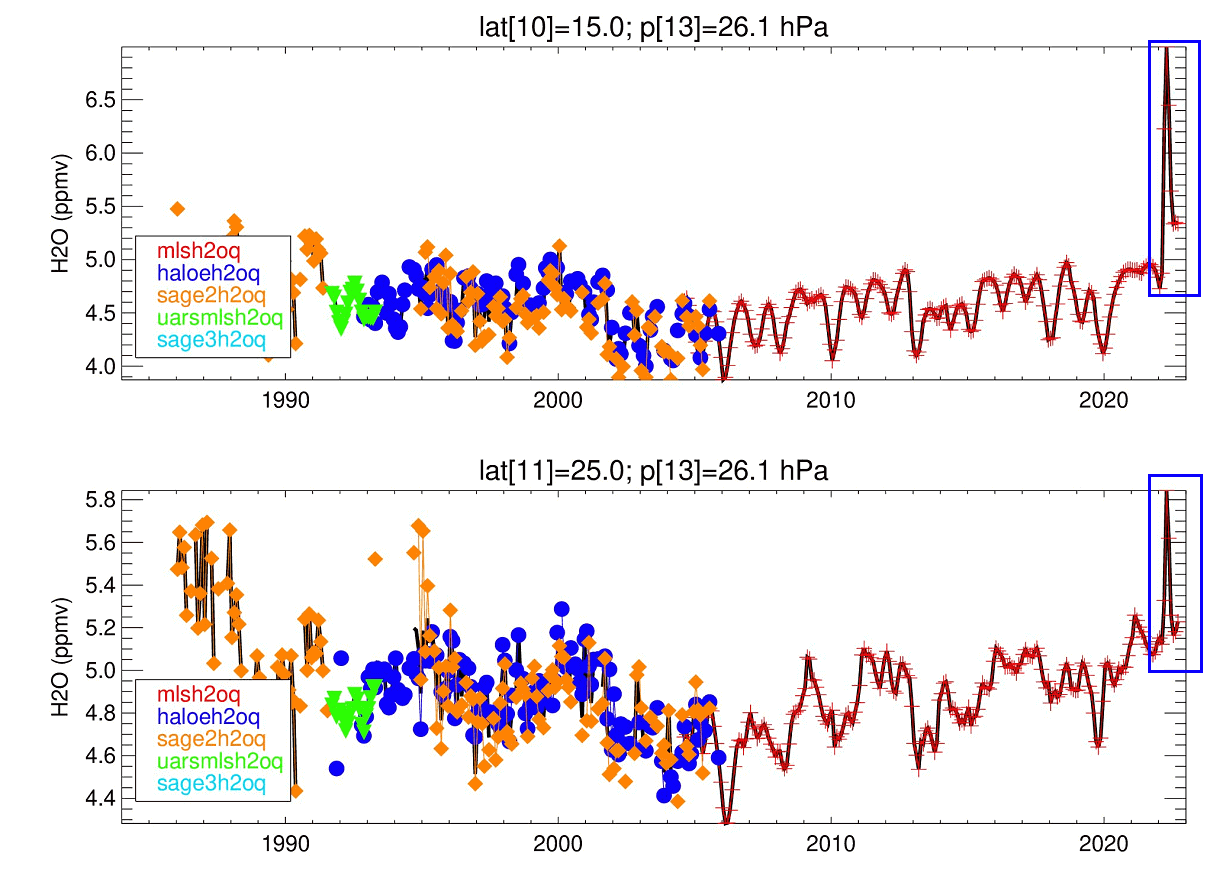
But what about the northern hemisphere? NASA analysis shows the stratospheric water vapor below at the 15 and 25 degrees north latitude. The data has large spikes, as the water vapor cloud breached the equator and entered the northern Hemisphere in 2022, reaching as far north as over Florida and the southern United States.
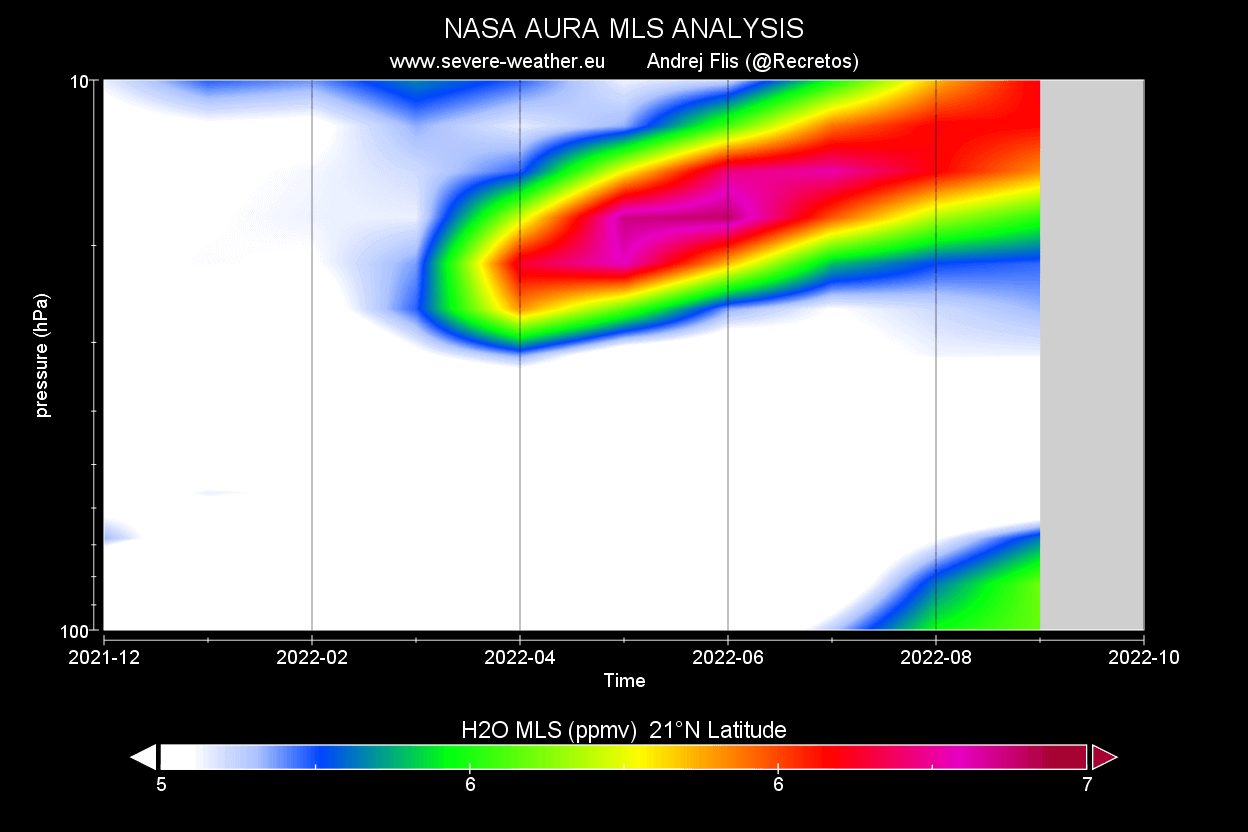
Looking around 21°N latitude, you can see the water vapor cloud below, starting to appear in March, and still remains in the northern hemisphere but rising in altitude.
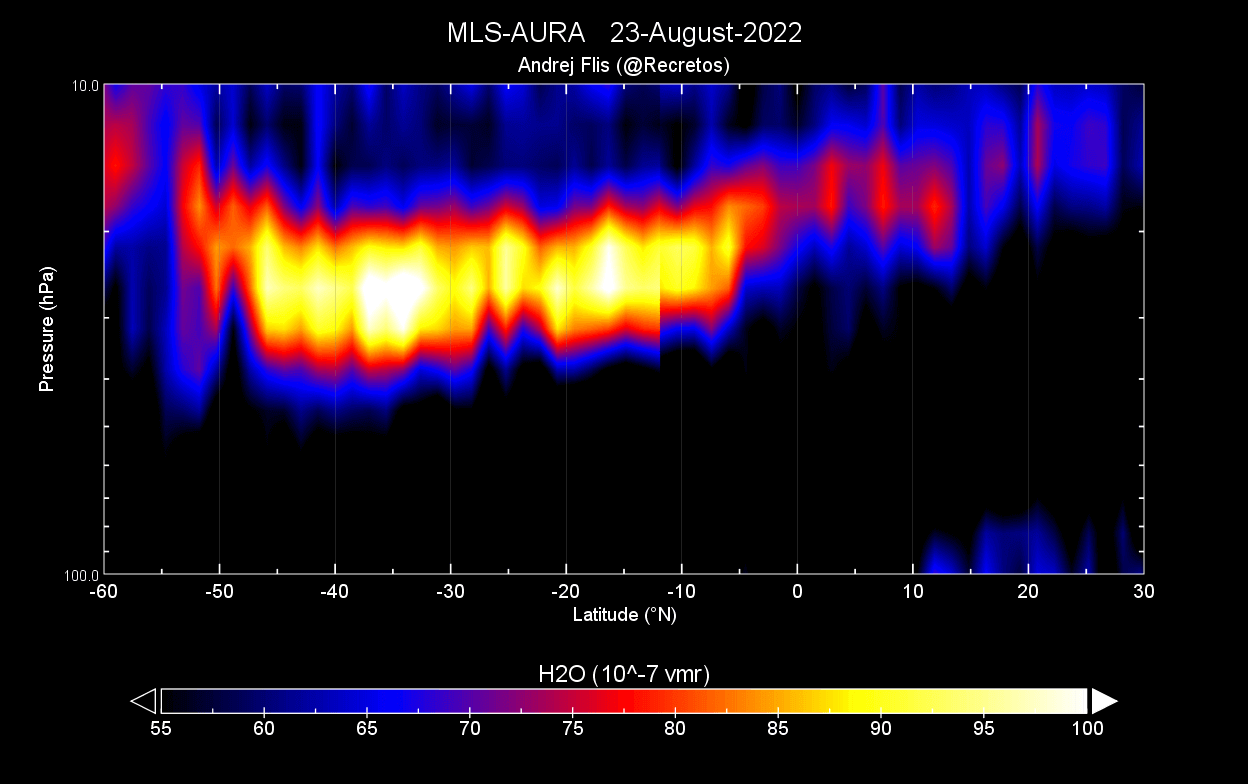
We also produced a zonal-mean plot from MLS-AURA data provided by NASA. It shows the water vapor content in the lower to mid-stratosphere in late August. You can see the water vapor cloud reaching deep into the southern hemisphere and also reaching into the northern hemisphere.
So the main takeaway is that a large water vapor “cloud” circles the globe in the stratosphere. As you will find out, it has a strong cooling effect and is likely to impact the global weather in some way over the coming months and years.
STRATOSPHERIC COOLING EFFECT
As mentioned, water vapor is very potent at cooling the stratosphere. It deflects the incoming solar radiation, lowering the temperatures in that layer. We will track these changes using the reanalysis data from the NOAA Physical Sciences Laboratory.
Starting in May, there was cooling already observed in the southern hemisphere. The strongest belt of cold anomalies was around the 30° south latitude.
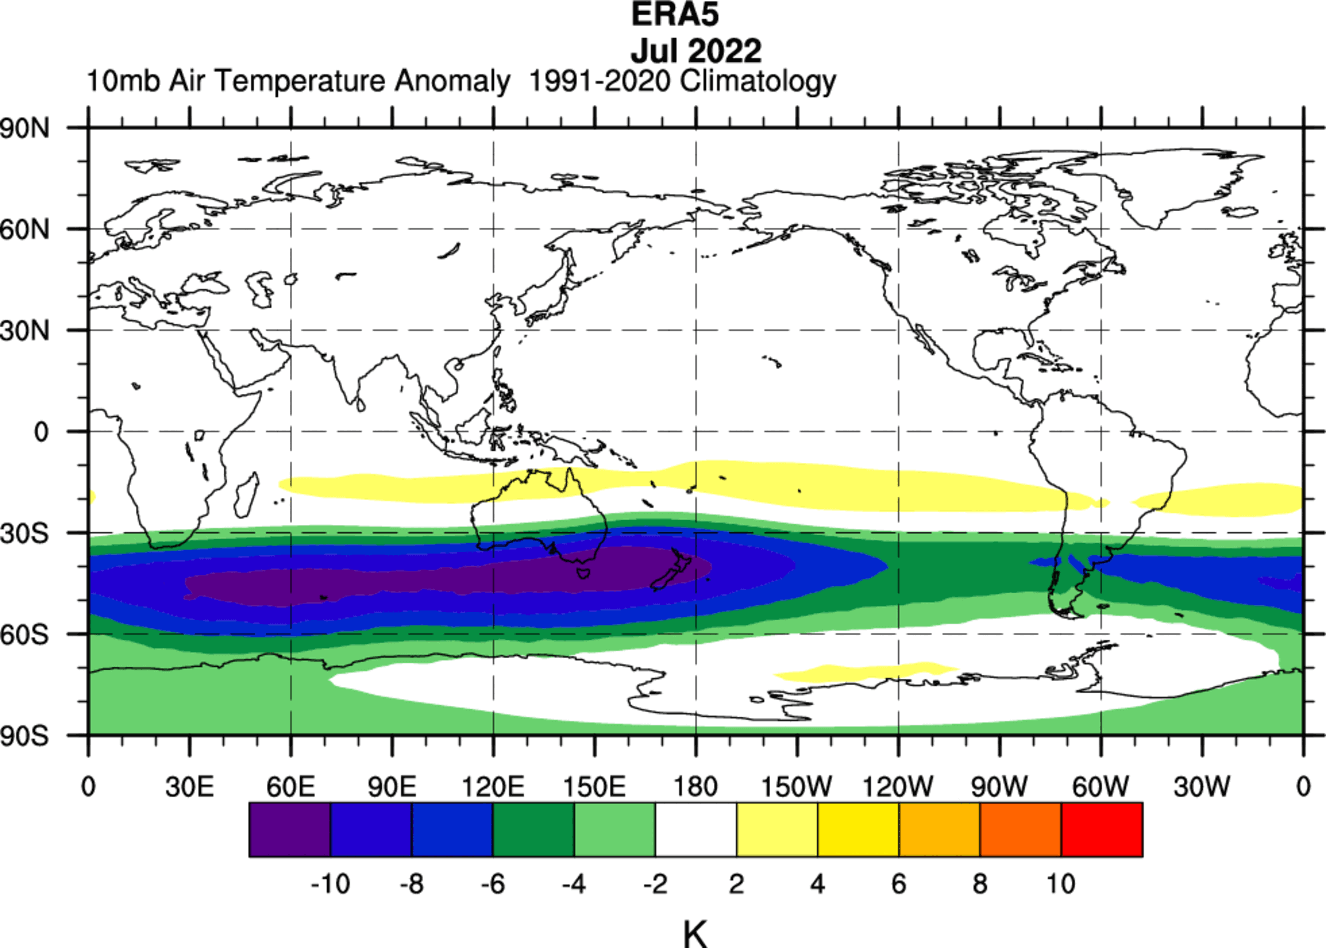
By July, the cooling effect was stronger. Below we can see the cold anomalies moved further towards the south pole, now maximizing in the mid-latitudes. The anomalies in July were substantial, reaching more than 10 degrees below normal.
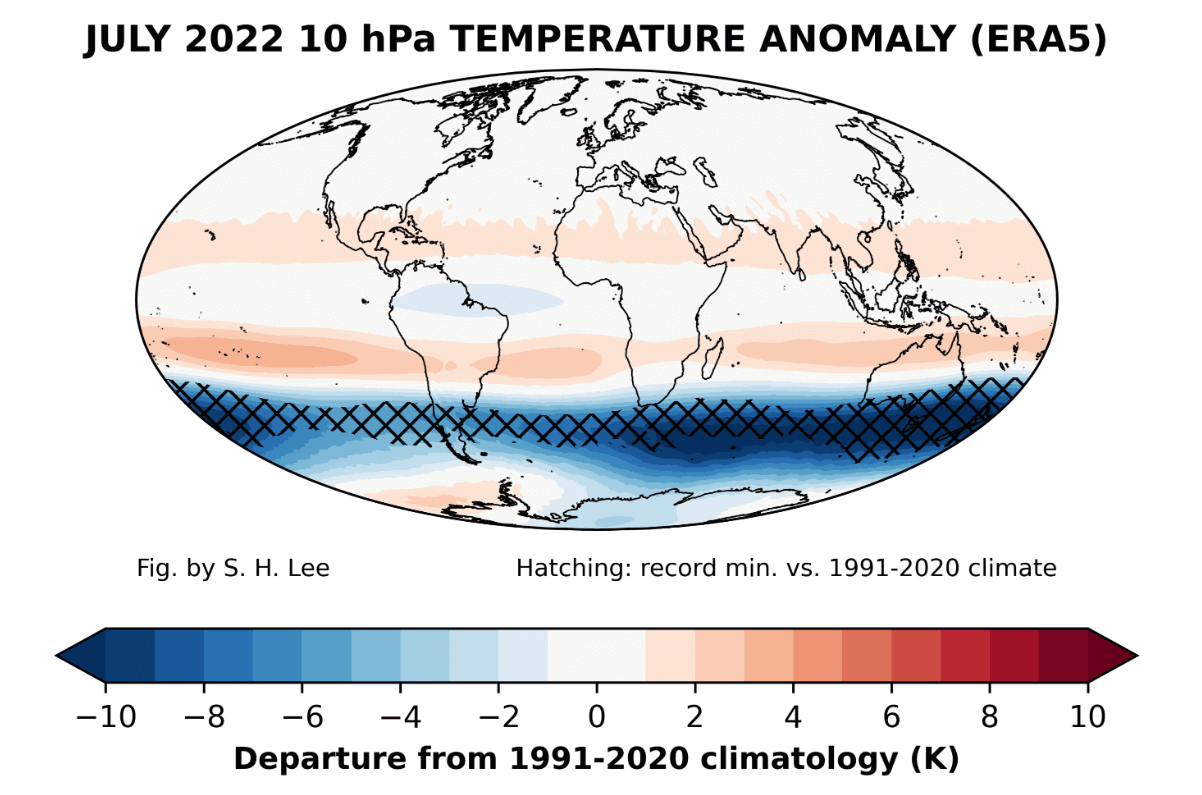
The image below was made by Simon H. Lee from ECMWF data and also shows the July 2022 mid-stratosphere temperature anomaly. The cross markings in the southern hemisphere mark the record minimal temperatures, which span in a belt around the whole southern hemisphere.
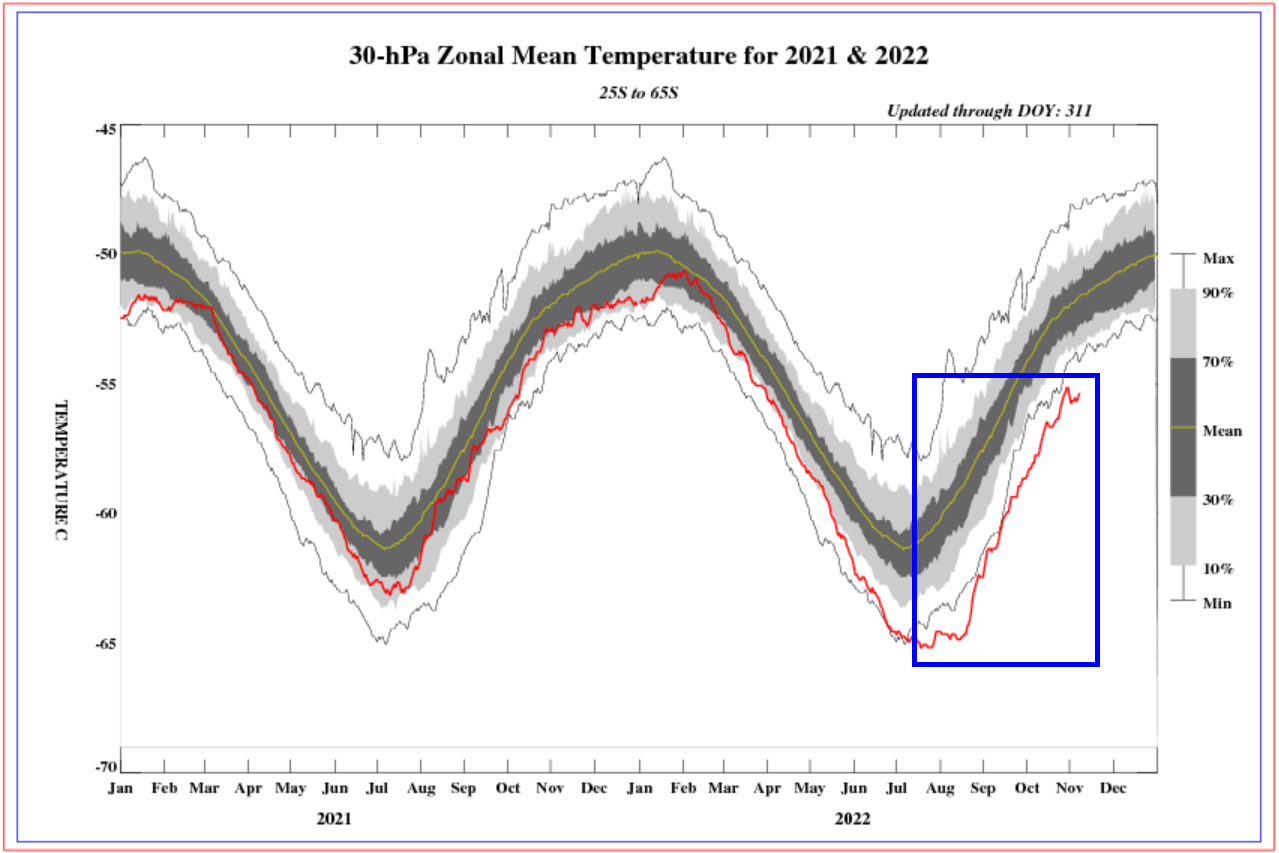
The NOAA mid-stratosphere temperature graph actually shows this unusual cooling. It is marked on the image below, reaching below the previous minimal temperatures in the past 40-year records. The cooling is expected for as long as the water vapor cloud remains in the stratosphere.
Looking at the October average temperature anomaly in the stratosphere, we can see colder temperatures over much of the southern hemisphere. The main cooling effect of the water vapor cloud is between the 30S and 60S latitudes.
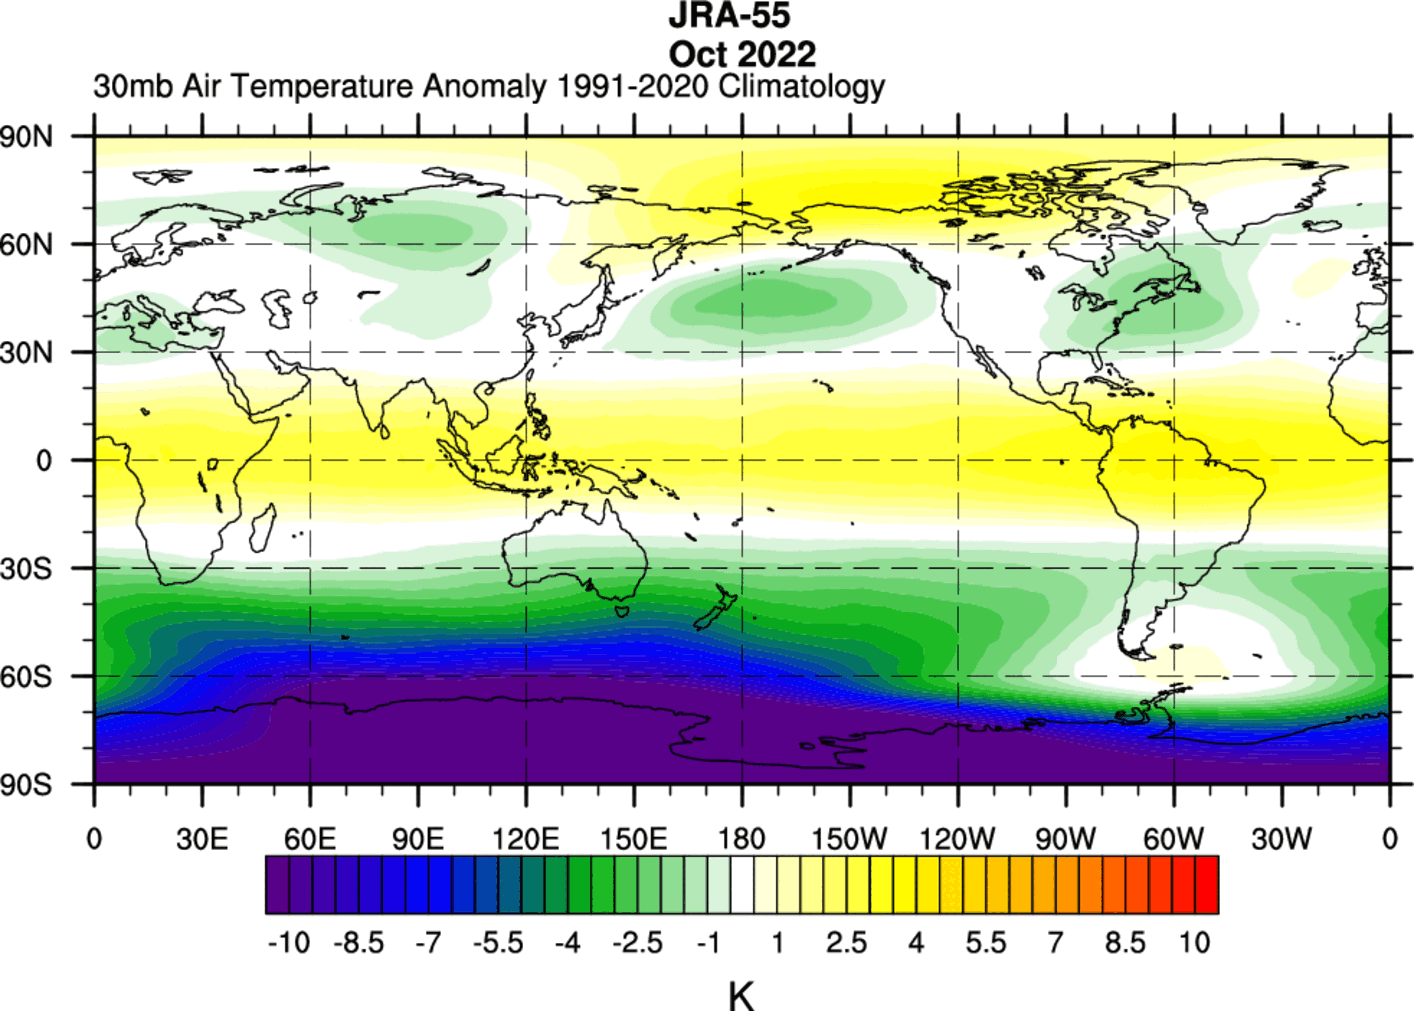
The end of October showed continued cold anomalies across the southern mid-latitudes. As the sunlight returns to the southern hemisphere, the anomalies are expected to continue as water vapor deflects some of the incoming radiation.
Not only temperatures, but the pressure is also lower. You can see a belt of low-pressure anomalies in the same region as the cooling anomalies. This is an overall significant change/anomaly for the southern stratosphere and shows a currently stronger Polar Vortex.

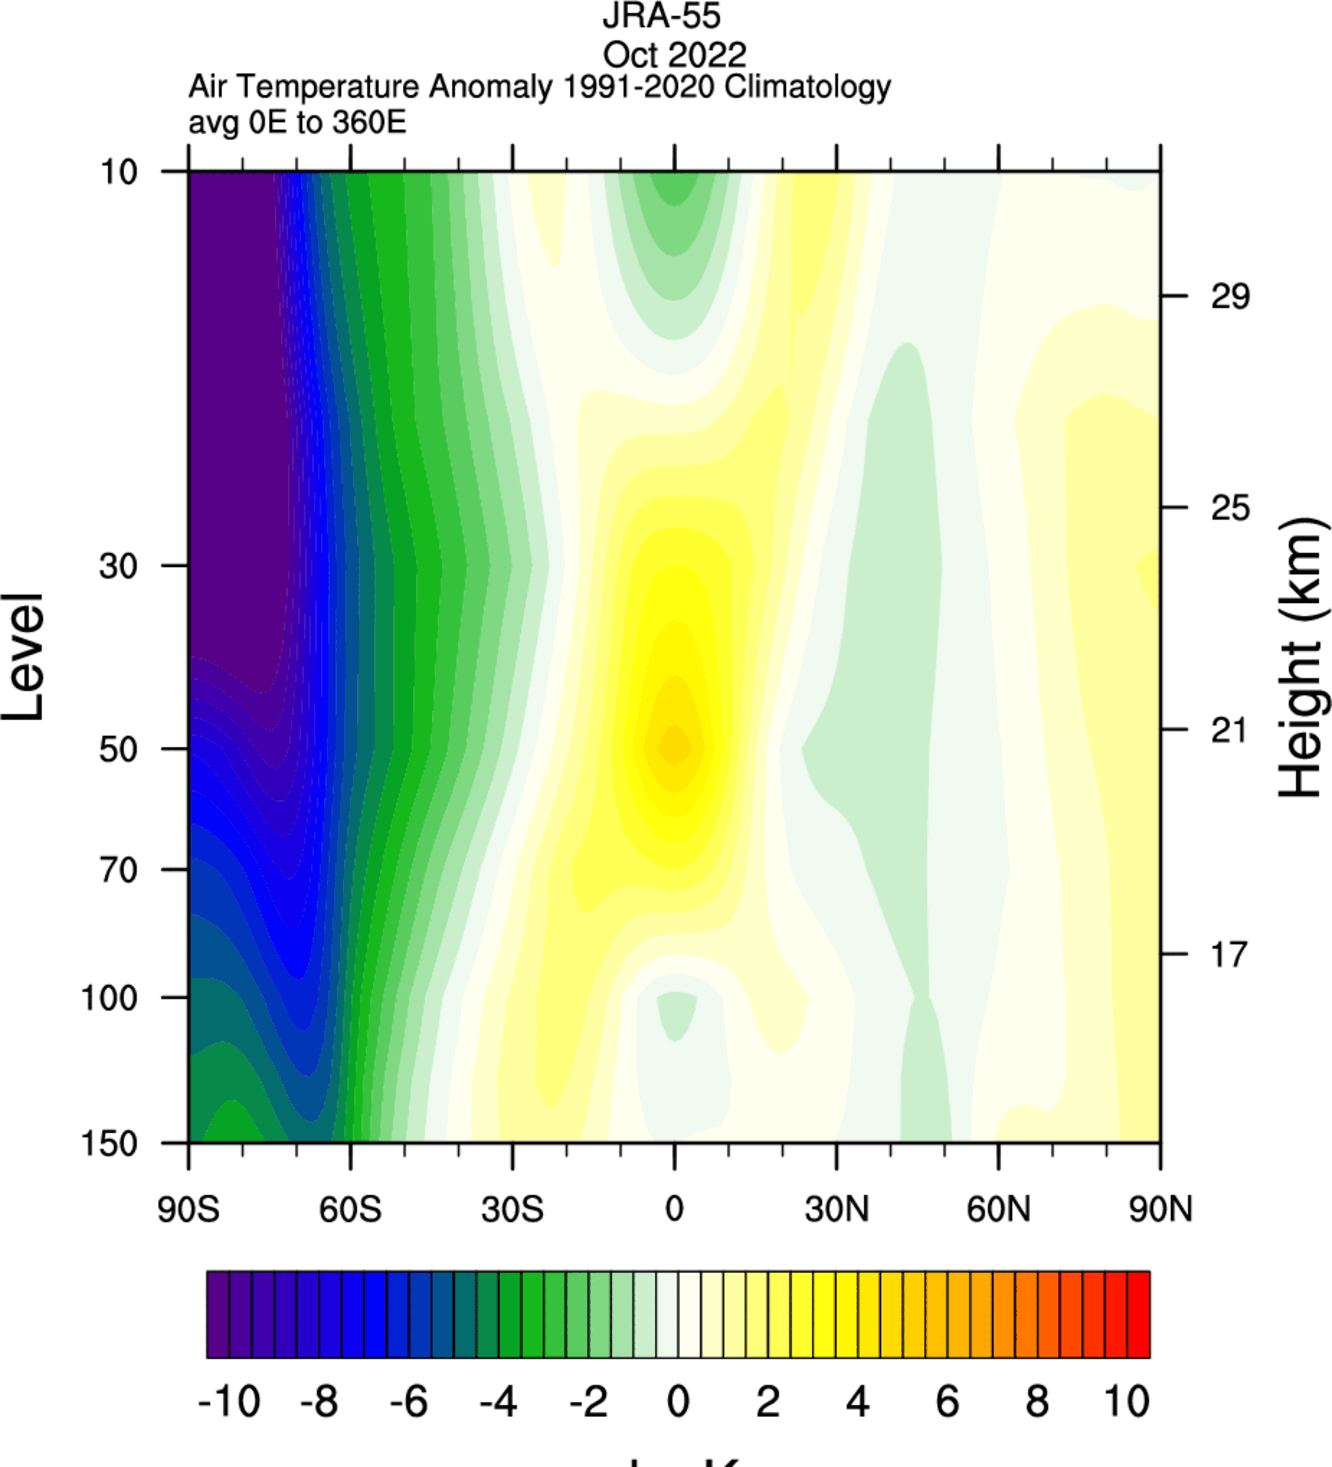
Looking at the vertical analysis, you can see the cold anomalies reaching all the way from the lower to the middle stratosphere. The strongest anomalies are confined between the 30S to 60S degrees south latitude.
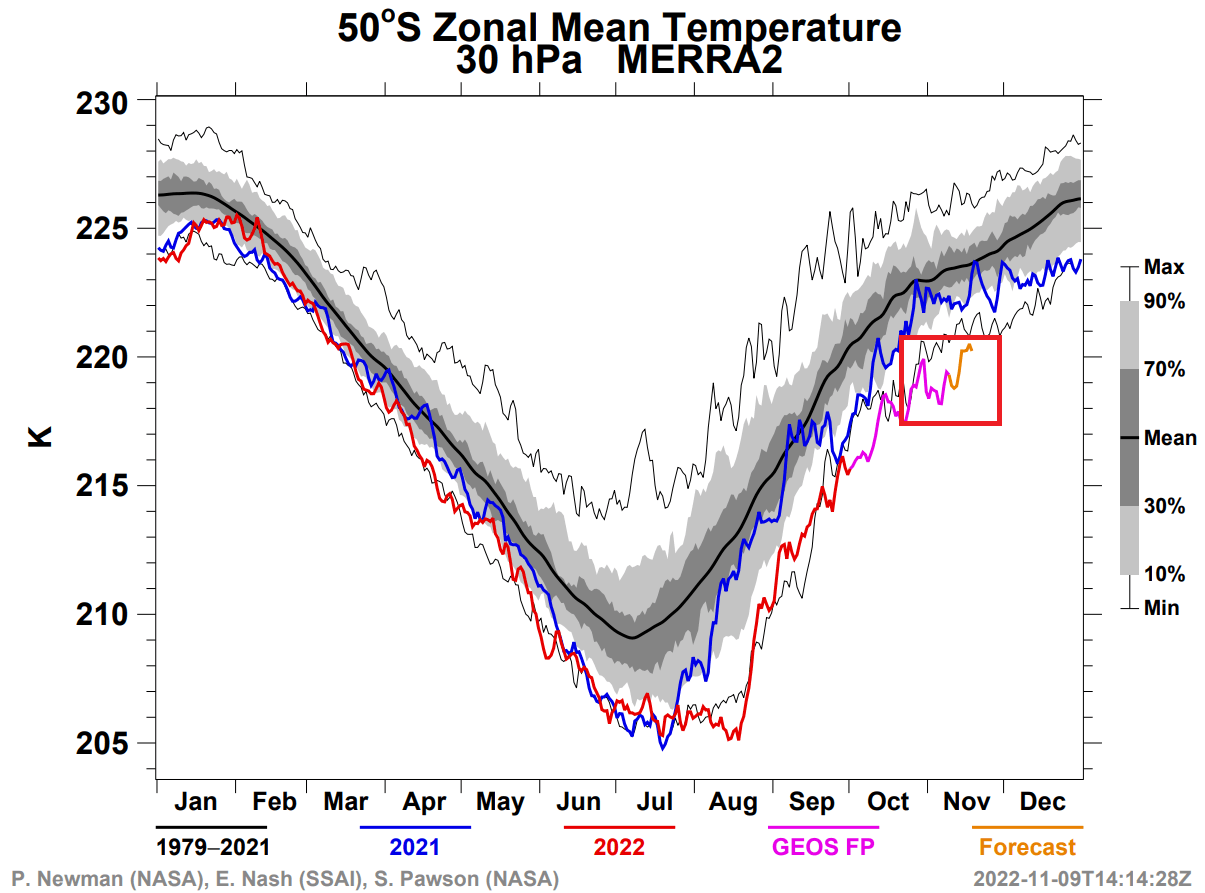
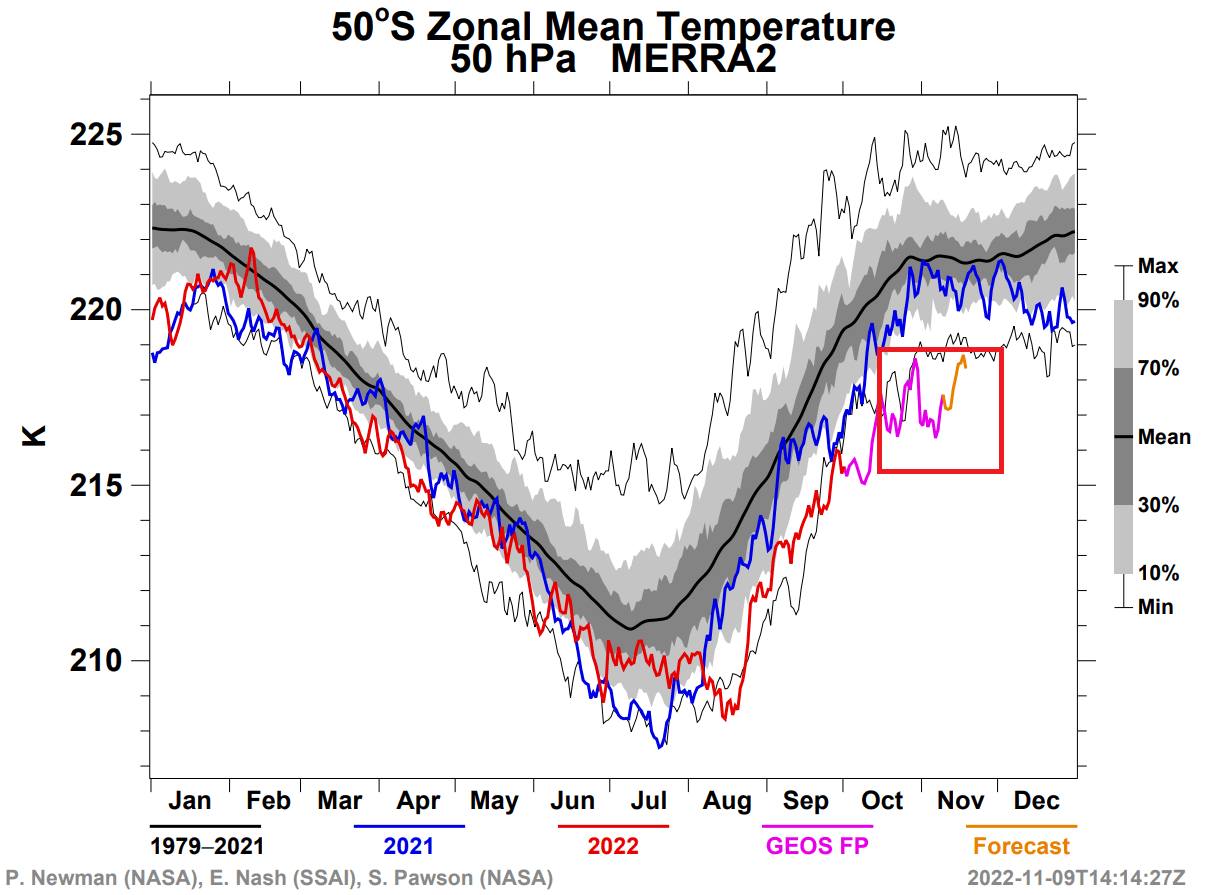
And finally, the latest NASA analysis shows continued cooling. The graph below is for the 50S latitude. In the mid-stratosphere, you can see record cold temperatures being detected and forecasted for this time of year.
Looking at the lower stratosphere, the story is the same. NASA analysis reveals record cold temperatures at the mid-latitudes for this time of year.
LATEST ANALYSIS AND FORECAST DATA
The latest analysis shows the cooling anomalies connecting all the way into the polar regions. This makes most of the south stratosphere colder than normal. This is a somewhat expected result after such a strong injection of water vapor directly into the stratosphere.
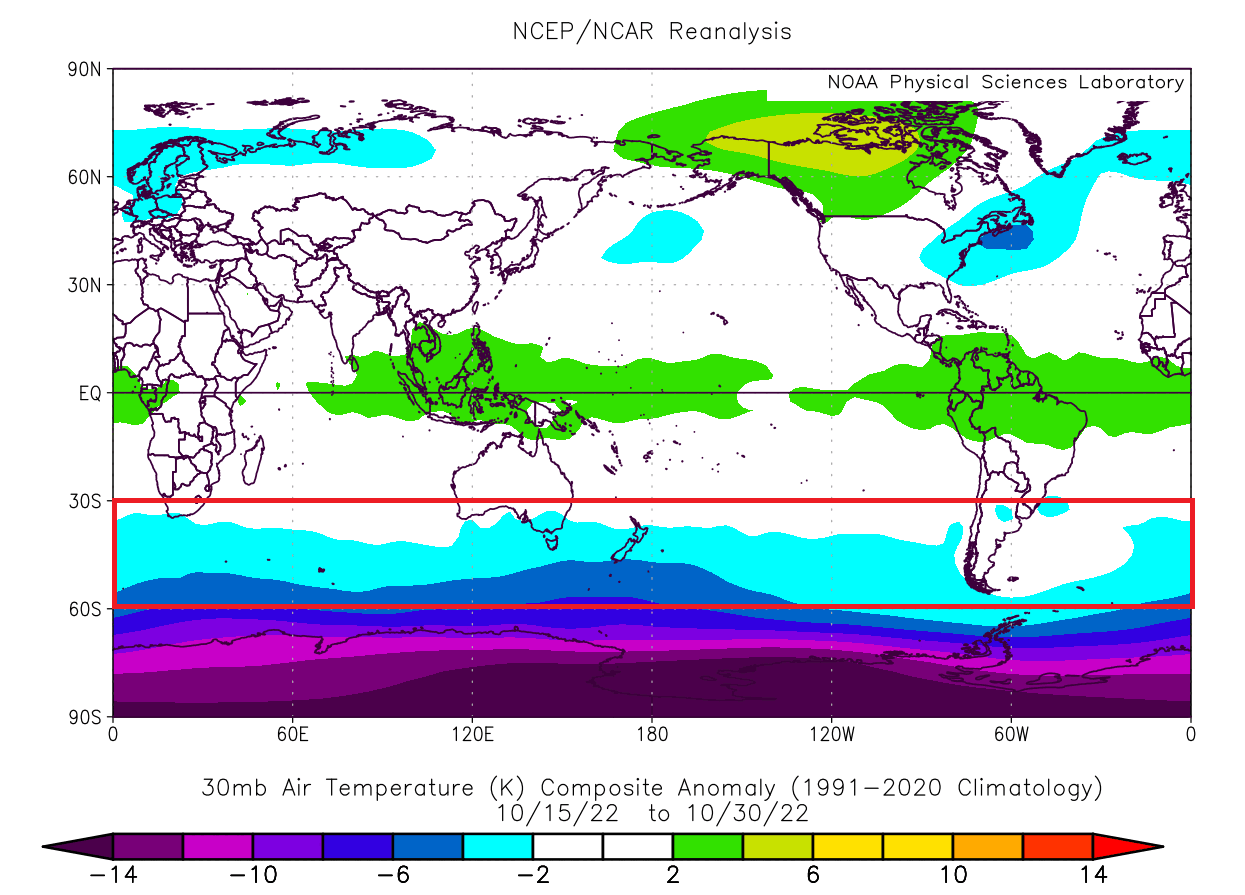
Below is the 30mb pressure level analysis (22km/13.6miles), showing a belt of cold anomalies over the southern mid-latitudes. Another large, strong cold area expands across the south-polar and mid-latitude regions.
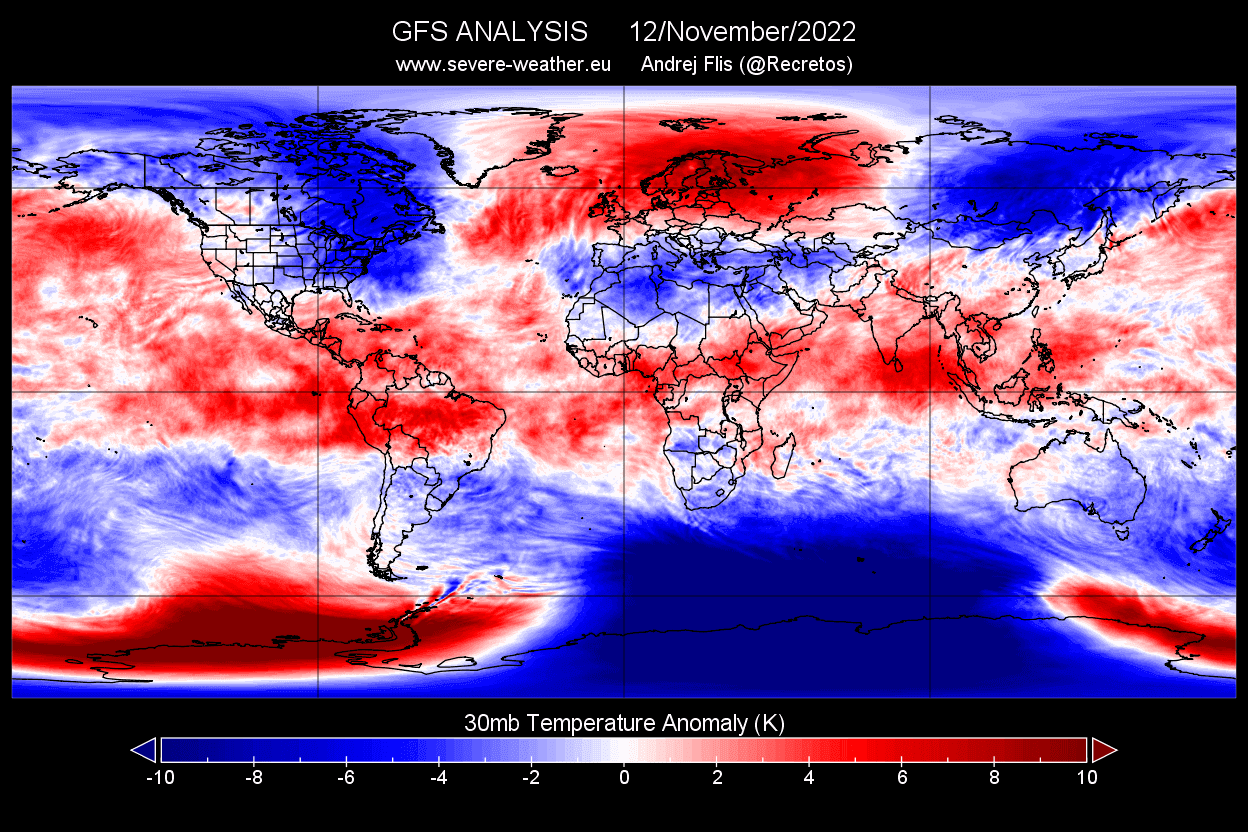
You can also see cold anomalies across the parts of the northern stratosphere. But currently, there is no data that would suggest those cold areas result from water vapor cooling.
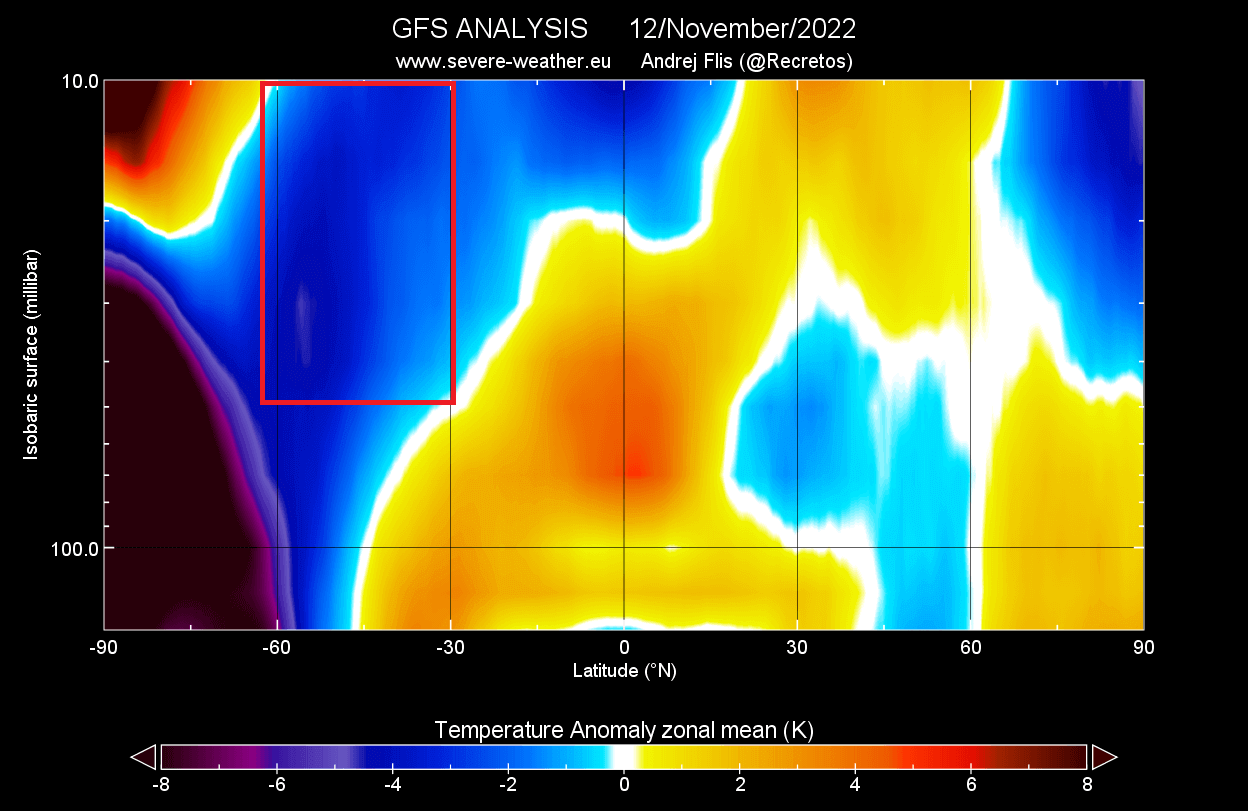
You can also see that on the latest vertical analysis. Most of the southern stratosphere is colder than normal, from the lower parts all the way into the mid and higher stratosphere. The marked area covers the mid/low stratosphere, with the cold anomalies there mostly resulting from the water vapor cooling.
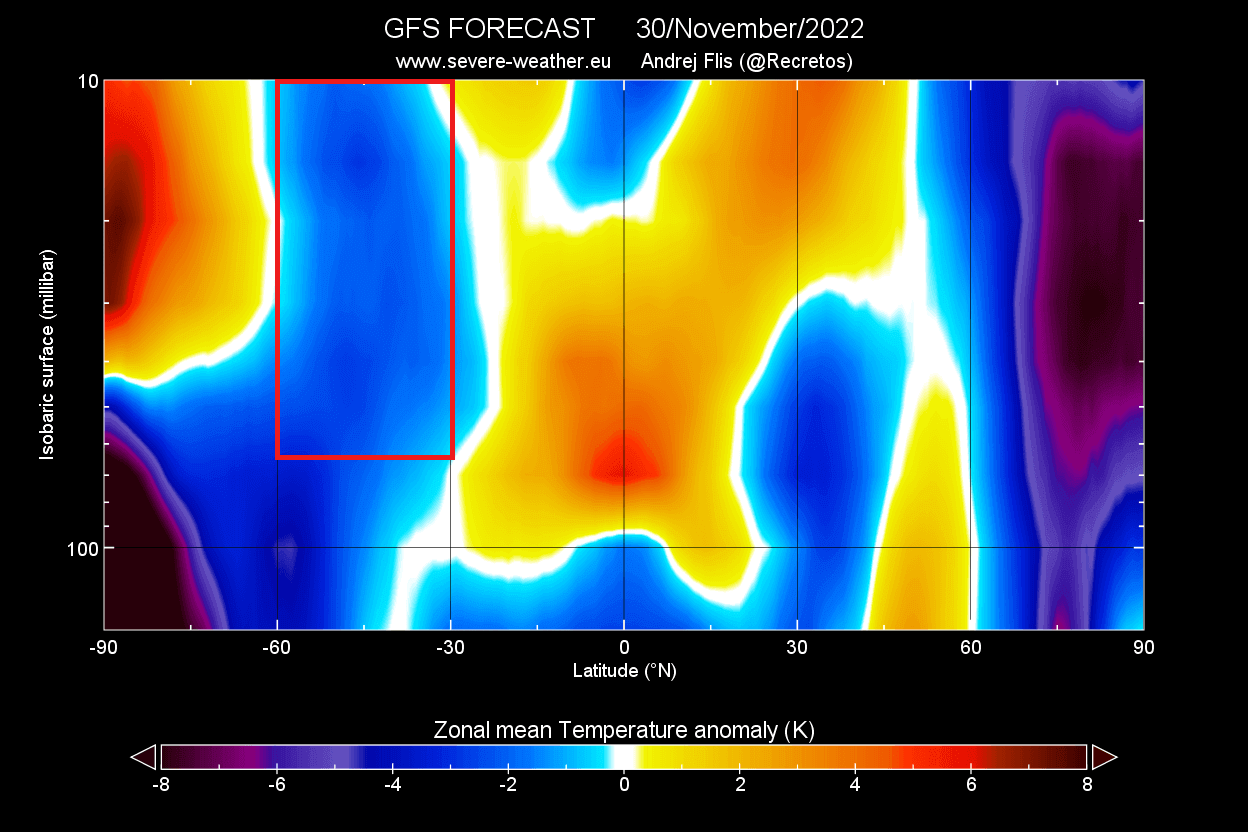
Looking ahead at the GFS forecast below for the end of the month, you can still see the cold anomalies in the 30 to 60 south latitudes. As the south polar stratosphere regions warm up, the mid-latitudes will remain colder due to the water vapor cloud cooling.
SEASONAL WINTER WEATHER INFLUENCE
Now, we all want to know how this will impact the global weather, especially (if at all) in the upcoming Winter 2022/2023.
For this purpose, we have produced a simple July-September temperature index covering the stratosphere over the southern hemisphere’s mid-latitudes. You can see it below, with several warm and cold seasons.
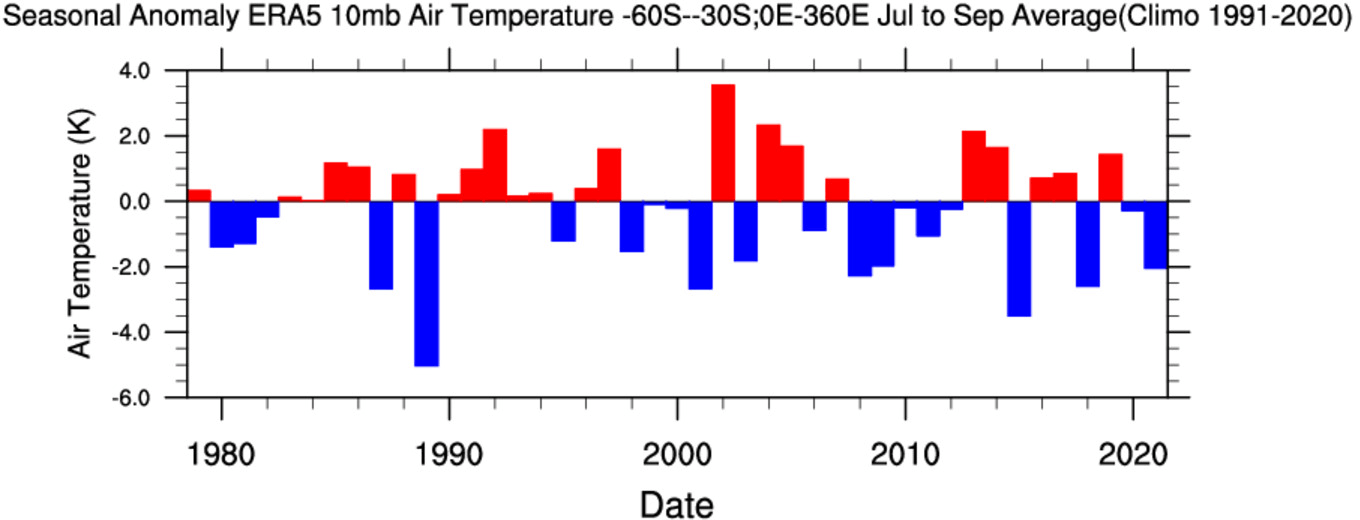
What we did next is compare this changing index year-to-year with changing temperature and pressure patterns during the winter season in the northern hemisphere. This is called a linear correlation and compares the two parameters, revealing any potential connection.
There is one very important thing to add here. A correlation does not mean direct cause and effect, as another background signal can cause the same pressure anomaly pattern. More research is needed to confirm the stratospheric cooling weather response.
But we can still look at the basic data, trying to find a simple connection between the stratospheric cooling and the winter weather.
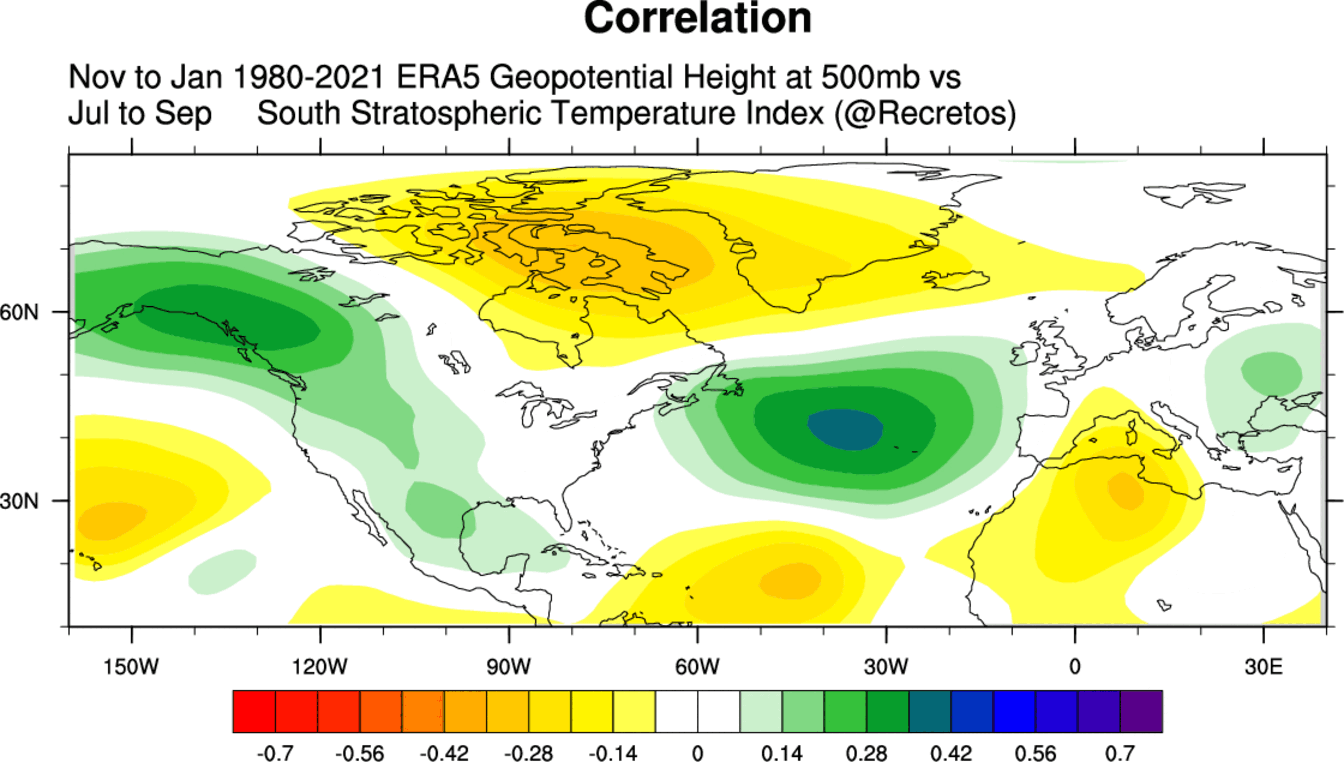
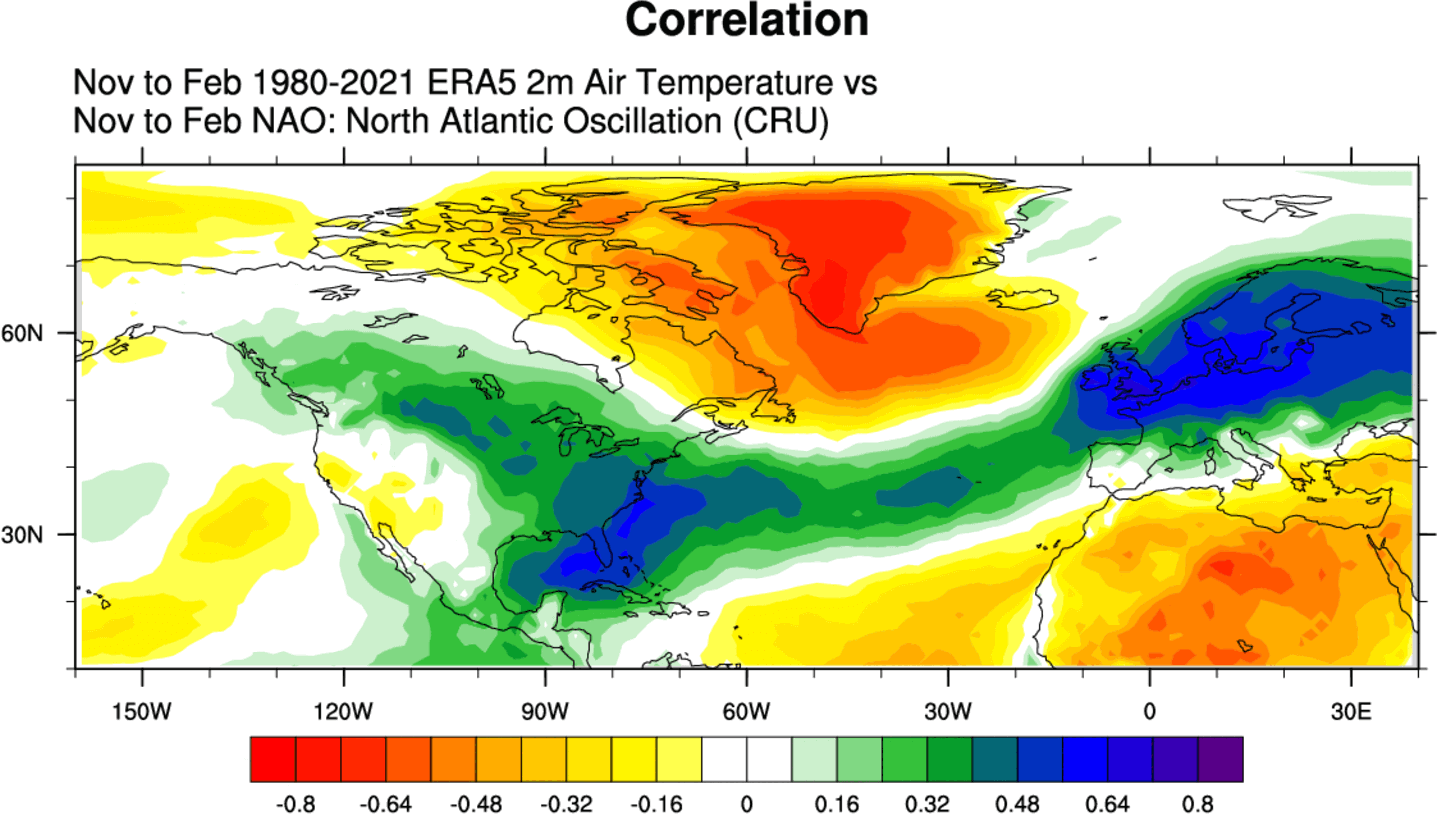
We can see that in the image below, where an indicated response to the south stratospheric cooling would be a negative NAO pressure pattern. NAO stands for North Atlantic Oscillation and describes the pressure pattern affecting North America and Europe.
A negative NAO pattern means higher pressure over the north Atlantic and Greenland and lower pressure to the south. The image below shows the temperature pattern of an average negative NAO winter season. You can see colder temperatures over the northern and eastern half of the United States and Europe.
If we look at the winter seasons following anomalously cold south stratospheric years, we can see a great example of a negative NAO pattern. High pressure over Greenland and lower pressure over the mid-North Atlantic.
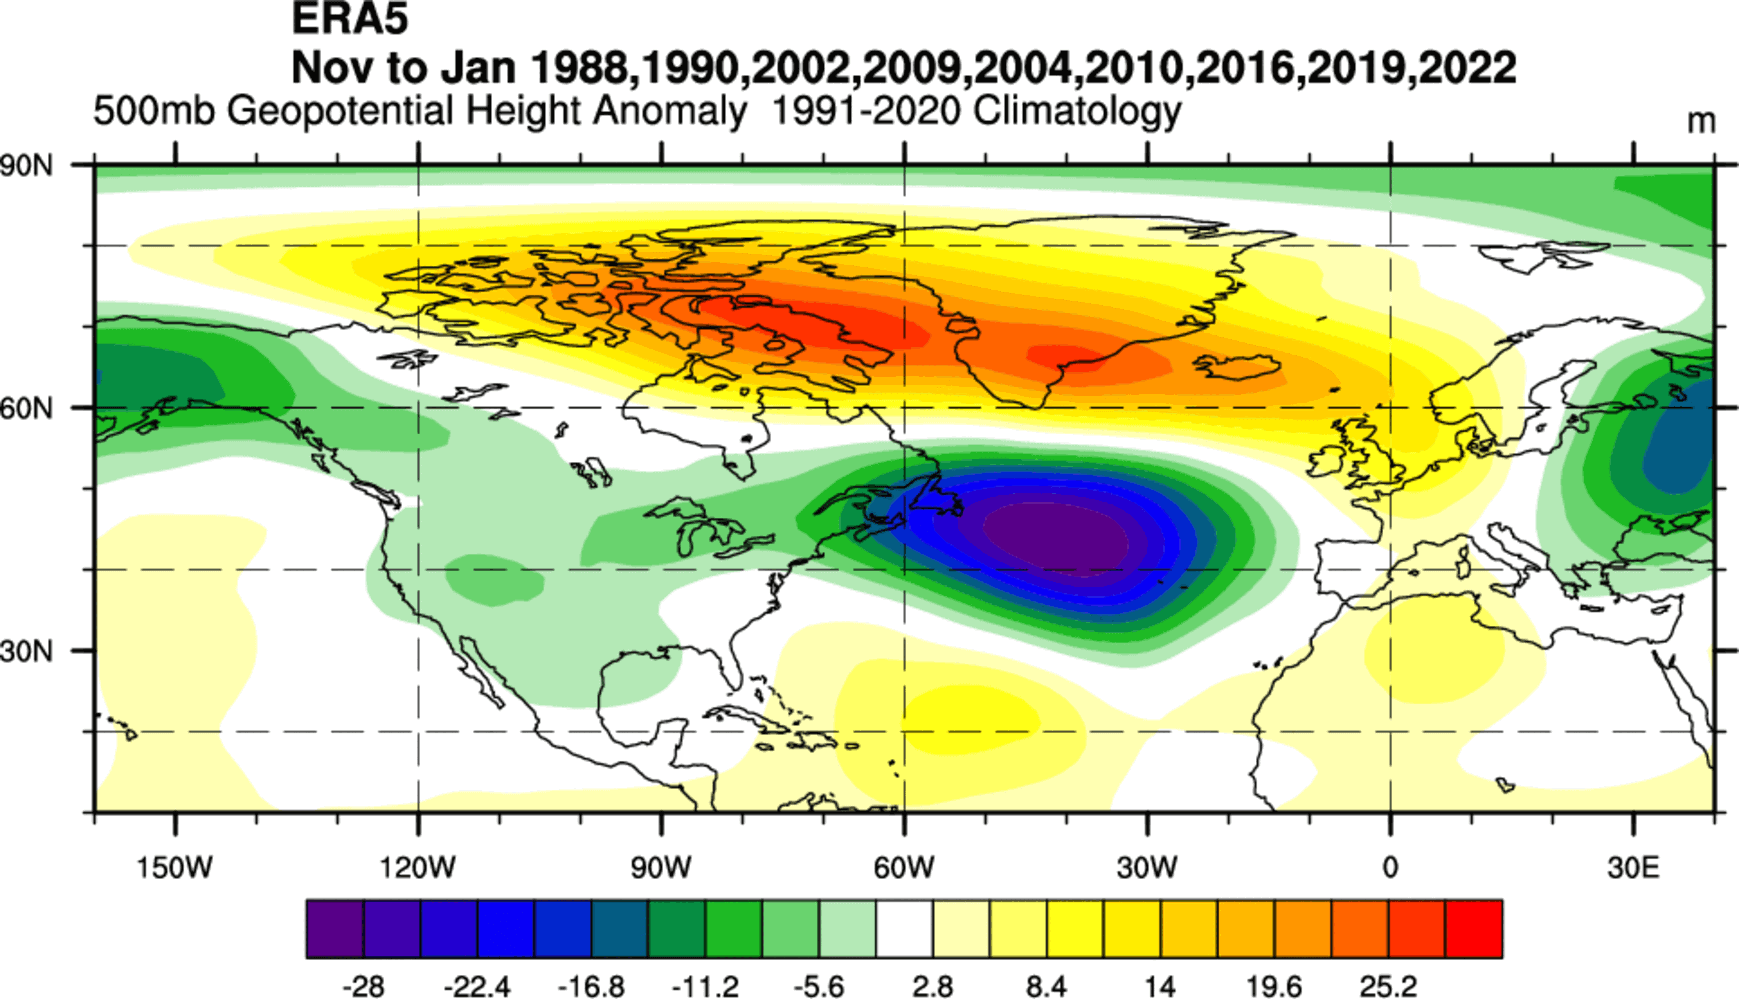
Of course, we have to add that this does not mean the stratospheric cooling was responsible for these patterns. Each year has other much more direct influences. But there is a hint or a statistical pattern between the south stratosphere and the northern Winter season.
WINTER SEASON STRATOSPHERE
One area of linkage could be the stratosphere itself. If we look at the same years again, we can see that the corresponding pressure pattern in the Northern Stratosphere shows a weaker polar vortex circulation. That is shown by a higher-than-normal pressure and weaker winds.
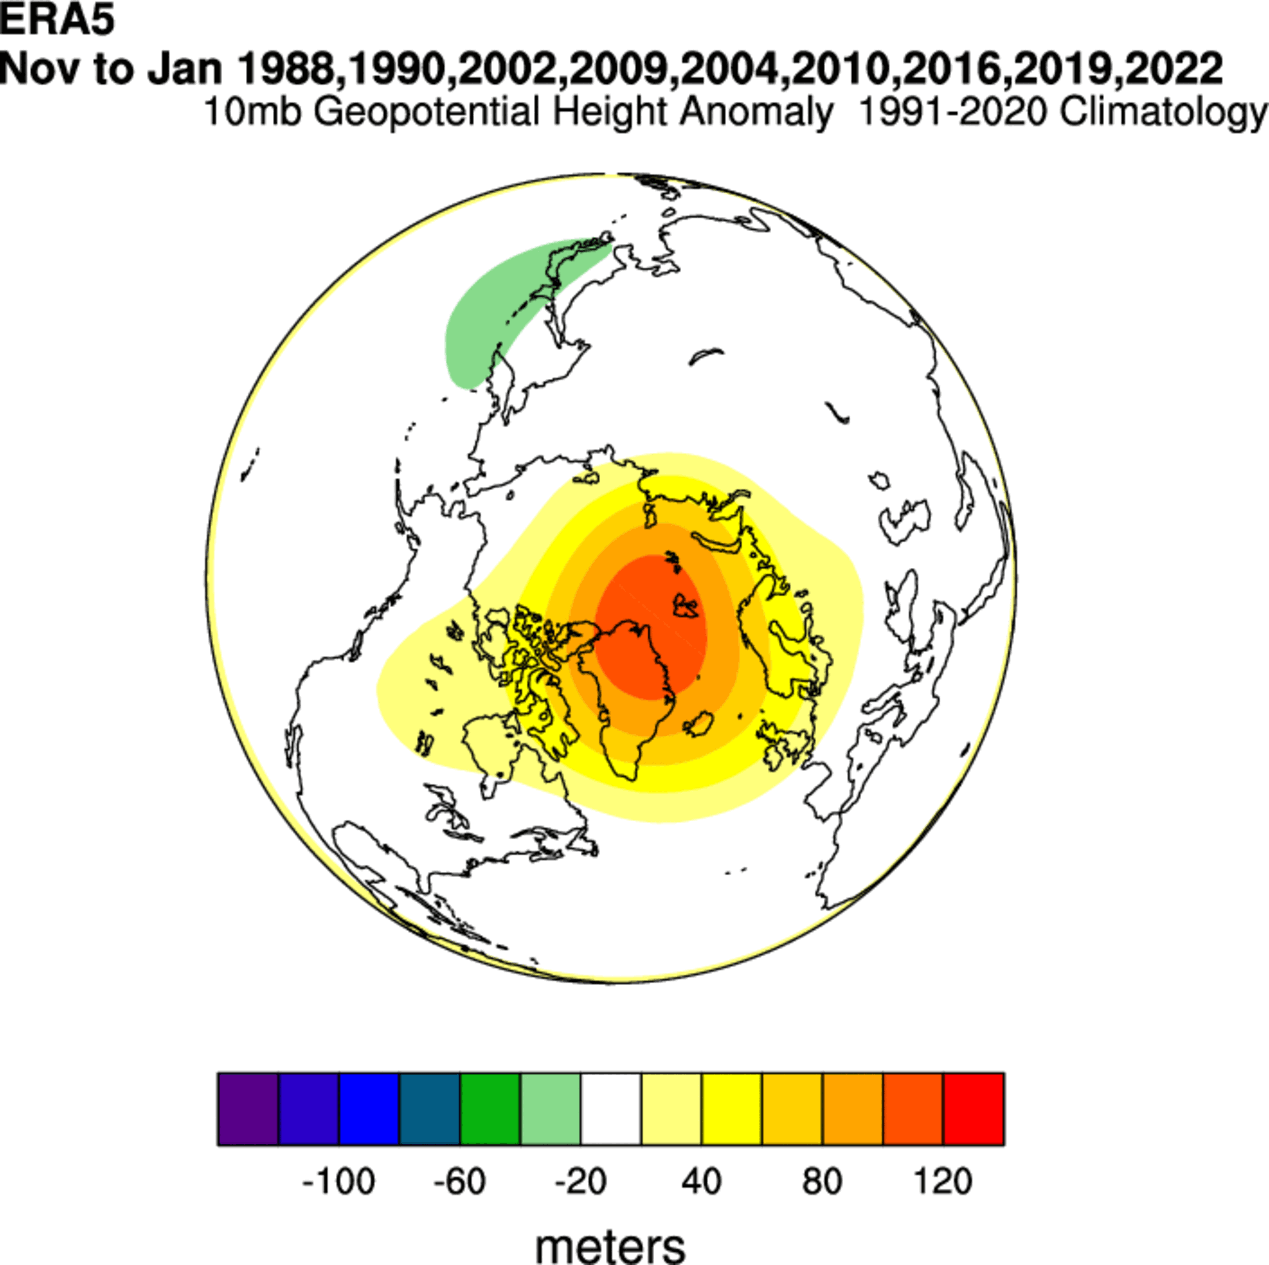
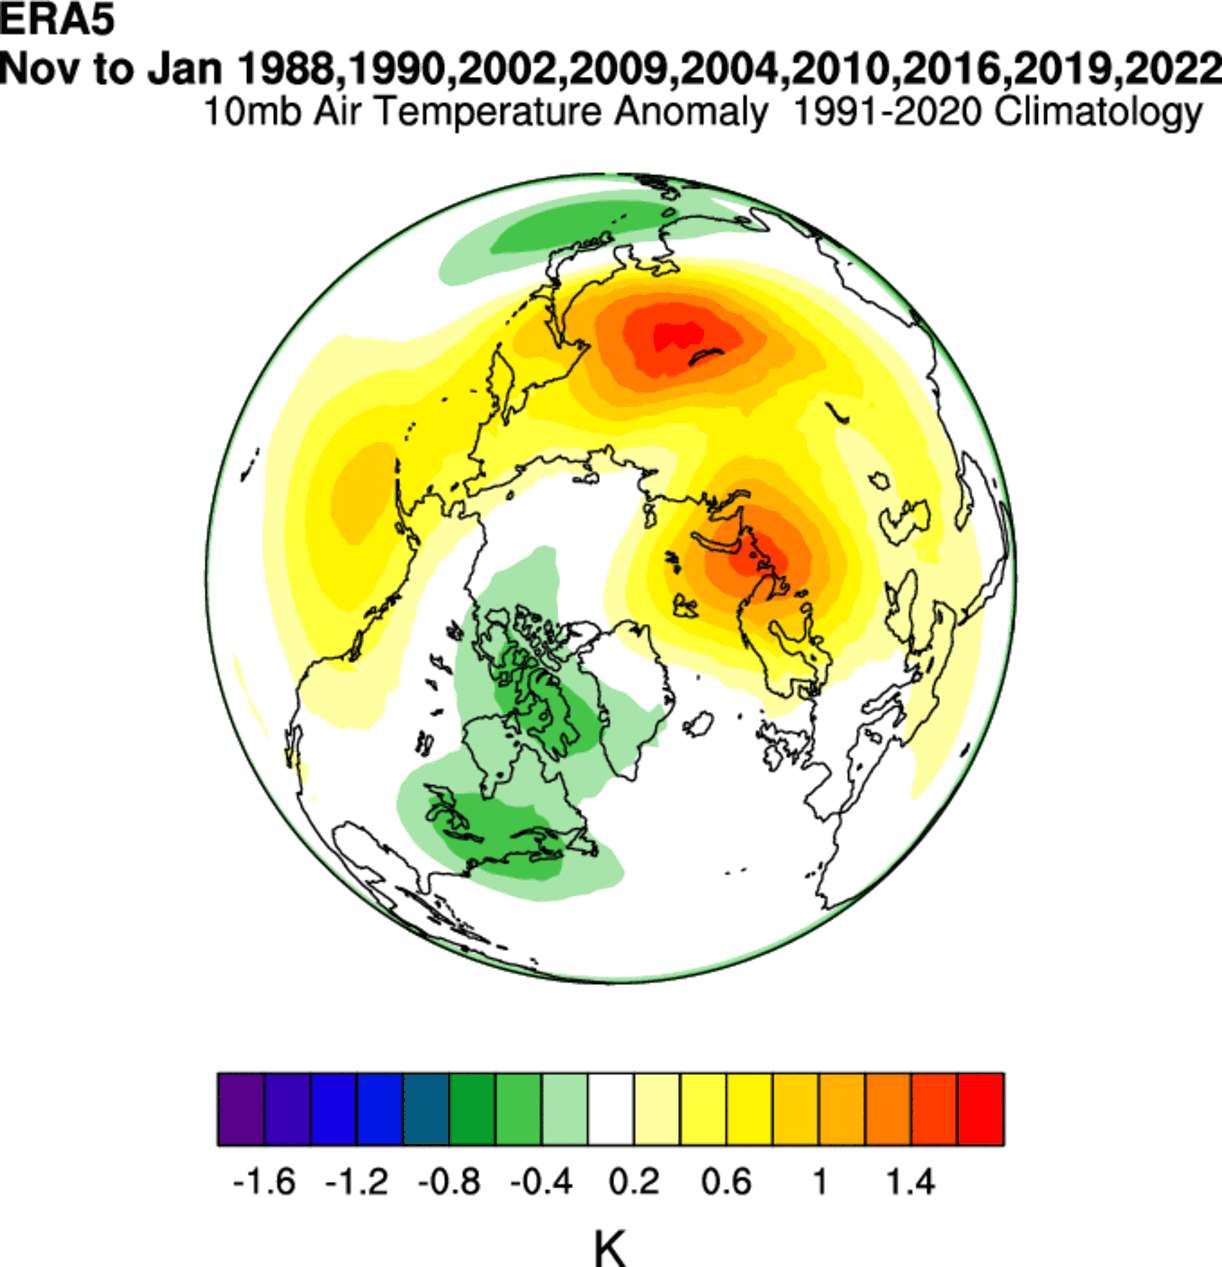
Also, looking at the northern stratospheric winter temperatures, we see warm temperature anomalies in the stratosphere in these winter seasons. This indicates a weaker stratospheric circulation, which can also mean a more disrupted jet stream pattern below.
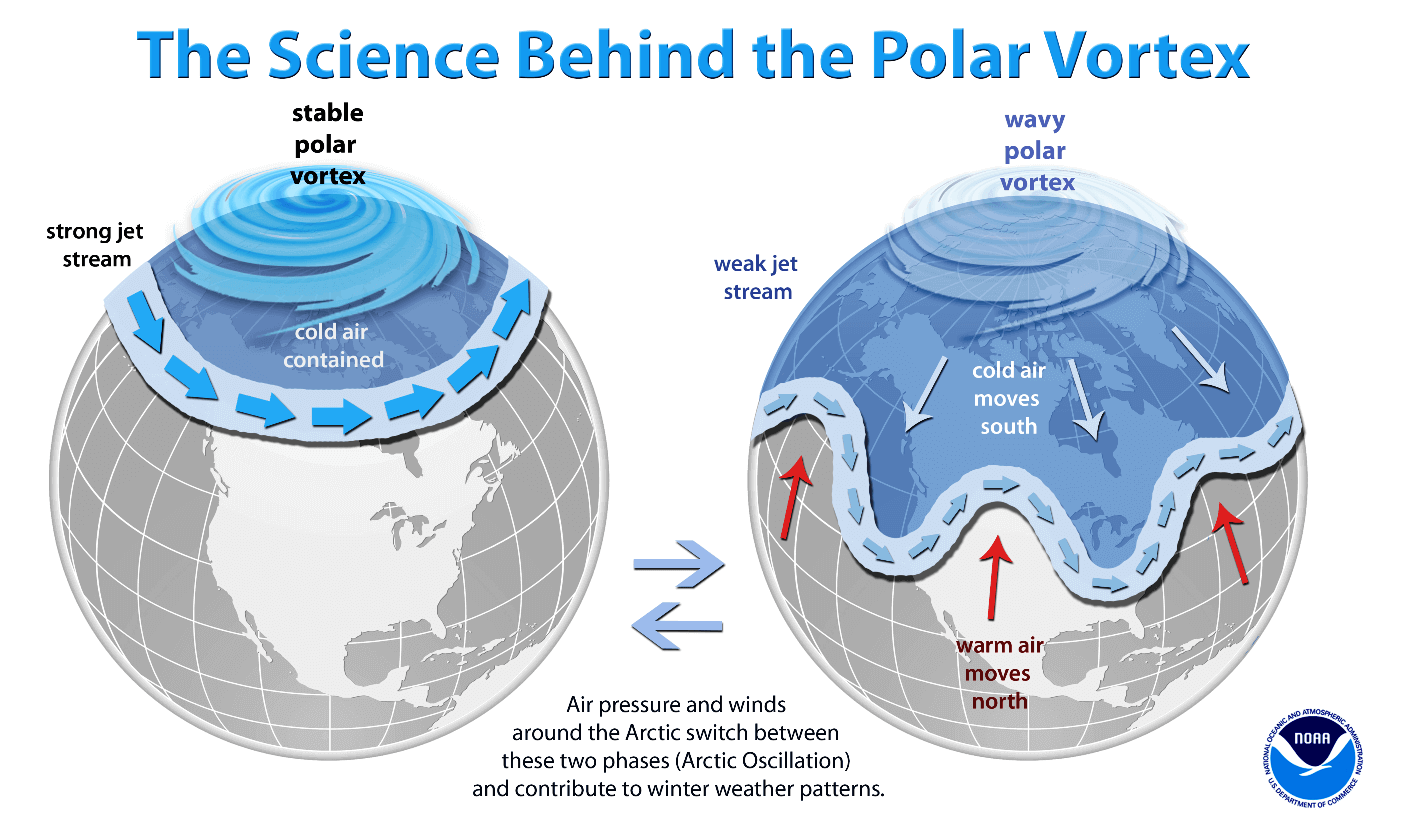
A strong Polar Vortex usually means strong polar circulation. This usually locks the colder air into the Polar regions, creating milder conditions for most of the United States and Europe.
In contrast, a weak Polar Vortex can create a weak jet stream pattern. As a result, it has a harder time containing the cold air, which can now escape from the polar regions into the United States and Europe. Image by NOAA.
The weak polar vortex events typically result from stratospheric warming events. These events can collapse the stratospheric polar circulation, heavily modifying the weather patterns below and creating a negative NAO pattern.
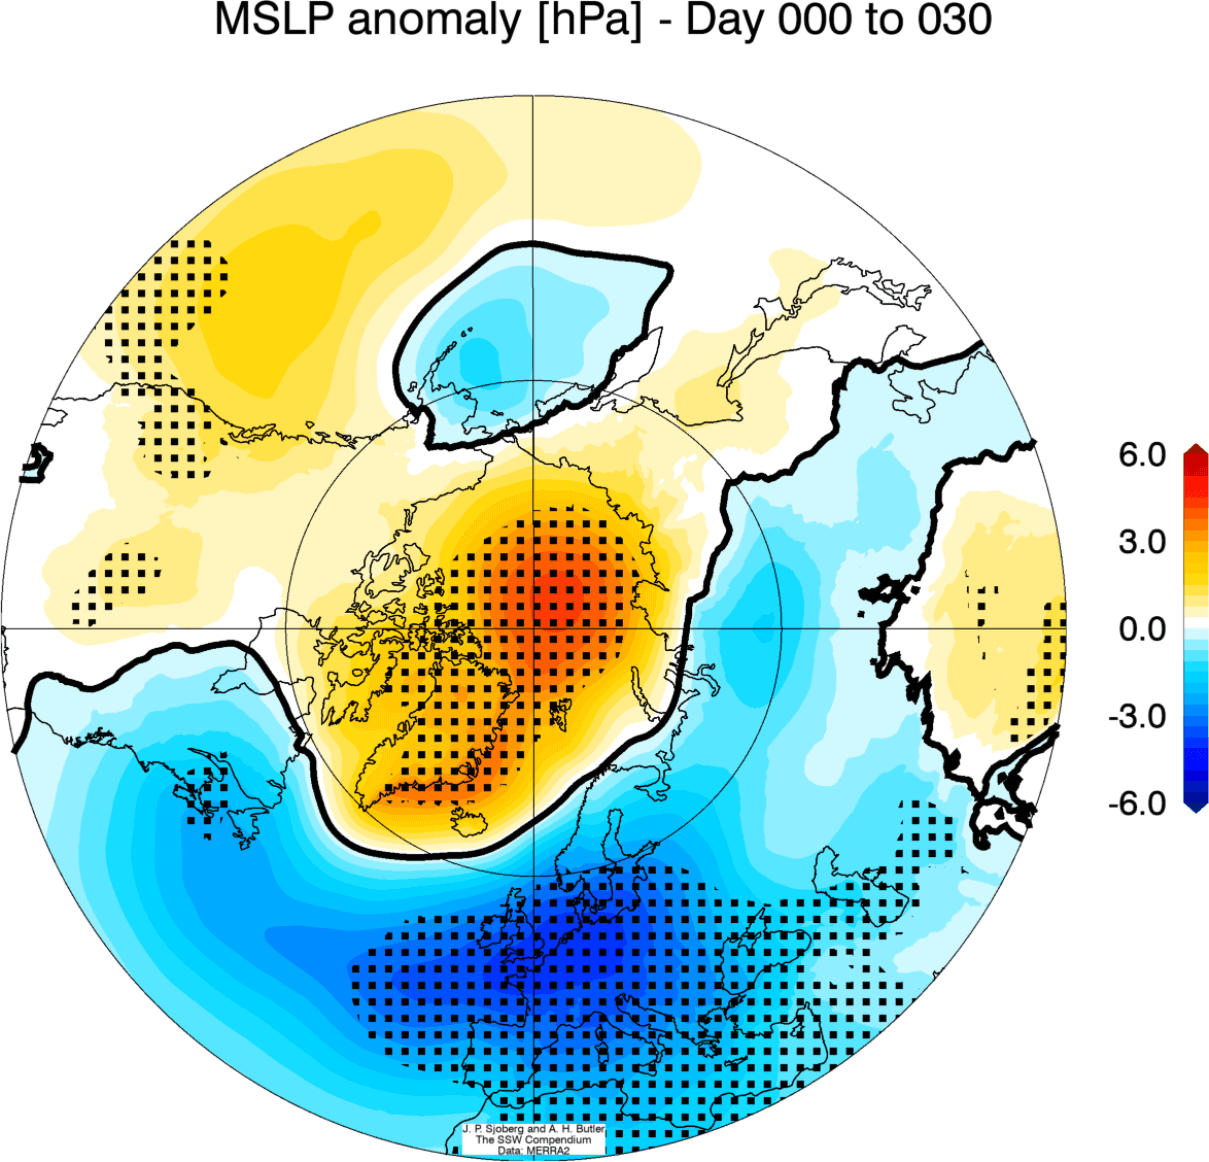
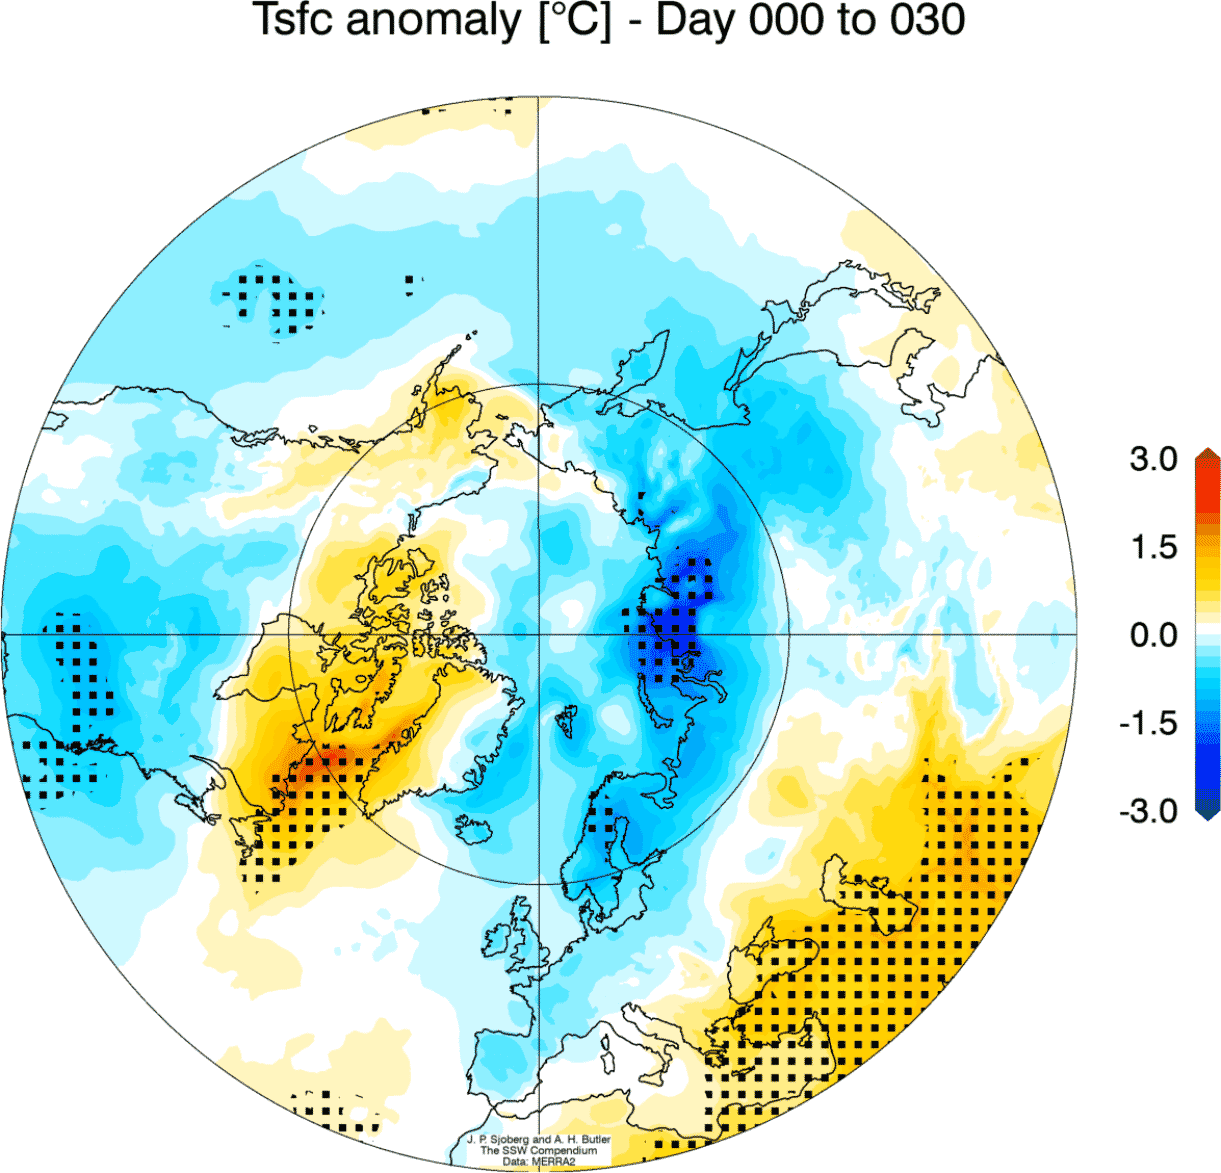
We get an interesting picture if we combine all Stratospheric Warming events and look at the weather 0-30 days following the stratospheric warming events.
Below is the average pressure anomaly after a stratospheric warming event. It corresponds to a negative NAO pattern. This heavily disrupted circulation pattern supports a free path for colder polar air to move out of the polar regions.
The corresponding average temperature 0-30 days after an SSW event shows that most of the United States is trending colder than normal, and Europe is as well. But note that this is an average picture of many SSW events. Each individual stratospheric warming event is different and does not automatically mean a strong winter pattern.
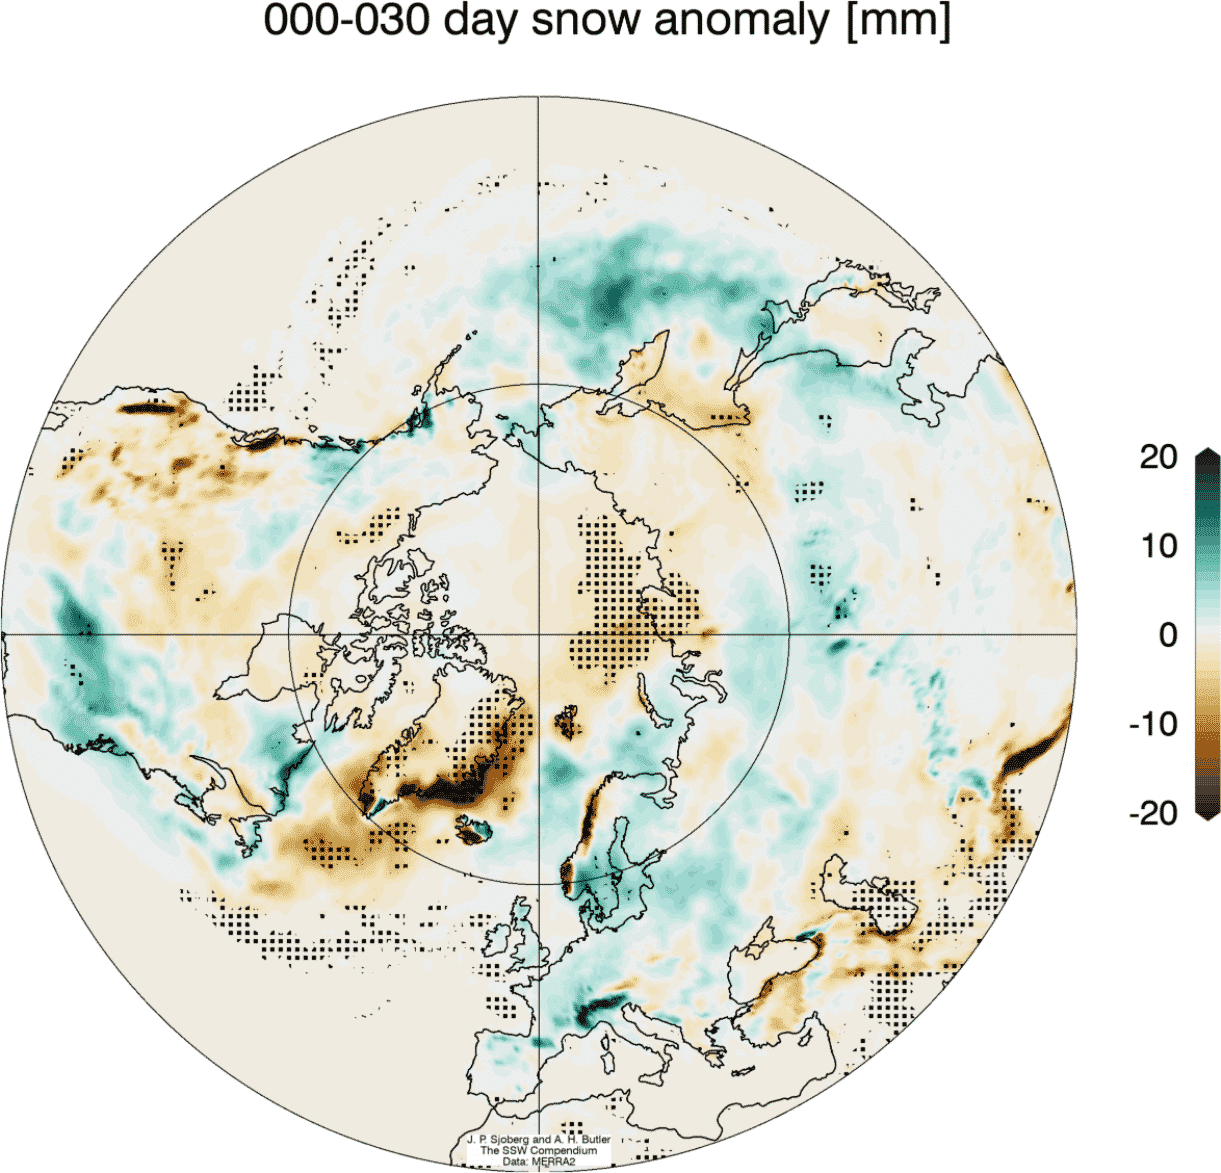
Looking at snowfall, we can see above-average snowfall over much of the eastern United States and also Europe. This is an expected response after major stratospheric warming events, as the colder air has an easier path towards the south and into these regions.
SUMMARY
The January eruption of Hunga Tonga in the South Pacific has injected a large amount of water vapor into the stratosphere. That water vapor is now causing significant cooling of the southern stratosphere, continuing into late Fall and early Winter.
We looked at the historical data and found that there is a weak indication of the south stratospheric cooling, coinciding with later stratospheric warming events over the northern hemisphere. But much more research is needed, as other background signals can be at play.
Stratospheric warming during the northern hemisphere winter can mean a heavy disruption of circulation. This causes pressure changes and can unleash cold air from the Arctic into the United States and Europe.
It would make sense for the changes in the stratosphere on the southern side of the planet could also impact the northern hemisphere. As the cooling in the southern hemisphere is substantial, the upcoming winter will be a great real-life “lab test” of the potential global weather changes.
We will release regular weekly, and monthly updates as fresh forecasts are produced during the upcoming cold season. So make sure to bookmark our page. Also, if you have seen this article in the Google App (Discover) feed, click the like button (♥) there to see more of our forecasts and our latest articles on weather and nature in general.