Fresh forecast data is available for Winter 2022/2023. It shows an increasing influence of the third-year La Nina phase. A high-pressure blocking system is forecast to develop in the North Pacific, modifying the jet stream over North America. The latest forecast also shows more snowfall potential across the United States.
Many factors are coming together to influence the Winter season each year. But this year, one of the main factors is the cold La Nina in the ENSO regions of the equatorial Pacific.
But how can the oceans have such an impact on winter weather? We will first examine how the La Nina works and how its influence is predicted to change as we get closer to the Winter season of 2022/2023.


WINTER FROM THE OCEAN AND ATMOSPHERE
La Nina develops in the ENSO region, short for “El Niño Southern Oscillation.” This region of the equatorial Pacific Ocean changes between warm and cold phases. Typically there is a phase change around every 1-3 years.
The cold phase is called La Nina, and the warm phase is called El Nino. We are currently in a La Nina phase, entering its 3rd year, which is a rather rare occurrence.
The image below from NOAA Climate shows the typical circulation during a cold ENSO phase. Air sinks in the eastern Pacific, promoting stable and dry weather. At the same time, the air rises in the western Pacific, with lower pressure and more rainfall.

This way, ENSO significantly impacts the tropical rainfall and pressure patterns and thus impacts the ocean-atmosphere feedback system. Through this ocean-atmosphere system, the ENSO influence spreads globally.
Looking at the latest global ocean anomalies, you can see the cold La Nina standing out in the tropical Pacific ocean. The rest of the world shows strong warm pooling in the North Pacific and in the North Atlantic, playing their role in the more regional pattern development.
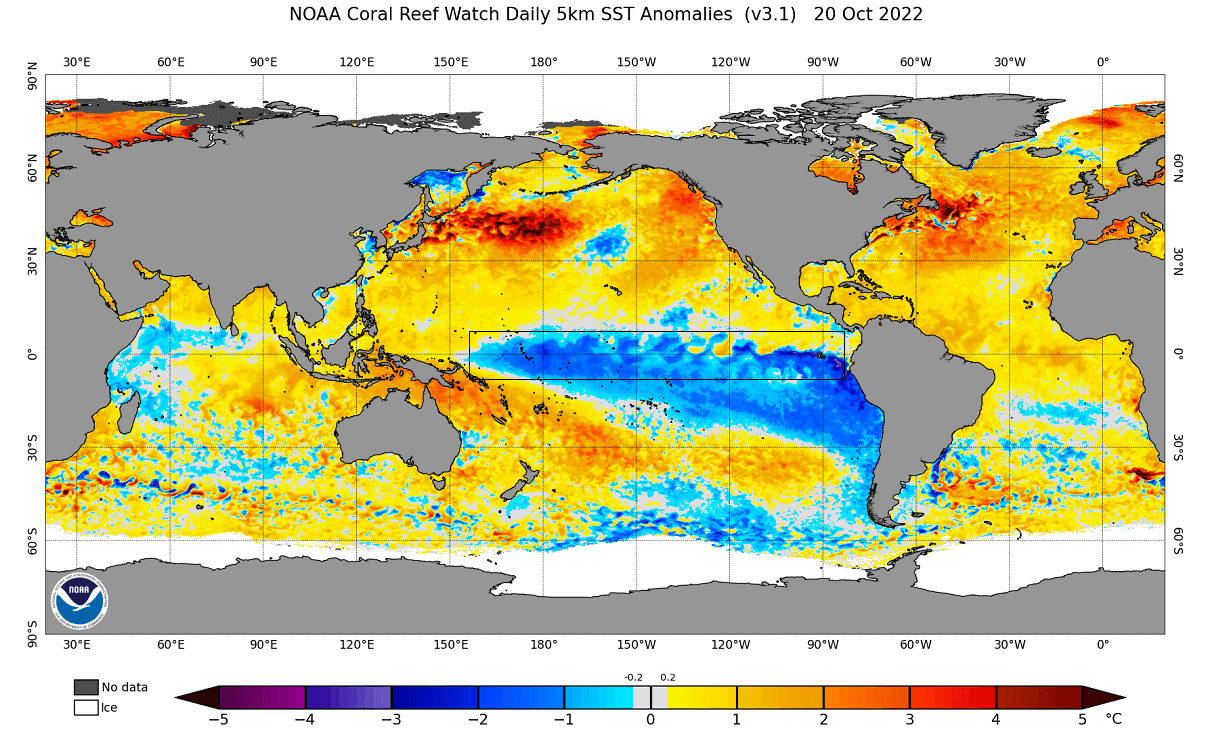
Below we have a close-up view of the tropical Pacific Ocean surface analysis. We can see the cold anomalies in the marked ENSO regions. The currently active La Nina is entering its third-year phase, extending the cold ocean anomalies across most of the tropical Pacific.

La Nina forms during strong easterly trade winds, which can tell us much about the general state of global circulation. This way, we can use these anomalies as an “indicator” to know the current state of the global climate system.
Below, you can see the progress of some historical multi-year La Nina episodes, with only two events previously having a 3rd-year event. Three events went neutral in the third year, and three phases reversed into an El Nino in the third season.

To better understand the ENSO development, we produced a video showing the ocean temperature anomalies from June to October 2022.
ENSO cooling restarted in August as the cold waves developed across the equatorial Pacific. But it picked up in September as the easterly trade winds intensified.
LA NINA ENSEMBLE FORECAST
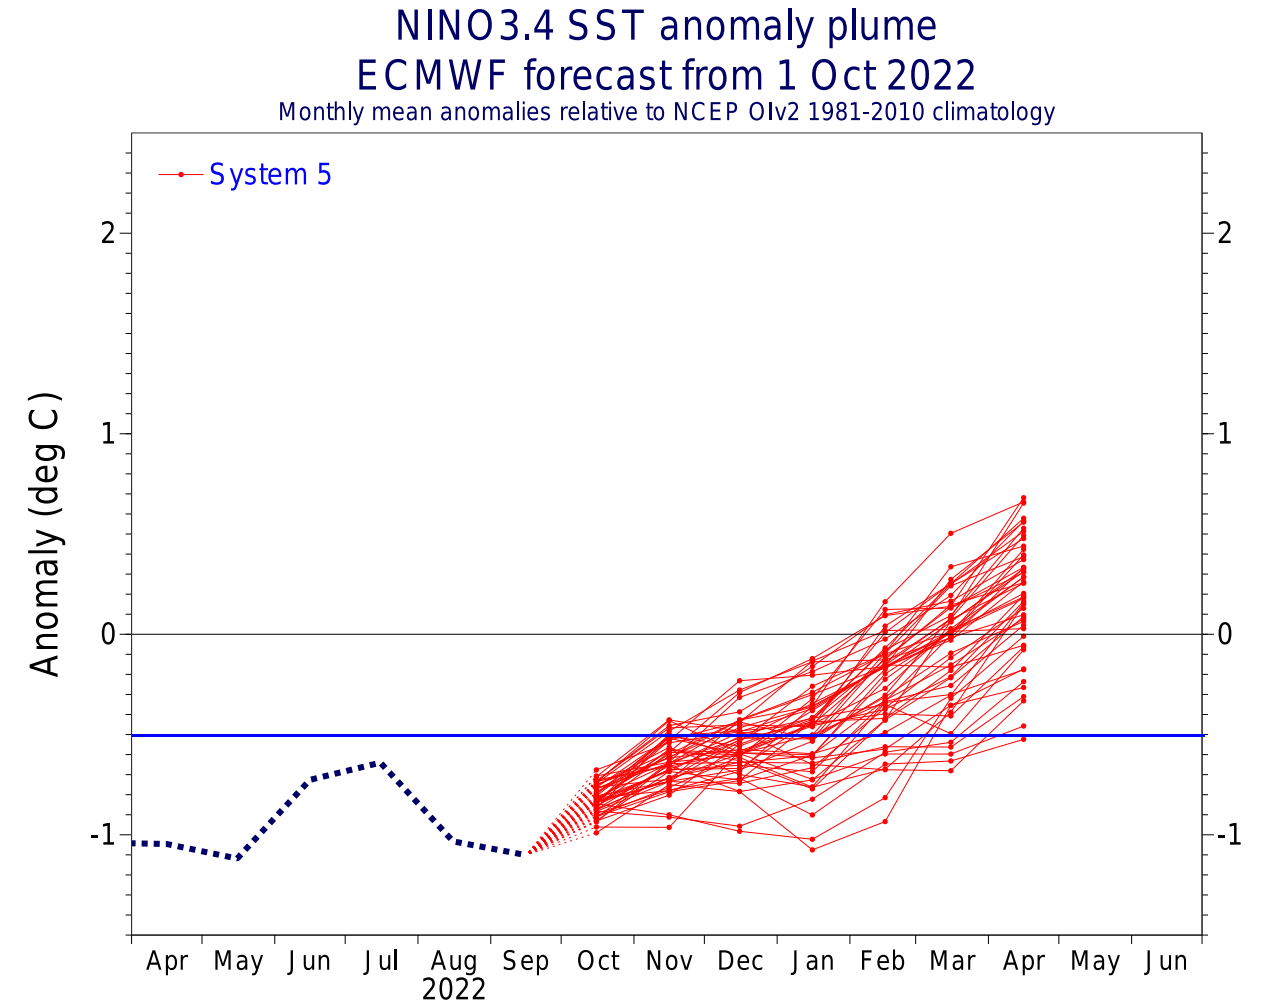
Below we have an analysis/forecast graphic by ECMWF, which shows the forecast of the central ENSO region. The La Nina conditions (below -0.5) will prevail over the late Fall and into Winter. But a weakening of the La Nina is expected for early next year, with a warm phase possible later in 2023.
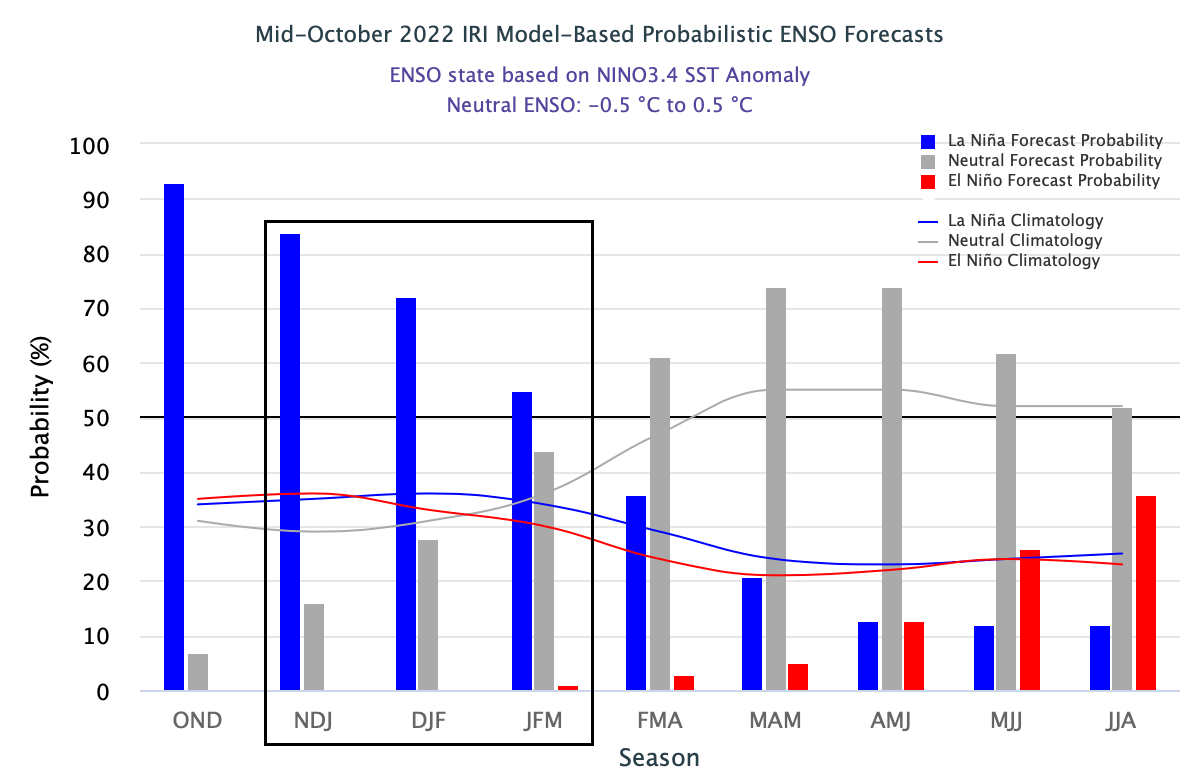
Looking at the IRI probability forecast, we can see a high agreement for the cold phase lasting over the Winter season. We expect a breakdown of the cold phase as we go into next Spring, with a warm phase increasing in probability later in the year.
The combined model ocean forecast shows the cold anomalies in the Pacific regions over the Winter average. A stable La Nina is forecast on all long-range systems, giving high confidence also for its weather influence.

WINTER AND THE MODIFIED JET STREAM
Typically, the first influence of these ocean anomalies can be seen in the changing jet stream. The jet stream is a large and powerful stream of air (wind) at around 8-11km (5-7mi) altitude. It interacts with pressure systems and affects their path and evolution.
The jet stream is an important piece of this forecast. It is one of the main ways La Nina can change the weather patterns more directly, especially over North America.
Historically, a strong blocking high-pressure system in the North Pacific is the most common effect of a cold ENSO phase. That usually redirects the polar jet stream down over the northern United States.
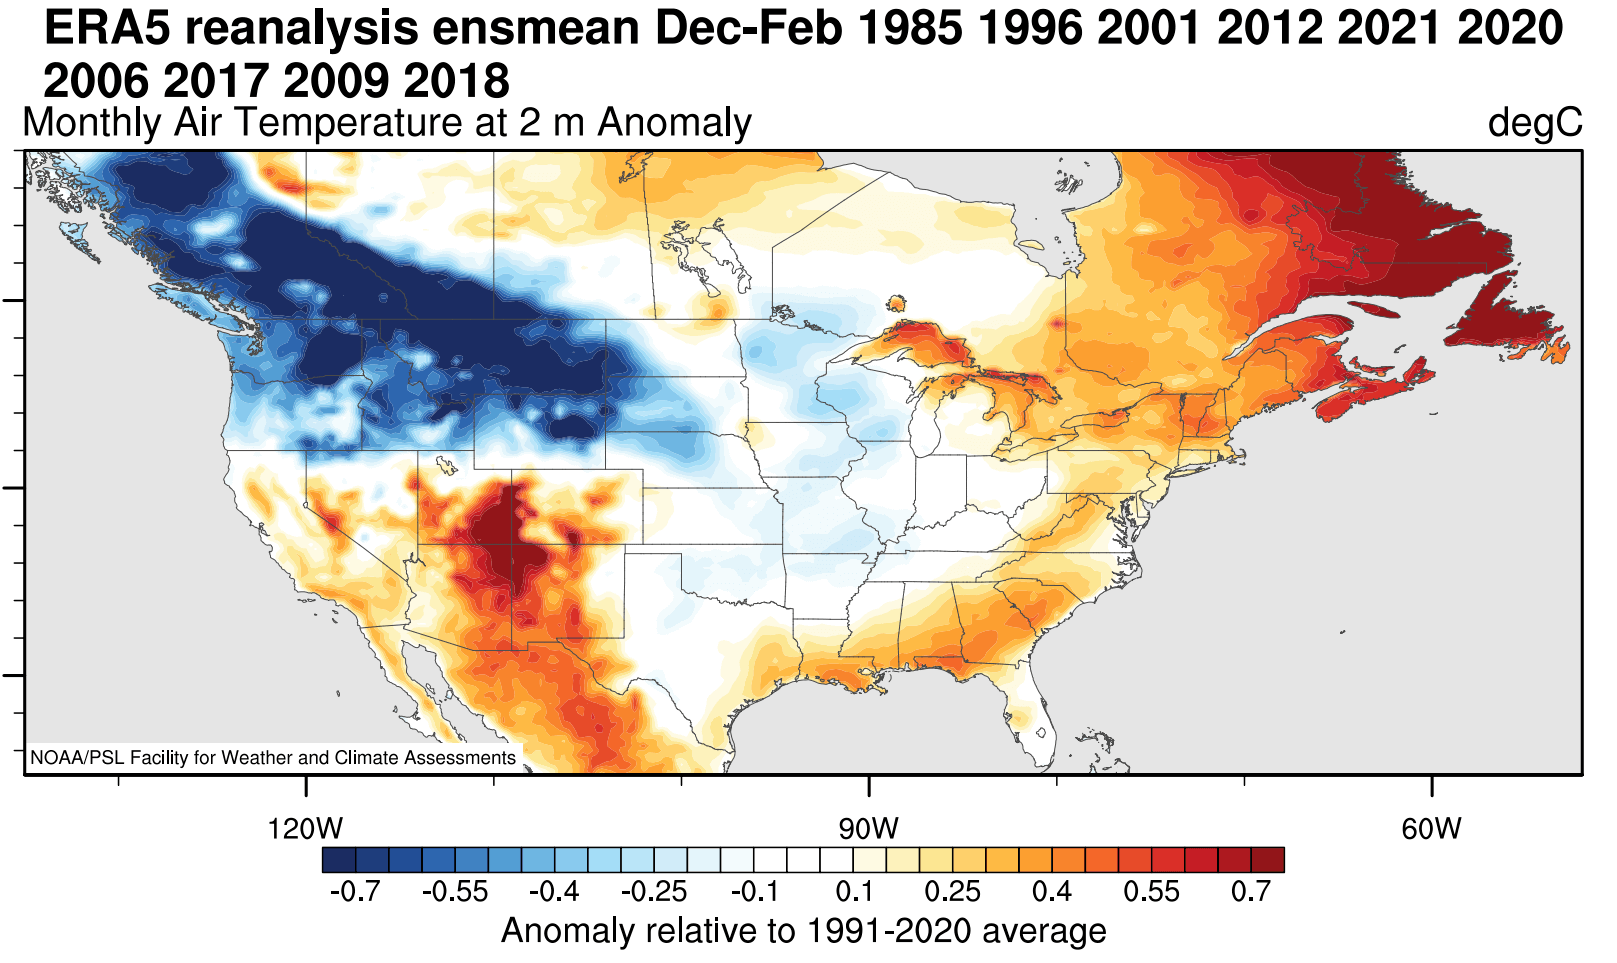
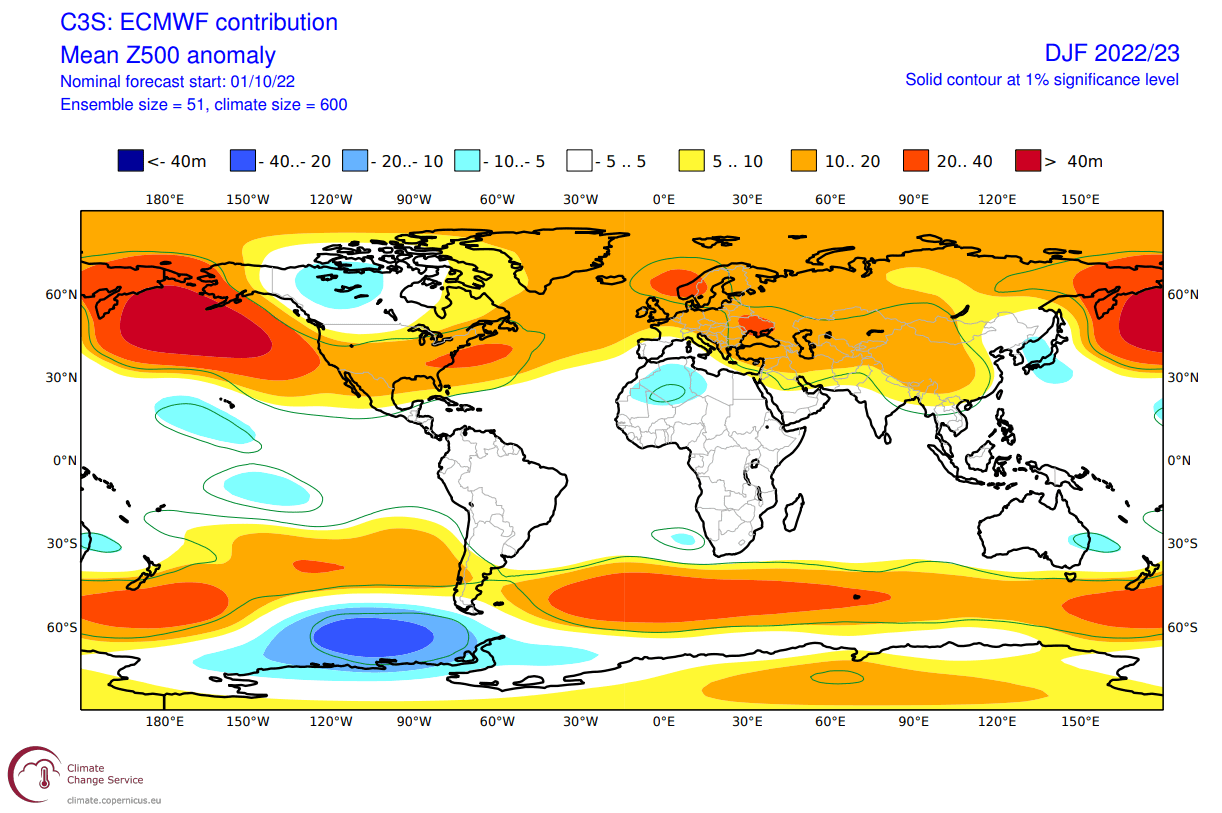
The image below shows the average pattern during the last few La Nina winters. We can see a strong high-pressure system in the North Pacific and a low-pressure area over Canada and southwestern Europe.
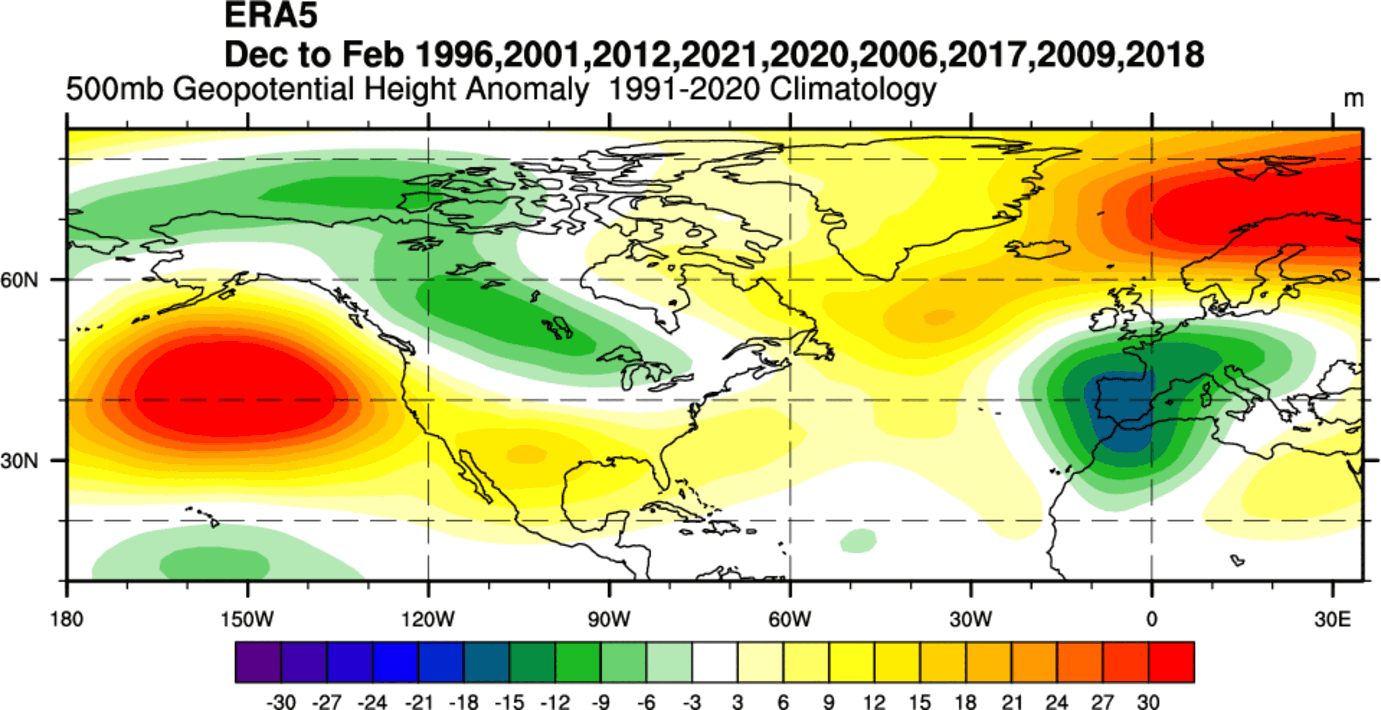
The circulation of the strong high-pressure system promotes the development of a low-pressure region over Canada. That curves the jet stream downwards in between the two pressure systems, bringing colder air into the northern United States.
Looking at the temperature analysis for the same winters, we can see a cold anomaly under the jet stream in western Canada and the northern United States. Warmer than normal winter is prevalent in the southwestern and southeastern United States and eastern Canada.
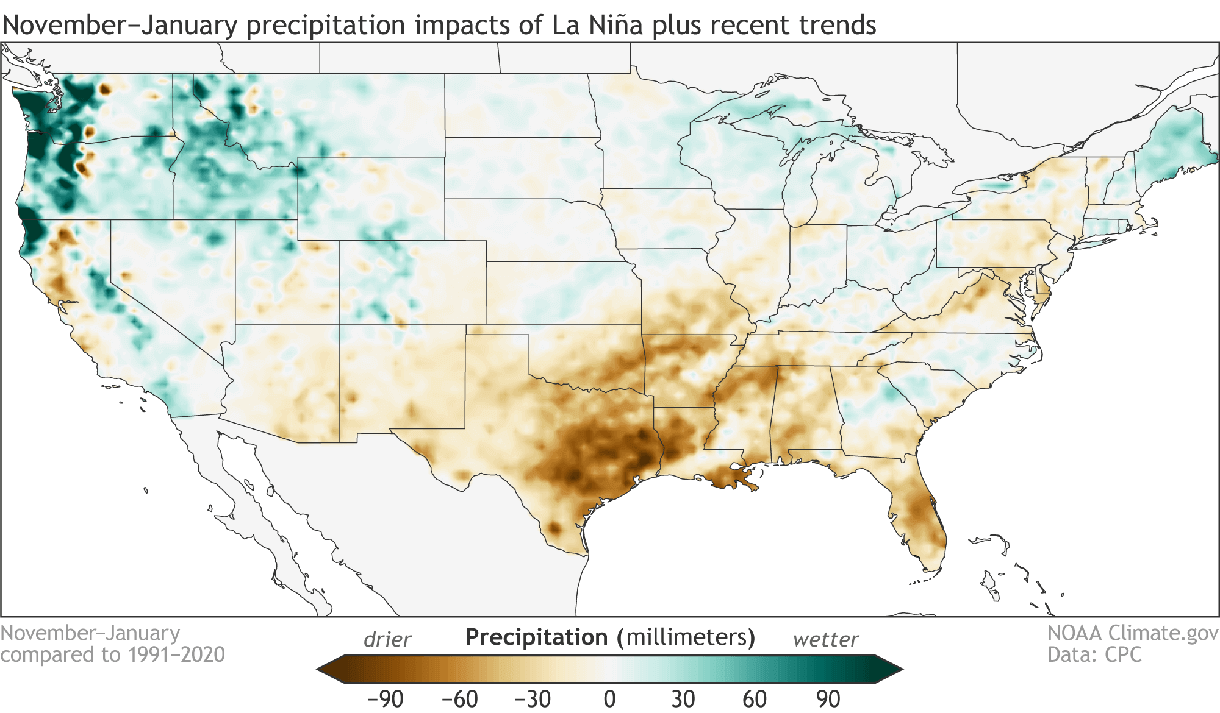
Precipitation-wise, La Nina winters are usually drier over the southern United States. Drier conditions also develop in the southeastern United States as La Nina produces a weaker subtropical jet stream and less moisture for the east. More precipitation is typical over the northwestern United States, the Great Lakes, and parts of the northeast.
You can see that jet stream re-position in the image below. The image shows the average position of the jet stream during La Nina winters and the resulting weather patterns over the United States and Canada.

The shifting jet stream brings colder temperatures and storms from the polar regions down into the northern and northwestern United States and warmer and drier weather to the southern parts.
In the northern part of the country, colder and wetter events are more frequent, as the jet stream directs the storm systems that way. But that can somewhat lockout the southern United States, creating warmer and more stable weather with less frequent storms and cold fronts.
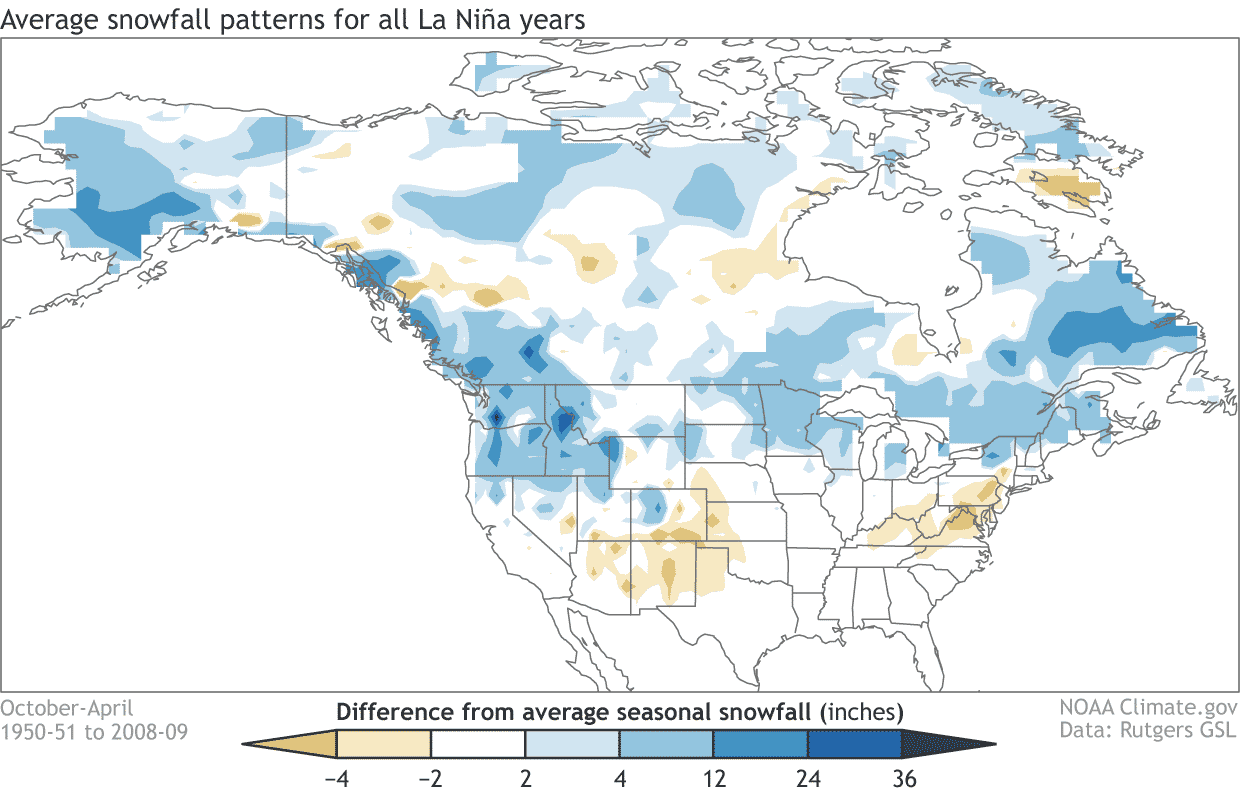
As the colder air is more easily accessible to the northern United States, it also increases the snowfall potential. Especially areas like Alaska, Canada, and the northern/northwestern United States benefit from more snowfall in a cold ENSO phase. The graphic below is provided by NOAA-Climate.
WINTER SEASON 2022/2023 – OCTOBER FORECAST UPDATE
You now know what the background La Nina influence will be this upcoming Winter and how it impacts the jet stream and weather. We will now also look at the actual model forecast, freshly updated this month, and their hints for Winter 2022/2023.
In this update, we focused on three seasonal models. The ECMWF from Europe, the CFSv2 from the United States, and the Canadian CanSIPS model. Graphics are from the Copernicus Climate project, the CPC/NCEP, and tropical tidbits.
All these forecasts are an average picture over three meteorological winter months (December-January-February) and show the general prevailing weather patterns.
Even if the models were 100% accurate, it does not mean that such weather conditions would last for three months straight. It only suggests how the weather patterns might look most of the time.
ECMWF WINTER SEASON FORECAST UPDATE
The ECMWF model is often considered one of the most reliable forecasting systems. But as we are only looking at trends and weather patterns on a large scale over a more extended period, it’s hard to quantify real reliability.
The updated winter pressure pattern forecast from ECMWF below further consolidates the La Nina high-pressure system in the North Pacific, extending to the western United States. A low-pressure anomaly is forecast over western Canada as expected, bringing the jet stream into the northern United States.
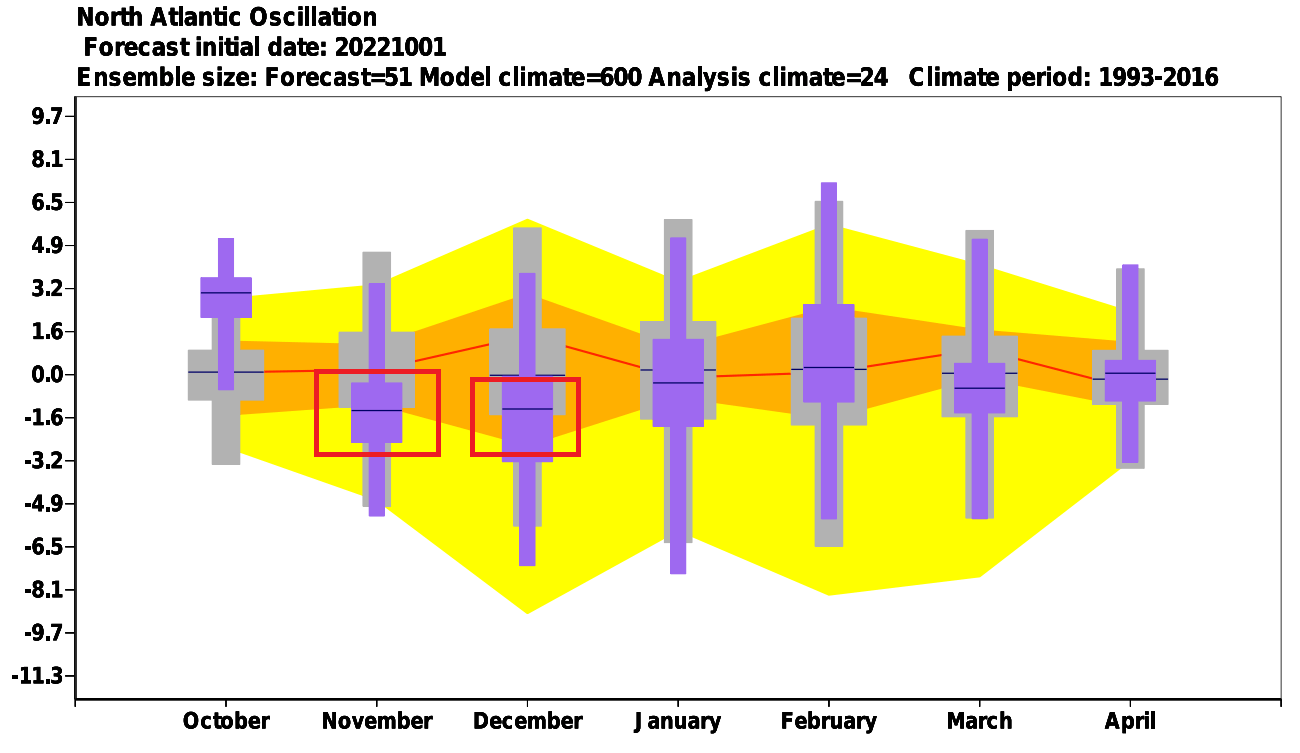
We also see the North Atlantic in a weak negative North Atlantic Oscillation (NAO) mode. Also, a low-pressure area over southwestern Europe and the Azores, opening several different pattern variations throughout Winter.
The monthly NAO forecast from ECMWF below hints at negative trends in early Winter. That would increase the chances of cold events in the eastern United States and parts of Europe. A negative NAO means higher pressure over Greenland and Iceland, disrupting the normal westerly zonal jet stream pattern.
The global airmass temperature forecast shows an expected pattern. Western Canada and parts of the northern United States are seen with colder to average temperatures. Warmer anomalies are forecast over the western and southern United States.

Europe shows weaker warm anomalies over the west, with the influence of the nearby low-pressure area. Warmer anomalies are forecast over parts of central Europe, rising towards the northeast.
Looking at the surface temperature probability forecast over Europe, we see an interesting pattern. Most of the central and western continent is in the average temperature range. However, a higher probability of warmer than average temperatures is over the southern and northern regions.

Over Noth America, the updated ECMWF forecast shows average to colder surface temperatures over most of western Canada, extending into parts of the northern United States. Warmer than normal temperatures are forecast over the southern United States, with a weaker anomaly going toward the northeast.

A negative NAO usually means a more northerly flow over the Midwest and the eastern United States. We have seen this development in the past in La Nina winters.
In this forecast, we do see a hint of weaker probabilities for warmer anomalies in the northern United States. But it is not yet clear how much of it is due to the negative NAO signal. That will be more clear in future updates.
Looking at the precipitation forecast, we can see Europe having a mostly average precipitation signal, with some drier areas in the west-central parts. More precipitation is forecast over the Mediterranean and far northern Europe.

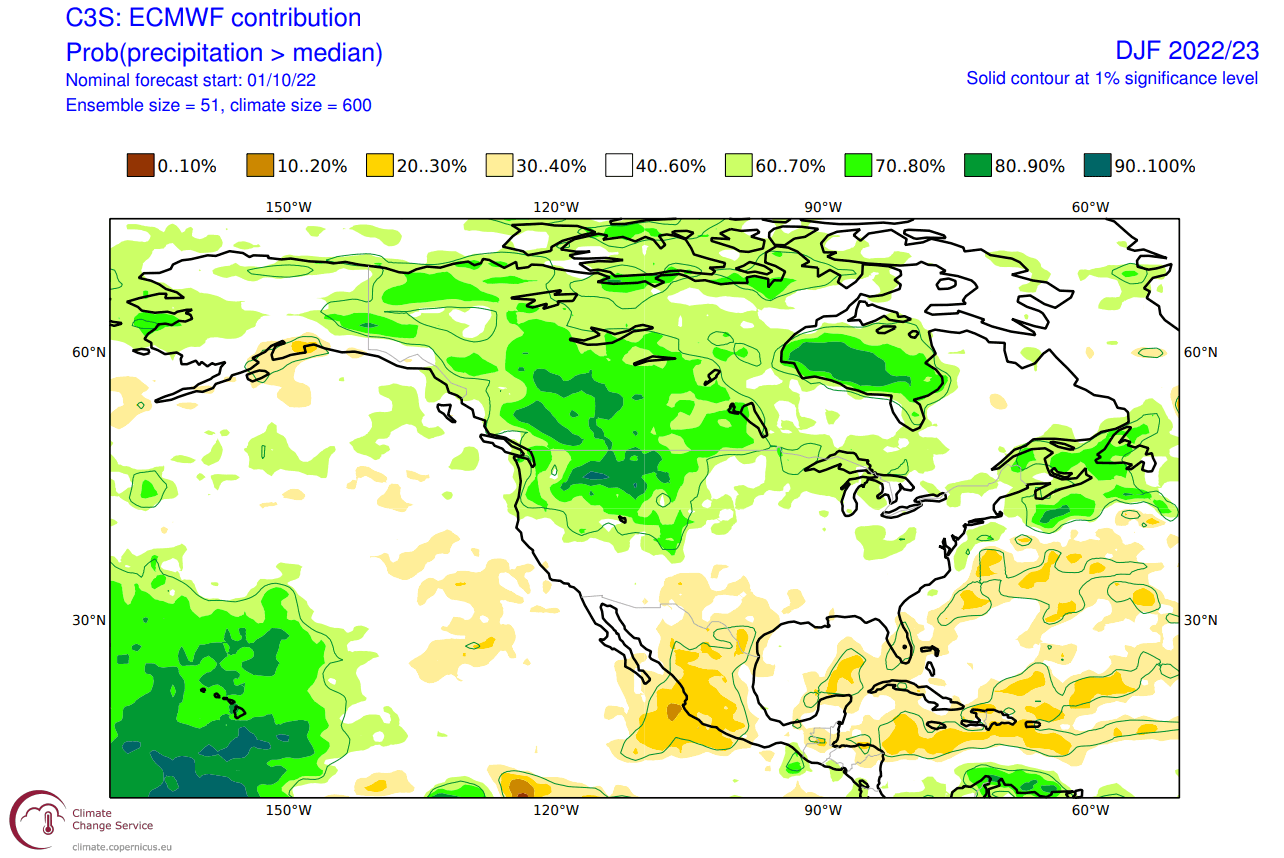
The precipitation anomaly forecast for North America shows a more typical La Nina-type pattern over Canada and the United States. More precipitation is forecast over Canada and the northwestern and northeastern United States. Drier conditions remain over the south-central United States, as usually seen in a La Nina pattern.
ECMWF WINTER 2022/2023 SNOWFALL FORECAST UPDATE
As always, we produced a special snowfall forecast from the ECMWF data provided by the Copernicus-EU project. Over Europe, we see below-average snowfall, which is surprising given the lack of strong warm anomalies and normal precipitation. An increased snowfall potential is forecast over small parts of central Europe.
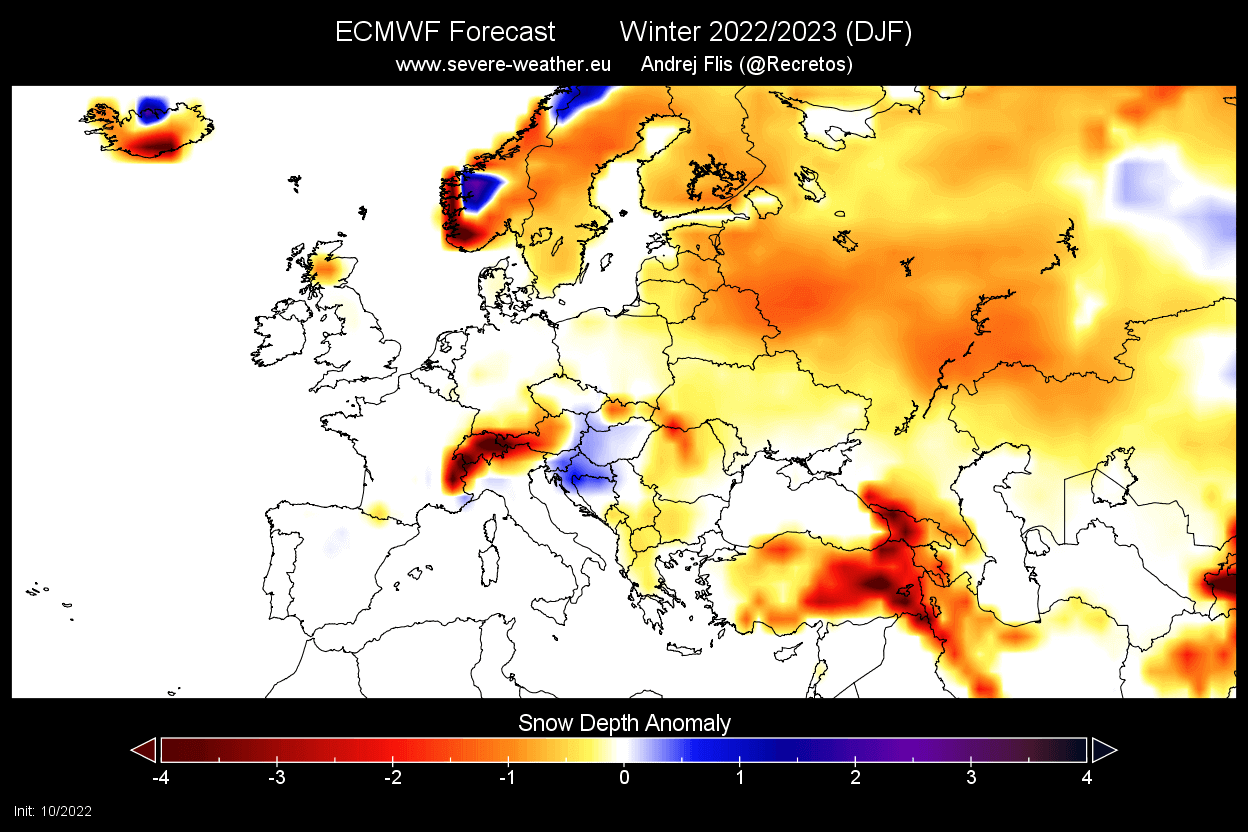
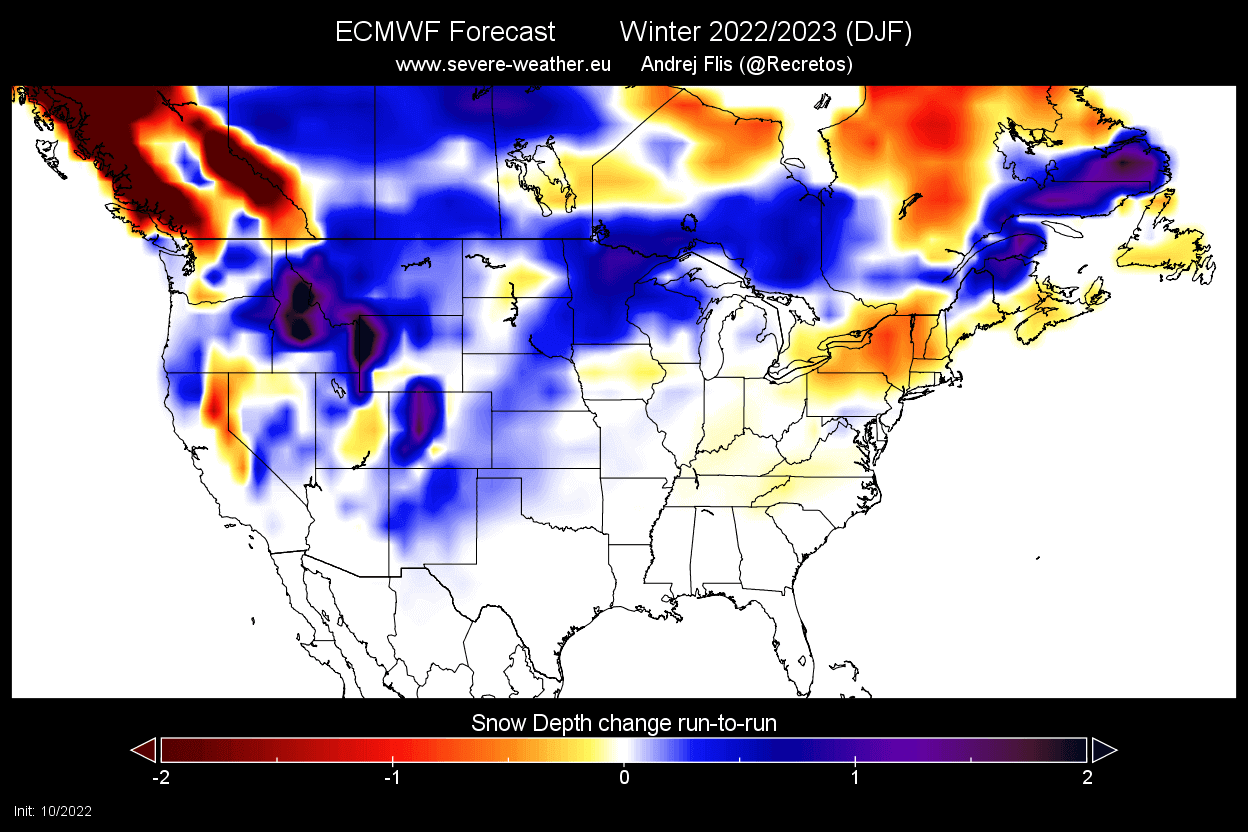
The next image below shows the change in the snow depth forecast between the latest model data and the previous model run. We can see that the latest ECMWF forecast shows more snowfall in central and western Europe compared to last month’s forecast.

Over North America, most of the country has below-average snow accumulation, except for the northwest and upper Midwest. Keep in mind that less snowfall than average does not equal no snowfall. So there can still be snowfall despite the forecast showing less snowfall than normal.
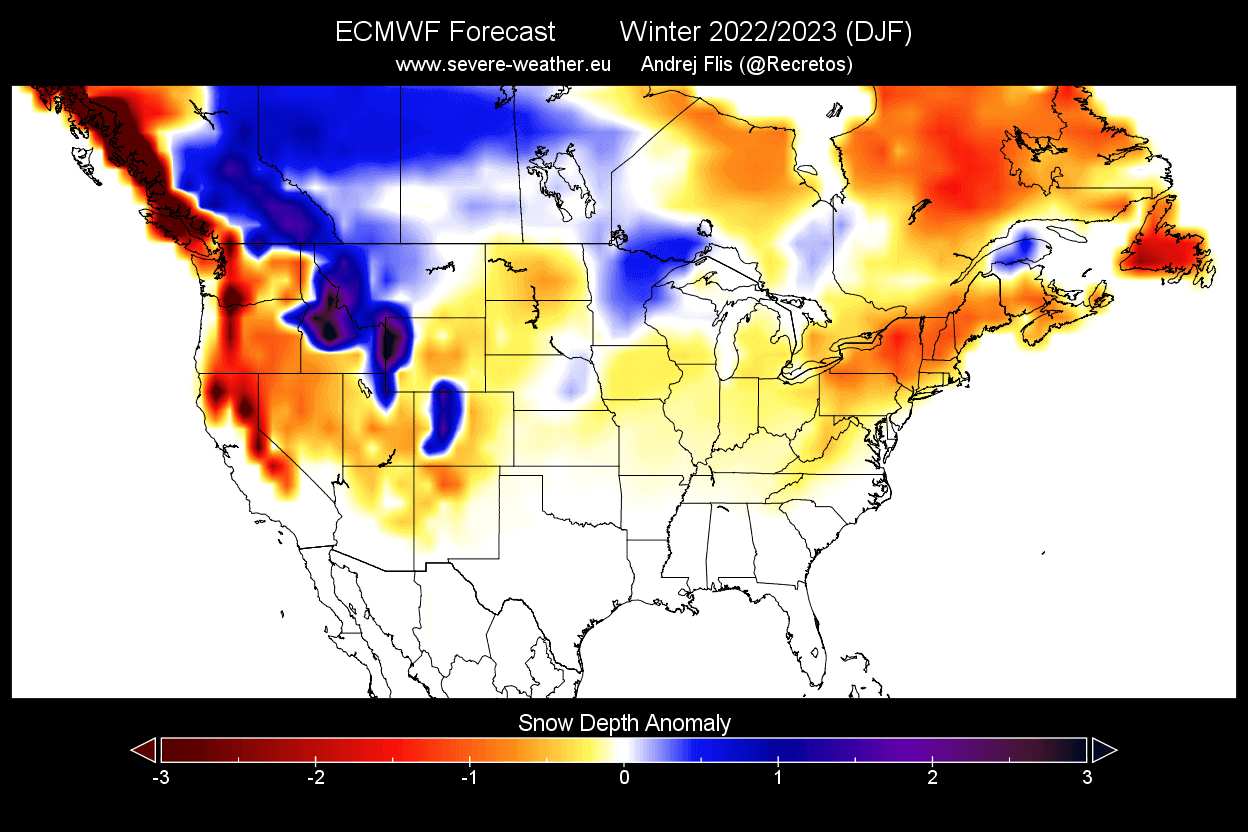
But, comparing the latest forecast to the previous one, we can see that more snowfall is being forecast across much of the western and northern United States compared to the previous forecast. Again, this is a reflection of the pressure changes in the latest model forecast.
We will release a unique forecast article dedicated to snowfall predictions. There, we will take a more in-depth look at snowfall potential, including more models and a month-by-month breakdown.
CANSIPS WINTER SEASON FORECAST UPDATE
Our second model for this update is the CanSIPS from the Canadian met-office. The name stands for Canadian Seasonal and Interannual Prediction System (CanSIPS). It consists of two coupled atmosphere-ocean-land physical climate models.
This model shows a standard La Nina pattern, which we have already seen in the historical analysis. A high-pressure zone is present over the North Pacific with a low-pressure response over North America. Another high-pressure area can be found over Europe.
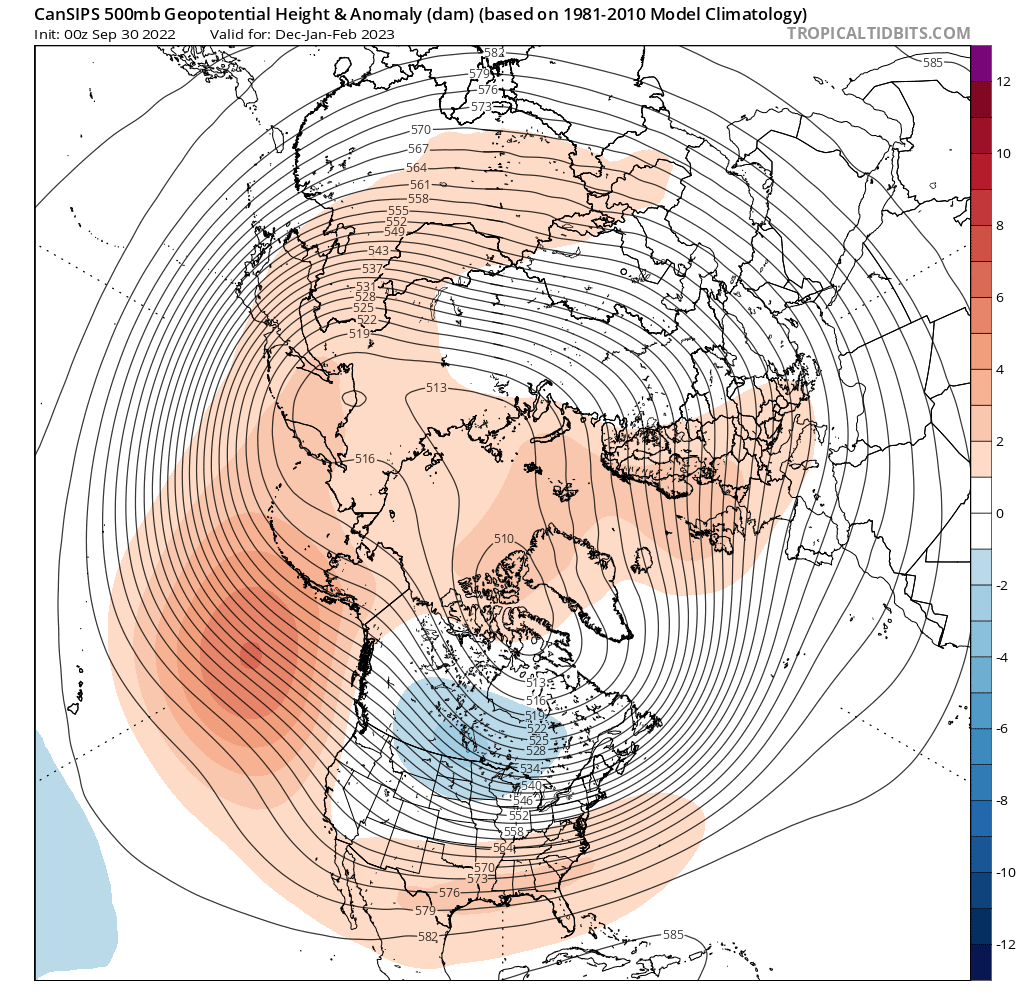
This is a “jet stream bending” pattern over North America, sending the polar jet stream down across the northern United States.
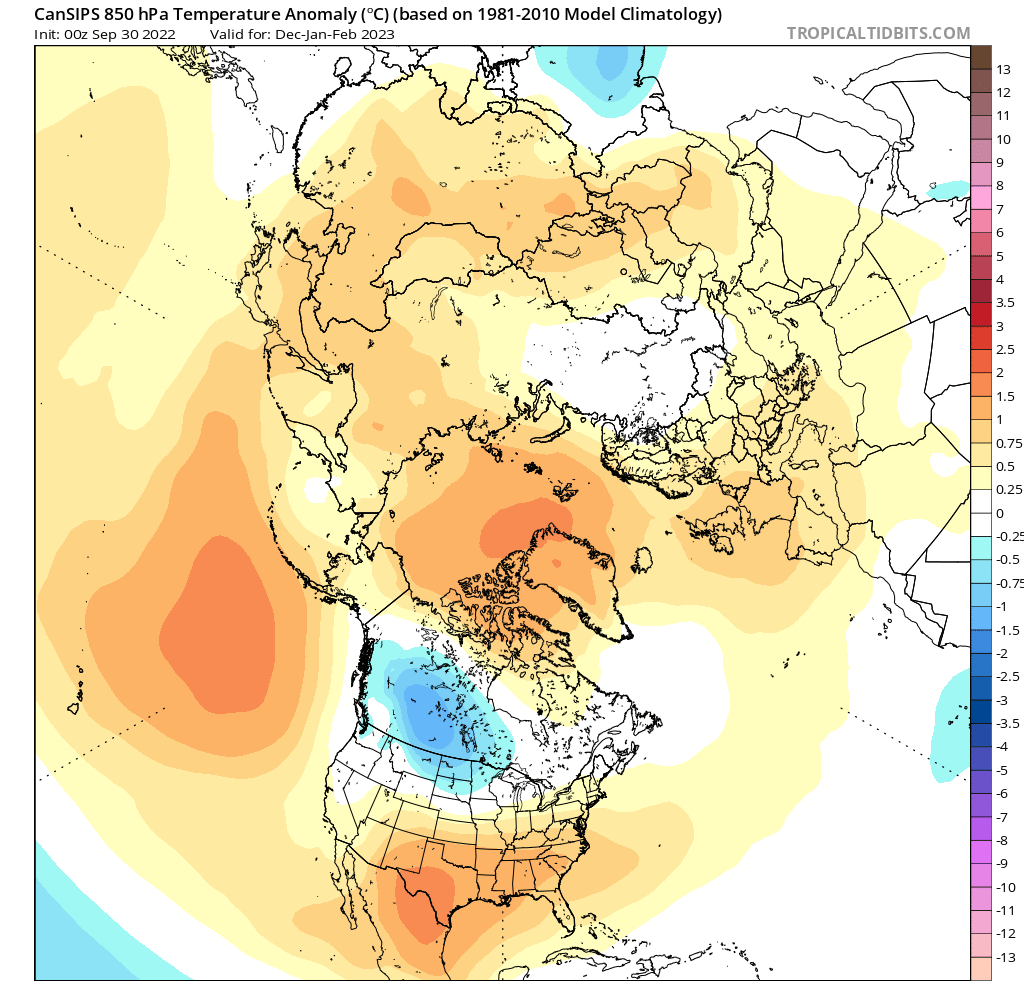
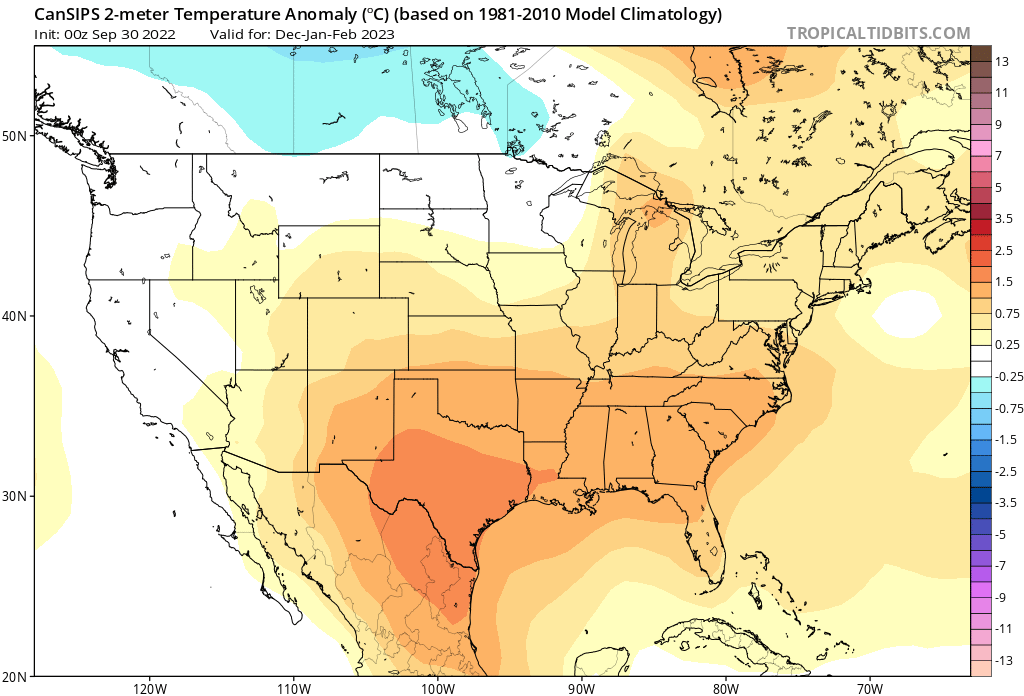
The airmass temperature forecast also looks like a typical La Nina winter. Over North America, we have the cold pool over western Canada, reaching down into the northern United States. The southern half of the United States is forecast to be warmer than normal.
Europe features mostly warmer than normal conditions over the continent, with stronger warm anomalies over the northwest.
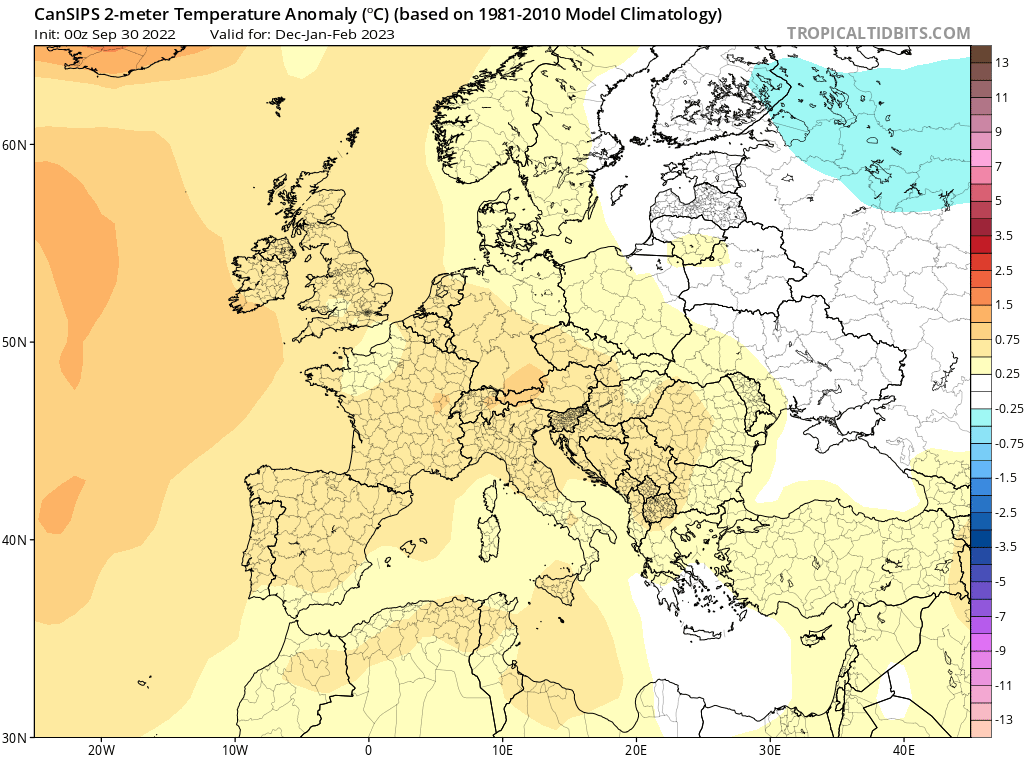
Looking closer at surface temperatures over Europe, we see the warm anomalies focused over the entire central and western parts of the continent.
Over North America, we see cold up north in western Canada. Colder than normal winter is hinted in the forecast over the northwestern United States. An extension of frequent cold air intrusions is extended towards the upper Midwest. But most of the southern and eastern United States is forecast warmer than normal by the Canadian model.
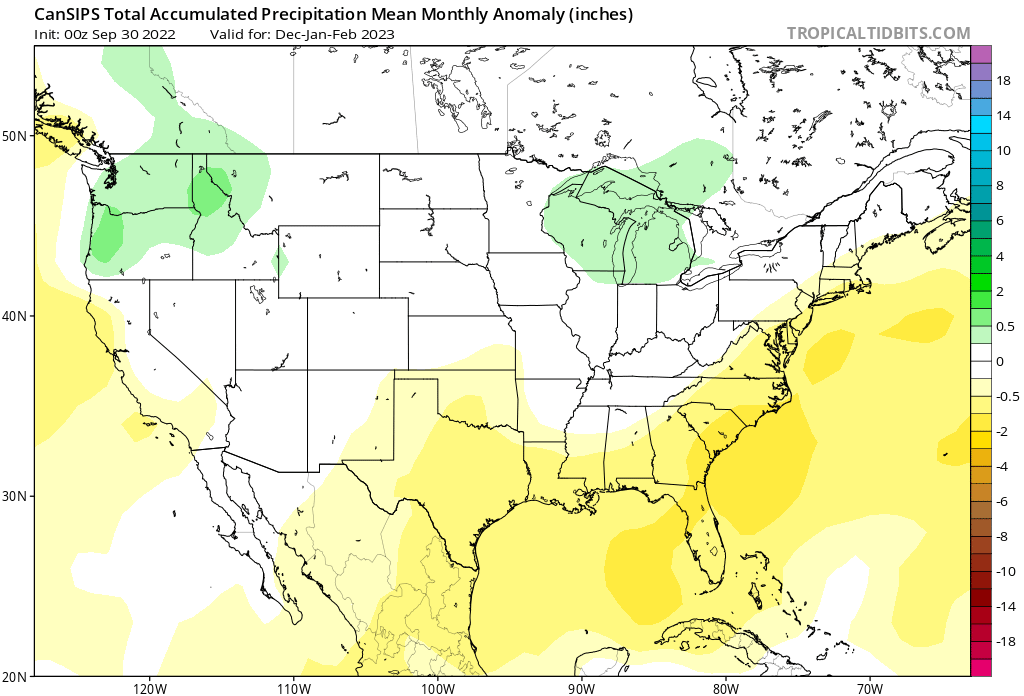
Going to precipitation, the Canadian model shows mostly less precipitation over western and southern Europe. More winter precipitation is forecast only over the southwest.

More winter precipitation is also forecast over the northwestern United States and around the Great Lakes area. As expected for a La Nina winter, the southern and southeastern United States is forecast to be mostly drier than normal.
CFSv2 WINTER SEASON FORECAST UPDATE
CFSv2 is the long-range/seasonal forecasting system from the United States NOAA/CPC. We use it in contrast to the ECMWF, as it is the most widely used seasonal forecasting system in the United States.
Looking at the latest data, the CFS is close to the ECMWF with the strong La Nina high-pressure zone in the North Pacific and a low-pressure response over Canada. However, the Atlantic/Greenland pattern is different, as the CFS extends the low-pressure zone into the North Atlantic and over Greenland.

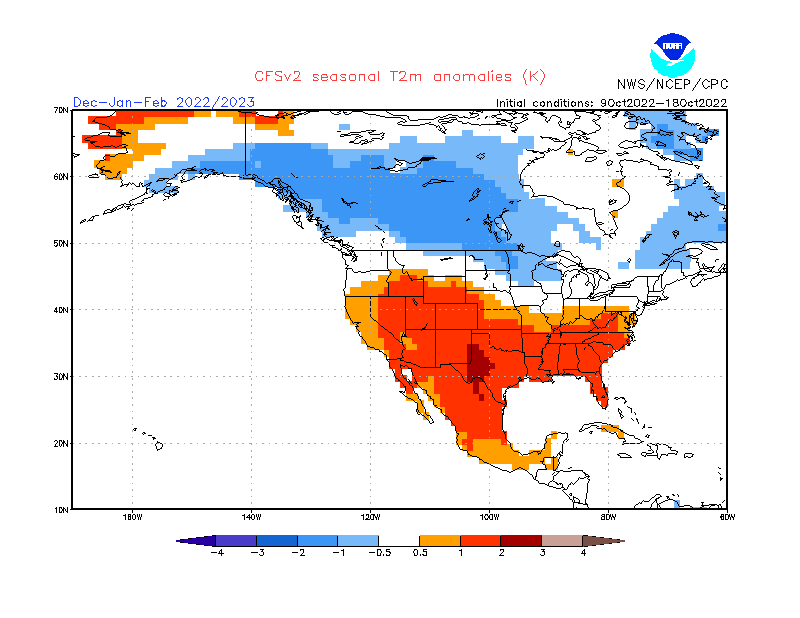
Airmass temperatures are most interesting over North America, with a strong cold pool developing over Canada and warmer air in the southern and western United States. The jet stream is usually found between the two air masses. Europe is seen as mostly warmer than normal.

The surface temperature forecast shows a really strong dipole pattern over North America. Much colder than normal temperatures are forecast over most of western and central Canada, expanding into the northern and northeastern United States. The CFS forecasts warmer than normal Winter over the southern half of the United States.
The precipitation anomaly forecast for North America shows the main weather dynamics (with increased precipitation) over the northwestern and eastern parts of the United States. Drier than normal conditions are forecast for the south-central United States, with the updated forecast showing much less precipitation over the far southeast.

We must remember that the strongest weather dynamics usually unfold between the cold and warm anomalies, including snowfall. CFS has no snow forecast graphic, but this temperature and precipitation pattern would suggest more snowfall over the northwestern United States, the upper Midwest, and parts of the far northeastern United States.
WINTER 2022/2023 UPDATE FORECAST SUMMARY
Reading images and descriptions can be somewhat confusing. So to simplify everything, here is what the October update forecast shows for the Winter season 2022/2023:
Europe is expected to have near-average temperatures over most of the west-central parts of the continent. Above-normal temperatures are indicated over the northern and southern parts.
This suggests that there can be periods with more cold fronts and colder days over parts of western and central Europe. The neutral to negative NAO forecast from ECMWF in early Winter supports this idea.
Such a pattern can permit an easier breakdown of the pattern and a northerly flow into central Europe later in the year and early next year.
The models are not in 100% agreement over the pattern in the North Atlantic. The main key is the positioning and strength of the pressure systems over Iceland/Greenland relative to the North American pattern.
Precipitation-wise, mostly average-to-drier conditions are forecast over central and western Europe. More precipitation is shown over the southern parts of the continent. The snowfall forecast shows less snowfall over Europe, with some central parts forecast with more snowfall than average.
North America winter forecast looks to be a classical La Nina-type winter. As a result, western and central Canada can expect colder and snowier conditions, along with Alaska.
The United States can expect to see a strong north-south pattern development. The Northern United States is expected to be normal to colder this Winter with more precipitation. Colder anomalies are forecast to develop from the northwestern United States into the Midwest. Intermittently, colder anomalies can spread into the far northeastern United States.
The Southern United States has a high chance for warmer and mostly drier than normal winter weather. This, however, does not mean that no cold front can reach the southern states. Instead, it shows that in a La Nina pattern, it is much less likely to get frequent cold fronts down to the deep south due to the different jet stream positioning.
Below is NOAA’s official Winter 2022/2023 temperature forecast for the United States. It shows the temperature probability, with an increased cold chance in the northern United States. As seen in the models above, the southwestern part of the country and the east coast have a higher probability of warmer than normal winter weather.

But take note of the trough of “equal” temperatures probability extending down low into the southern Plains. That can be interpreted as a potential route of winter cold air outbreaks down from the Midwest.
The official NOAA Temperature outlook points:
- The greatest chance for warmer-than-average conditions is in the Central Great Basin and Southwest extending through the Southern Plains.
- Warmer-than-average temperatures are also favored in the Southeastern U.S. and along the Atlantic coast.
- Below-normal temperatures are favored from the Pacific Northwest eastward to the western Great Lakes and the Alaska Panhandle.
The official precipitation forecast is also quite similar to the latest model forecasts. We see an equal-to-higher probability for more precipitation (and snowfall) over the northern half of the United States. The southern United States is forecast to have a drier-than-normal winter season.

NOAA Official precipitation outlook points:
- Wetter-than-average conditions are most likely in the Pacific Northwest, the northern Rockies, Great Lakes, and Ohio Valley.
- The greatest chances for drier-than-average conditions are forecast in portions of California, the Southwest, the southern Rockies, the southern Plains, the Gulf Coast, and much of the Southeast.
In a La Nina winter, there is usually a problem with the persistence of drought conditions in the south and southwest. Below is the latest drought graphic from NOAA, which shows the current drought conditions in the United States through mid-October.

Strong drought conditions prevail over the south-central and western United States. We can see a gap in the southwest, especially in Arizona. That is thanks to the summer monsoon bringing a decent amount of precipitation.
But the drought conditions in the south are expected to continue and can worsen in a La Nina Winter. The same goes for western parts of the United States, especially California.
There is no certainty in the winter forecast at this long lead time. But there is also one very important factor that can change the course of Winter at any time. That is the Stratospheric Polar Vortex.
STRATOSPHERIC POLAR VORTEX IN WINTER
Winter weather is also very dependent on the Polar Vortex. The Polar Vortex re-emerges every Fall and plays a key role in daily to weekly weather development in late Fall, Winter, and Spring.
The Polar Vortex is a large area of a cyclonic circulation over the entire Northern Hemisphere, from the ground up to the top of the Stratosphere, reaching over 50km/31miles altitude.
Below is our 3-dimensional model of the Polar Vortex, extending from the lower levels upwards into the Stratosphere. The vertical axis is enhanced for better visual purposes. You can see in the image below what the actual structure of the Polar Vortex looks like in mid-Winter.

In the example above, the Polar Vortex underwent a temporary warming event. These events can disrupt the Polar Vortex, weakening its circulation and changing the weather patterns below.
That is very important for winter weather patterns, as it can change the dynamics and circulation for several weeks ahead. But even a strong Polar Vortex plays a role in the developing weather patterns.
A strong Polar Vortex usually means strong polar circulation. This usually locks the colder air into the Polar regions, resulting in mild seasonal conditions for most of the United States and Europe.
In contrast, a weak Polar Vortex can create a disrupted jet stream pattern. This means that it has a harder time containing the cold Arctic air, which now has an easier way of escaping from the polar regions into the United States or Europe.

A Sudden Stratospheric Warming event (SSW) can significantly impact circulation and cause major pressure changes in the Northern Hemisphere. So we monitor these processes very closely.
One such event occurred in early January 2021. The stratospheric warming wave has crawled over the entire North Pole in the Stratosphere, effectively splitting the cold core of the polar vortex into two parts.
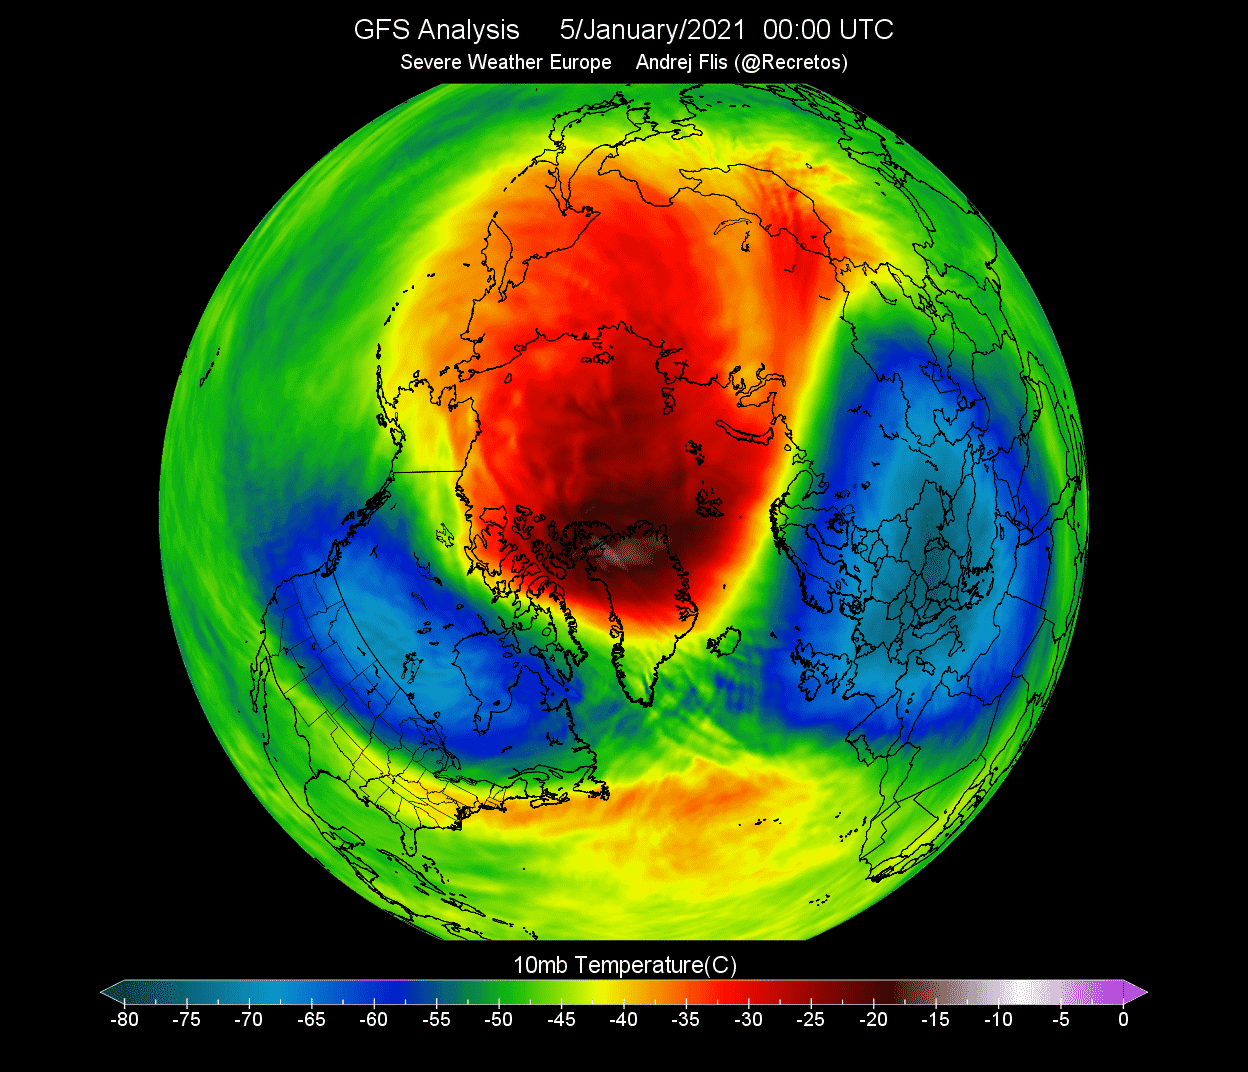
One part of the broken polar vortex has moved over North America, and one remained over the European area. At this point, this did not yet influence the winter weather on the surface. This is because such events begin at over 30km (18 miles) altitude. But the weather influence followed quite soon after.
That is how a stratospheric warming event typically operates. First, it breaks down the upper structure of the Polar Vortex, which then collapses downwards, impacting the weather at the surface.
Below is an image that shows an average temperature pattern 0-30 days after a proper mid-winter stratospheric warming event. High pressure over the Arctic helps to unlock the cold air out of the Arctic regions, sending it down into the mid-latitudes of the United States and Europe.
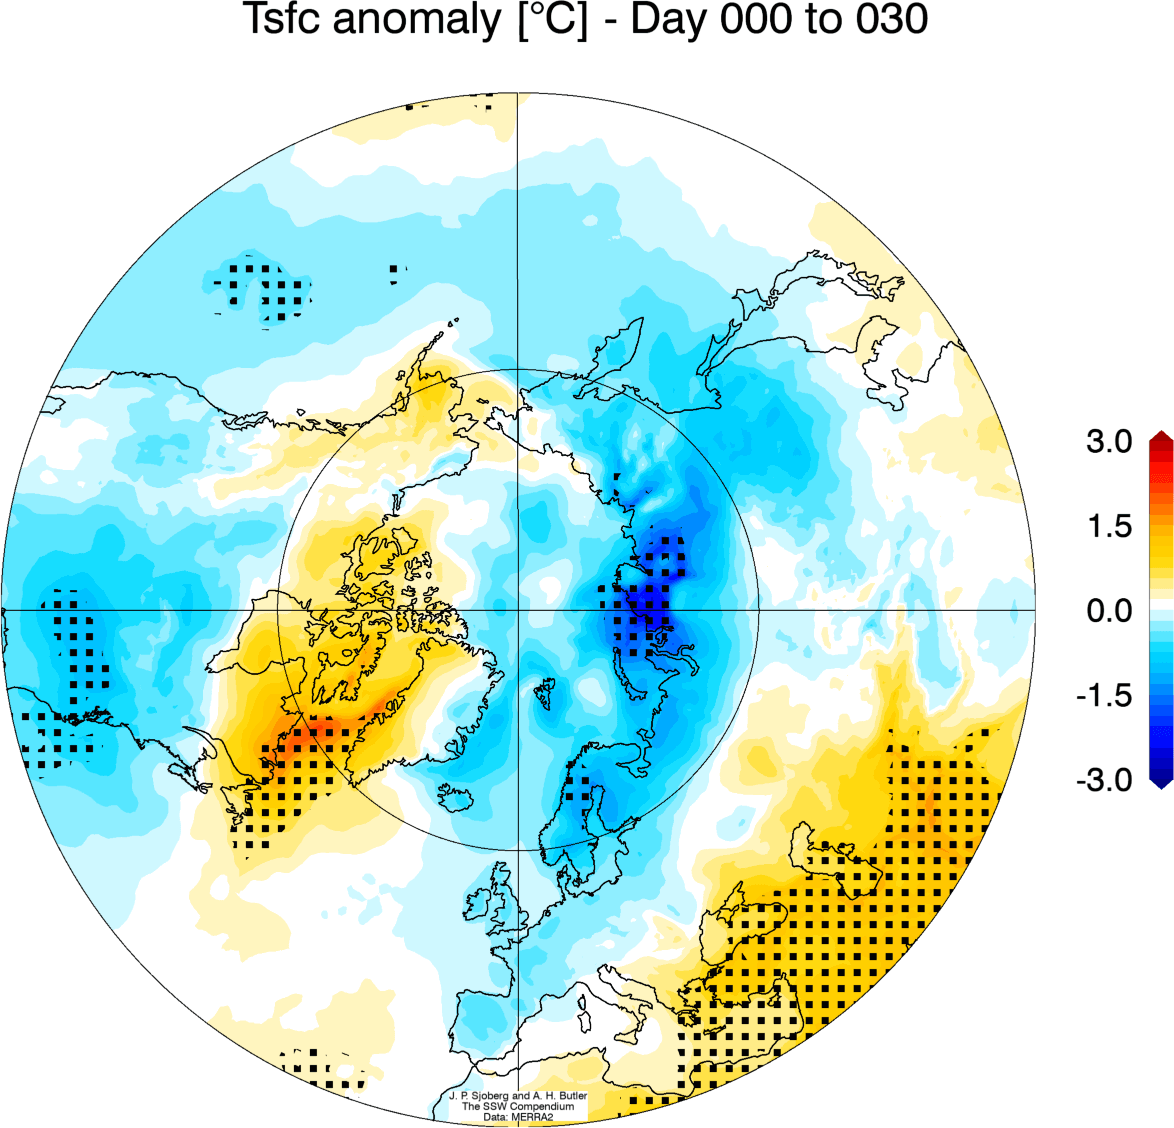
Looking at snowfall, we can see above-average snowfall over much of the eastern United States and Europe after a Polar Vortex collapse event. But, again, this is an average response, as the colder air has an easier path towards the south and into these regions after a stratospheric warming event.

Of course, not every stratospheric warming event produces this pattern, but this is an average image of many events in the past 40 years. A lot depends on the already established weather patterns and the timing of the stratospheric warming event.
There is not much forecast data to look at in the forecast for the Stratosphere. The ECMWF forecast for the 10mb stratospheric zonal winds shows a slight reduction of the stratospheric wind speeds in early Winter.
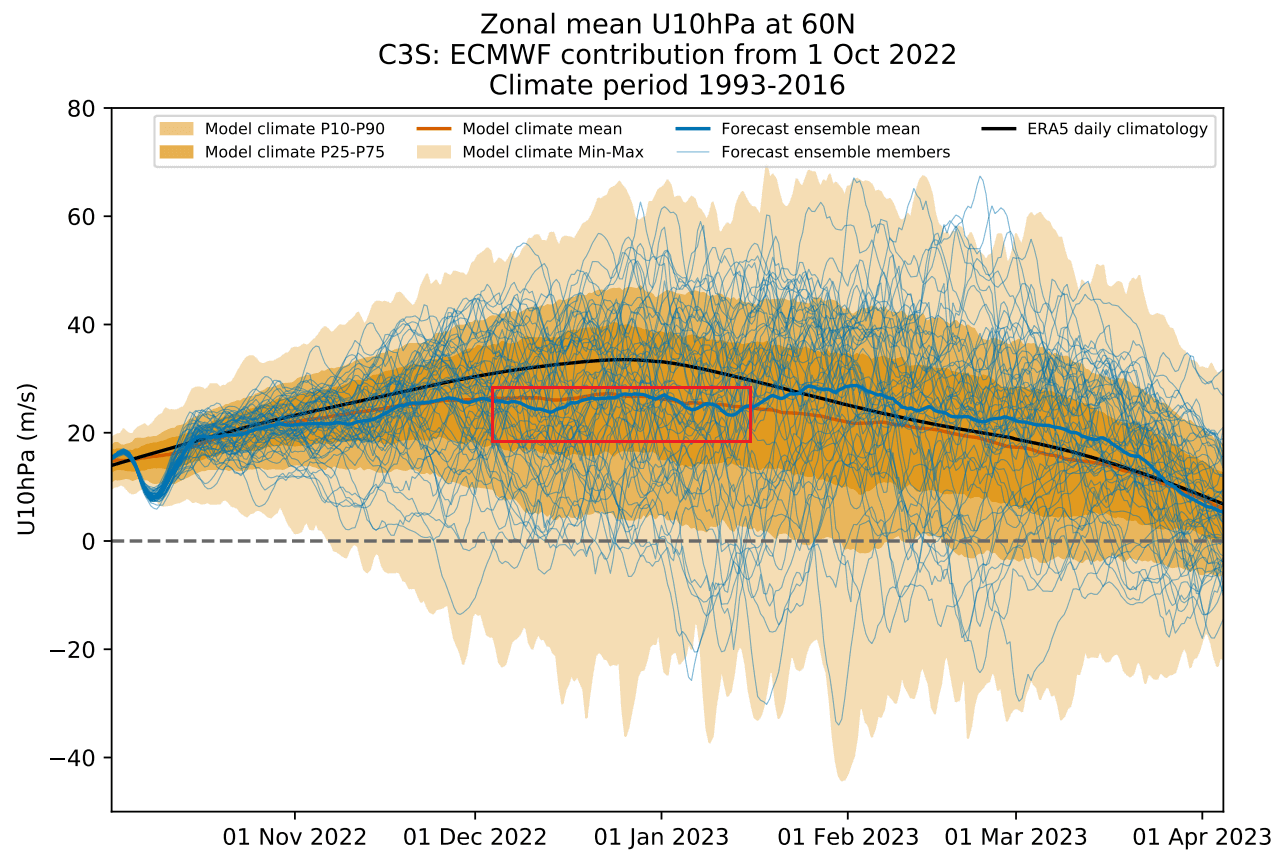
As winds are directly related to the strength of the Polar Vortex, we can see this as a signal for a weakening of the Polar Vortex. This is likely connected to the suggested negative NAO pattern in early Winter, so some forcing is expected onto the Polar Vortex.
It gives us a signal to keep an eye on, as these dynamics can have a large-scale and long-lasting impact on the weather pattern during Winter.
We will keep you updated on the developing weather trends in the coming seasons, so make sure to bookmark our page. Also, if you have seen this article in the Google App (Discover) feed, click the like button (♥) there to see more of our forecasts and our latest articles on weather and nature in general.
Don’t miss:
Polar Vortex and Winter Weather are affected by October Snow depth, new data shows