The world still fights against the novel Coronavirus outbreak. Eventually, this hazard will be overcome with cooperation and science. Weather can also be a hazard, claiming (too)many lives each year. We will take a look at the global ocean analysis, and what it tells us for the upcoming seasons and their weather.
The oceans cover 71% of the Earth’s surface and contain 97% of the Earth’s water. They play a crucial role in global atmospheric circulation and climate. We decided to take a look at the current state of the ocean, and what it might reveal for the seasons to come.
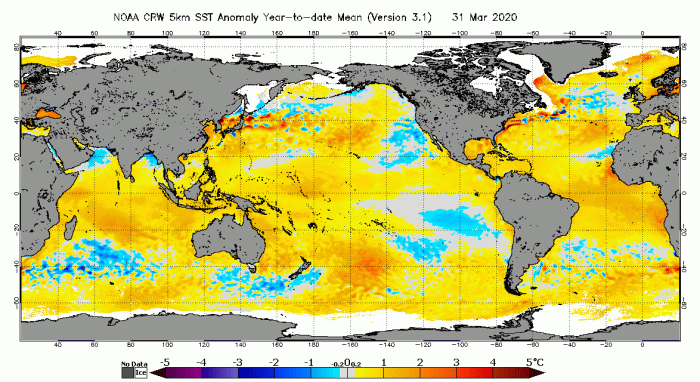
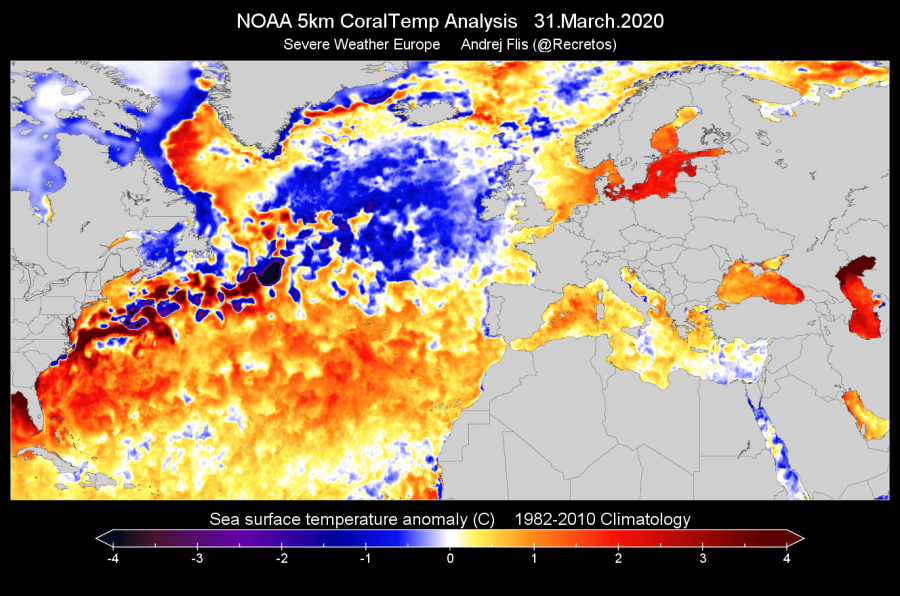
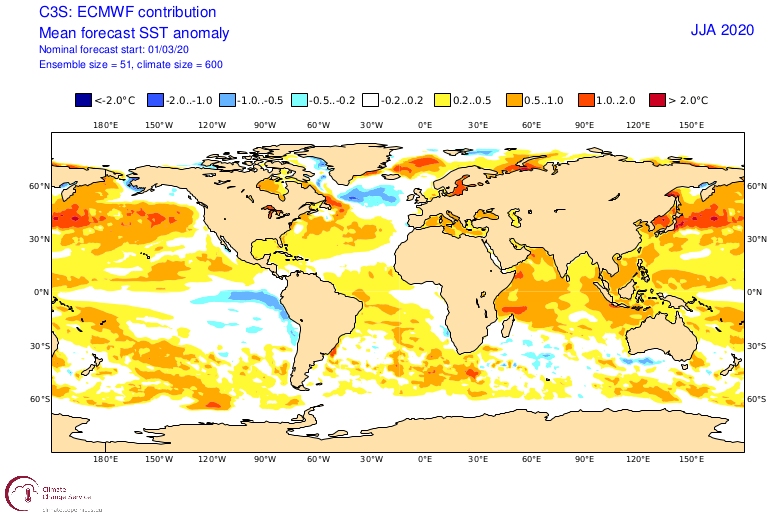
First we have the global analysis, which shows the sea surface temperature anomaly, revealing where the waters are warmer/colder than the long term average (1982-2010). There are many anomalies present around the world. There are three that stand out to us, for various reasons: the North Atlantic, Gulf of Mexico and the tropical Pacific region (ENSO). Each of these areas plays its role in the overall weather development, be it for the next 7 days, or the next 7 months.
The ocean temperature anomaly for 2020 so far, reveals similar characteristics, but some of the development is more recent, which gets hidden in the 3-month average.
North Atlantic
Looking closer at the North Atlantic, we see a large area of colder than normal temperatures in the subpolar regions. This is mainly due to the intense cyclonic activity in this region and the resulting strong positive NAO during the entire winter season. The second graphic shows the sea-level pressure anomaly during the 2019/2020 winter. It reveals much lower than normal pressure over the subpolar North Atlantic and Scandinavia, and higher pressure over central North Atlantic regions. Constant strong cyclonic activity and cold fronts, tend to mix the ocean surface with deeper cooler waters, and also removing some of the heat from upper ocean layers, further cooling the ocean surface. A more long-term cause is also the weakening of the North Atlantic ocean circulation (AMOC), which also tends to cool the subpolar North Atlantic. But more on that in another article.
Why is this important? There is a known connection between colder subpolar North Atlantic ocean temperatures and heatwaves in Europe. Studies suggest that “Cold North Atlantic ocean anomaly, and the resulting strong meridional SST gradient could have initiated a propagating Rossby wave train causing a stationary Jet Stream position that favoured the development of high pressure and temperature extremes over Central Europe during the heatwave”. To simplify, the ocean anomalies in the North Atlantic can have an influence on the developing pressure patterns in summer, affecting the position of the jet stream, allowing higher pressure to build over Europe, causing strong heat waves. Partially we also have to consider that the positive NAO pattern holds or transfers into summer, allowing for higher pressure to build over central Europe.
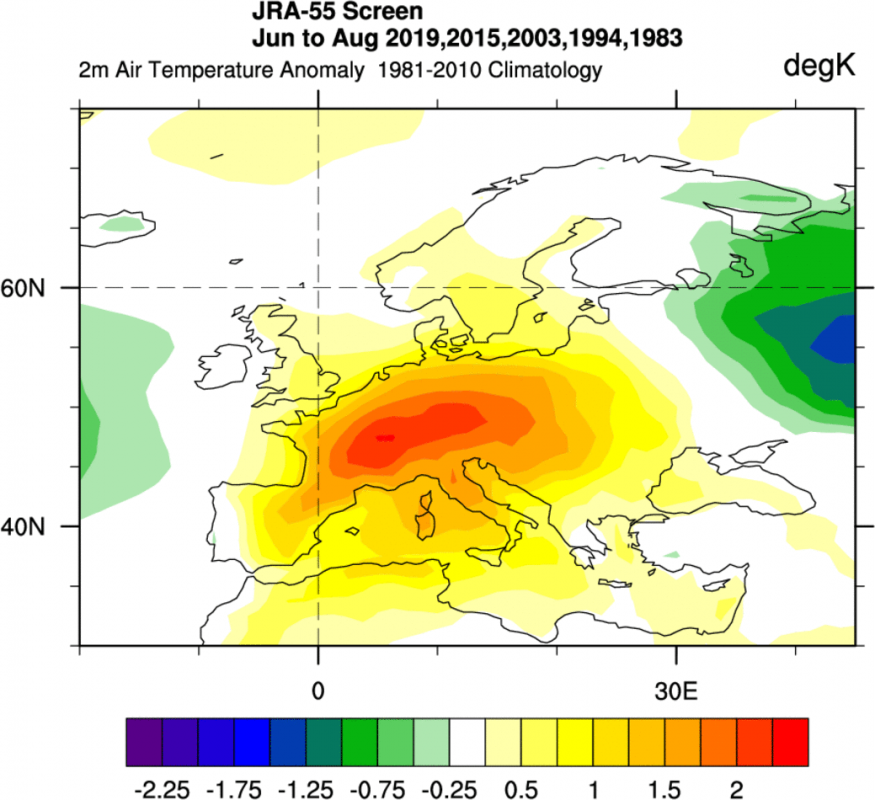
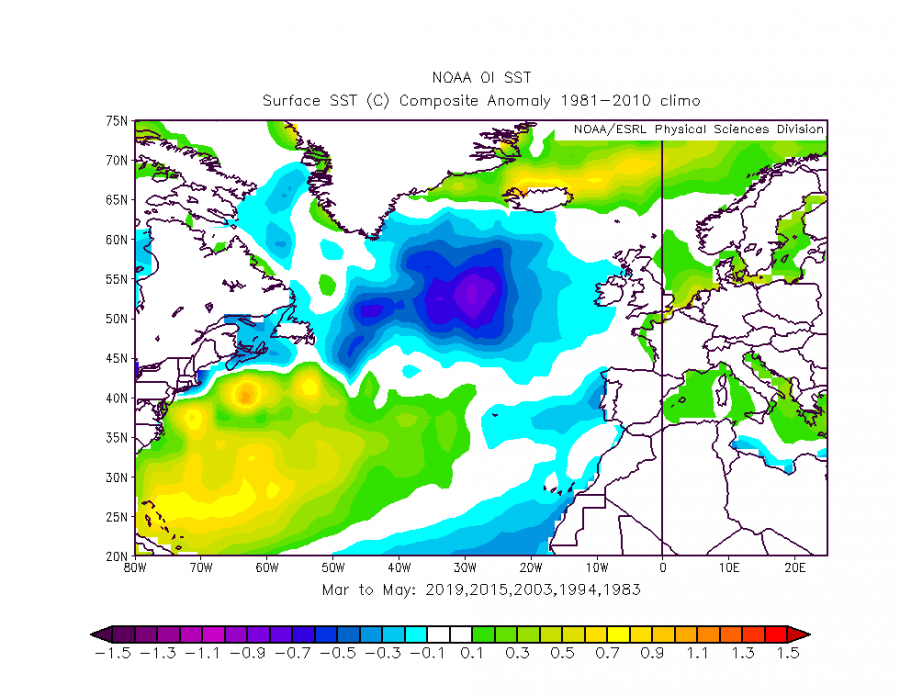
Below we have two graphics. The first one shows temperature anomalies in summer, during the years with strong heat waves. We have 2019, 2015, 2003, 1994 and 1983. All these years featured strong heat waves during summer over parts of central Europe. The second graphic shows the ocean temperature anomalies in spring, prior to these years. We can see a very similar picture to this year, with the cold subpolar North Atlantic, and warmer central North Atlantic regions.
Looking at the seasonal forecasts for summer, we can actually see a very similar pattern in the ocean temperatures, and in the surface temperatures. We have colder North Atlantic, but much warmer than usual European regions. This model forecast does seem to indicate a very warm/hot summer for Europe, partially as a non-direct result from the oceanic impacts on the developing weather circulation. We can also see much warmer temperatures over North America.
Gulf of Mexico
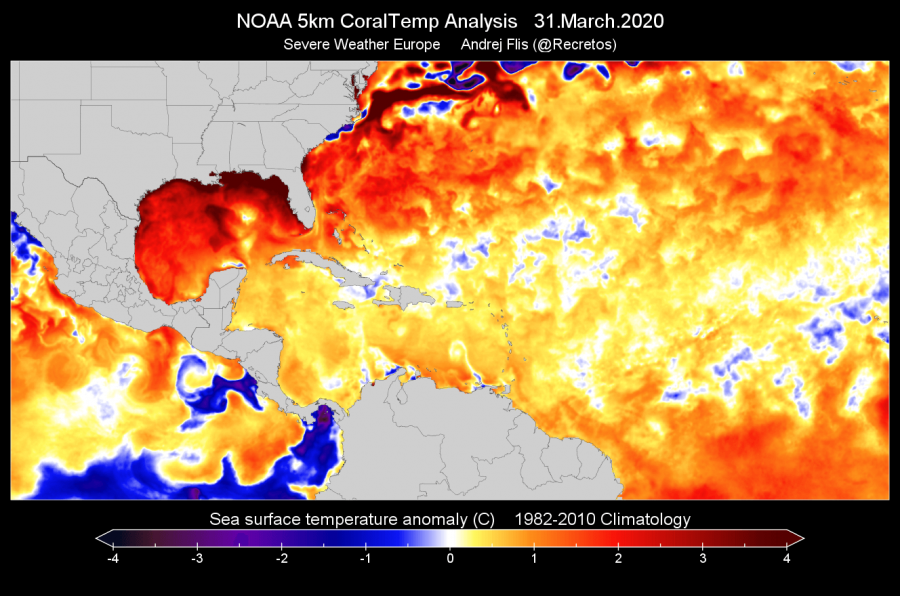
The second region of itnterest is the Gulf of Mexico. Currently, it is abnormally warm, runing several degrees above the long term norm. The major warming of surface waters begain in mid March, and it has raised temperatures to over 4°C above the long term average in coastal areas.
Looking at the actual temperatures, we can see temperatures over 26°C starting to creep into the gulf. The 26°C temperature threshold is where the waters are warm enough to provide energy for tropical systems. It is very unusual to get such temperatures in the Gulf of Mexico this early in the year. It does not mean that we hurricanes will start developing in the gulf, but it is an ominous sign to have such temperatures this early.
Why is this important? Gulf of Mexico acts as a source of energy. It is a pool of warm water, providing warmth and moisture to weather systems, acting as a fuel source. This is especially important during the USA tornado season, which has already begun. Southerly winds usually carry warm and moist air from the Gulf of Mexico into the tornado alley, where it meets cold and dry air from the north. When the Gulf of Mexico is warmer than normal, it can also provide warmer air, which can hold more moisture. This directly means more fuel for storms and more severe events. It increases potential energy, which means a higher chance for more (stronger) tornadoes. Of course, this also depends on the availability of cold/dry air, which is required to lift the warm/moist air up into the troposphere, creating storms and releasing energy.
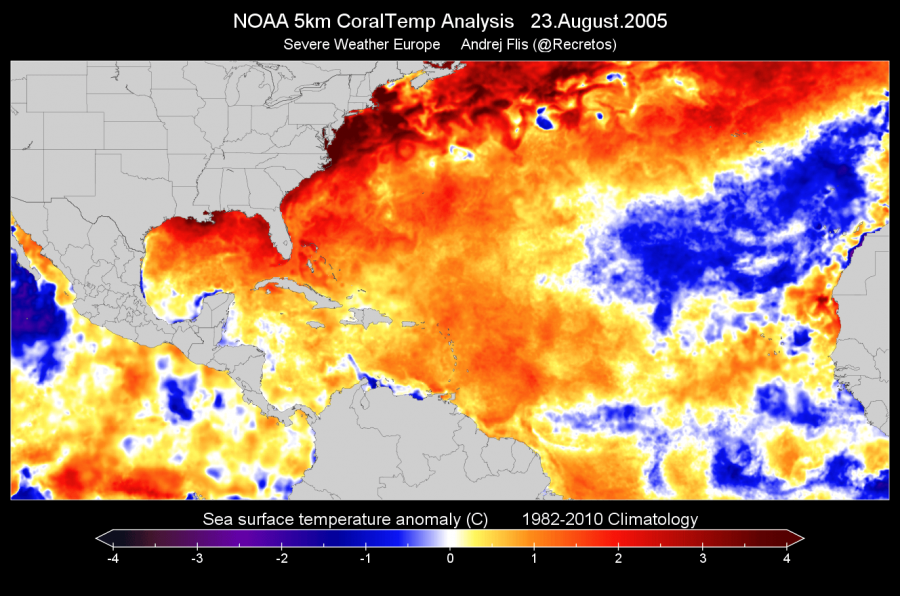
The Gulf of Mexico is also important during the summer and autumn months, more specifically during the hurricane season. Just like for tornadoes, it also provides energy for tropical storms and hurricanes. We mentioned the 26°C threshold required to sustain tropical storms. But summer and autumn water temperatures in the Gulf of Mexico are much warmer than 26°C and are completely able to sustain tropical systems. But every additional degree of warmth can provide more energy to a developing storm. Two well-known examples are hurricane Katrina in 2005 and hurricane Harvey in 2017. Below we have two graphics, which show sea surface temperature anomalies before the development of these two hurricanes. We can see the Gulf of Mexico running several degrees warmer than normal. There are of course also other factors required to power up a hurricane, but the warmer waters had a very important role as an energy source, providing more energy than it would normally be available.
Tropical Pacific (ENSO Region)
The most well known of the trio is probably the ENSO region in the tropical Pacific ocean. There are many ways to describe the ENSO region, but the best version is probably from NOAA Climate page:
“El Niño and La Niña are the warm and cool phases of a recurring climate pattern across the tropical Pacific – the El Niño-Southern Oscillation, or “ENSO” for short.
The pattern can shift back and forth irregularly every two to seven years, and each phase triggers predictable disruptions of temperature, precipitation, and winds.
These changes disrupt the large-scale air movements in the tropics, triggering a cascade of global side effects.”
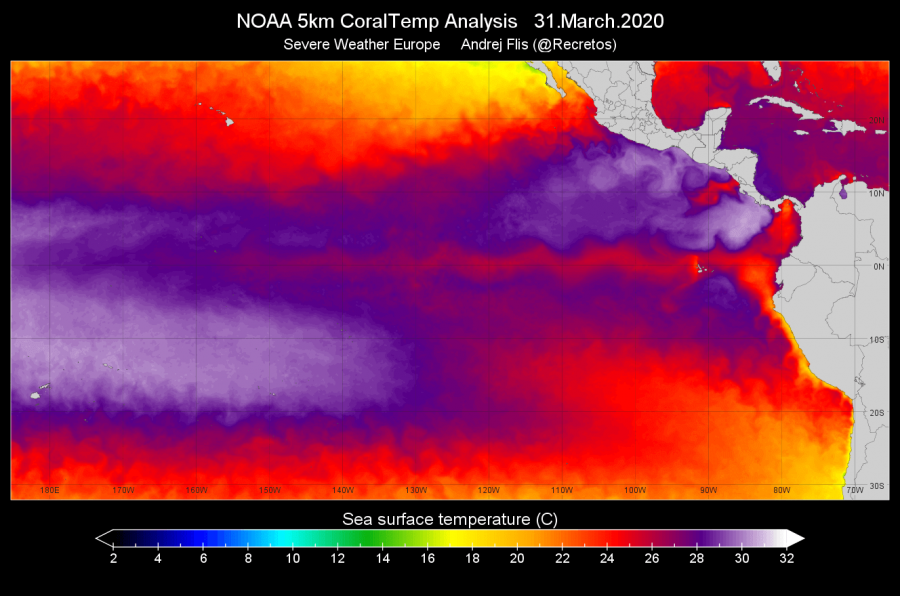
To simplify again, this is a region of ocean in the tropical Pacific, which alternates between warm and cold phases. The tropical trade wind patterns usually initiate or stop a certain phase. Each phase has a different influence on the tropical weather and circulation and thus impacting the weather worldwide. A specific phase (warm/cold) usually develops around late summer and autumn, and can last until next summer, or even up to two years! The warm ENSO phase is called El Nino, and the cold phase is called La Nina. The ENSO phase is determined by the temperature anomalies in the ENSO 3.4 region in the tropical Pacific. The graphic below shows the ENSO region, from which we can observe or calculate the phases.
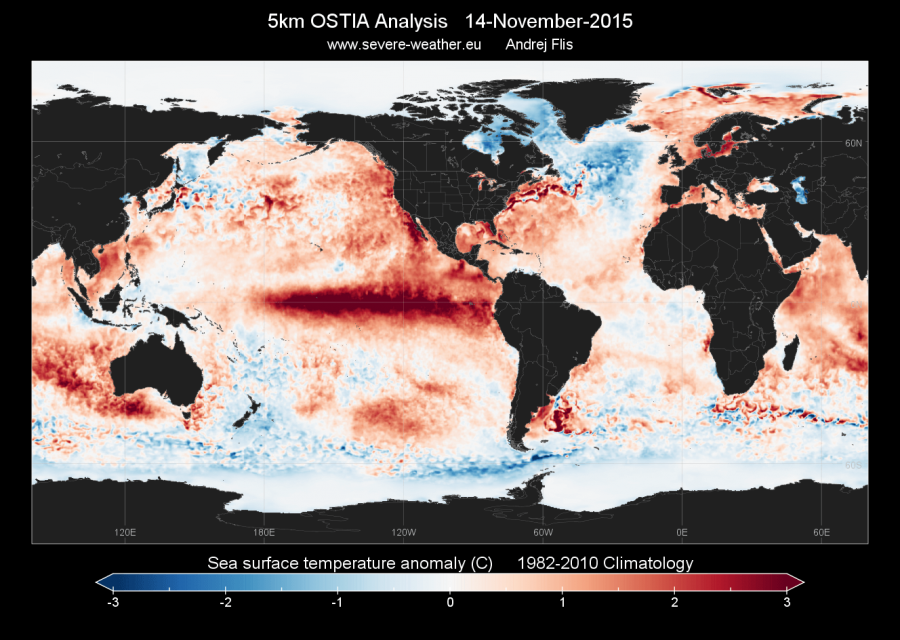
Below we have an example of each event, the warm El Nino phase in 2015, and the cold La Nina phase in 2011. Graphics show sea surface temperature anomalies. We can see warmer/colder waters in the tropical Pacific in the ENSO regions.
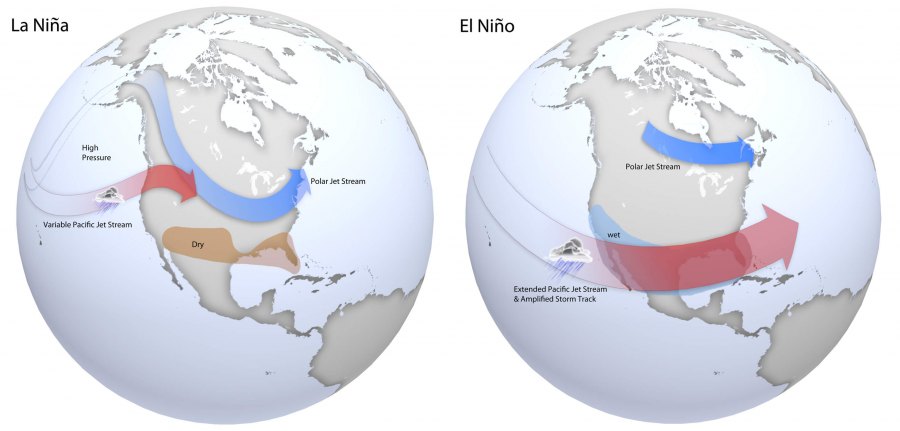
Each phase has a different impact on global weather patterns and the positioning of the jet stream. The graphics below from NOAA nicely outline the major jet stream position difference in each phase and main impacts during winter and summer. Of course, the ENSO phases have global implications beyond those that are shown on the graphics.
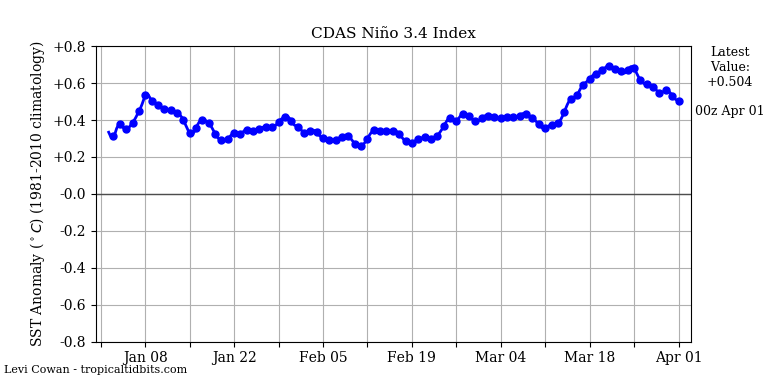
The tropical Pacific analysis reveals that the ENSO regions are currently mostly warm, but colder waters are moving in from the east. The time series shows that the ENSO 3.4 region (from which we calculate the phases), was mostly in the neutral-warm phase, without proper El Nino development. The threshold for each phase is several months of sustained anomaly of at least 0.5°C in positive for El Nino or in negative for La Nina.
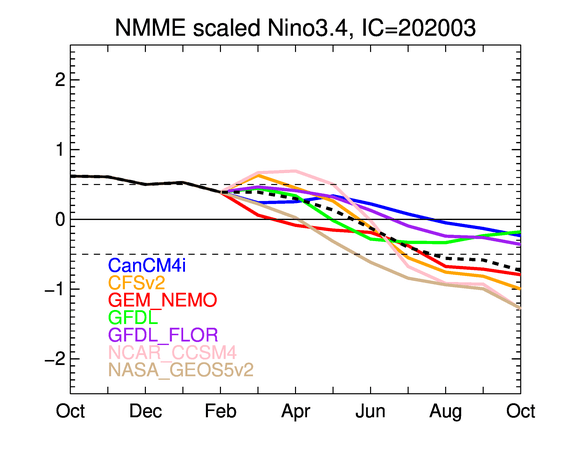
The forecasts are currently trending towards a negative phase, a La Nina, as we go into summer and autumn. The first graphic below shows the multi-model forecast of the temperature anomaly in the ENSO 3.4 region. We can see that in autumn, several models go below -0.5°C, which is the threshold for La Nina if sustained.
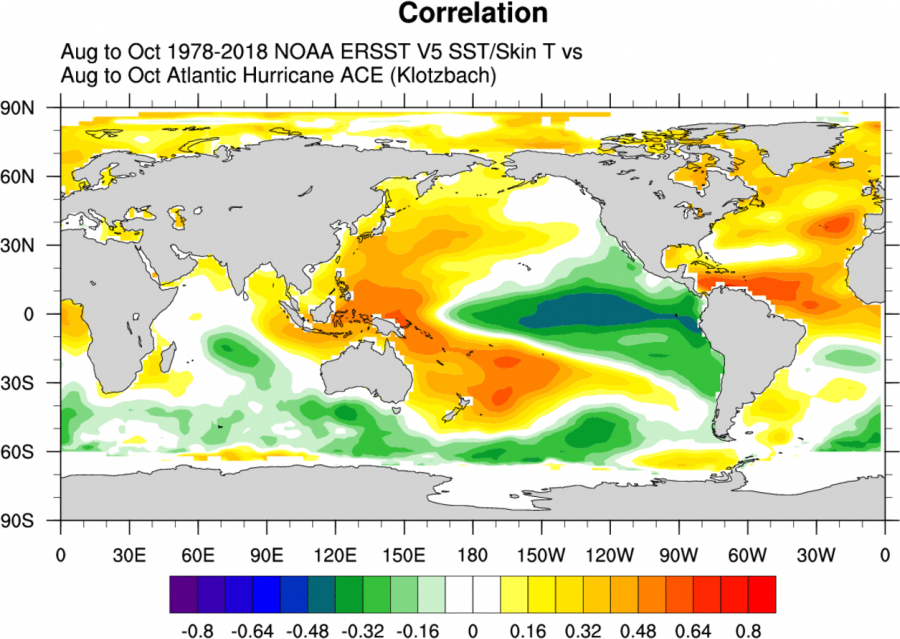
Why is this important? A negative phase, La Nina, is usually associated with stronger hurricane activity in the Atlantic, increasing the risk of landfall and damage across the many islands in the tropical regions and also for the coasts of the USA. A La Nina has a specific impact on pressure patterns and tropical circulation, providing favorable conditions for tropical systems to power up as they move across the tropical Atlantic. The first graphic below shows the tropical sea surface temperature pattern during high power hurricane years. We can see that it shows negative temperatures in the ENSO region, indicating a La Nina. It also shows warmer temperatures in the tropical Atlantic and in the Gulf of Mexico. The second graphic is a forecast from the CFSv2 model, which shows exactly the same image for Autumn 2020. If this forecast were to materialize, it would raise real concerns for the hurricane season, as it could again be a stronger one. We will provide regular updates on the development of this ENSO phase, with potential impacts on weather across the Northern Hemisphere in the winter of 2020/2021.
We will keep you updated on any important further development. While you wait for more updates, don’t miss the upcoming comet, which could be bright enough to be seen during the day with some luck!
Arctic cold outbreak develops across the United States tonight and continues into the weekend
Also, don’t miss the global CO2 levels analysis, which shows the temporary hold in the global CO2 increase, likely due to the industry slowdown from the Coronavirus outbreak:

