Welcome to Severe Weather Europe page!
Welcome to our Severe Weather Europe page – an online resource of weather forecasts, outlooks, long-range trends, severe weather, and more. Our mission is to …
We didn't find the posts for that URL.
Welcome to our Severe Weather Europe page – an online resource of weather forecasts, outlooks, long-range trends, severe weather, and more. Our mission is to …
The first forecast trends for Summer 2024 are here, and they show a dynamic summer pattern in the atmosphere. Most of it has to do …
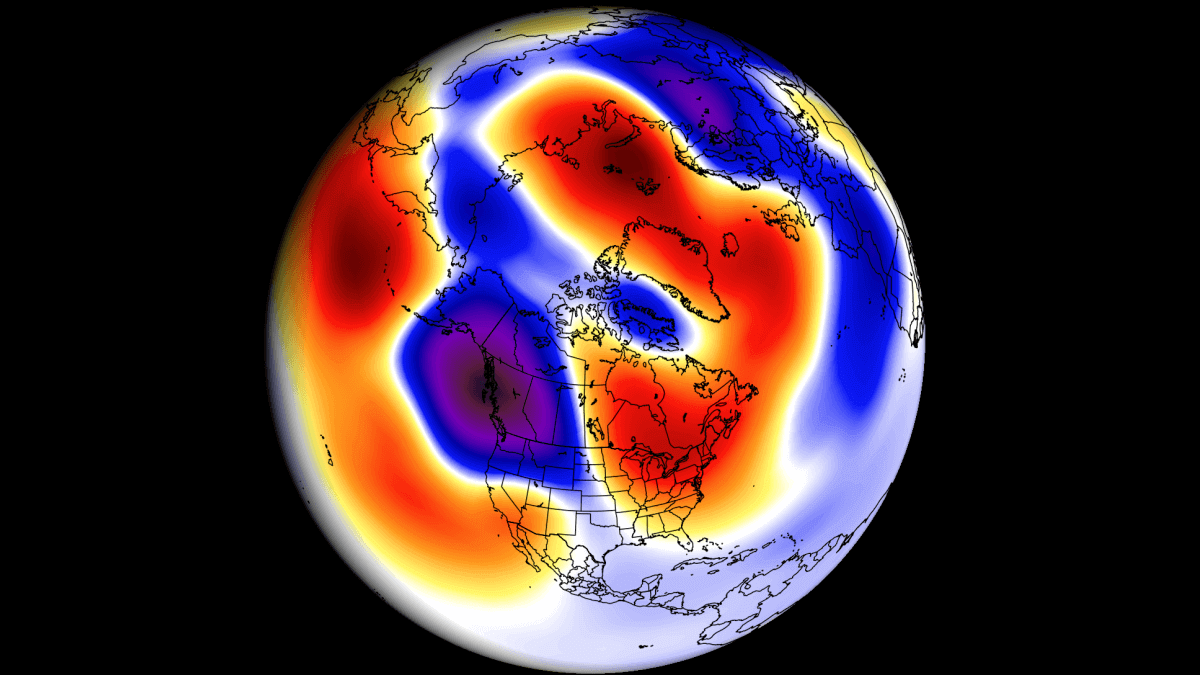
March weather patterns over North America are forecast to undergo a real power struggle between winter and spring. Rapid changes in pressure anomalies will also …
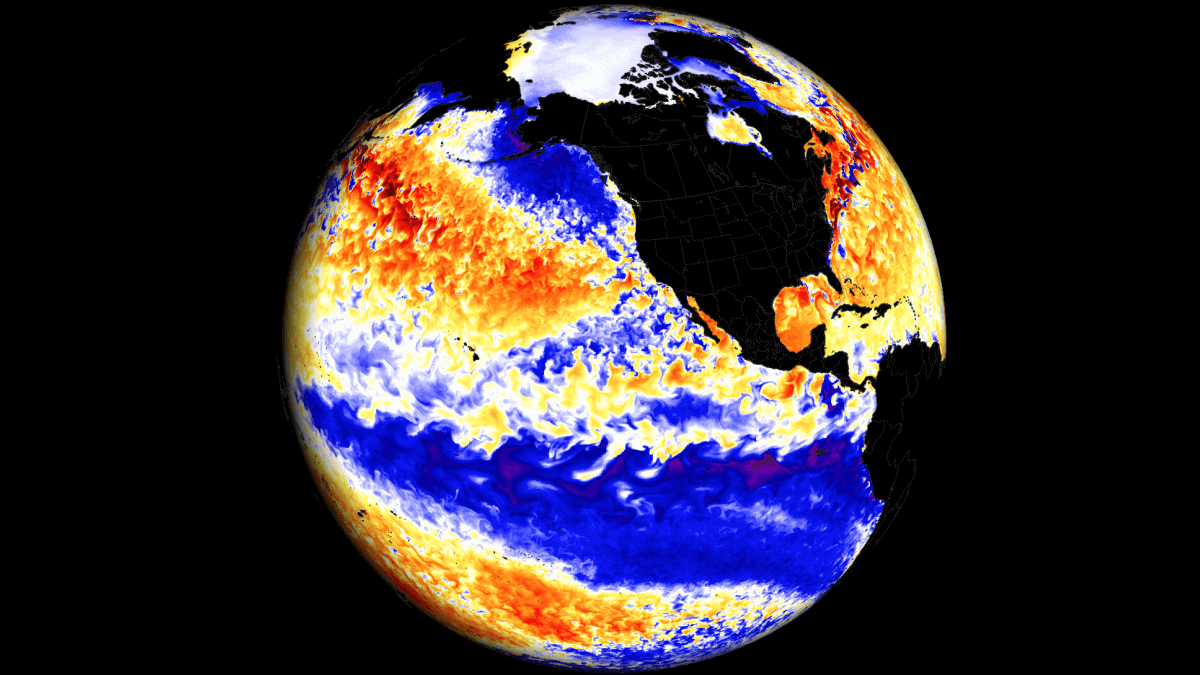
Rapid changes in the oceanic and atmospheric patterns have prompted NOAA to release an official La Niña watch. This means that La Niña is expected …
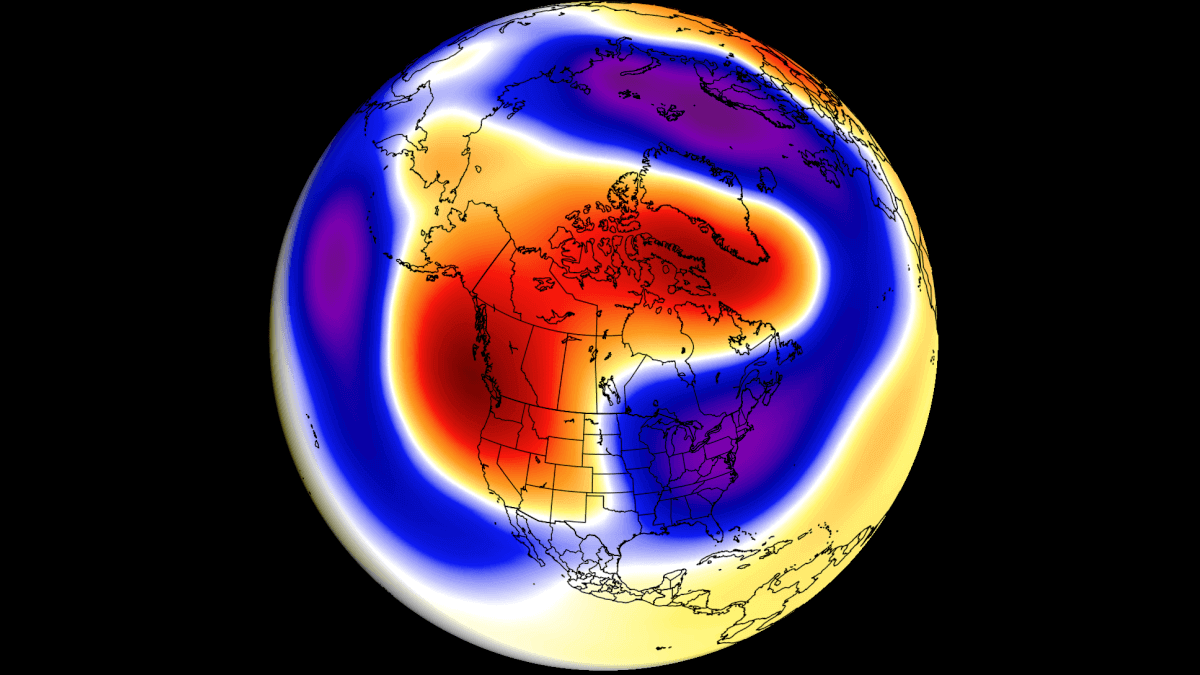
Weather patterns are changing again, this time with the help of the final warming event in the Stratosphere. The latest forecast shows a cooler and …
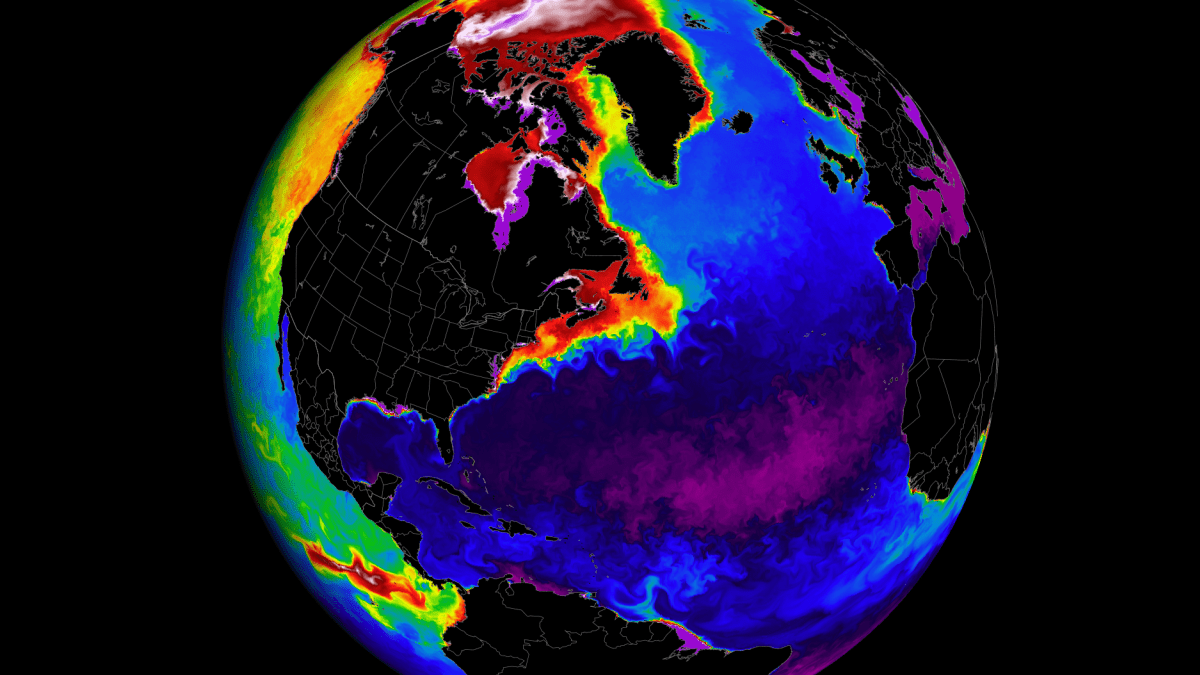
The Atlantic Ocean currents are getting very unstable and are close to a tipping point of no return. That is what a new study shows, …
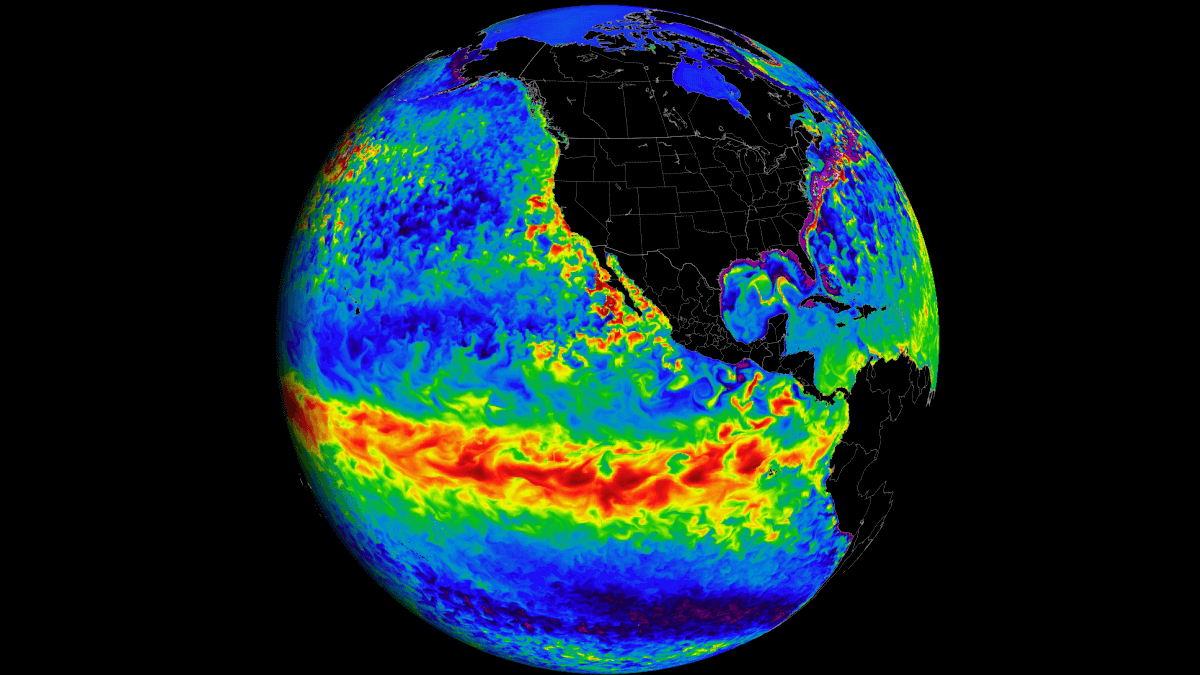
The El Niño event has reached its peak and is now headed for a rapid breakdown, the latest data shows. But as the ocean anomalies …
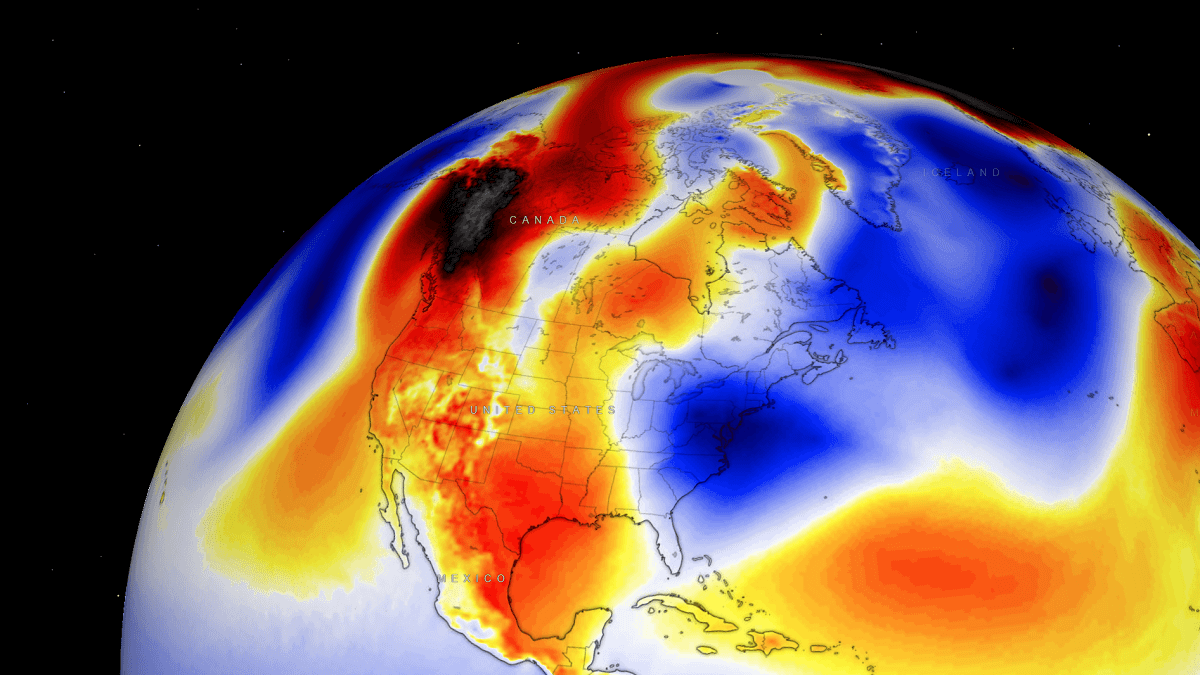
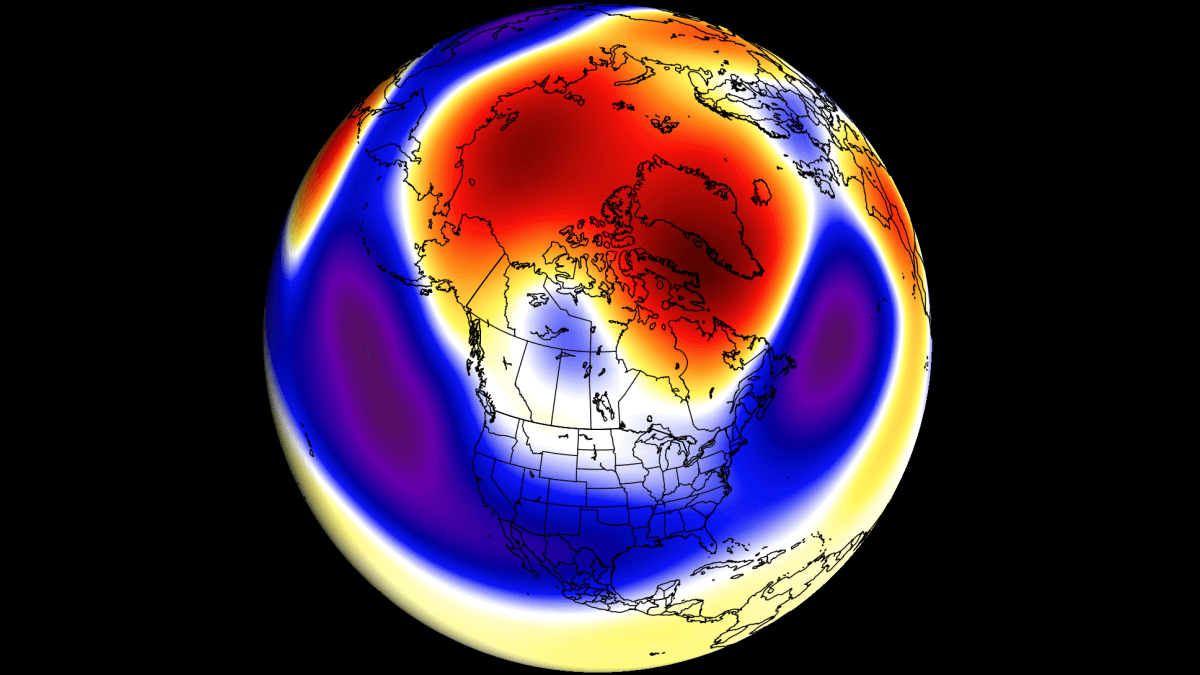
The unseasonably warm weather across Canada and the United States is soon ending. A more progressive weather pattern will develop across North America through mid …

Updated February 8th, 2024: This article was originally published on February 5th, but it was now updated on the 8th to include a new analysis, …