Updated February 8th, 2024:
This article was originally published on February 5th, but it was now updated on the 8th to include a new analysis, the latest discoveries in the new weather forecast, and the updated expected weather impacts from this event across the United States. The updated sections are properly marked.
A Polar Vortex collapse event is now confirmed by the forecasts for mid-February. With a stratospheric warming event expected to develop, we currently see a rapid breakdown of the Polar Vortex and a cold weather pattern change across the United States in the second half of February and possibly into early March.
This is now the second disruption of the Polar Vortex in 2024. The first occurred around mid-January and coincided with a strong cold air release across much of the central and eastern United States.
This upcoming event looks stronger than the first one. Current forecasts are already picking up on these dynamics and are starting to outline a new cold episode across the United States after this atmospheric disruption unfolds.
POWER OVER THE NORTH
The best way to understand the polar vortex is to see it. In simple terms, it is just a name that describes the broad winter circulation over the northern (and southern) hemispheres.
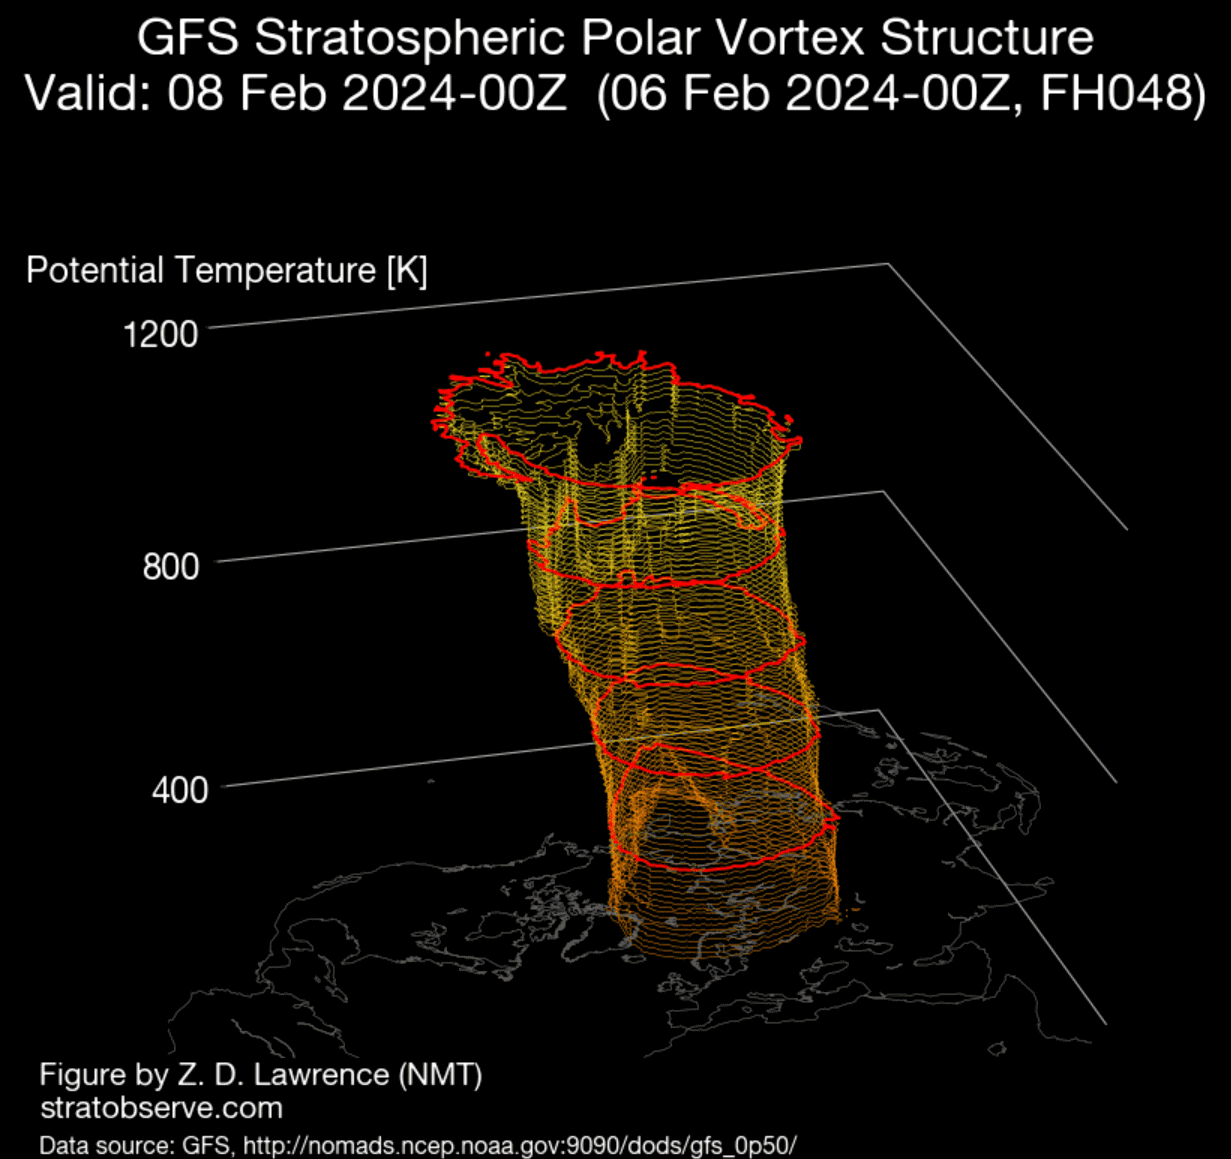
Below is a 3D image example of the polar vortex. The vertical axis is greatly enhanced for better visual presentation. You can see the actual structure of the polar vortex, connecting down from the stratosphere to the lower levels and the pressure systems.
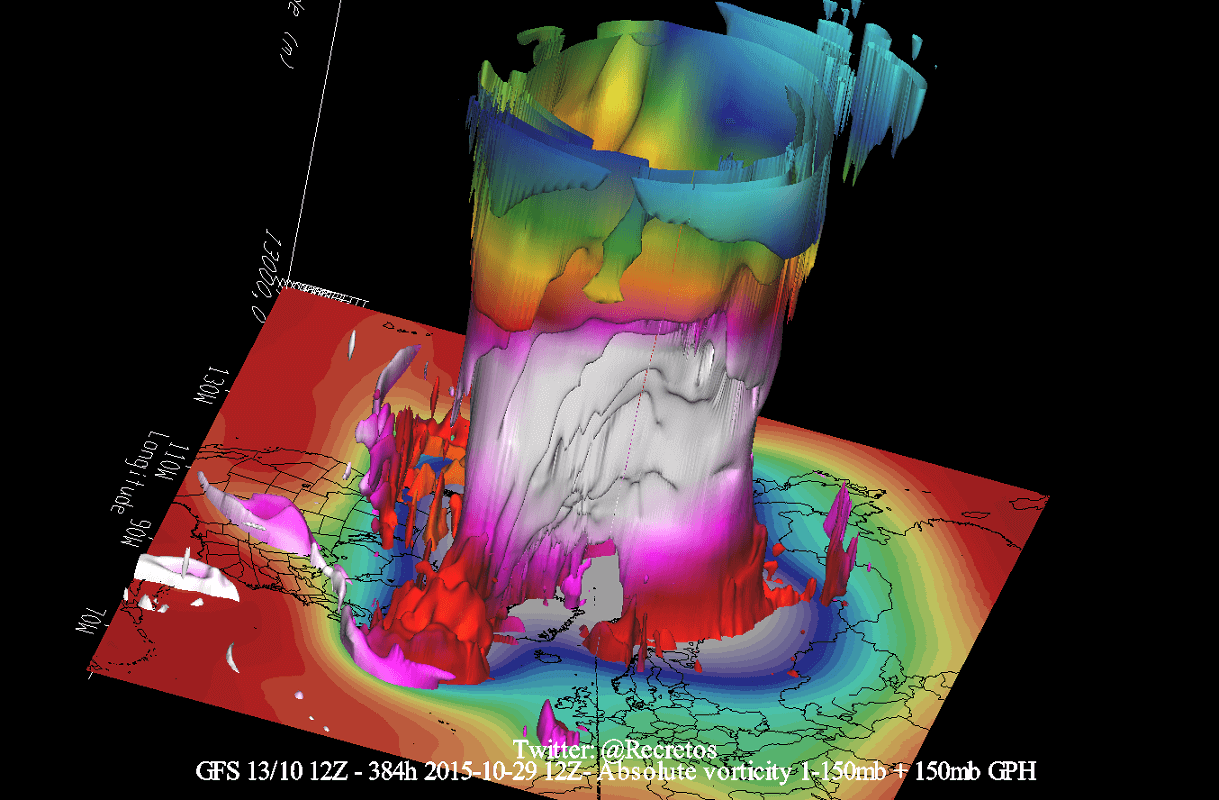
The polar vortex extends high across different layers of the atmosphere. The lowest level is called the troposphere, where all weather events occur. But above that, we have the stratosphere, a deeper and drier layer.
For this reason, we separate the polar vortex into an upper (stratospheric) and a lower (tropospheric) part. They both play their role differently, so we monitor them separately. But both parts together form the winter circulation across the Northern Hemisphere.

To keep things simple, all you need to know is that the upper and lower parts of the polar vortex are connected. Changes in the upper part can significantly impact the weather anomalies in the lower parts of the atmosphere and the weather at the surface.
The reason we monitor the state of the polar vortex is because it can have a profound impact on our daily weather. We mainly separate the polar vortex into two different modes:
A strong/stable polar vortex usually means strong polar circulation and jet stream. This locks the colder air into the Arctic Circle, creating milder conditions for most of the United States.
In contrast, a weak/disrupted polar vortex creates a weak jet stream pattern. As a result, it has a harder time containing the cold air, which can now escape from the polar regions into the United States. Image by NOAA.
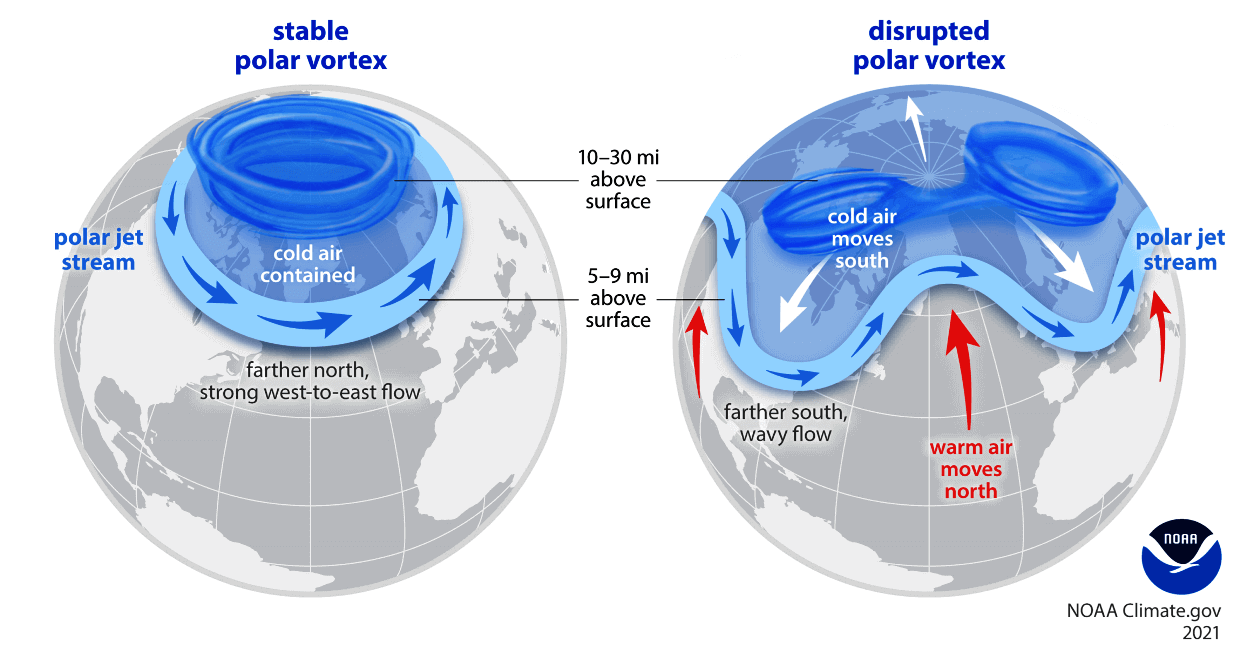
So, for example, a weak polar vortex can greatly increase the odds of cold and snow across the central or eastern United States. In nature, that means a heavy disruption of the jet stream and a release of cold air from the polar regions.
To put the polar vortex into perspective, we produced a high-resolution video below, showing it in 3D. This way, it gives you a better idea of what it actually looks like in nature. But note that the vertical size of the vortex was greatly enhanced for visual purposes.
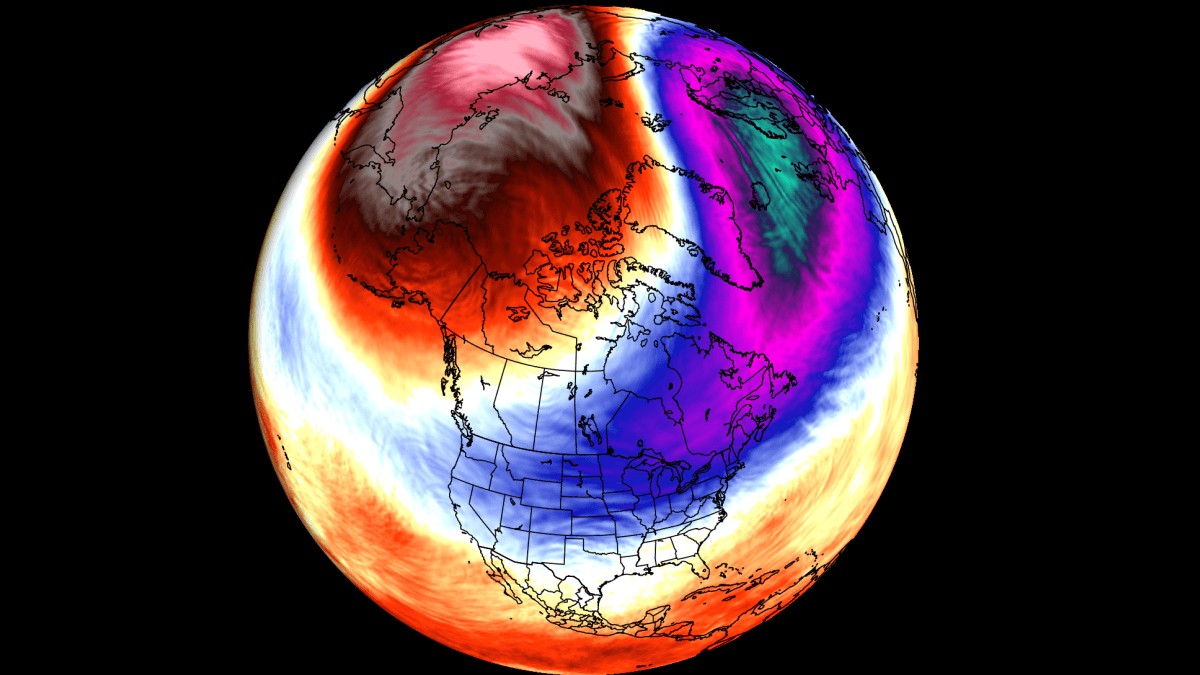
The main takeaway from the video should be that the polar vortex is the entire weather circulation over the Northern Hemisphere and not just one cold/storm event over the Midwest or the northeastern United States.
POLAR VORTEX LATEST DATA (UPDATED)
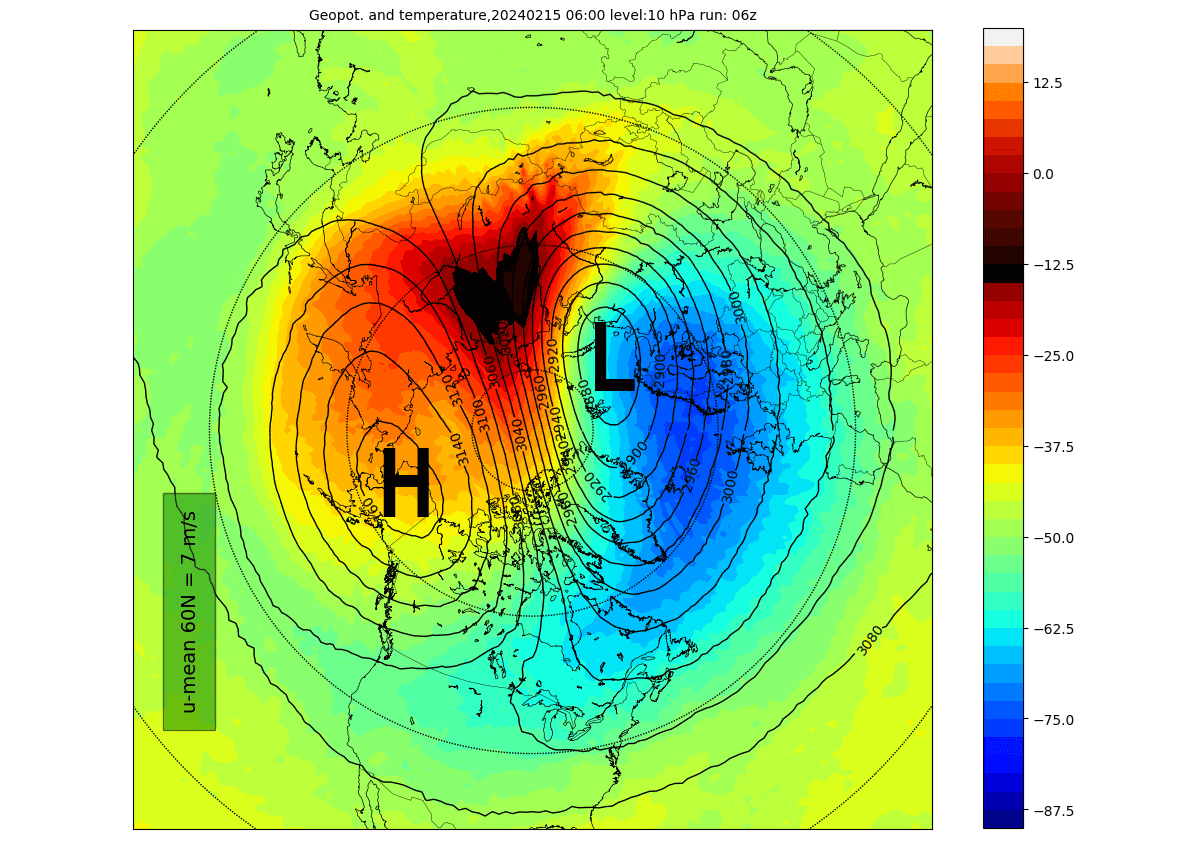
The stratospheric polar vortex is fairly normal in size on the current data. It is just slightly displaced towards the eastern hemisphere. But compared to a few days ago, a high-pressure region is forming, and a warming wave is starting to appear between the two systems in the stratosphere.
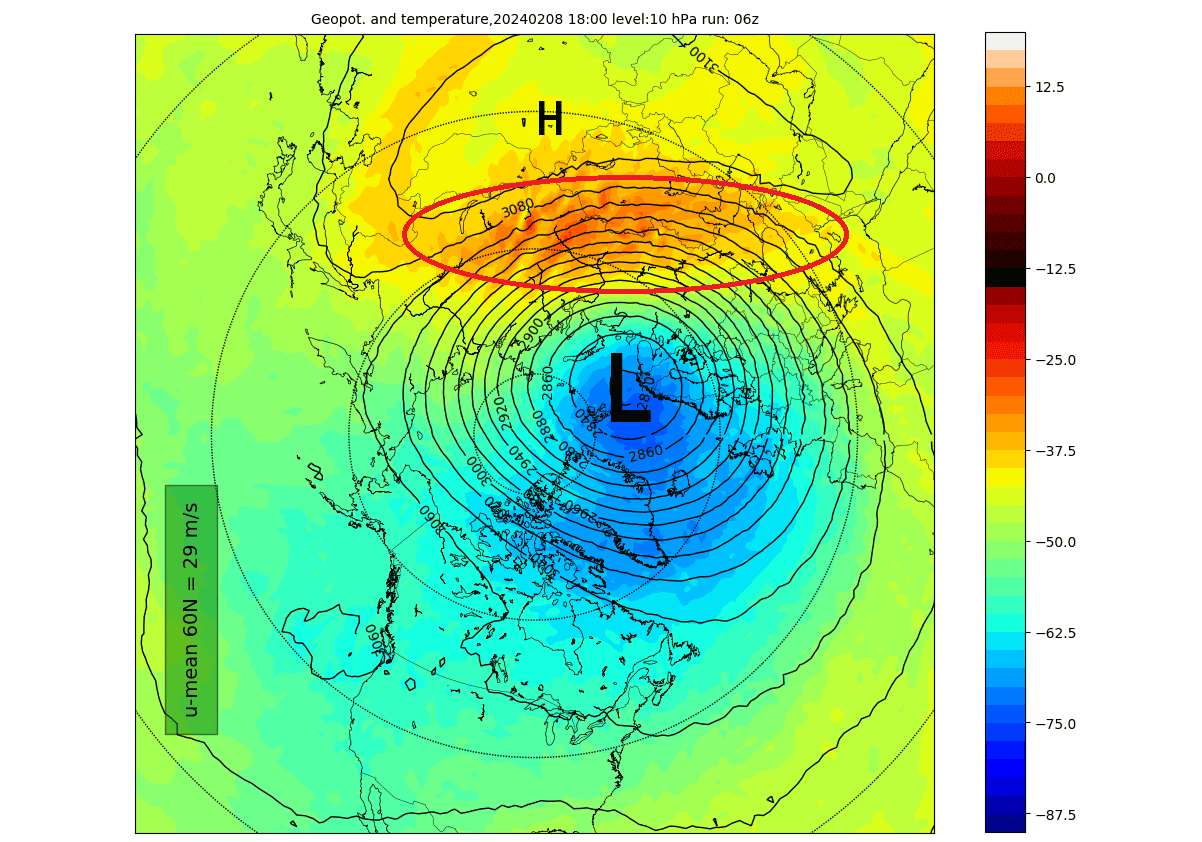
The image above shows geopotential height and temperature in the mid-stratosphere at 30km/18.5miles height. The polar vortex resembles a “cyclone” with a cold core near its low-pressure center. Image by weatheriscool.com
Below is the latest wind data for the same level. It shows a circular shape of the polar vortex, indicating it is in a stable condition. Winds are usually the main indicator of the polar vortex’s state and health. But you can see a high-pressure area starting to appear and is expected to grow, eventually creating the whole stratospheric disruption event.

Looking at the 3D structure of the polar vortex at this time, we can see it has a good circular structure. But compared to the analysis a few days ago, it is now starting to wobble slightly in the upper levels as the high-pressure area starts to form. Image by stratobserve.
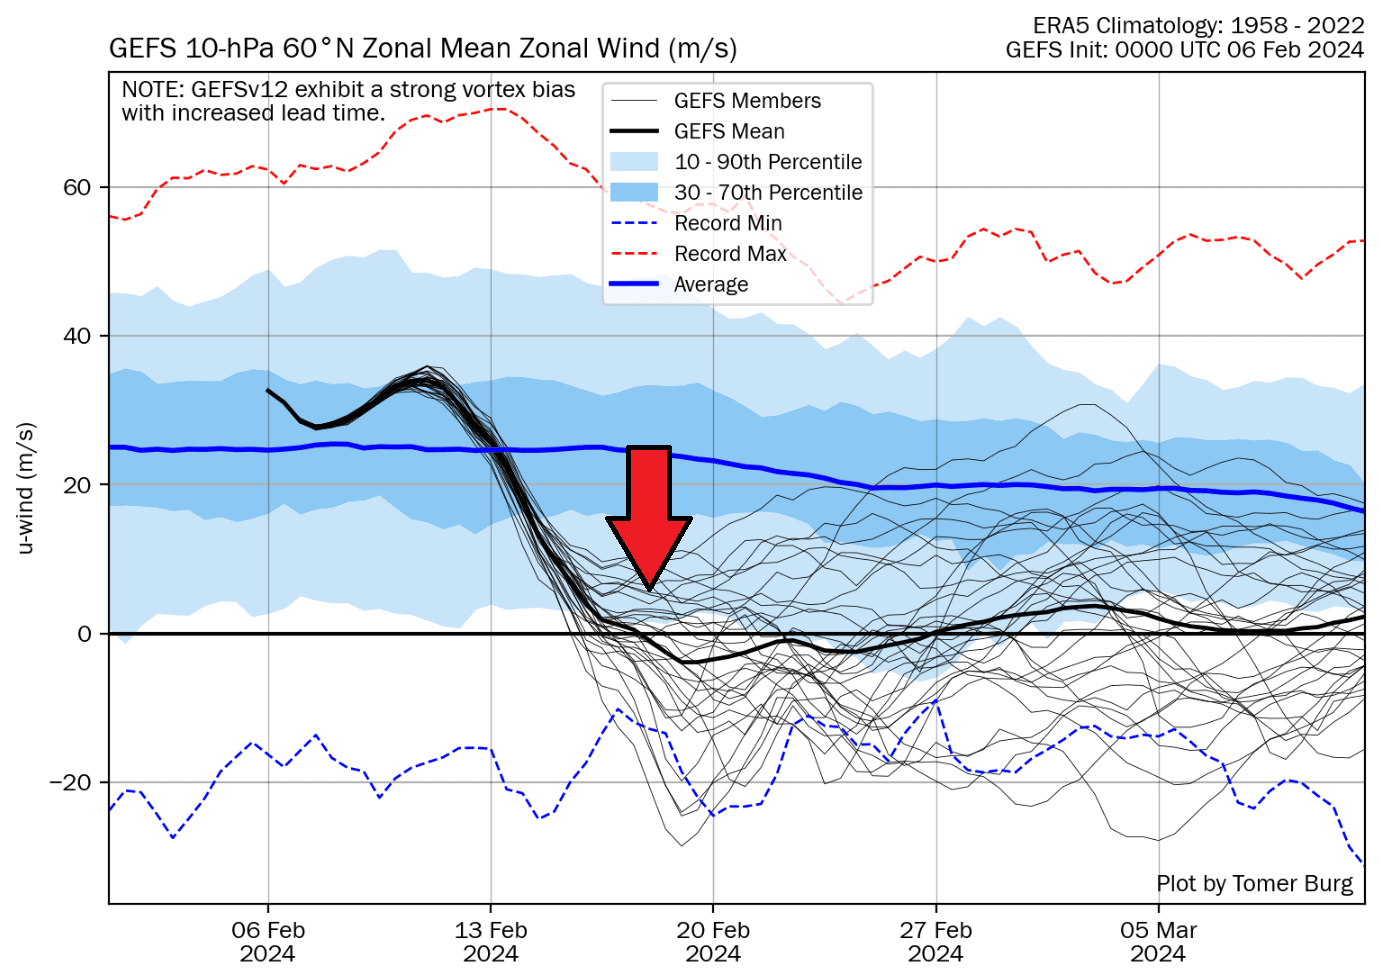
The polar vortex might still be in good condition at the present time. But the latest stratospheric forecast has further intensified the upcoming disruption. In the image below, you can see the ensemble forecast for wind and temperature in the mid-stratosphere. A strong warming wave can be seen on the temperature graph, raising stratospheric temperatures far beyond the normal values.
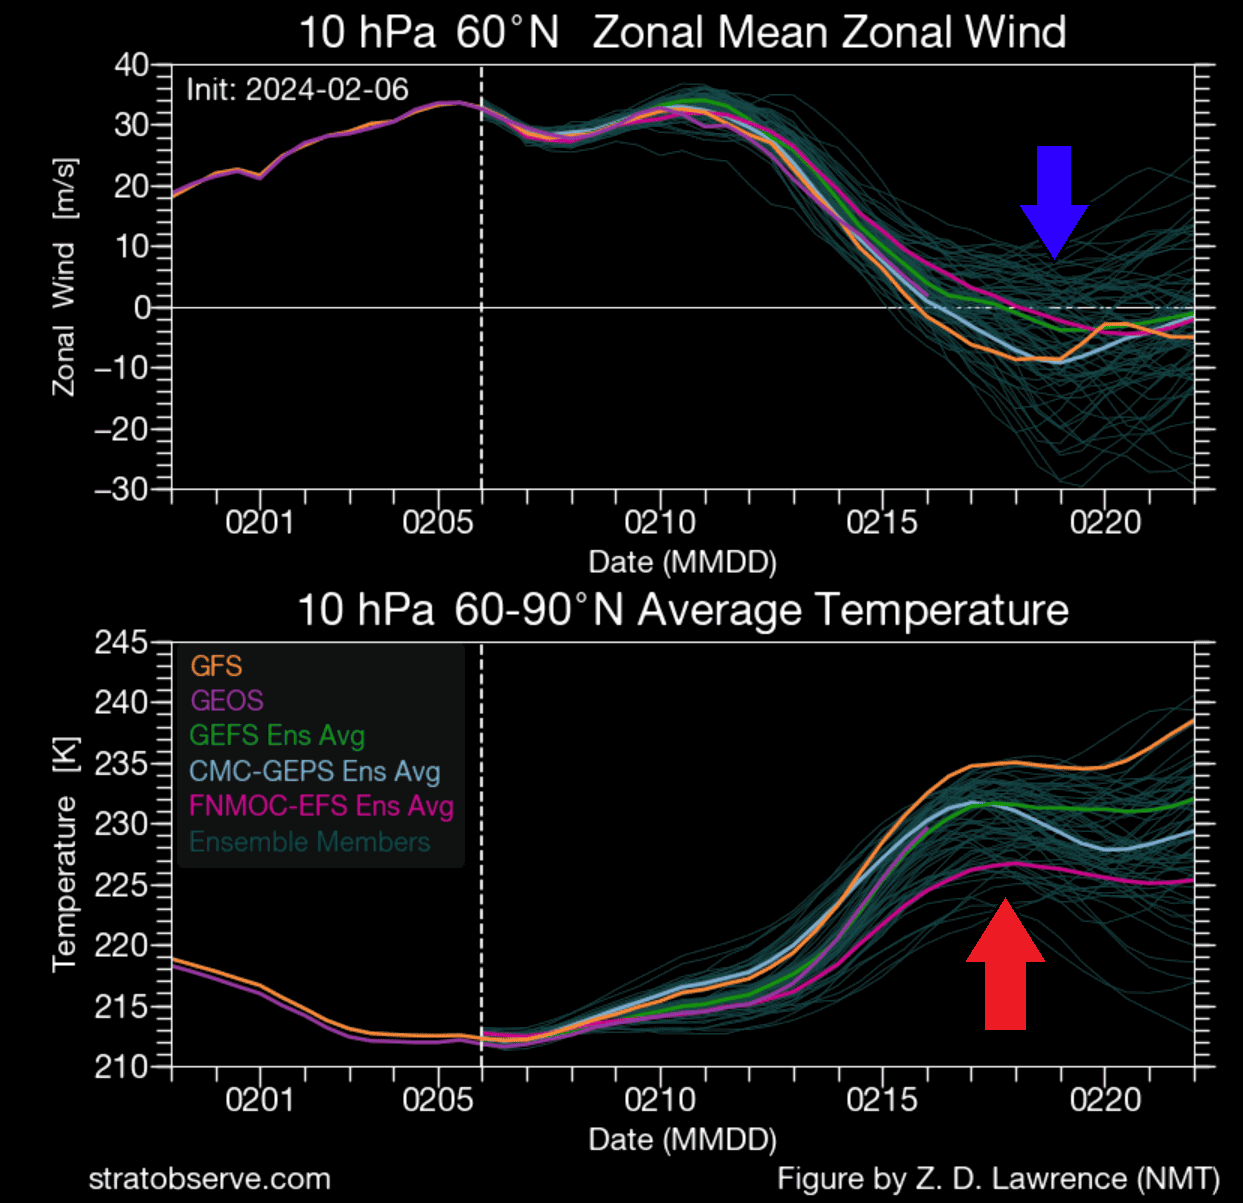
The wind forecast shows negative values in the stratosphere, meaning the circulation will reverse from the usual westerly to easterly. This also meets the official criteria for this event to be a major Sudden Stratospheric Warming event (SSW).
Winds are the first indicator that the polar vortex is expected to lose power. We tend to measure how strong the winds are around the polar circle. If those winds get weak or reverse from west to east, it signals a potentially strong disruption from the stratosphere down to the lower levels and our weather.
The polar vortex is always very cold when it is in good condition. When temperatures rise, it shows that something will happen to the polar vortex. So, when we see temperatures starting to rise fast, it is a strong statement that the polar vortex will weaken or even collapse.
A DISRUPTION BEGINS (UPDATED)
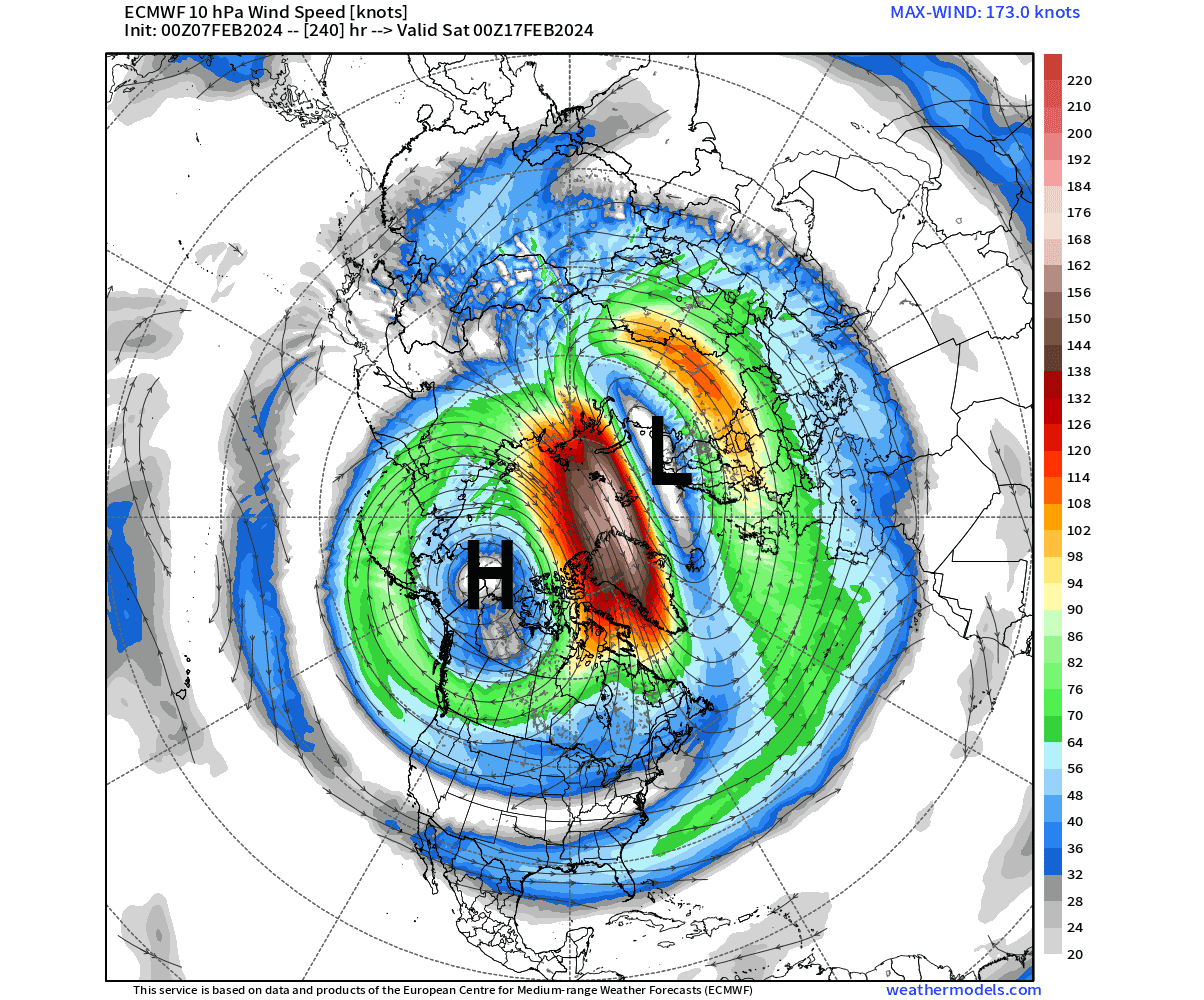
Below is the stratospheric forecast 8 days from now, which shows the high-pressure system to grow very large and push against the polar vortex. This completely changes the wind dynamics in the stratosphere, and you can also see a strong warming wave between the systems like sparks flying when they clash.
This substantially reduces the westerly wind speed in the stratosphere and sends a strong disruption wave downwards. Imagine having a large stack of plates, and as the whole stack starts to wobble around, it can even start collapsing from above, eventually bringing down the whole thing.
You can see the wind forecast for the same period below, with the high-pressure area having a much better shape and pushing against the polar vortex. The energy and the dynamics between the systems are high, creating strong pressure gradients and, thus, strong cross-polar winds.
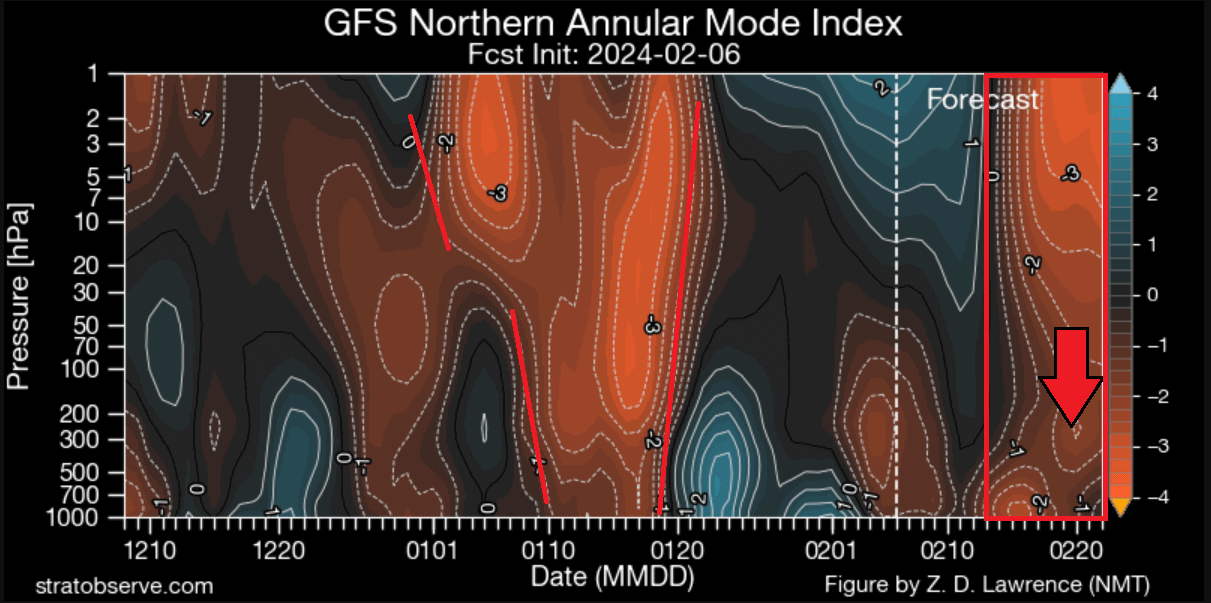
Below is the extended wind forecast for the polar vortex, and you can see the forecast average going into negative values. This means a true wind reversal in the stratosphere, which can have profound weather impacts in the following days/weeks.
The 3D vertical structure forecast below shows the deformed shape of the polar vortex around that time. It is no longer seen as nicely circular and compact. It is getting torn apart, completely changing its dynamics and weather impacts, as the high-pressure area creates a “void” seen in the structure of the polar vortex.
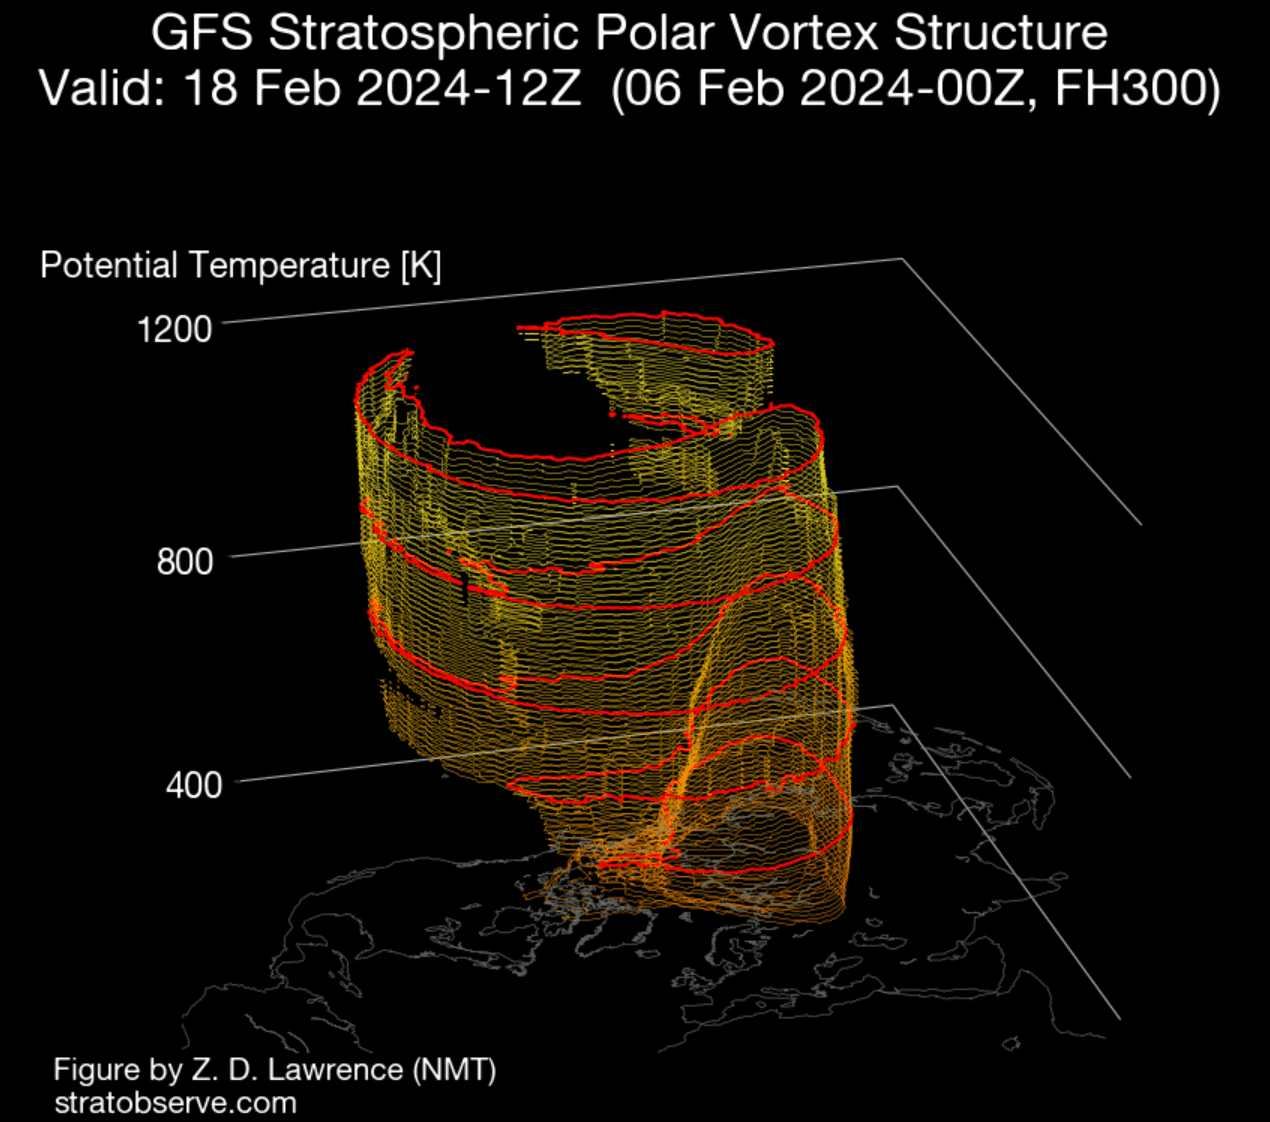
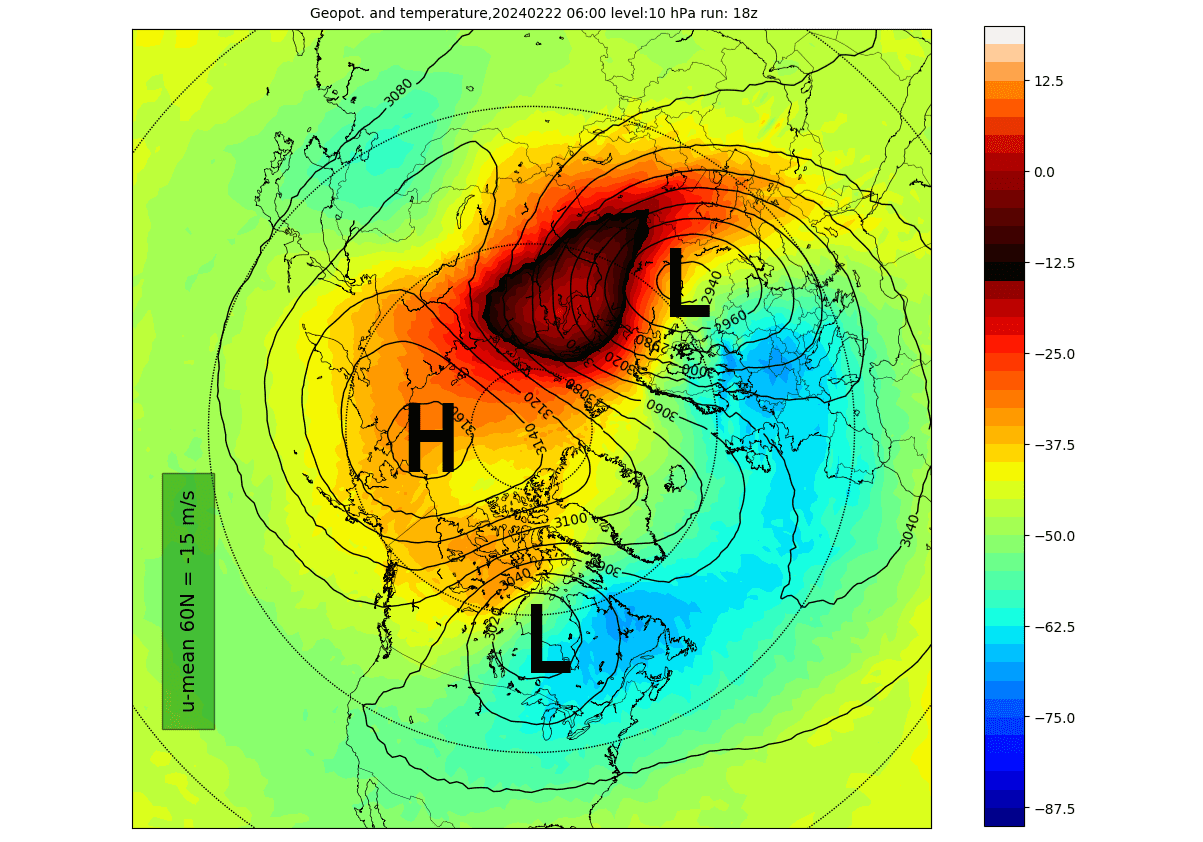
A week after the main event begins, the forecast below shows the high-pressure area extending further, tearing apart the polar vortex completely. One core will move into Eurasia, and one will move into North America. This is still shown at the 10mb level (31km/18.5miles), but the pressure anomalies in the lower levels tend to follow the upper dynamics.
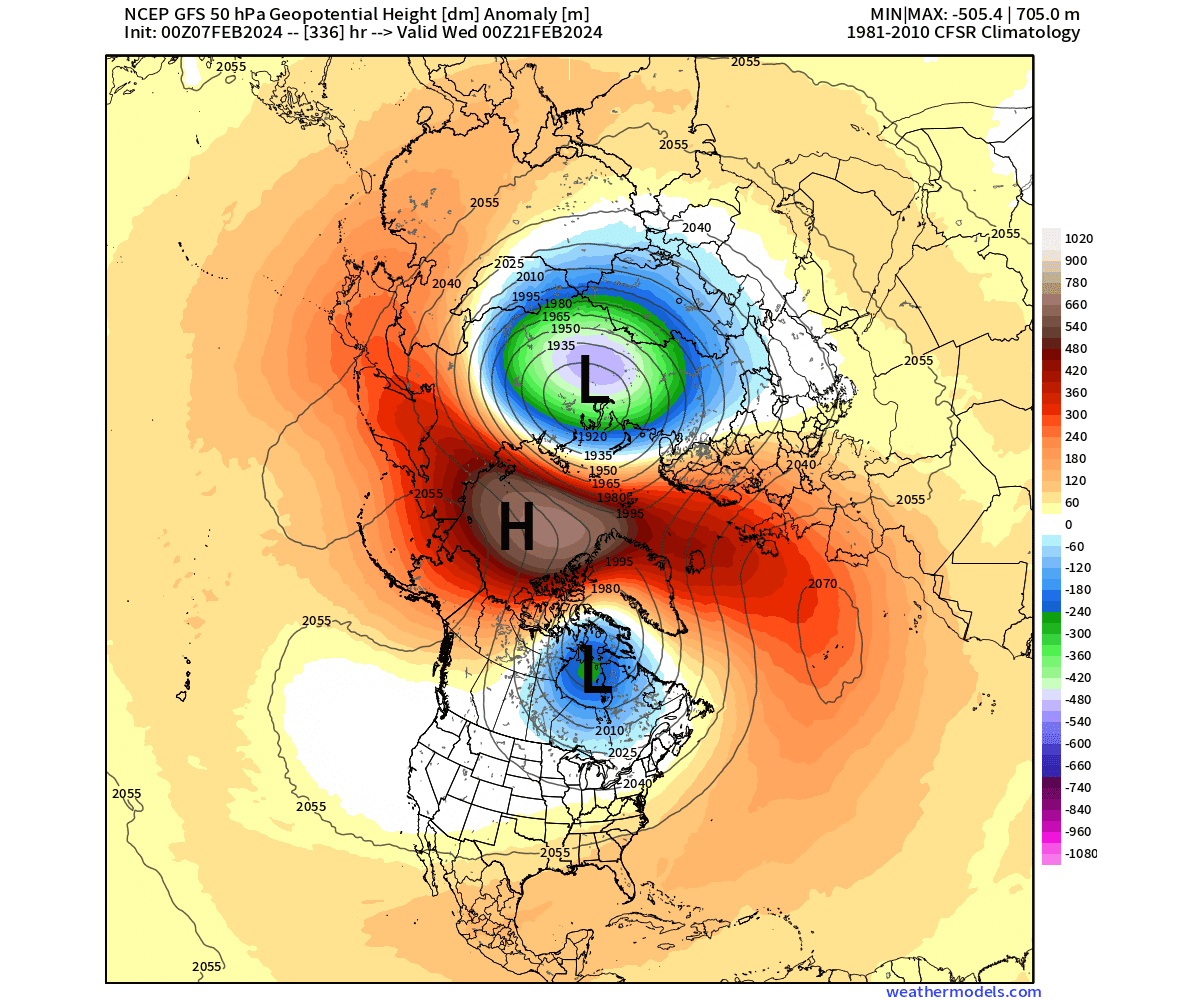
Below is the pressure anomaly forecast for the lower levels of the stratosphere at 50mb (20km/12.5 miles). Even further down, you can see a strong high-pressure anomaly over the pole and two low-pressure areas over Siberia and North America. This indicates a rapid response across the entire depth of the stratosphere.
So, to recap, you can see a major shift in the stratosphere is coming for the polar vortex. Based on what we know, a weak polar vortex can substantially change the weather patterns across the United States and the rest of the Northern Hemisphere.
Below is the forecast graphic for the winds across the atmosphere. You can see strong, reversed winds in the stratosphere in the left part of the graphic. In the right part, you can see the anomalies, where it is easier to see how this wind anomaly translates towards the surface levels. Image by weatheriscool.com
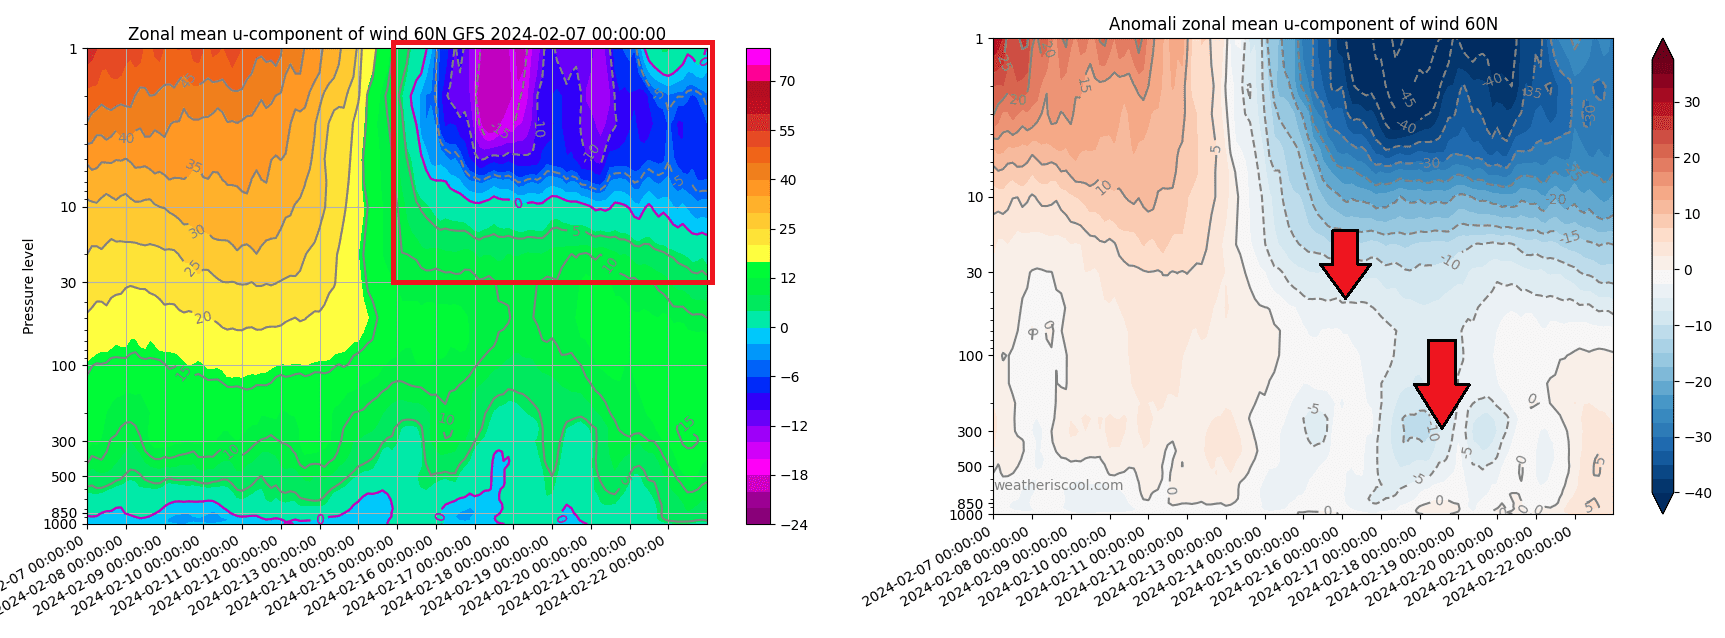
The stratospheric warming event is still a few days away, but a full wind reversal is starting to look more and more likely as different forecasting systems now start to see it. But we will still look at what we usually expect from such events and the latest forecast for the weather development in that period.
WEATHER ABOVE AND BELOW (UPDATED)
Sudden Stratospheric Warming basically means a strong temperature and pressure rise in the Stratosphere. That causes a major disturbance in the circulation and, as a result, starts a collapse of the polar vortex. But how does it actually change the weather?
Below is a typical example of how a stratospheric warming event works. The image shows pressure anomalies across the atmosphere. You can see the main event in the stratosphere slowly affecting the surface layers below over a certain time period.

An SSW event usually involves high-pressure anomalies from the stratosphere making their way to the surface. This disrupts the jet stream, helping to unlock cold air from the polar regions down into the United States and Europe.
Below is the new actual analysis and forecast of the atmosphere this winter. Two areas stand out in this image. First was the high-pressure anomaly in mid-January, which also featured a polar vortex disruption connecting downwards to the lower levels, helping to unleash a cold air anomaly across the United States in that period.
Second is the high-pressure anomaly marked in the forecast part of the graphic. It shows the high-pressure anomaly connecting the stratosphere and the lower levels during this upcoming polar vortex disruption.
That usually means a weakened jet stream and low-pressure systems from the eastern United States across the North Atlantic and Europe. This helps to unlock the cold air from the Arctic, sending it down into the mid-latitudes.
WINTER STRIKES AGAIN? (UPDATED)
Below, we will look at the latest weather forecast in the mid-term and the extended range, showing the impacts of the stratospheric polar vortex collapse (updated February 8th, 2024).
The stratospheric warming event is usually one of the main events (along with El Niño) that can rapidly push the weather patterns into a more wintery mode.
Below is the updated pressure pattern forecast for mid-month. You can see the strong high-pressure area over the pole, which looks oddly similar to the stratospheric disturbances. This is known as high latitude blocking. As a response, a low-pressure area takes over the United States and the rest of the Northern Hemisphere.
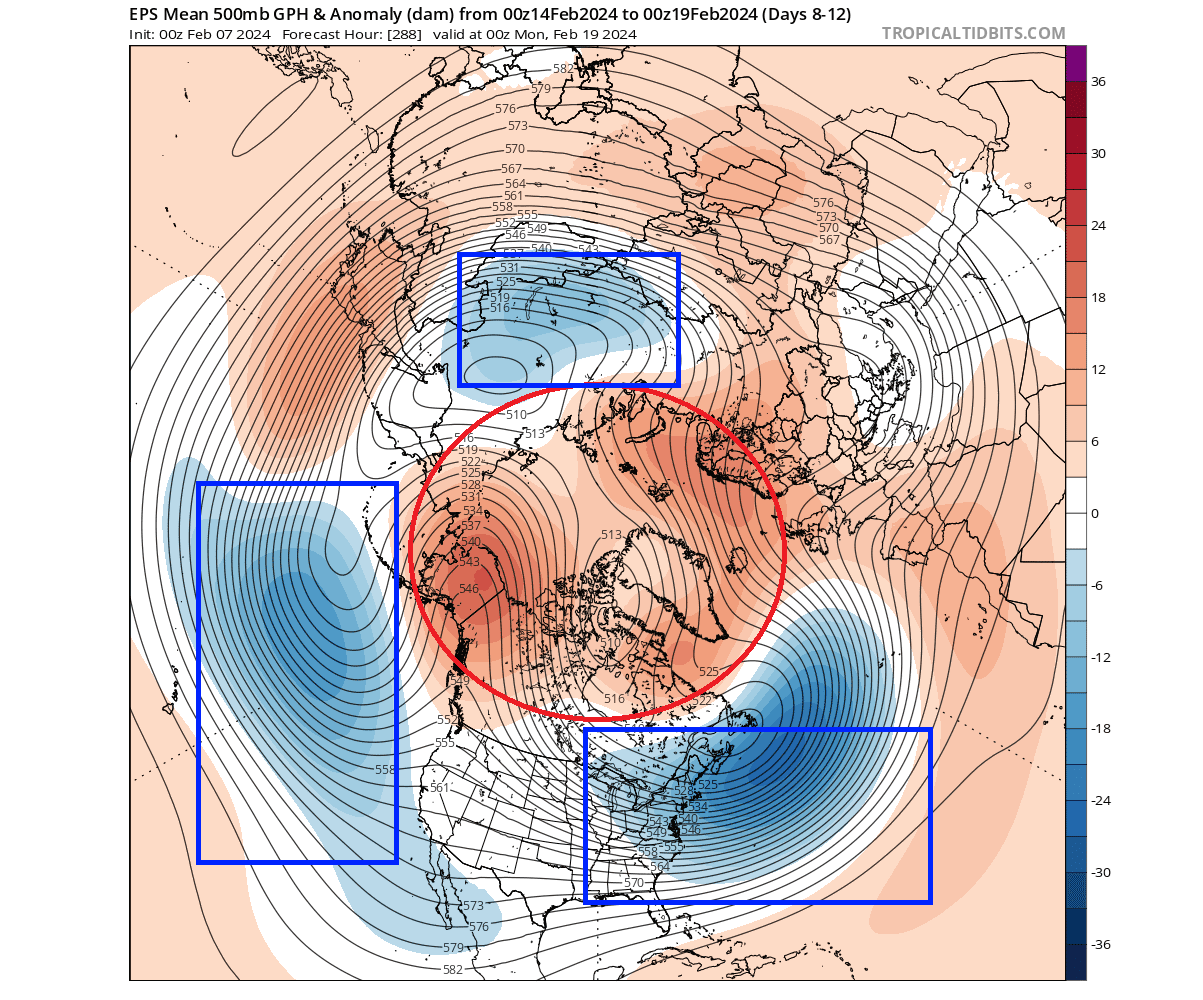
This is not necessarily a sole direct result of the stratospheric dynamics, but the whole system is connected and reflects changes from above to below and vice-versa.
The temperature pattern for the same period has not changed much. It continues to show a colder anomaly over the United States, focusing on the Midwest and the eastern United States. Such a temperature pattern would be expected with strong stratospheric dynamics and high latitude blocking and can persist for some time.
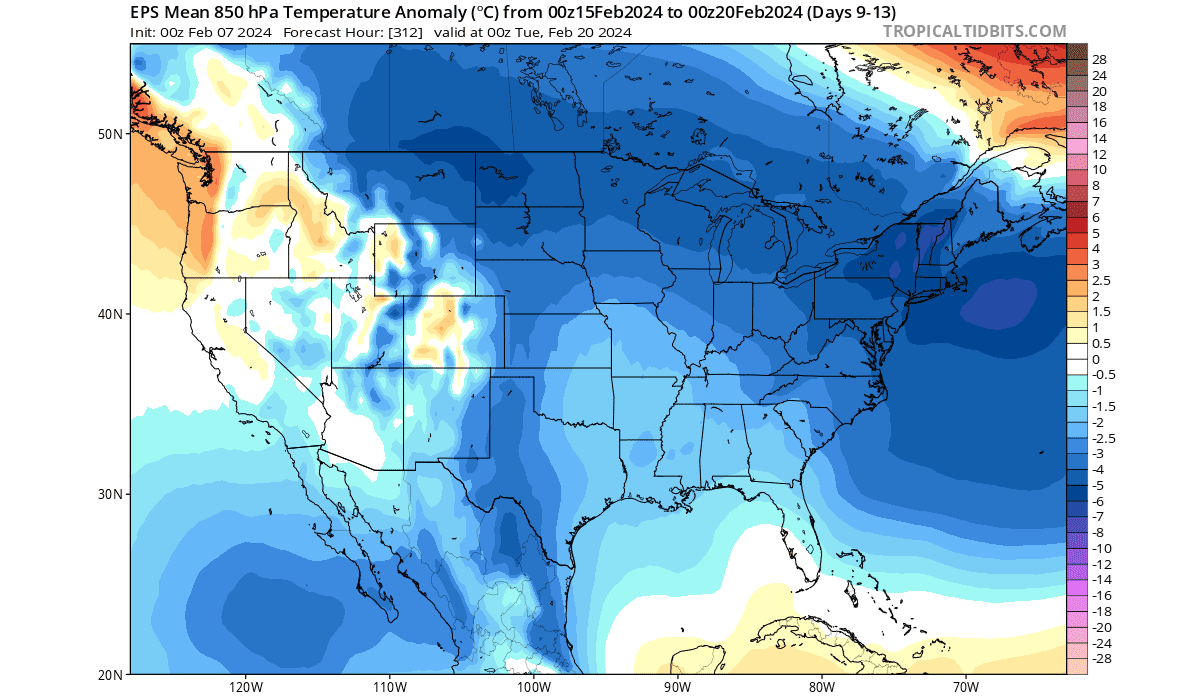
This forecast is still in the day 9-13 day range, so it is in the far medium range and is also an ensemble forecast. That means it does not show the full potential of the cold airmass due to the range, as it gets diluted in the forecast. As the period gets closer, the true extent of the cold airmass becomes more evident, while here, we only look at trends in this range.
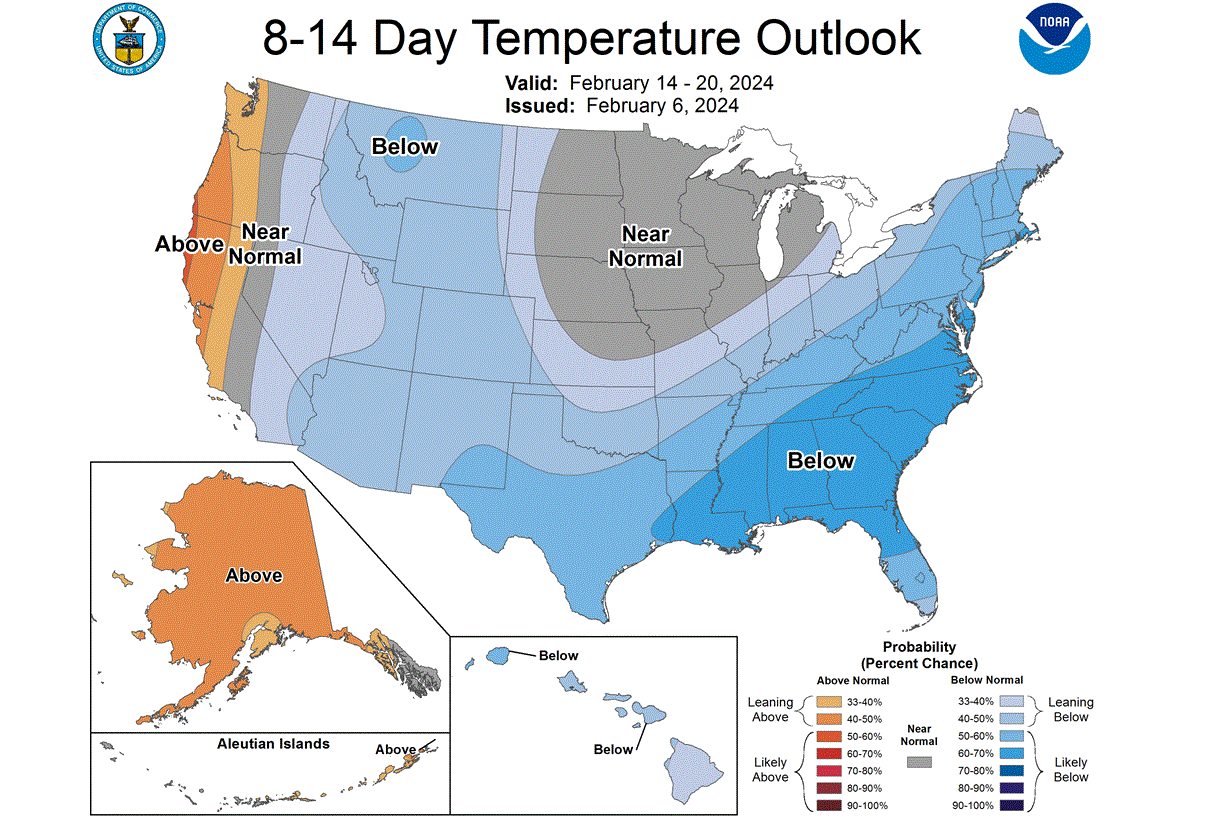
Below is the official NOAA temperature outlook for the day 8-14 period, also indicating the cold airmass is starting to return across the United States. Keep in mind that this is still in the far medium range, so this is just the current evolving forecast trend.
But the effects of a stratospheric warming event can reach far beyond the medium range, so we will also look at the extended-range forecast to indicate the latest trends and potential weather evolution over the United States following these events.
EXTENDED-RANGE FORECAST (UPDATED)
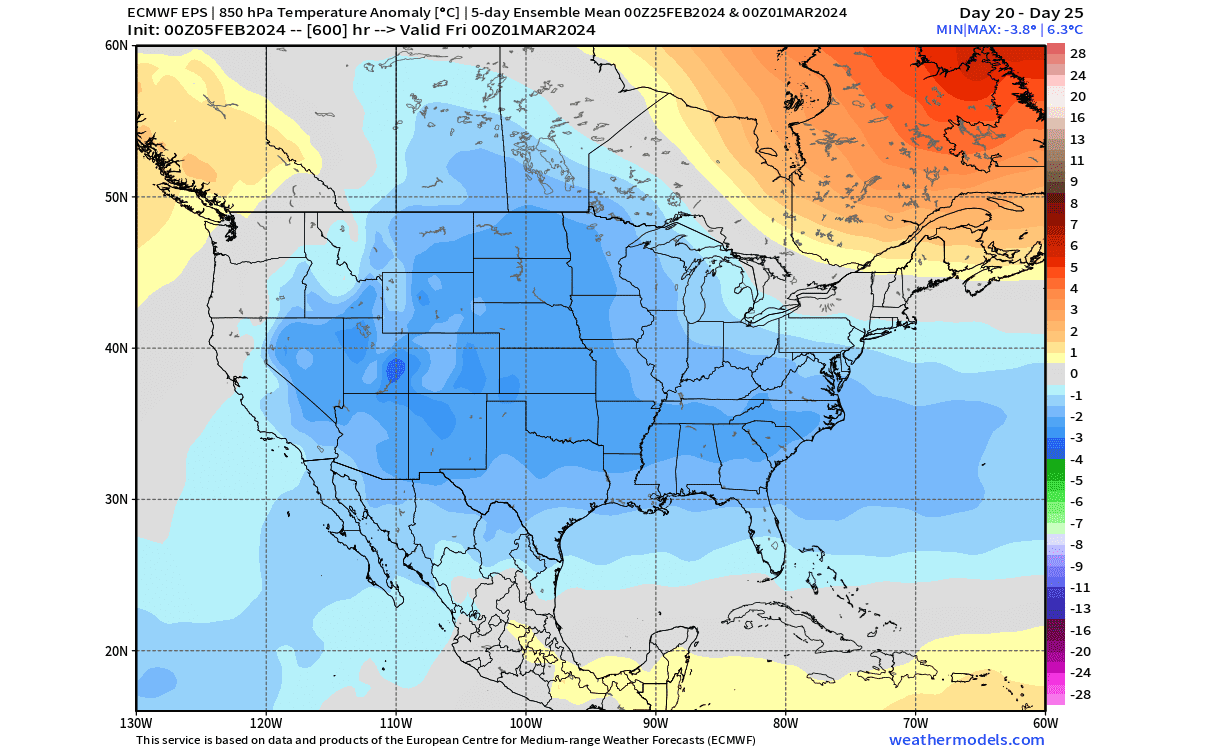
The ECMWF extended forecast below covers late February and early March. It shows a continued high-pressure area over North Canada and Greenland. That enables a low-pressure zone over much of the central and eastern United States that has the potential to persist.
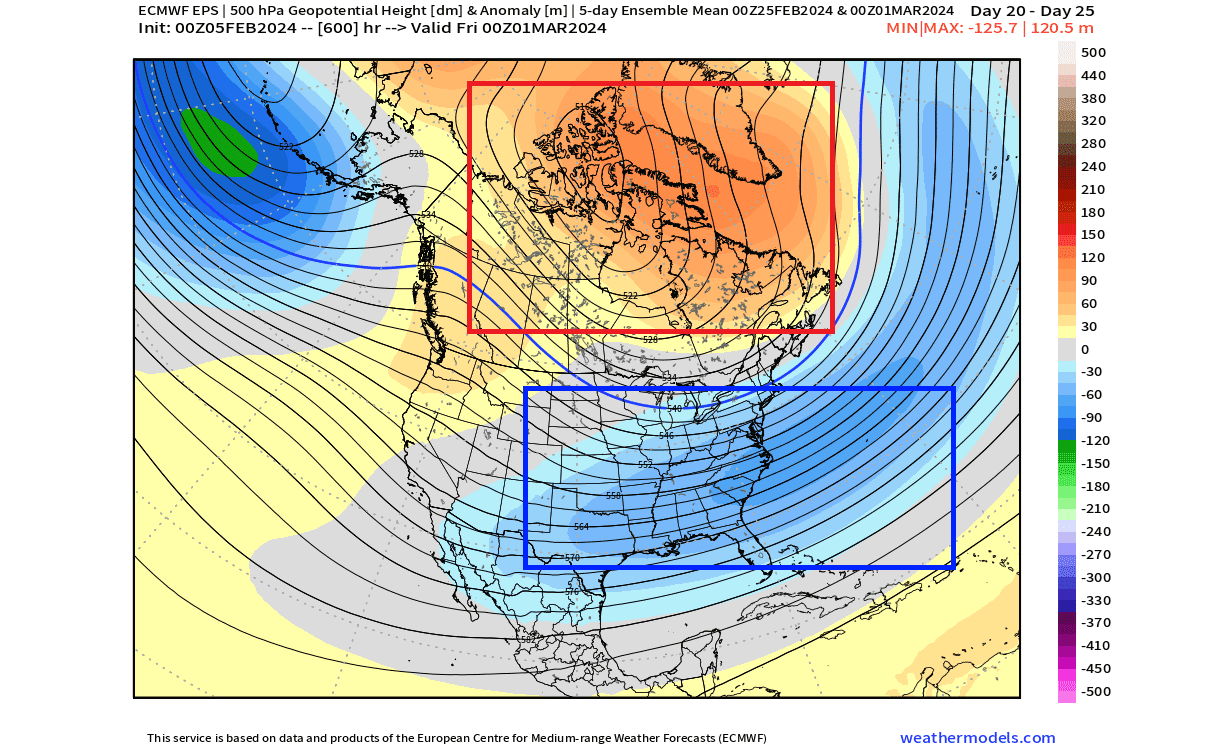
A persistent high-pressure area is often also called “blocking”. And for a good reason, as it is similar to throwing a large rock into the river. Despite the strong water flow, if the rock is heavy/strong enough, it will stay in its place and divert the water flow around it.
In a similar way, a strong high-pressure area over the polar regions can block the jet stream, diverting it and bringing low-pressure and cold air down into the United States. High-pressure systems boosted by stratospheric warming tend to stay in place longer, supporting the colder weather pattern for the United States.
The airmass temperature anomaly for the same period shows cold anomalies over much of the United States. This is likely a typical cold air evolution, starting over the northern United States and expanding into the central United States and towards the east.
These extended-range forecasts are just used to uncover weather trends. But knowing that an atmospheric disruption event is likely gives good confidence in these scenarios. Especially as we can see from past examples it creates exactly such weather patterns over the United States.
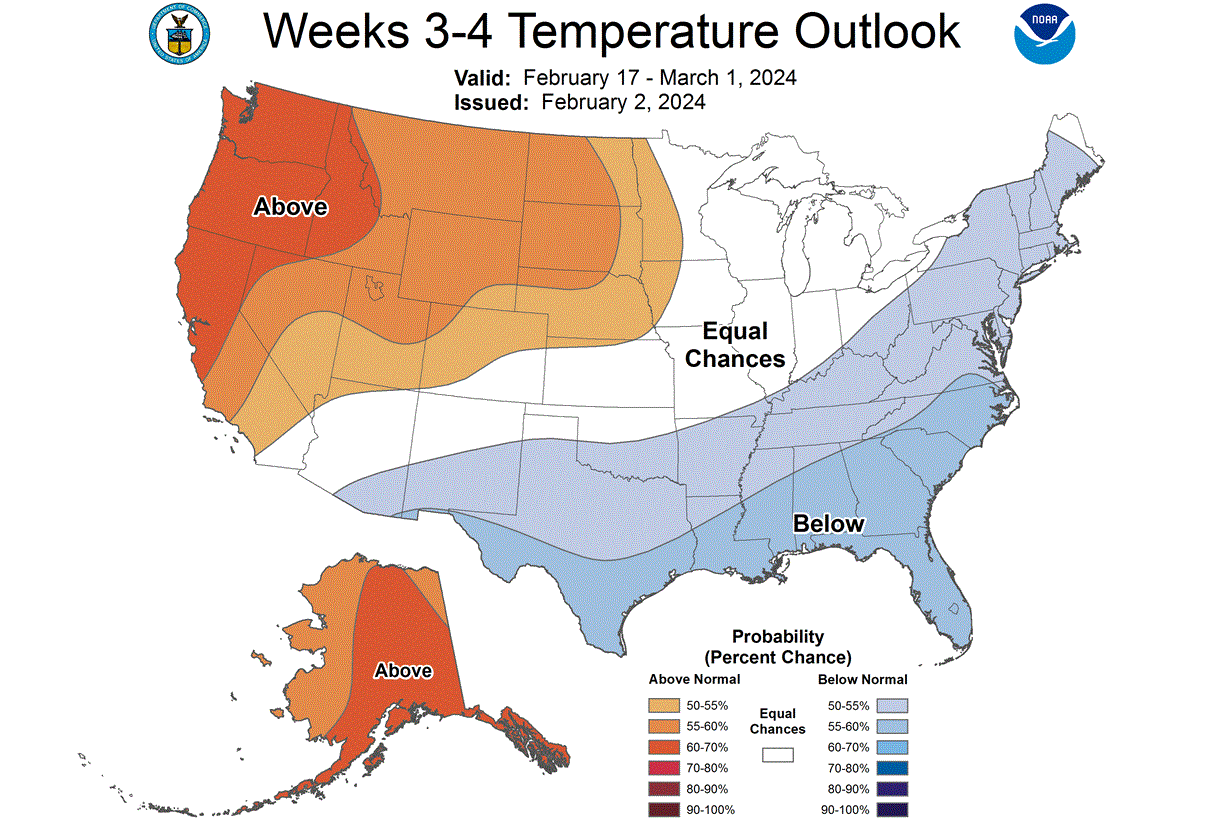
Below is the official NOAA week 3-4 temperature outlook, which indicates a colder trend for the eastern and southern United States. But this is still a more conservative forecast, as the latest one was released five days ago and is not regularly updated. As this period gets closer, a new update will likely show an improved cold trend also into the central and northern United States.
Below is the updated snowfall forecast for the last third of February. There is increased snowfall potential across the Midwest, the Northeast, and the elevations of the western United States. Some snowfall is also evident across the Central Plains.

This is just an ensemble average, so the values are not that important in this range. But it gives us a calculated estimate of which areas across the United States are most likely to see a higher/lower amount of snowfall in the upcoming weather games between the stratosphere and the lower levels.
Below is a new section of the article, that shows the latest seasonal forecast data for March, based on the ECMWF weather model.
MARCH 2024 U.S. WEATHER
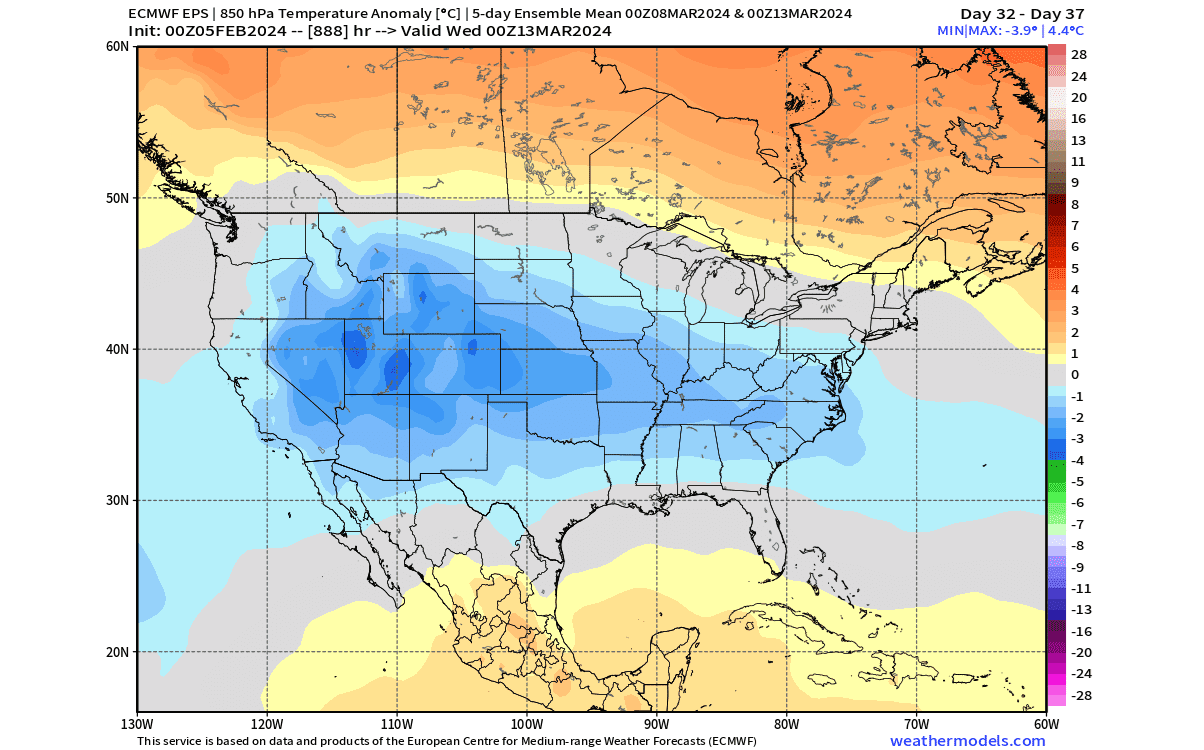
Looking ahead into the first half of March below, you can see the continued trend of below-normal temperatures across much of the United States. This indicates a stable blocking pattern over the northern regions, disrupting the jet stream and diverting low-pressure systems and colder air to the south.
But let’s look at the latest seasonal forecast for March 2024 as a whole. The surface pressure forecast over the United States shows a persistent area of low pressure over the central and eastern United States. This is usually expected in a blocked polar pattern, boosted by stratospheric warming, which diverts the jet stream, as we discussed above.
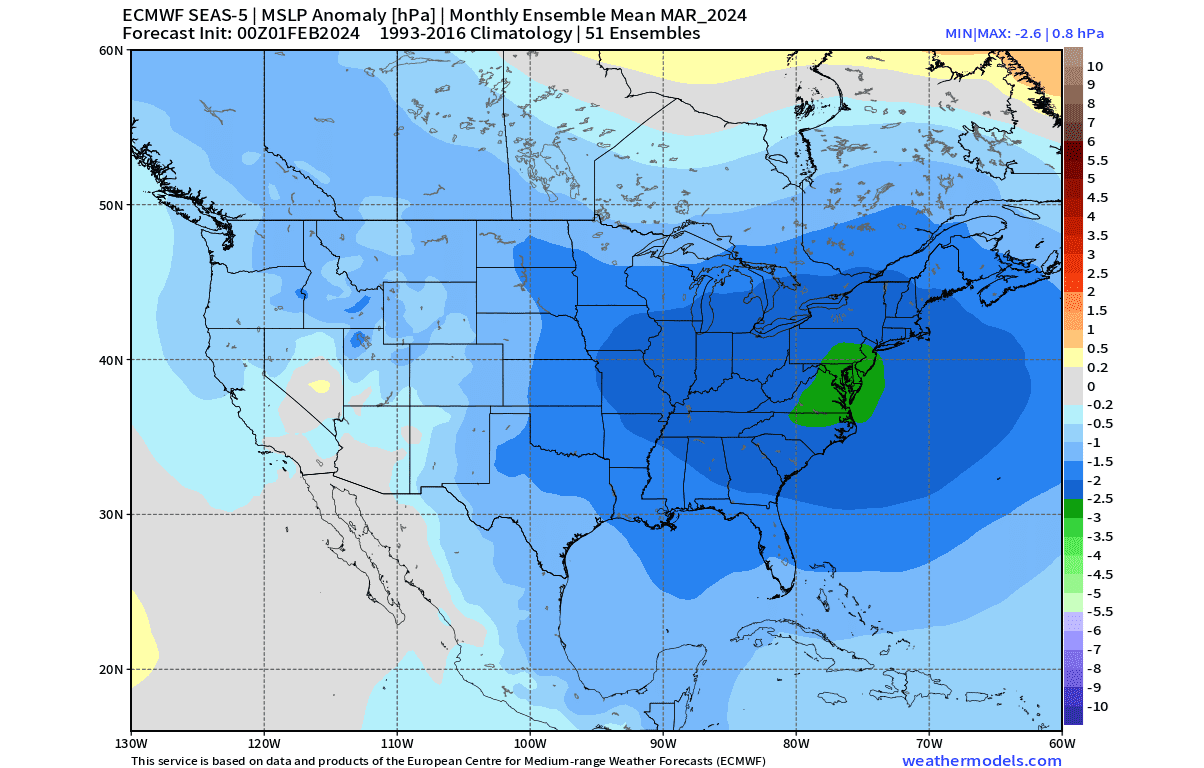
A low-pressure area in this region promotes a northerly to northeasterly flow into much of the Midwest, eastern United States, and across the plains. Northerly winds usually mean cooler air, so this is the best pattern to create a cooler first month of Spring.
The seasonal temperature forecast for March below shows a less cold pattern than one might expect. But it is an average image of the whole month. So, if we know that the month will start out colder, it tells us that it will likely end in a warmer pattern. Still, you can see the lower-than-normal temperatures across the southeastern and eastern United States and over the southwest.

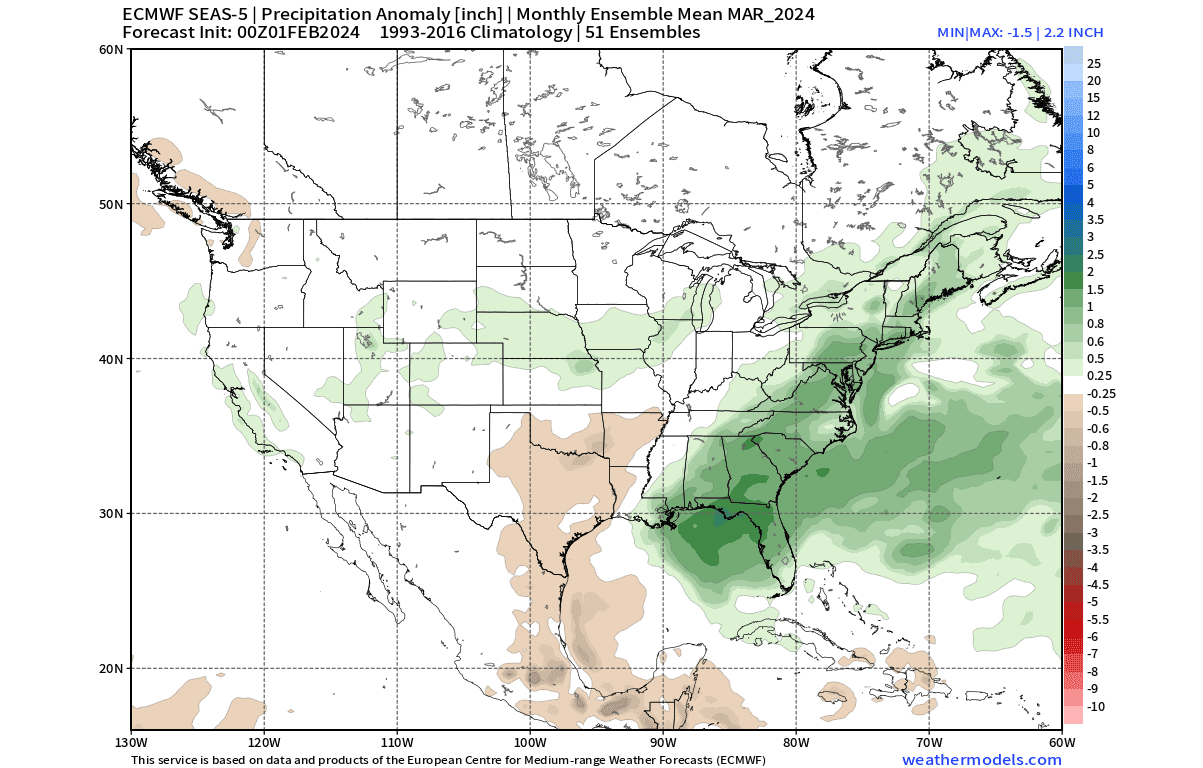
The precipitation forecast for March shows increased precipitation over much of the eastern United States and parts of the Midwest. Combined with cooler temperatures, this gives us good early Spring snowfall potential across the upper Midwest, the northeastern United States, and parts of the East.
Overall, the stratospheric warming signature is strongly visible in the March forecast across the United States. But we also must give credit to the El Nino event, which usually promotes a more dynamic winter weather pattern in the final weeks of the season and into early Spring.
We will keep you updated on the global weather pattern development, so bookmark our page. Also, if you have seen this article in the Google App (Discover) feed, click the like button (♥) there to see more of our forecasts and our latest articles on weather and nature in general.
Don’t miss: