The El Niño event has reached its peak and is now headed for a rapid breakdown, the latest data shows. But as the ocean anomalies start to dissolve, its atmospheric impact will persist into spring, with forecast data showing clear weather impacts across the United States and Canada.
Ocean anomalies play an important role in atmospheric circulation and our weather on smaller and larger scales. But the ocean and the atmosphere also play a game of cat and mouse, impacting each other.
We will first look at the latest data on El Nino, when it is forecast to disappear, and what NOAA expects to come after it. Early indications show that we could rapidly enter a cold ENSO phase later in the year, the La Niña, which would play a major role in the next Winter 2024/2025.
WHERE OCEAN MEETS THE ATMOSPHERE
El Niño Southern Oscillation (or ENSO) is a region of the equatorial Pacific Ocean that changes between warm and cold phases. Typically, there is a change around every 1-3 years from one phase to another.
Currently, we are in a warm phase called El Niño, which has now reached its peak and is expected to break down over Spring. The cold phase of the ENSO is called a La Niña.
The image below shows the ENSO regions across the tropical Pacific. The main region is seen in the image as the Nino 3.4 region. This area covers parts of the eastern and western tropical Pacific and is where the ENSO phase is determined.
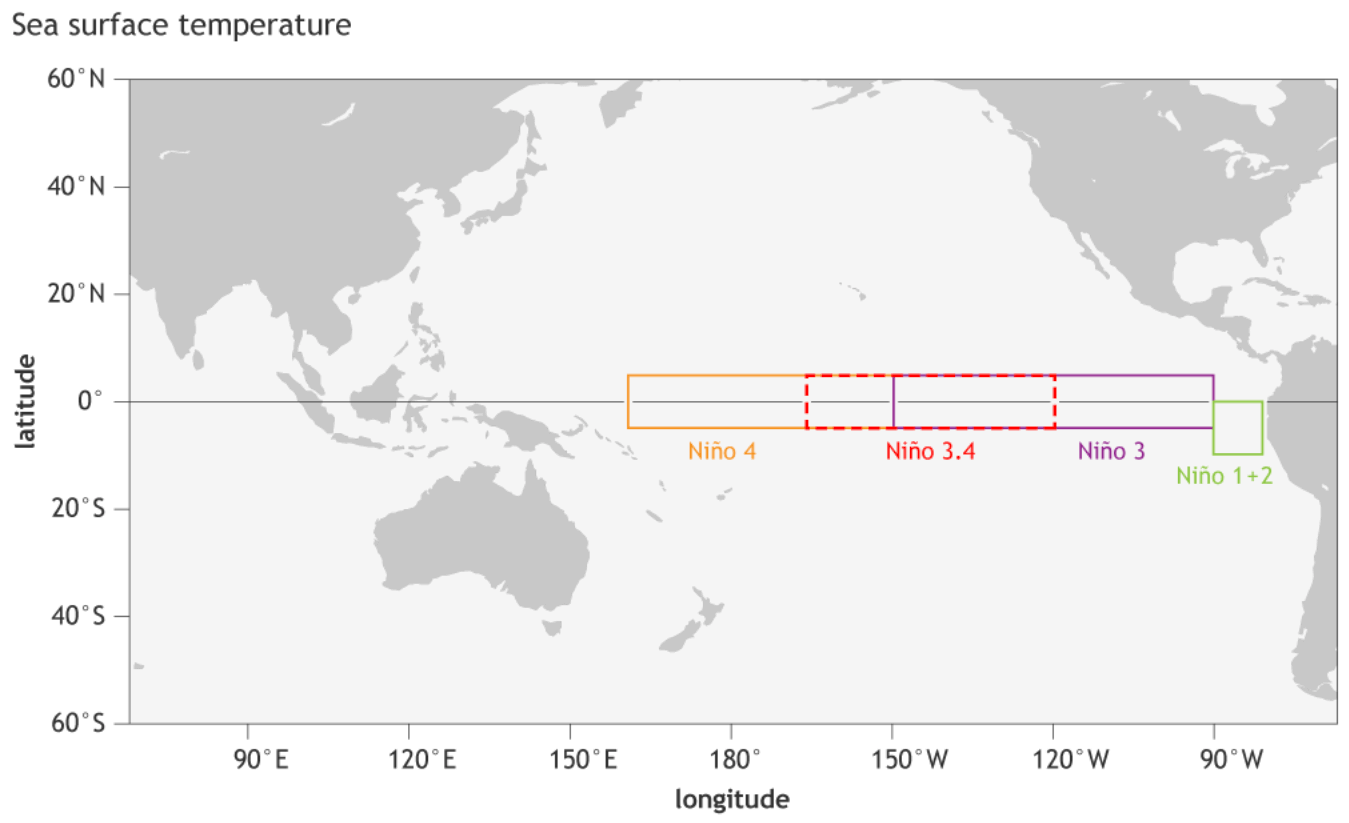
Each ENSO phase influences the pressure and weather in the tropics differently. This affects the overall global circulation over time, changing the seasonal weather patterns worldwide, but the main impacts are first felt closer to the main region.
Below is an image of the mid-winter ocean anomaly analysis from NOAA. The El Niño stands out as an area of above-normal ocean temperatures across the equatorial Pacific Ocean. This anomaly affects the atmosphere but also indicates pressure pattern changes on a global scale.
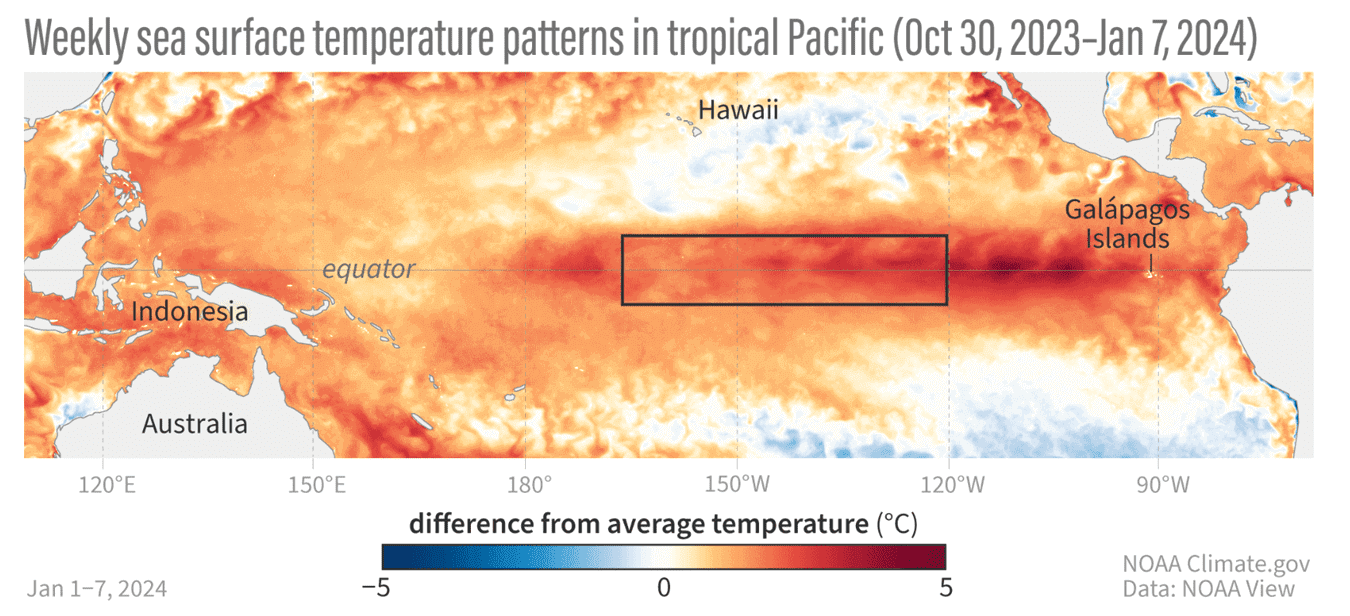
These pressure changes in the tropics translate into global circulation over time, affecting seasonal weather over both Hemispheres. We can observe a global shift in pressure patterns during the emergence of an ENSO phase.
The following image below from NOAA Climate shows the typical circulation during an El Niño event.
Air rises over the central and eastern Pacific, causing more storms and precipitation and lowering the pressure over the region. At the same time, the air descends in the western Pacific, causing stable weather and high-pressure conditions.
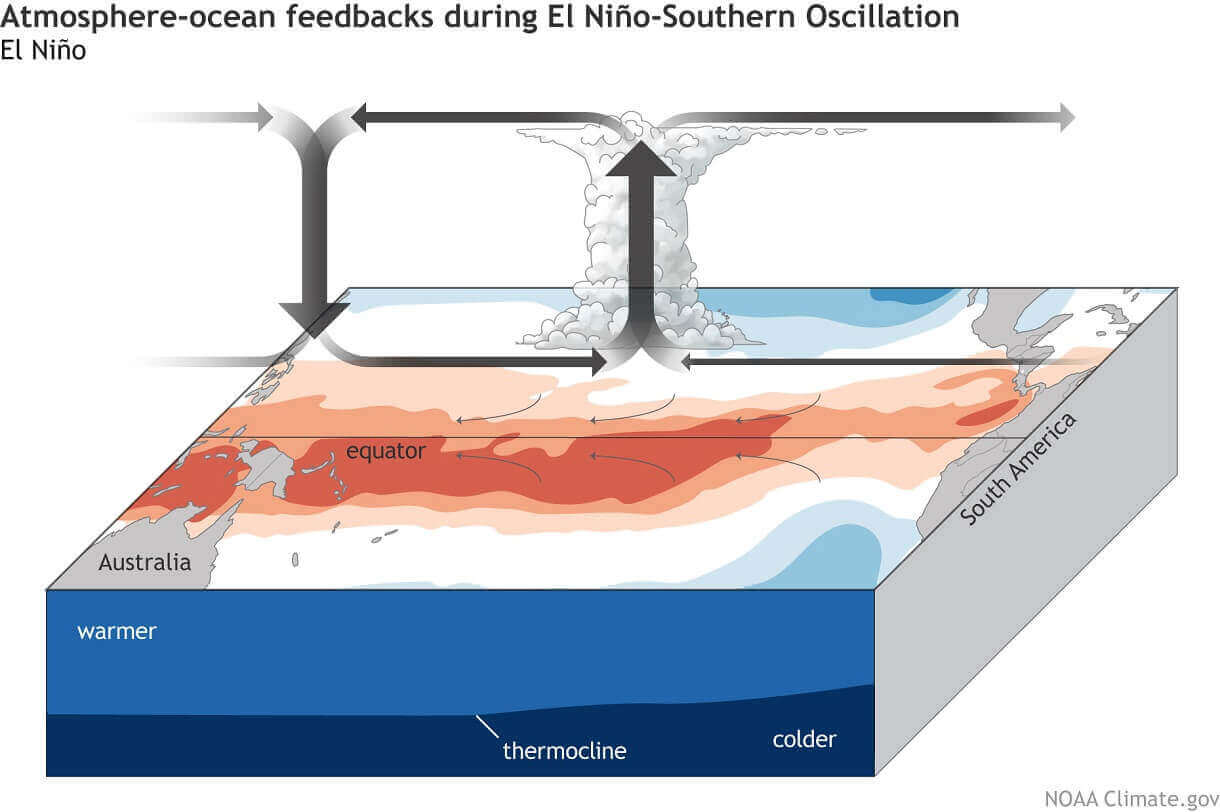
This way, ENSO strongly impacts the tropical rainfall and pressure patterns, affecting the ocean-atmosphere feedback system. Through this ocean-atmosphere system, the ENSO also influences the weather globally.
We can see this atmospheric motion using a special parameter called the “velocity potential”. To keep it simple, it allows us to see where the atmosphere rises and sinks. This is one way we can track the influence of the El Niño spreading globally.
In the image below, this motion anomaly can be seen in blue (rising air) and brown (sinking air) colors. Blue areas indicate rising motions and lower pressure, as indicated over the ENSO regions in the Pacific. You can see sinking motion and higher surface pressure tendency to the east and west of the ENSO regions.

This way, we can see the active influence of El Niño on atmospheric motion, which also translates into weather impacts.
REACHING PEAK POWER
The latest ocean temperature data shows ongoing warm anomalies in the tropical Pacific. The strongest anomalies are around 2-3 degrees Celsius above normal. This is, by all means, an active El Niño, but we are starting to see signs that the countdown to its demise has begun.
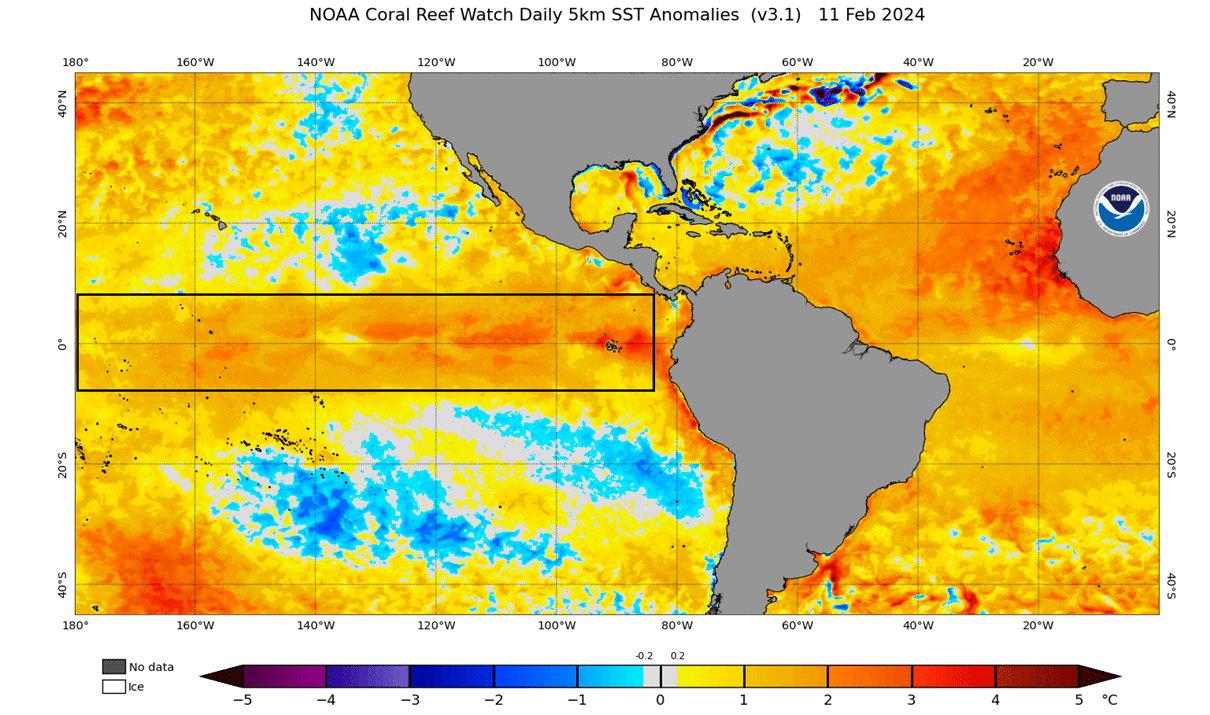
For example, you can compare the latest image above with the analysis from January below. Just last month, the warm anomalies were stronger across the entire region, also showing a more compact shape of the anomalies.

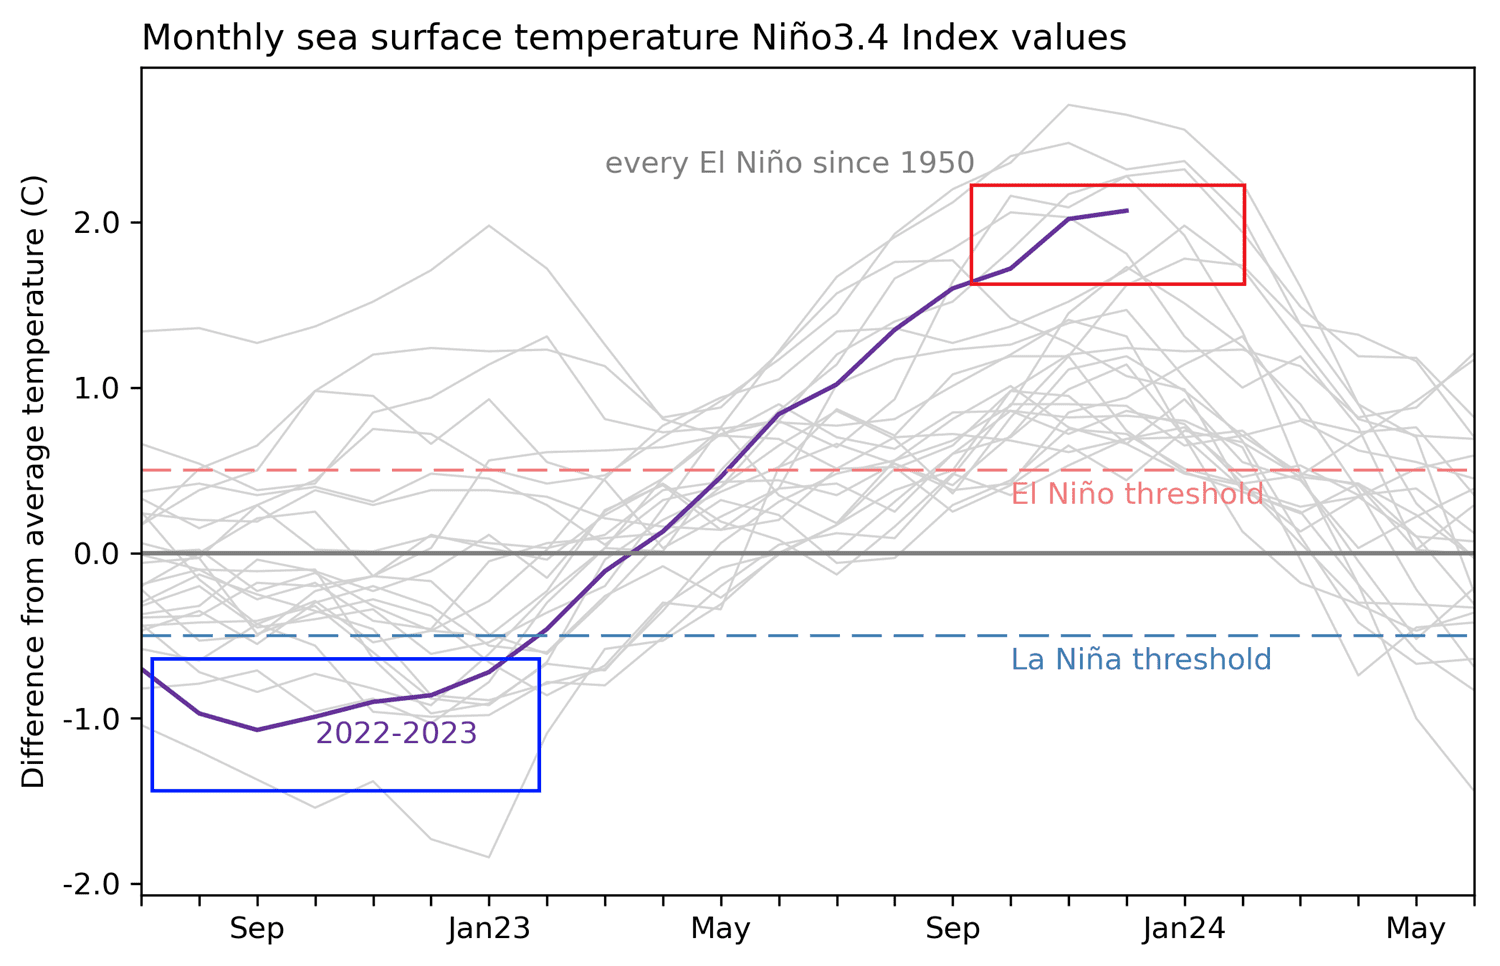
Below is the ENSO region anomaly data for the 2022-2024 seasons. Notice the rapid rise in ocean temperatures last year, as the region was coming out of an active cold phase. The red box shows the latest values for the ENSO region in January, showing that El Niño has already reached its peak.
Another example of the El Niño already being past its peak can be seen if we look below the ocean surface. These events are far from superficial, usually with temperature anomalies going several hundred meters below the ocean surface.
Below is the latest analysis of the ocean temperatures below the surface. You can see the warm anomalies close to the surface, which is the last stand of the El Niño. But going just 100 meters (30ft) below the surface, we can find a large pool below normal ocean temperatures. Image by NOAA Climate.

A strong subsurface cold pool is the main pre-condition for an El Niño breakdown. With the aid of the trade winds and ocean currents, these subsurface anomalies move from west to east, eventually coming to the surface over the eastern Pacific.
You can see this process in the video below, produced from NOAA subsurface data. It shows the ocean temperature anomalies for the past two months. You can see a rapid breakdown of the warm pool below the surface.
In January, we saw a strong expansion of the cold pool towards the east. It has begun to erode the warm anomalies and is expected to reach the surface sometime in the next weeks/months.
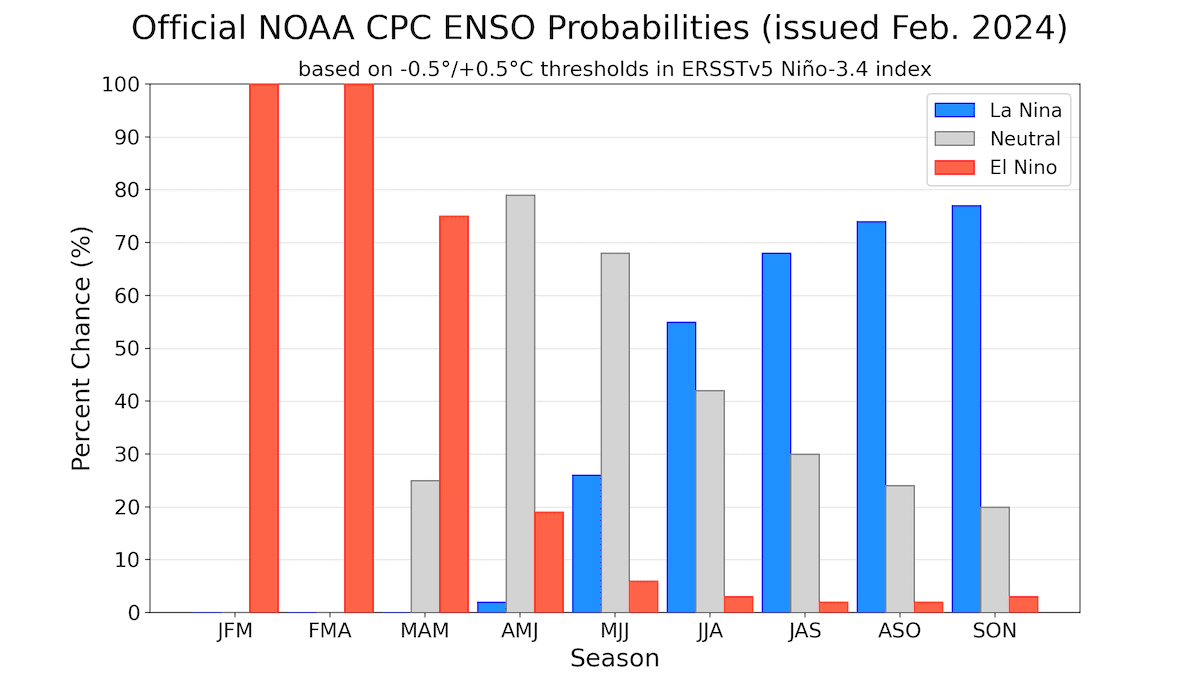
The subsurface temperature changes have prompted the Climate Prediction Center to issue an official La Niña watch, which is the cold phase of the ENSO. The latest outlook gives a greater than 50% chance of a La Niña impacting the Winter season of 2024/2025.
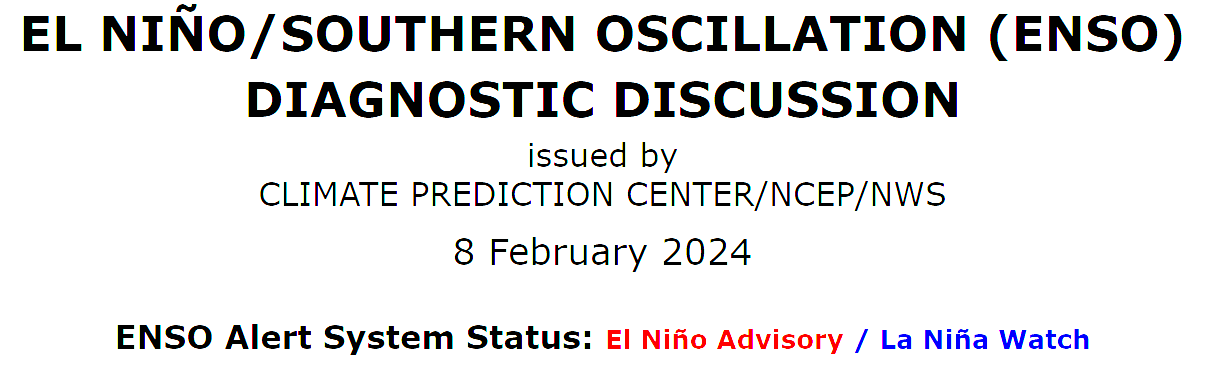
In their latest discussion, they write: “A transition from El Niño to ENSO-neutral is likely by April-June 2024 (79% chance), with increasing odds of La Niña developing in June-August 2024 (55% chance)…”
It means that the atmosphere will have to transition from one ENSO event to another at a relatively rapid pace. Nothing is certain at this point except for the breakdown of the warm El Niño event.
OCEAN FORECAST DATA
Below is a simple CPC analysis/forecast graphic that shows the long-range forecast for the main ENSO region. You can see the seasonal outline of the expected ENSO phases, clearly showing the current warm phase breakdown and the emergence of a potential cold phase into late 2024 and 2025.
This would be a rather rapid transition, but such occurrences were seen many times in the past. Since 1950, over half of the El Niño events were followed by a transition into a La Niña event in the same year.
The IRI multi-model predictions show the consensus that El Niño has already peaked in power. The combined forecasts from several different forecasting systems show a good consensus that we are on a transition course into a cold ENSO event by Fall 2024.
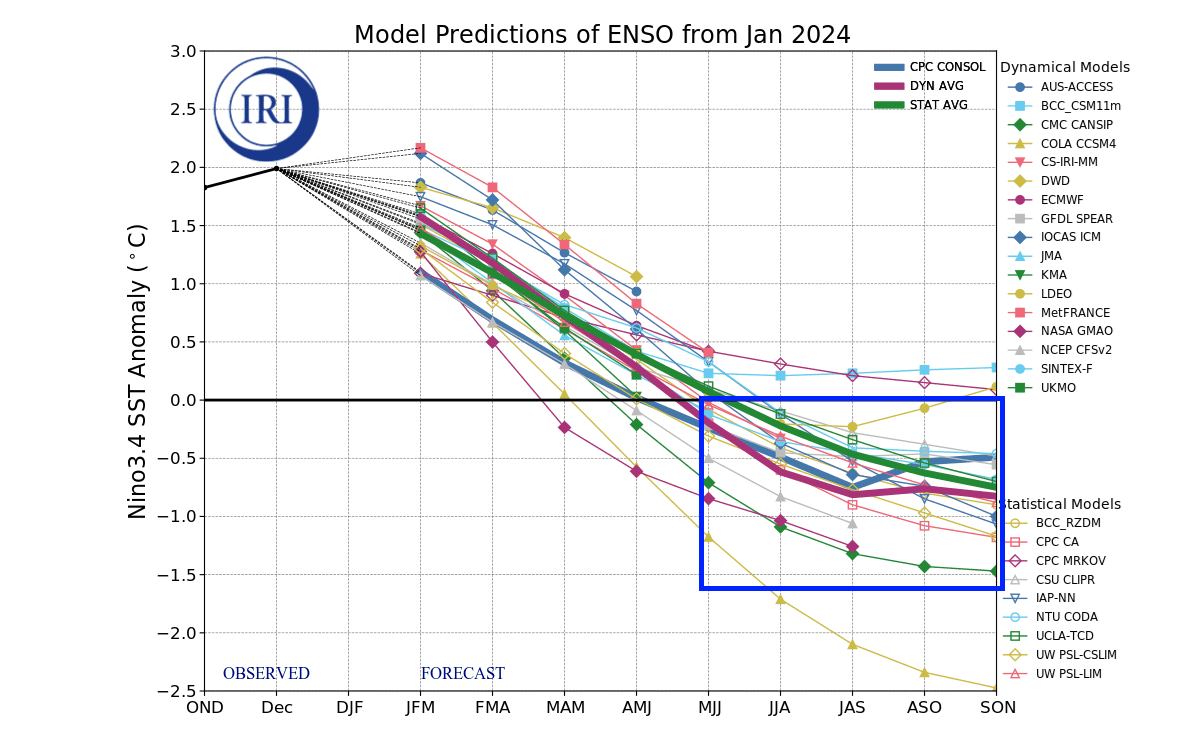
From this forecast, we can see that the El Niño event is expected to completely disappear before the Summer, with its atmospheric influence also likely to drastically reduce by early summer.
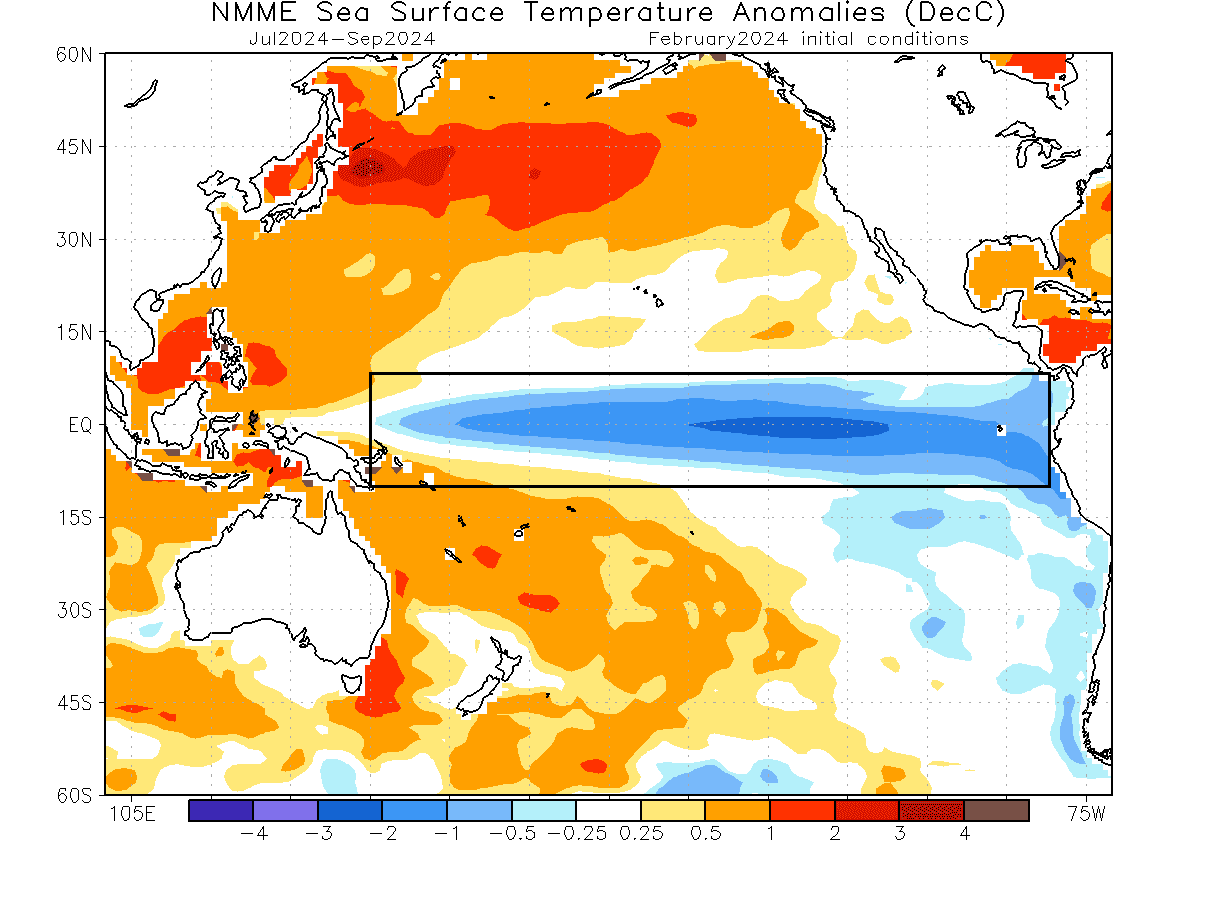
Looking at the Winter 2023/24 ocean forecast by the multi-model forecast, you can see an area of cold ocean anomalies expanding across the entire tropical Pacific by early Fall 2024. An event of this magnitude is strong enough to have a profound atmospheric response during the Winter 2024/2025.
Based on all this forecast data, we know that the days are counted for El Niño. But, such large-scale events tend to work on longer time periods. This means that despite a rapid breakdown of the warm ocean anomalies, the atmosphere can take some time to adjust and respond to that.
For this reason, we will look at the upcoming Spring forecast data, which still shows a strong El Niño signal lingering in the atmosphere. We will focus on North America, as it is close to the source region of El Niño impacts and tends to still feel its influence, despite the event now declining.
EL NINO ATMOSPHERE PERSISTS
During an El Niño season, we usually see a strong and persistent low-pressure area in the North Pacific. That tends to persist into spring. Below is the expected spring pressure pattern across North America under an El Niño influence, based on 42 years of past data.
You can see the low-pressure anomaly extending from the North Pacific into the United States. This usually creates an amplified subtropical jet stream, bringing lower temperatures and more precipitation across the southern and eastern United States.
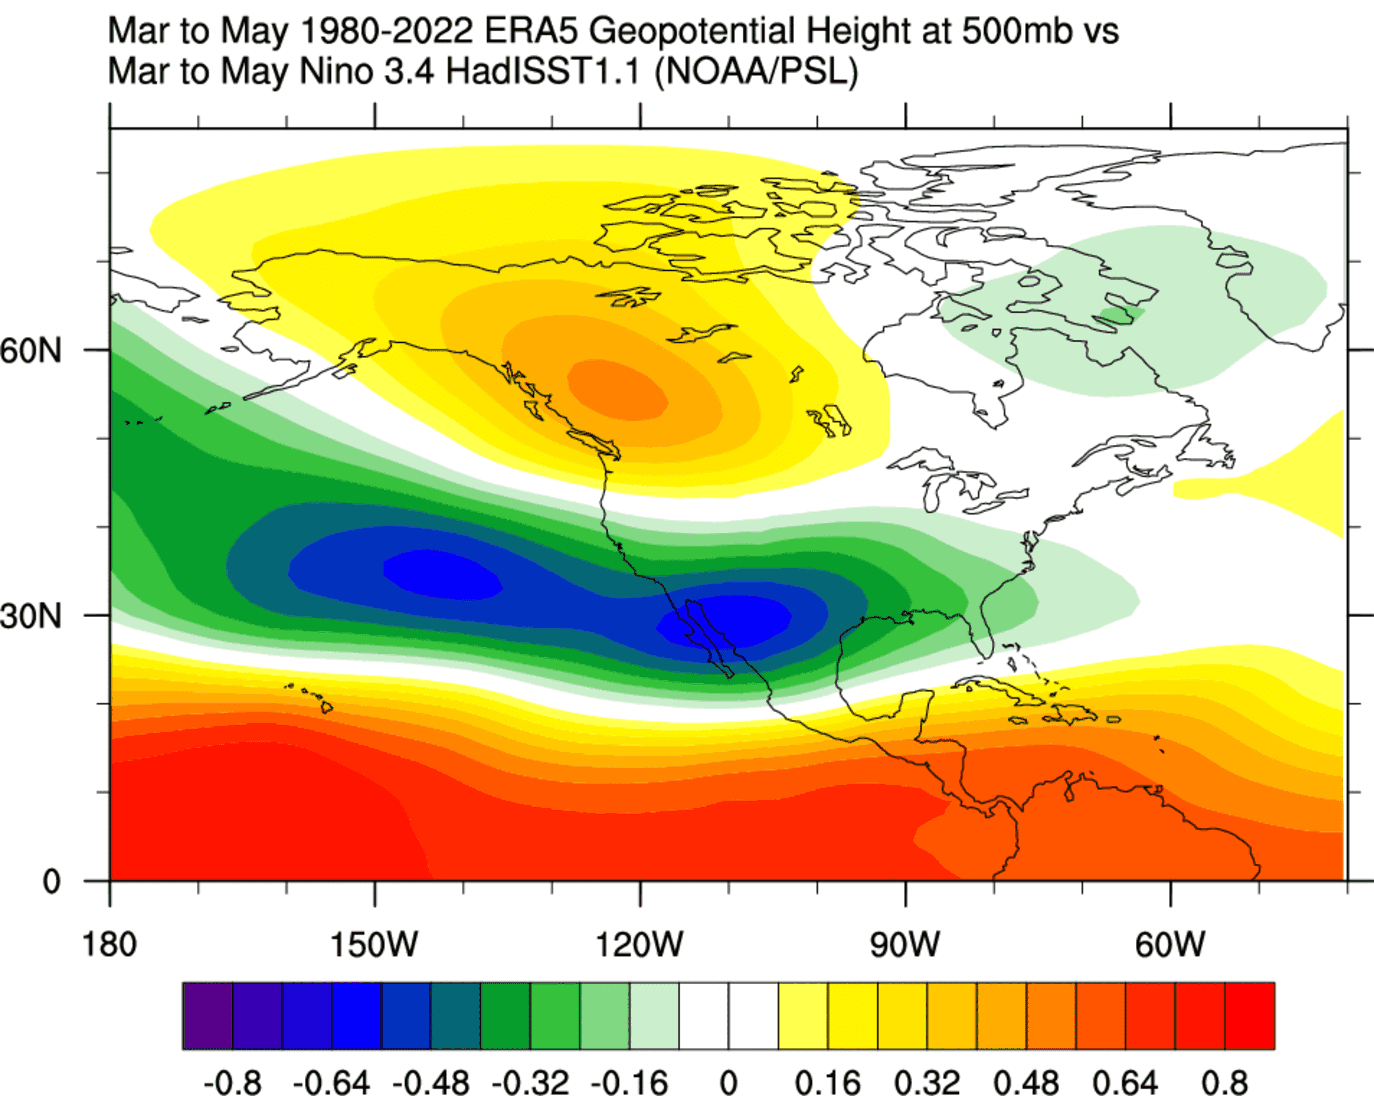
A high-pressure anomaly over western Canada means warmer and drier conditions across the northern United States and western Canada. Overall, this pattern is very similar to what we have seen this winter so far.
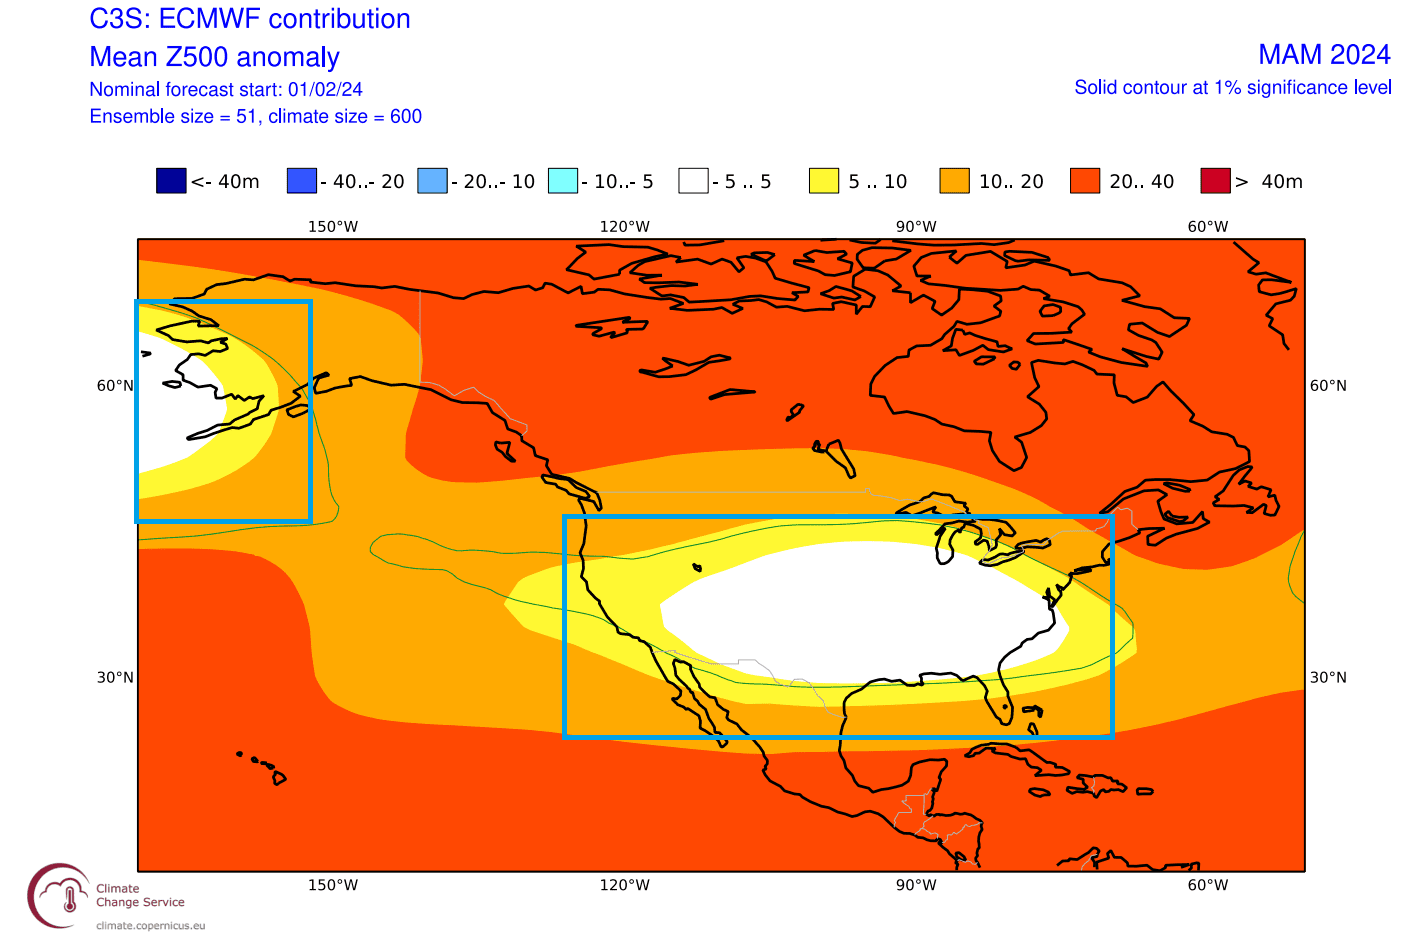
Below is the actual ECMWF pressure pattern forecast for Spring. You can pretty much see a very similar pattern to the expected El Niño signal above. A low-pressure area over the United States and a high-pressure zone over Canada. This shows that the El Niño signal continues across the atmosphere, despite breaking down in the ocean.
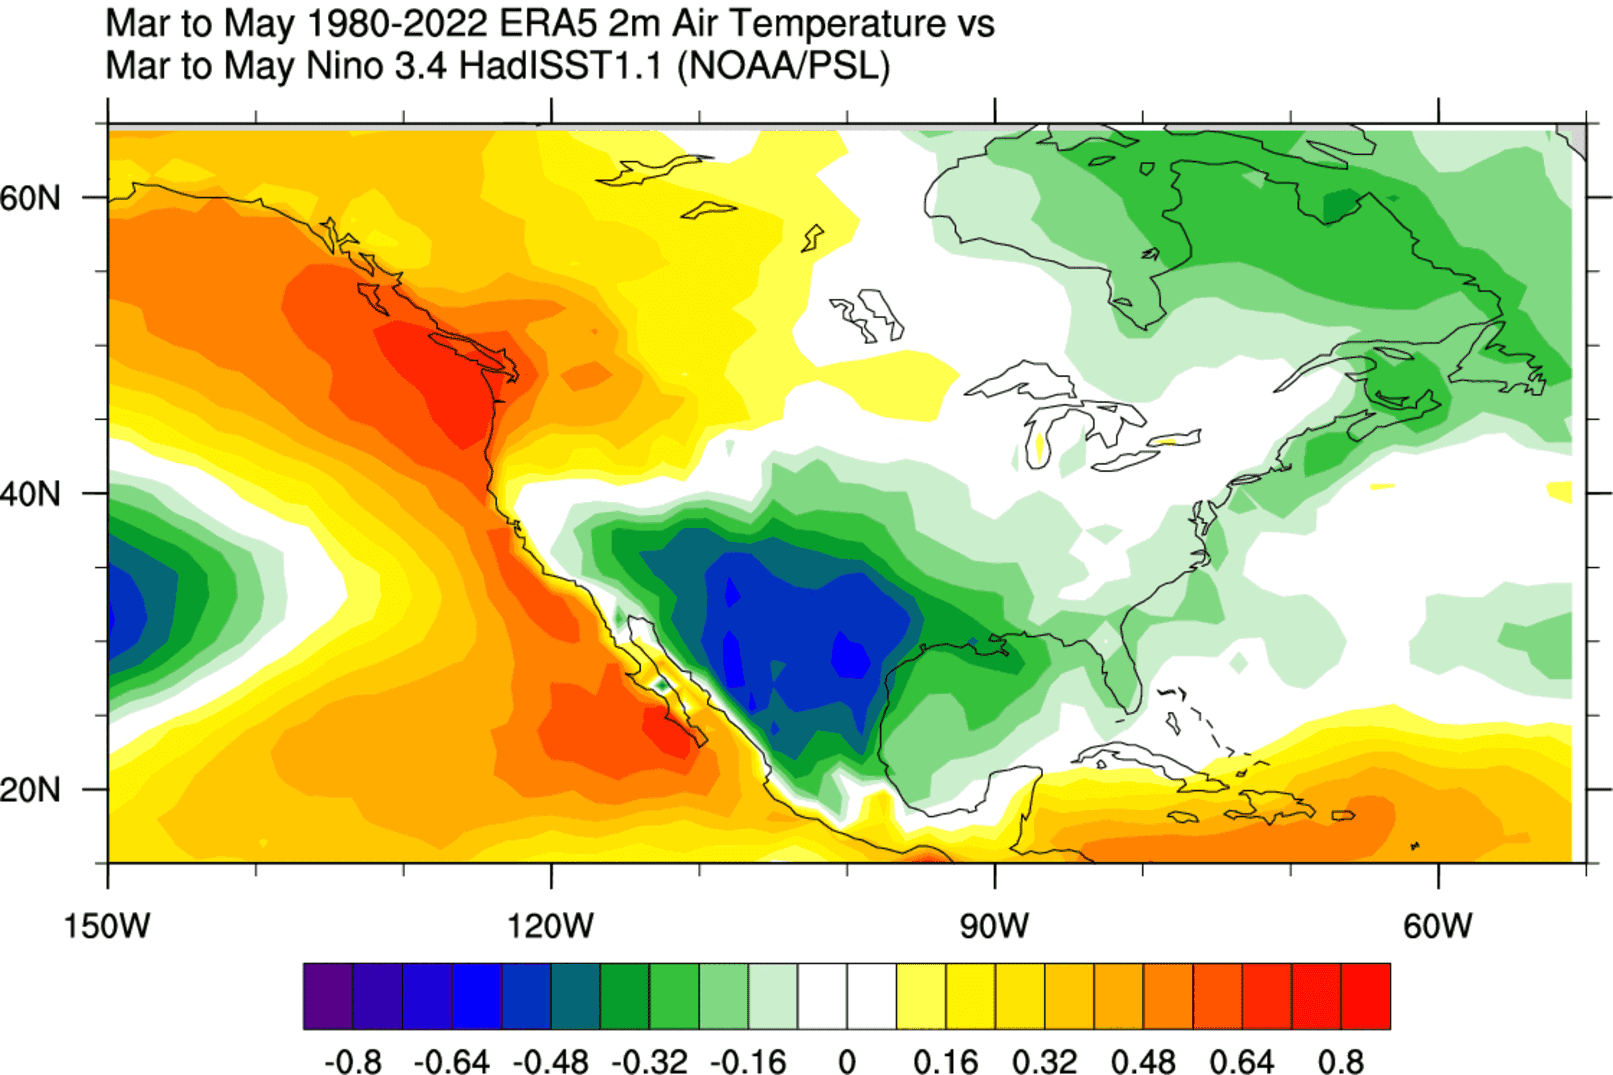
Looking at the El Niño signal in the spring temperature anomalies, you can see colder temperatures in the southern half of the United States and parts of the eastern United States. The northwestern United States is warmer than usual, with warm anomalies continuing over western Canada.
The latest temperature forecast for spring 2024 shows a similar signal overall. You can see a zone of neutral temperatures over much of the southern half of the central United States and warmth over the northern parts of the United States and southern Canada.

This temperature forecast does show an El Niño signal, with a temperature pattern separating the normal/cool southern United States and warmer northern United States and southern Canada.
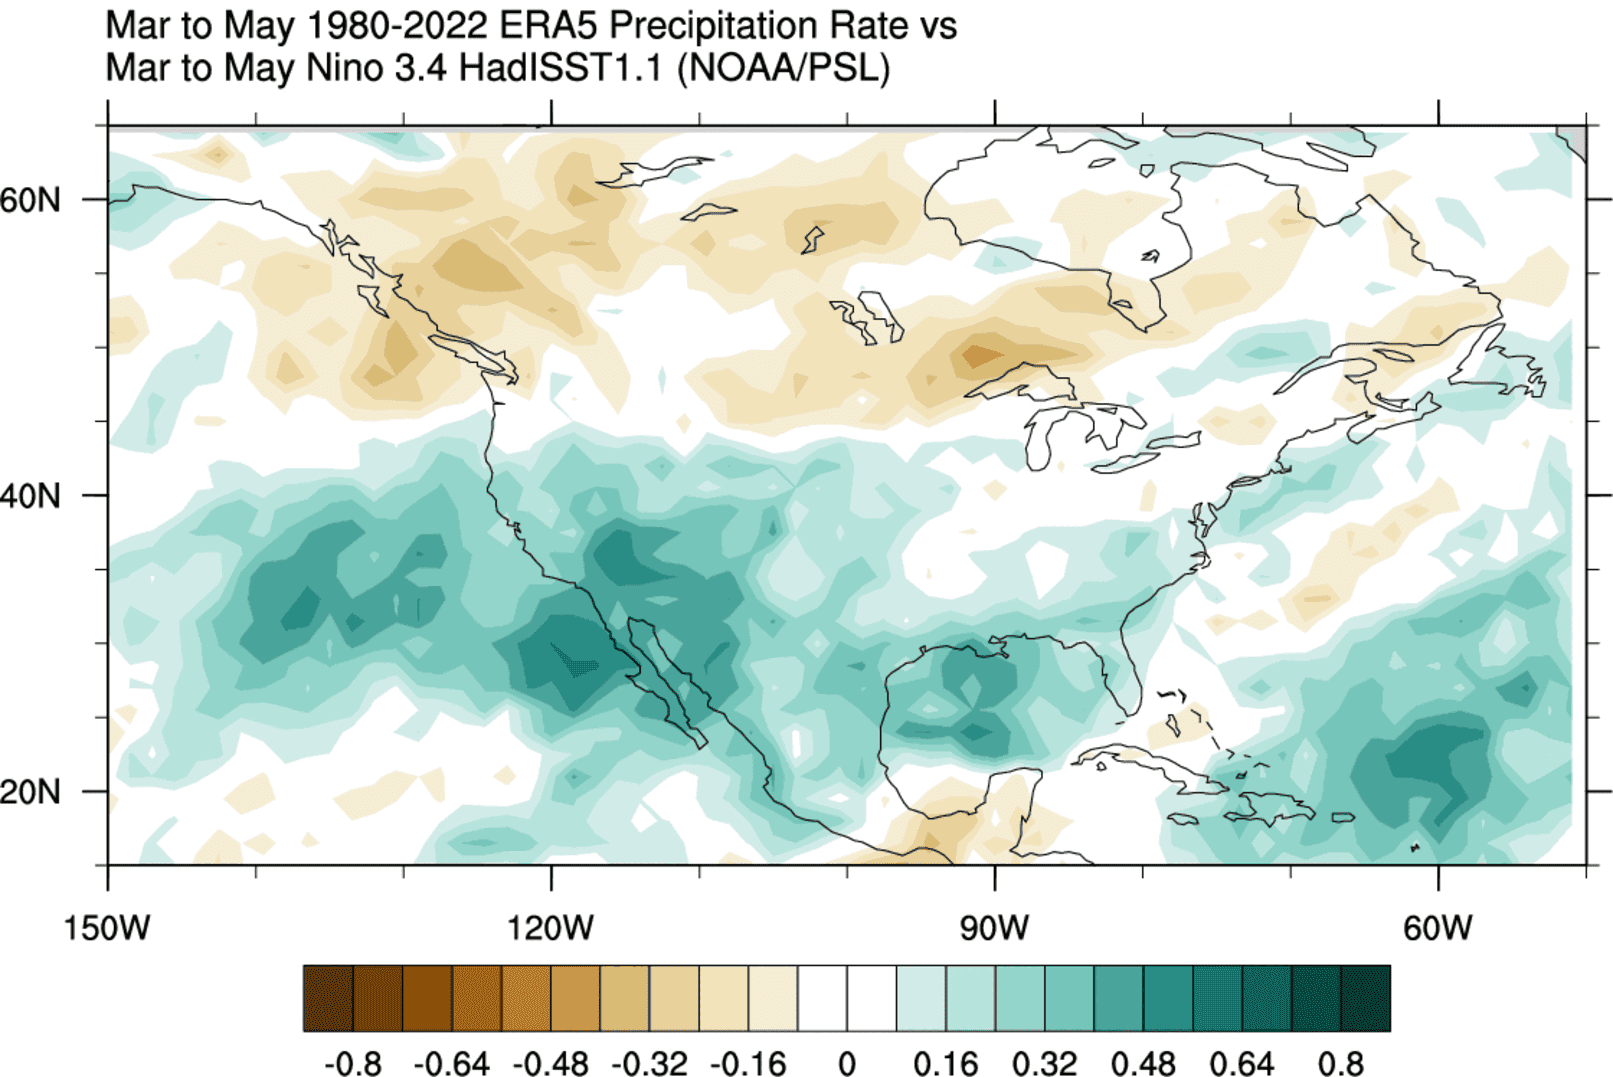
Precipitation-wise, an average El Niño spring signal shows more precipitation over the southern half of the United States and the west. Less precipitation than normal is usually expected from an El Niño over the northwestern United States and around the Great Lakes.
Below is the actual spring precipitation forecast for North America, and it does show some indications of an El Niño signal. We do see more precipitation over the western United States and over much of the far eastern United States. But we do see more precipitation than expected across the Pacific Northwest.
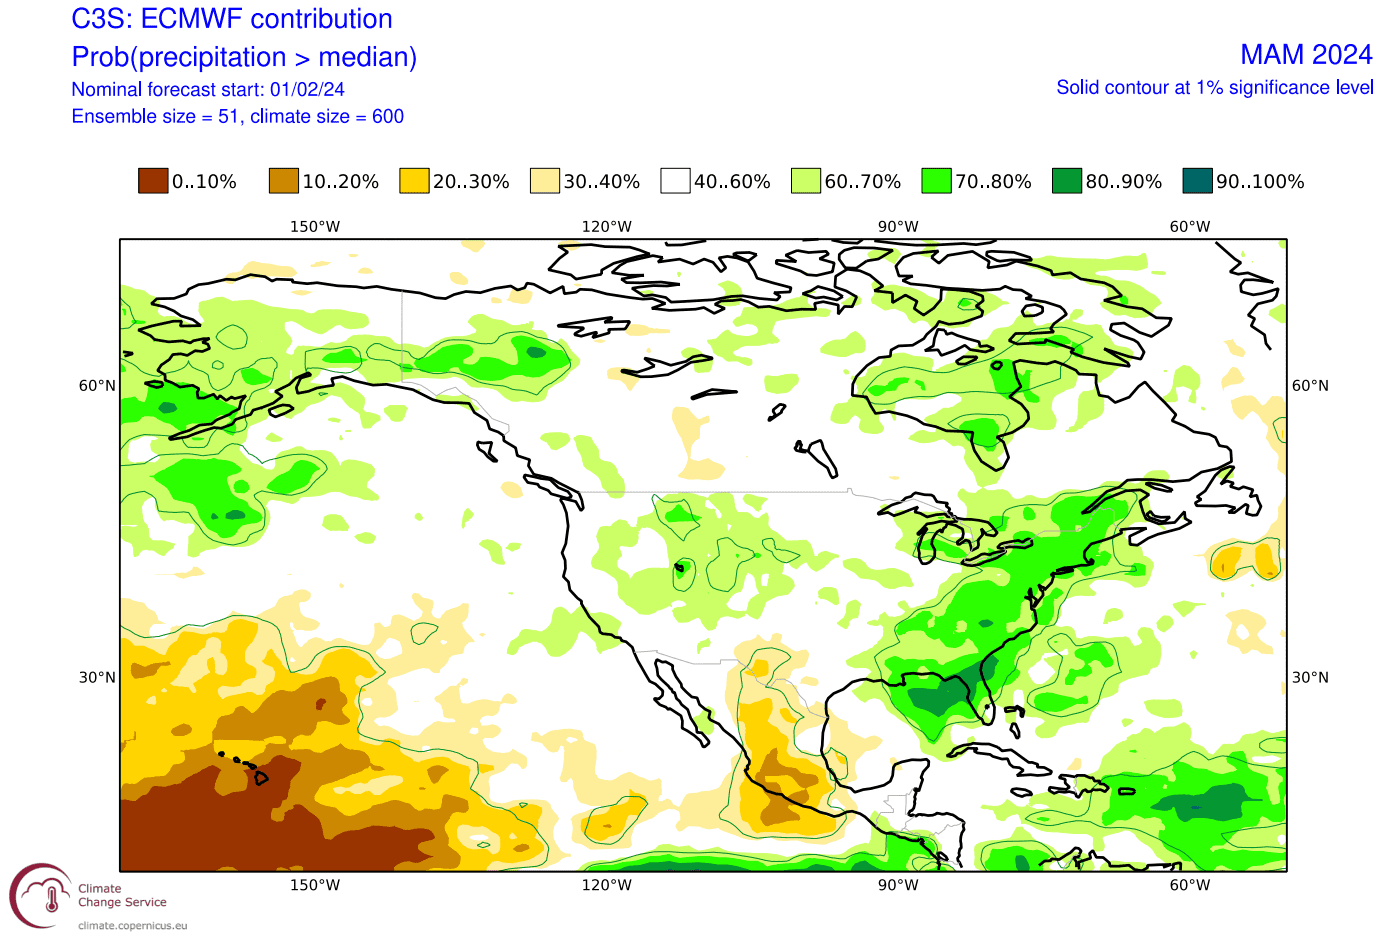
That is mainly due to low-pressure systems trailing across the southern United States. More moisture increases the precipitation amounts across the southern and eastern United States.
It is hard to find two similar winters in the data. So, despite knowing what these ocean anomalies can mean for the daily weather, each year has its distinct flavor and can create different weather outcomes locally.
We will keep you updated on global weather development and long-range outlooks, so make sure to bookmark our page. Also, if you have seen this article in the Google App (Discover) feed, click the like (♥) button to see more of our forecasts and our latest articles on weather and nature in general.
Don’t miss:
Deep snow blizzard for Northeast US and Nova Scotia ahead with Winter Storm Kayden