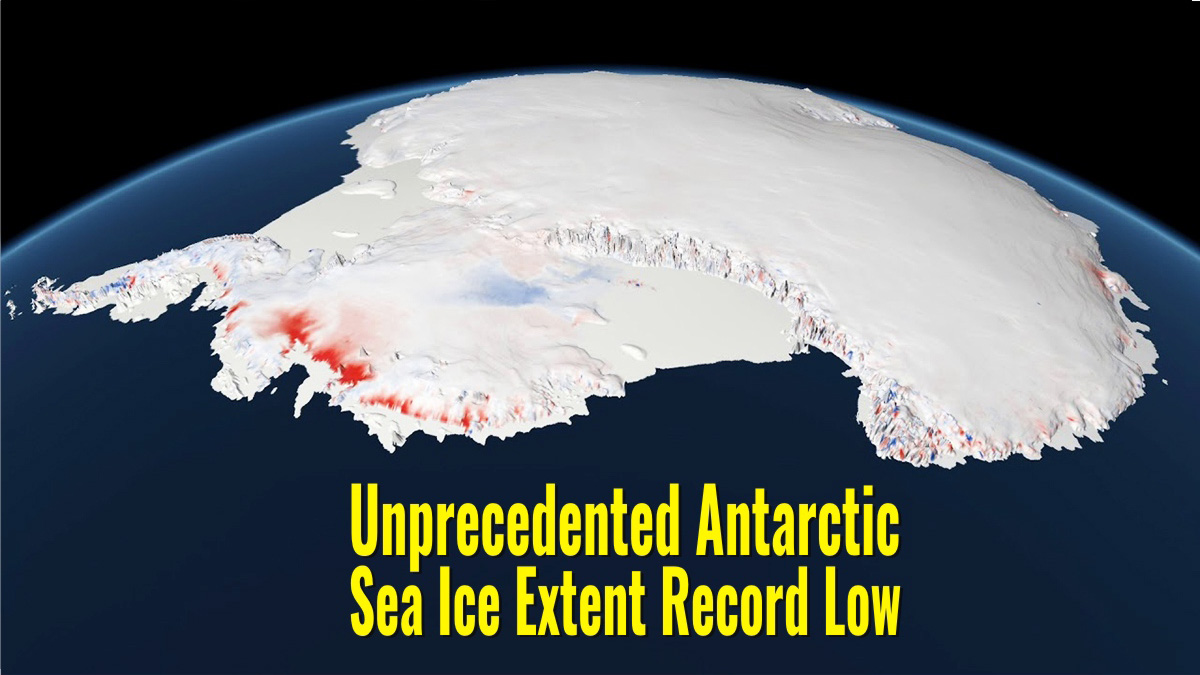
A warm summer in Antarctica and several strong föhn wind events smashed the Antarctic sea ice extent setting an all-time record low in 44 years of satellite observations. It is impressive to witness this frozen ocean melting down, and for the first time since satellite measurement began in 1979 the Southern Ocean sea ice coverage has dropped below 2 million square kilometers.
SEA ICE EXTENT
The sea ice extent is one of the key components of the polar climate system. It has been an increasing focus of consideration in recent years, mostly because of the massive and rapid decrease in the Arctic sea ice extent. Modeling indicates that global warming might amplify sea-ice reduction in the Arctic mainly due to ice-albedo feedback.
The Arctic and Antarctic are geographic opposites, and not just because they stand on opposite ends of the Earth’s globe. They also have opposite land-sea arrangements. In the Arctic, continents surround an ocean, while in Antarctica the continent is surrounded by oceans.
These differences in the arrangement of land and water contribute to differences in each polar region’s climate, oceanic and atmospheric circulation patterns, and sea ice.

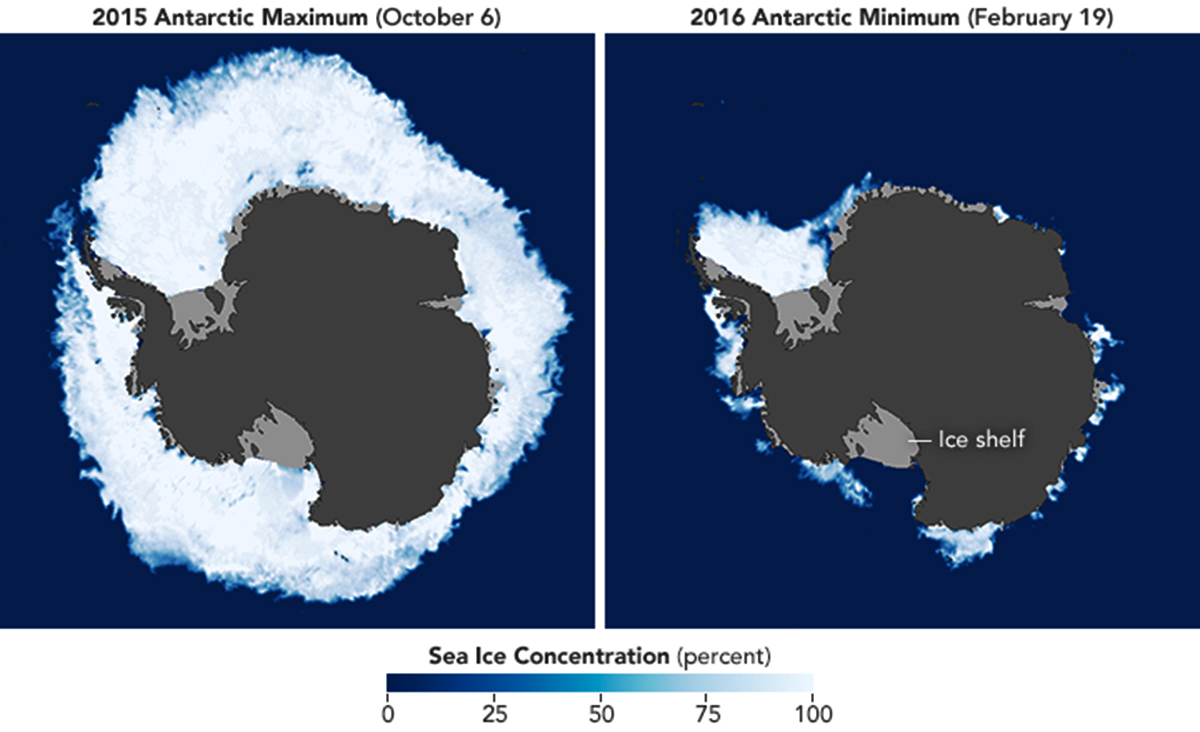
Antarctic sea ice normally peaks in September or October and reaches a minimum in February. In some places, sea ice melts completely in the summer. In the NASA Earth Observatory maps below by Joshua Stevens, using AMSR2 data supplied by GCOM-W1/JAXA, sea ice extent in Antarctica in the season 2015-2016
The cold waters around Antarctica allow rapid sea ice formation in winter. At its maximum extent in September, sea ice cover is around 16 million square kilometers or 6.2 million square miles, shrinking to about 2 million square kilometers or 0.77 million square miles in February. This is a much larger fluctuation than in the Arctic, where the configuration of the continents encourages the retention of ice for longer periods.
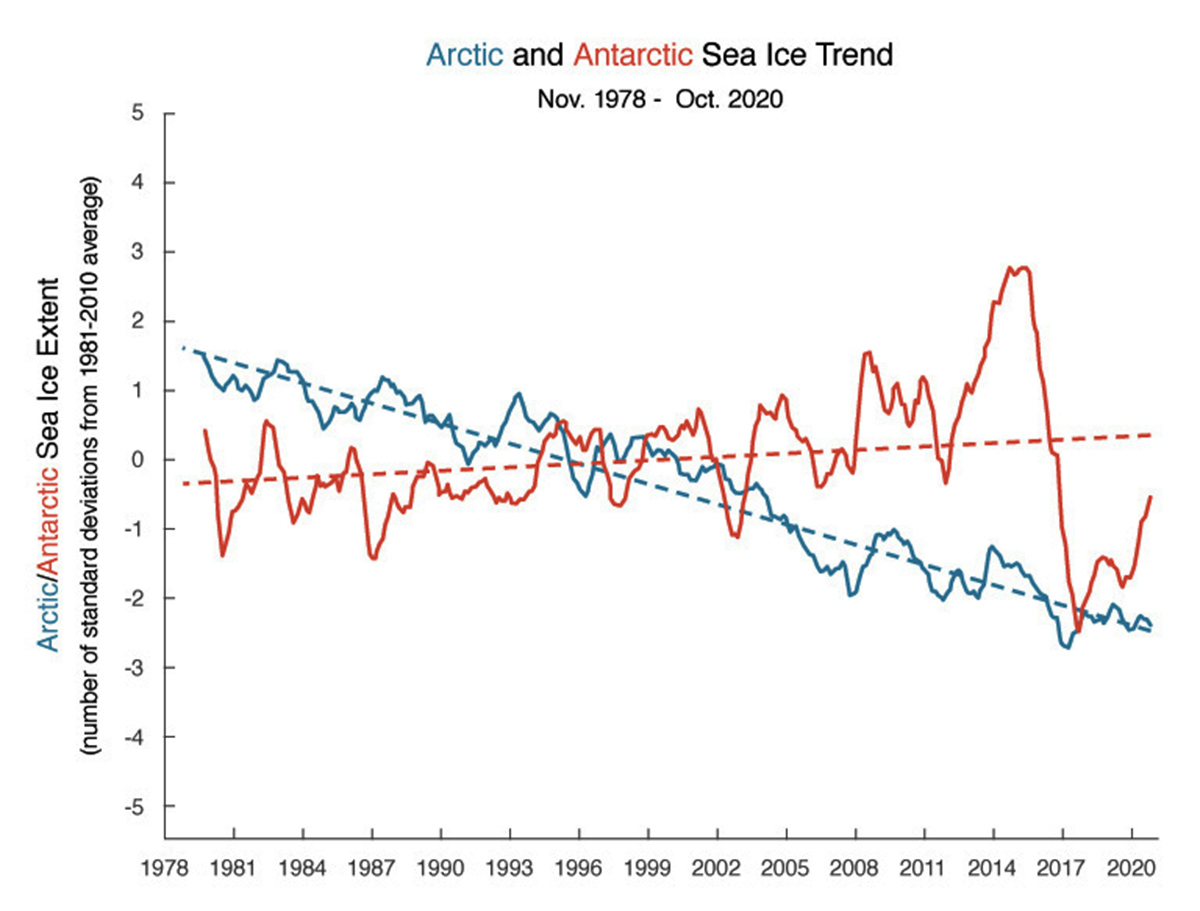
More, unlike the Arctic, where the average sea ice area has been decreasing by about 4% per decade, the average area of Antarctic sea ice has been increasing so far, at a rate of about 1.7 % per decade.
In fact, Satellite-based observations started in late 1978 shows that rapid changes have been occurring in the Arctic, where the ice coverage declined at a substantial rate. In contrast, in the Southern Hemisphere Antarctica showed increased sea ice extent recently although at a smaller rate than the Arctic’s reduction.
The solid lines indicate 12-month running averages, while the dotted lines indicate the overall trend. Units of extent are shown as standard deviations, which refer to the extent of change from the average. The source is the National Snow and Ice Data Center.
In the video below you can see the evolution of maximum Antarctic sea ice concentration at the end of the winter season (end of September) and minimum Antarctic sea ice concentration at the end of the summer season (end of March). The source is OSI SAF
Despite moderate warming, sea ice area and volume over the Antarctic showed no significant trend in the last 40 years and a slow increase on average. The latter may be attributed to regionally opposing trends and large internal variability according to the IPCC.
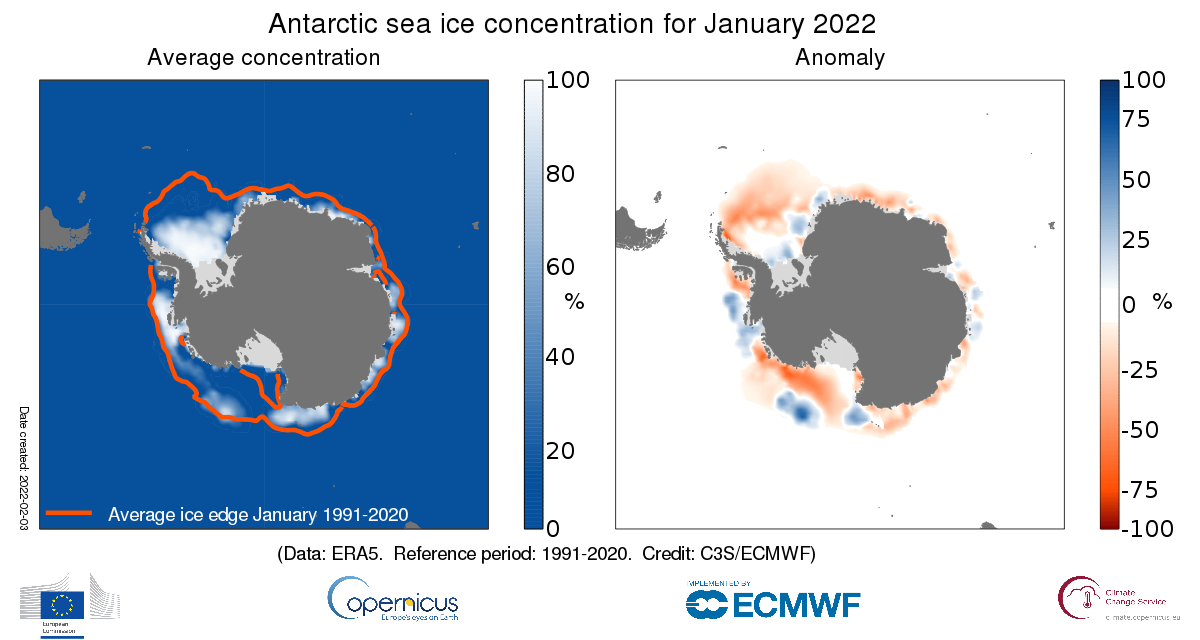
But this year, sea ice concentration anomalies for the Antarctic region for January 2022 showed a large reduction compared to December and, more importantly, the recent years, especially in the Atlantic and Pacific sectors.
Overall, below-average concentrations dominated around the continent, though small regions of above-average concentrations could be found in nearly all sectors.
Sea ice concentrations were most above average in the inner Ross and Amundsen Seas, as well as immediately to the west of the Antarctic Peninsula and across the outer Weddell Sea. The largest negative anomalies are found in parts of the Bellingshausen and outer Ross Seas.
AUSTRAL SUMMER 2022 IN ANTARCTICA
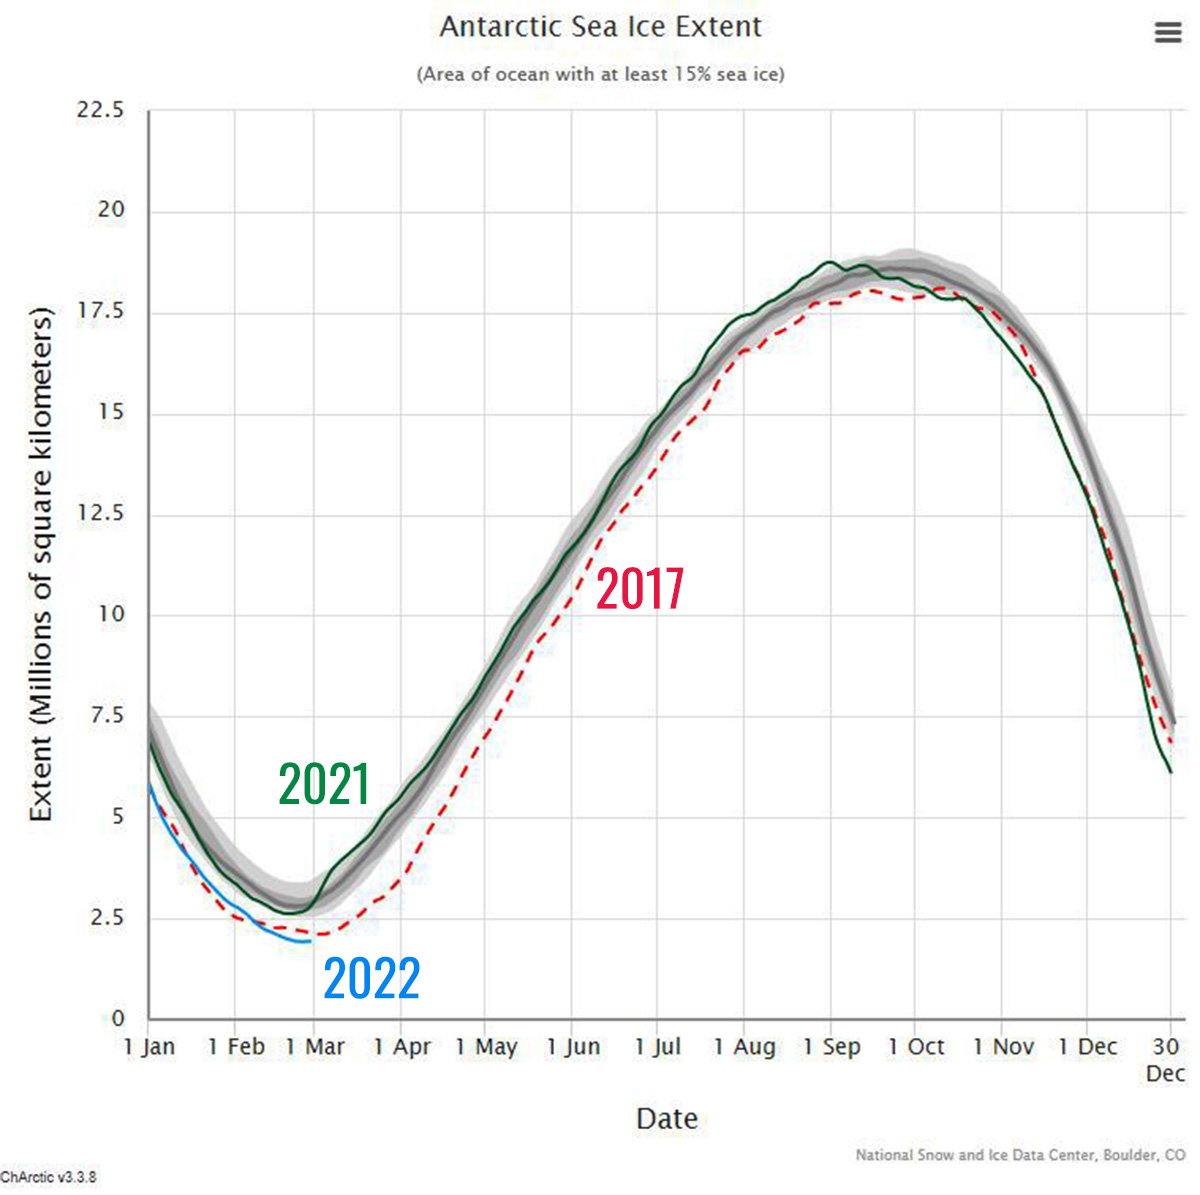
Antarctica experienced definitely warmer temperature in summer 2021-22. As a consequence, at the end of February sea ice extent was the lowest in the 44-year record. The image below shows the Antarctic sea ice extent at the end of February, along with daily ice extent data for 2021 and 2017.
According to the National Snow and Ice Data Center of Boulder, Colorado’s sea ice extension on February 25th was 1.924 million square kilometers or 0.742 million square miles while the previous 2017 minimum was recorded on March 3rd, 2017 with 2.110 million square kilometers or 0.811 million square miles.
In the image below the Sea ice concentration was observed on February 25th when the record low has been set. Sea ice concentration is the percent areal coverage of ice within the data element (grid cell).
Sea ice extent is the integral sum of the areas of all grid cells with at least 15% ice concentration, while sea ice area is the integral sum of the product of ice concentration and area of all grid cells with at least 15% ice concentration. The dashed vertical line indicates the date of the latest plotted and mapped data.

During the austral summer, which is just finished on February 28th, the sea ice extent was running roughly at the same pace of season 2017. Regionally, ice extent was tracking below levels observed for 2017 in the Indian and Pacific sectors, but above levels for that year in other sectors.
In 2017, only the Ross Sea recorded a very low extent, therefore it was the main driver of the record low hemispheric sea ice extent. But this year none of the specific regions have recorded extremely low extents, but all were well below average leading to the lowest Antarctic sea ice in the satellite record.
In the image below set by Zachary Labe, Antarctic sea ice extent anomalies for each year from 1979 to 2022 thanks to satellite-era NSIDC, DMSP SSM/I-SSMIS. The plotted anomalies are calculated by using a five-day running mean from a climatological baseline of 1981-2010.
Here, 2022 is shown with a red line and updated at the last day of February. February 28 is the last day of the southern hemisphere meteorological summer, while in the northern hemisphere this day corresponds to the end of the meteorological winter.
SEA ICE ANOMALIES
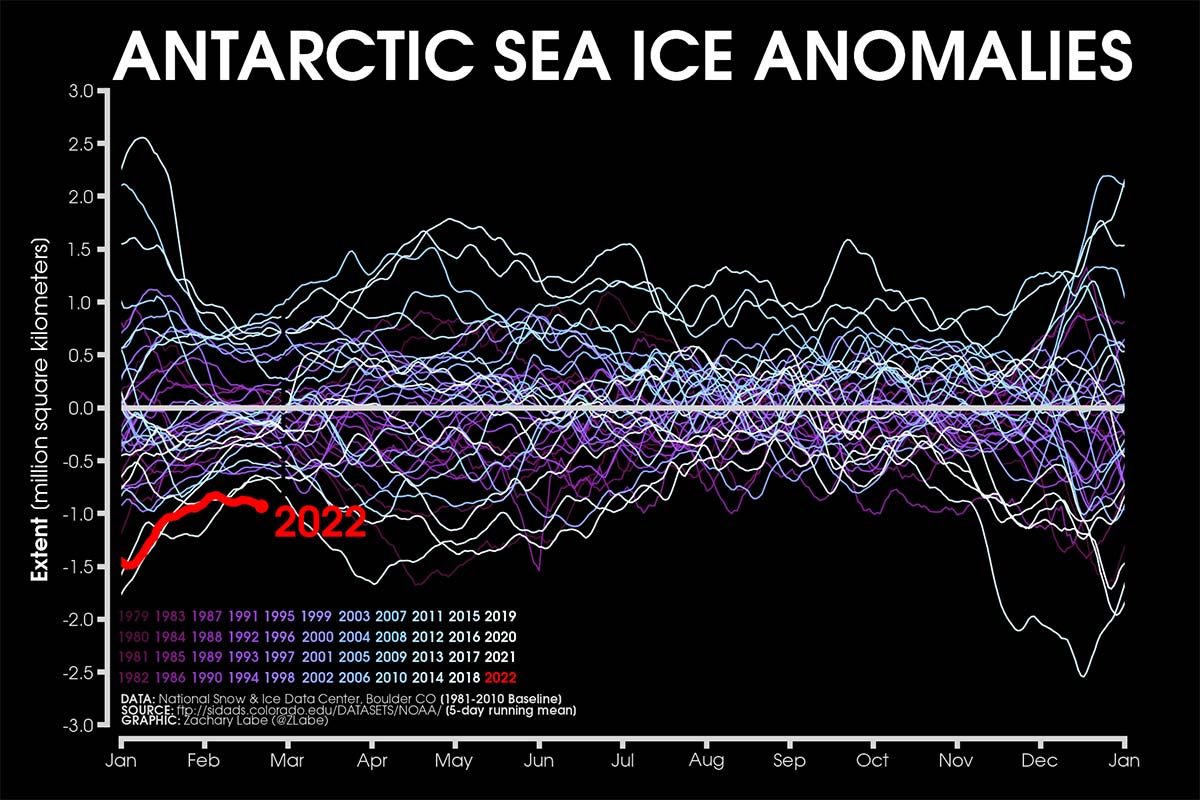
Although February 25th does not represent the most negative anomaly of the record as a whole, it is so for the end of February when the usual annual climatic minimum occurs.
This is also clearly evident in the image below which shows the Antarctic sea ice extent anomalies stretching from January 1979 to the present-day thanks to satellite-era, NSIDC, DMSP SSM/I-SSMIS. The anomalies are plotted by using a five-day running mean from the 1981-2010 climatological baseline and updated to February 28th.
While overall sea ice extent has only slightly increased since the late 1970s, the rate of increase began to accelerate in 2000, and ice extent reached a record high in 2014. But then something unexpected happened. It dropped drastically over the next three years, reaching a record low in 2017.

The year-to-year variability and the increase by about 1.7% in the extent of the Antarctic sea of 2000s ice have been well observed since the beginning of the satellite era, from 1978-79 to the present. In the 2000s, several highly positive anomaly peaks contrast with those negatives observed in the very last seasons.
In fact, when looking at this curve in a different perspective, we can see at least three short-term trends. In the image below, redrawn from the original one set by Zachary Labe showed above, we highlight the recent sea ice variability and short trends.
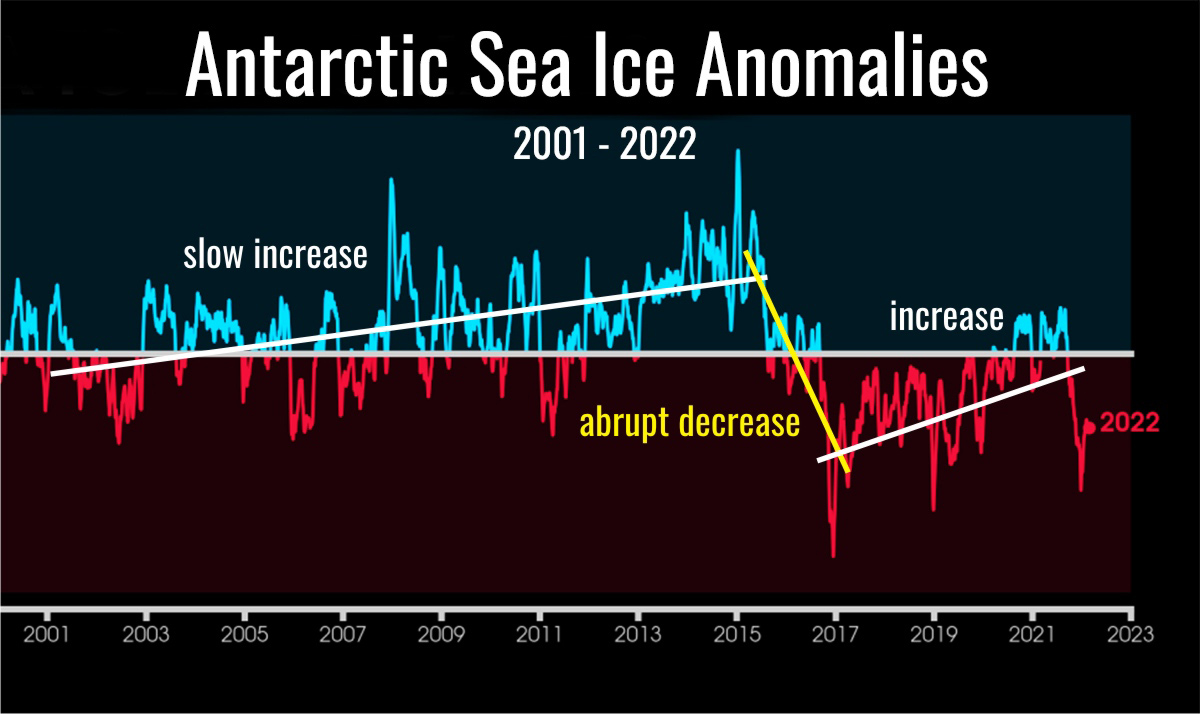
The slow increase observed in the 2000s, and particularly evident in the period 2011-2015 when sea ice extent was substantially always above average, ended abruptly in 2016. A rapid and extensive decrease with massive negative anomalies peaked in 2017, and for about four years sea ice extent was continuously below the 1981-2010 average.
From 2017 on, a new slow increase has been observed, and in 2021 the sea ice extent showed again periods of positive anomalies. The three main negative peaks occurred at the end of 2016 and 2018, and in February 2022 as well as the positive peaks, apparently follow the same increasing trend.
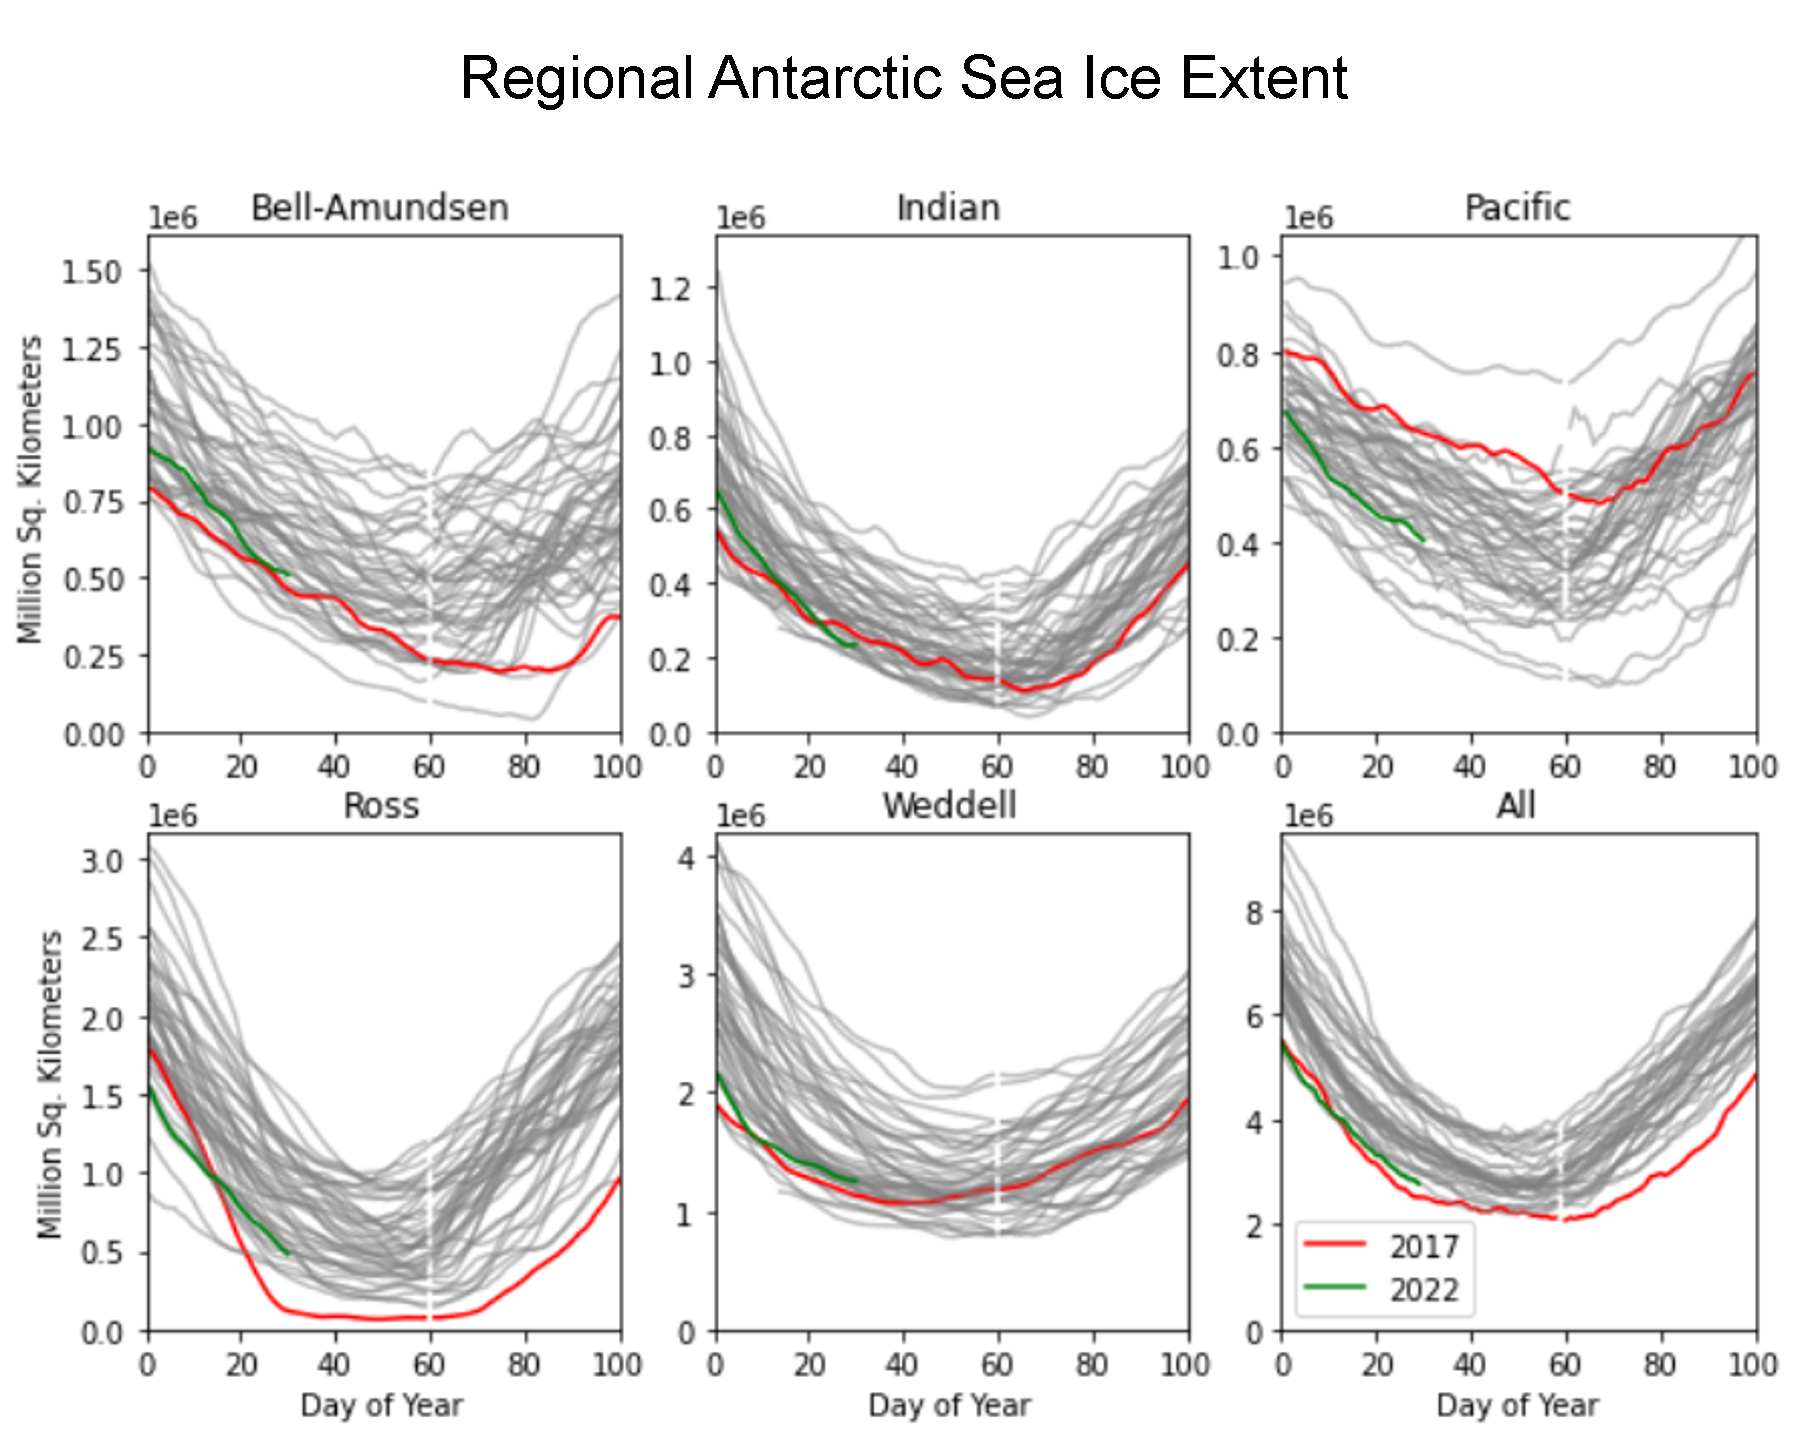
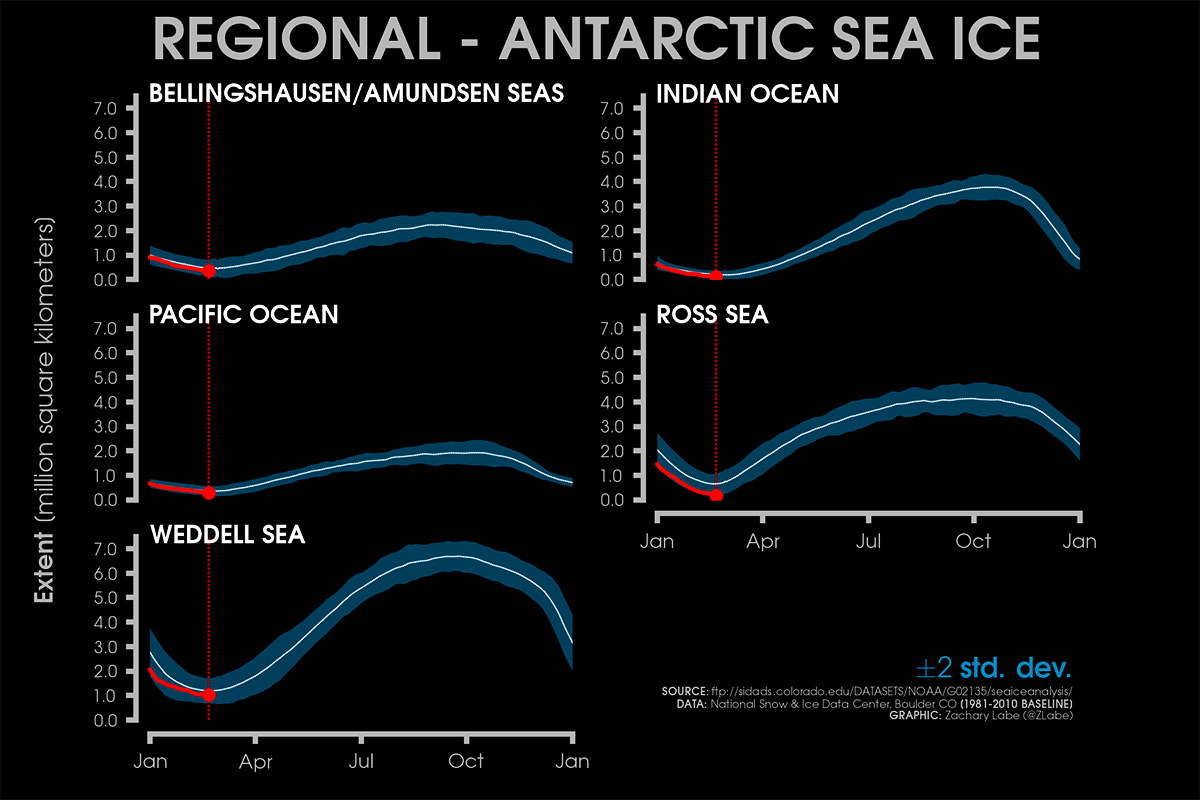
In the image above credit Robbie Mallet, University College London, Antarctic sea ice extent in square kilometers overall and in five different regions.
ANTARCTIC WEATHER PATTERNS
The low sea ice extent has been noticeable in the Weddell Sea, east of the Antarctic Peninsula, which because of its circular current retains much more ice from year to year than the other parts of the Antarctic coast. Nevertheless, The Antarctic summer was indeed pretty warm this year already in the first part of the austral summer.
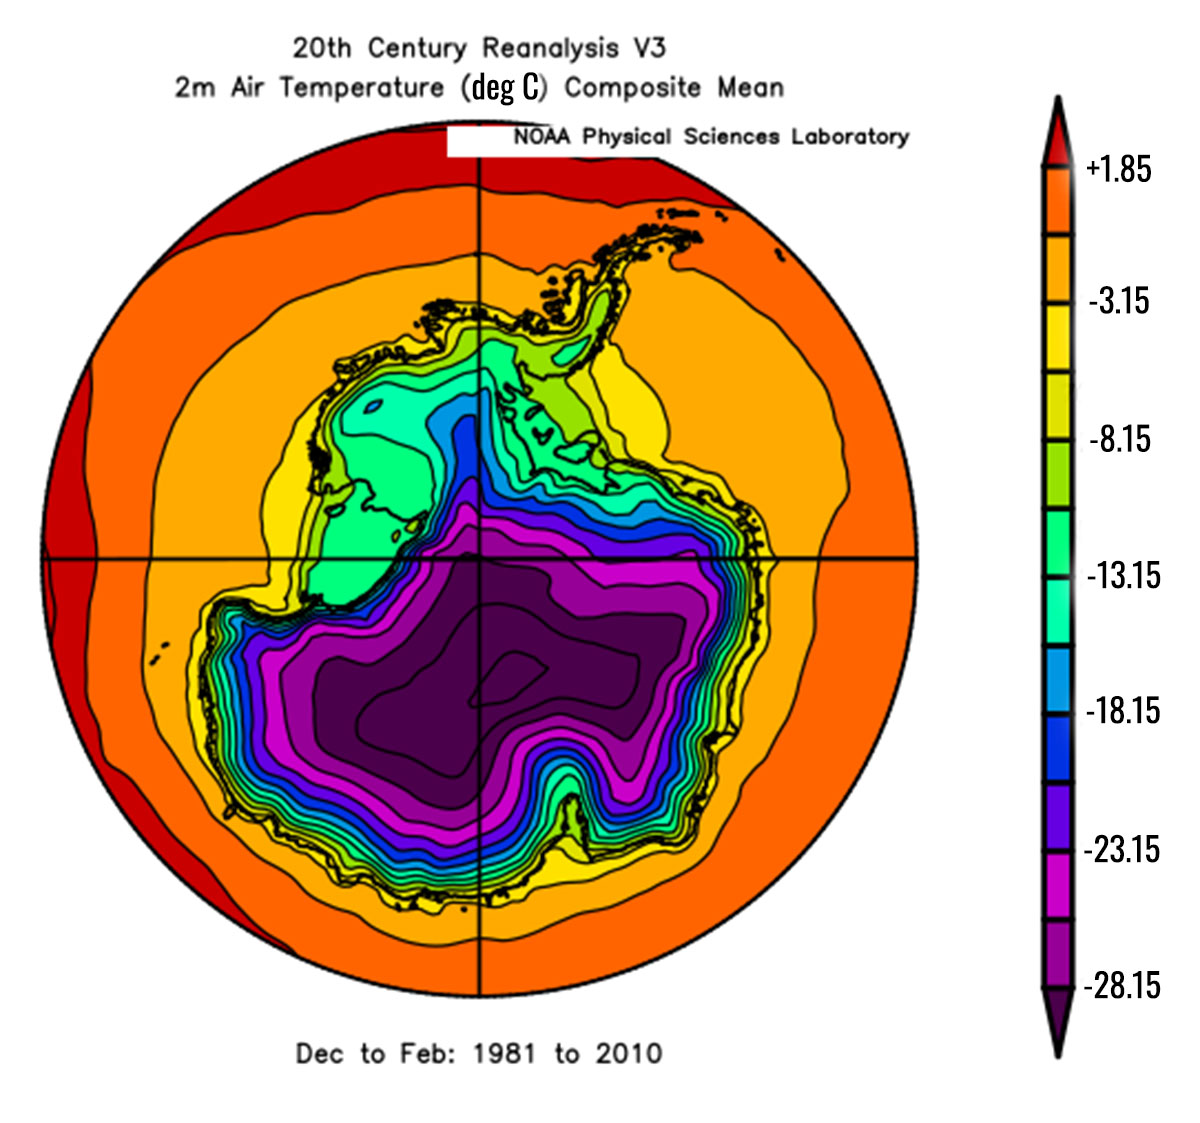
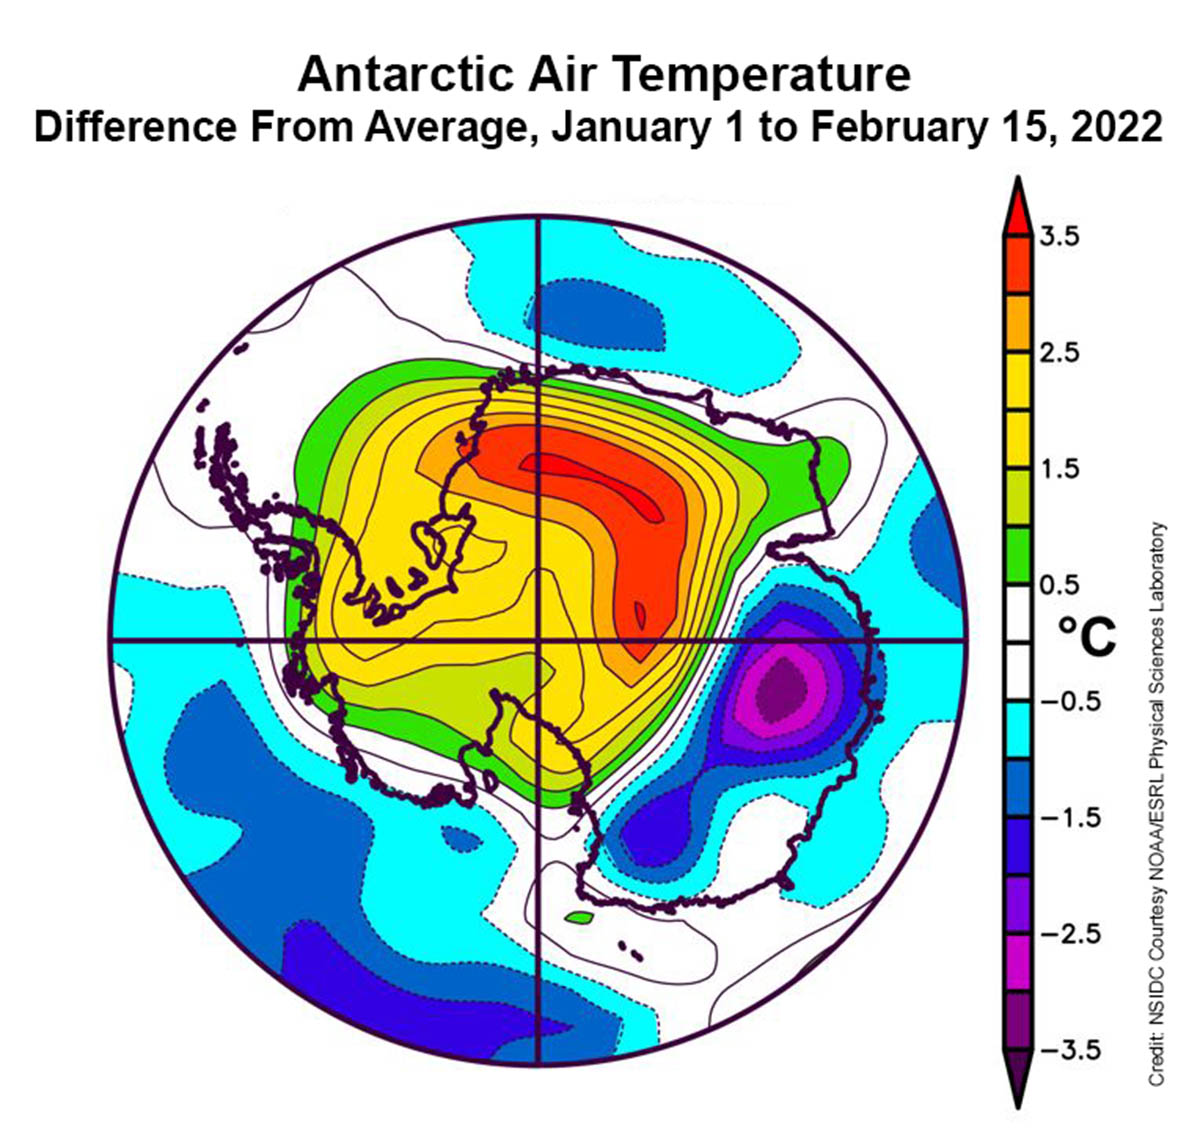
As a yardstick, the image above reports the 1981-2010 mean summer air temperature in Antarctica thanks to the NOAA Physical Science Laboratory. In the image below the average temperature for the first part of the summer shows a massive positive anomaly up to 4 degrees Celsius in a large part of Antarctica. The image shows the departure from mean air temperature, in degrees Celsius. Yellows and reds indicate higher than average temperatures; blues and purples indicate lower than average temperatures.
The interior of the East Antarctic Ice Sheet was rather warm but did not approach the melting temperature of course. On the other side, in coastal areas temperature approached more easily and frequently the melting point during the summer season.

Antarctic climate conditions for the second half of the summer, between January 1 and February 15, have been driven by a strong Amundsen Sea Low located westward of its usual position. Strong northwest winds again flew across the Antarctic Peninsula with several föhn events. Therefore, recursively dry, warm, down-slope winds occurred on the downside of the mountain range.
The image below credits NSIDC courtesy NOAA Earth System Research Laboratory, shows the departure from average air temperature over Antarctica at the 925 hPa level, in degrees Celsius, from January 1 to February 15, 2022. Yellows and reds indicate higher than average temperatures; blues and purples indicate lower than average temperatures.
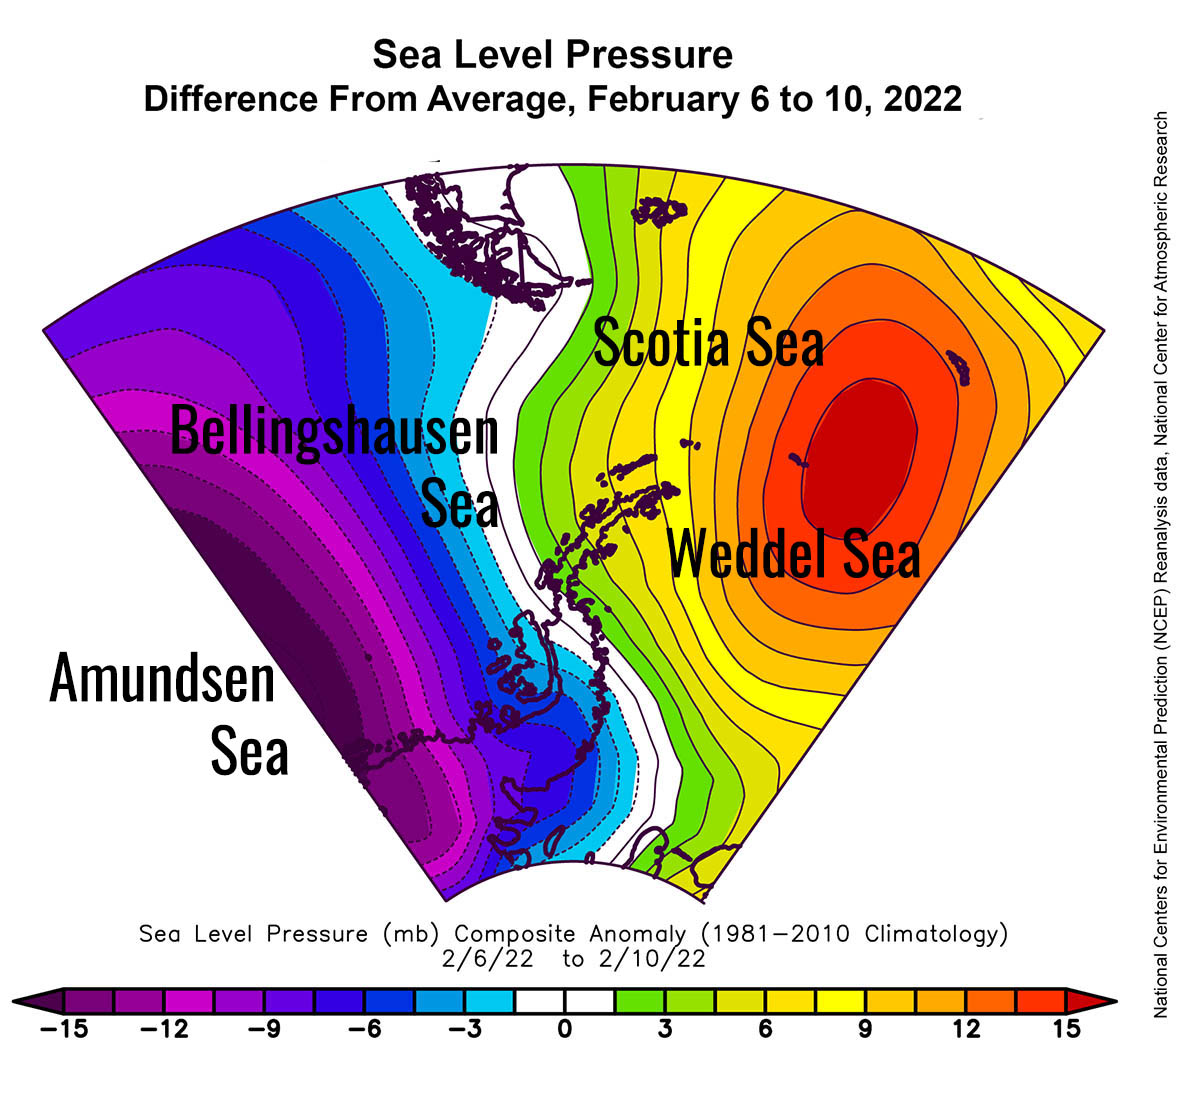
The image below credits National Centers for Environmental Prediction (NCEP) Reanalysis data, National Center for Atmospheric Research, shows mean sea level pressure for the Antarctic Peninsula from February 6 to 10, 2022.
During this period, an extremely intense event of föhn hit the eastern Peninsula.
On the windward side of the Peninsula, stau conditions produced intense snowfalls there. Such a synoptic pattern with high pressure over the Scotia Sea and the low pressure over the Amundsen Sea produces strong N-NW winds. More than 50% of the Peninsula’s ice cover was interested in melting during this period.
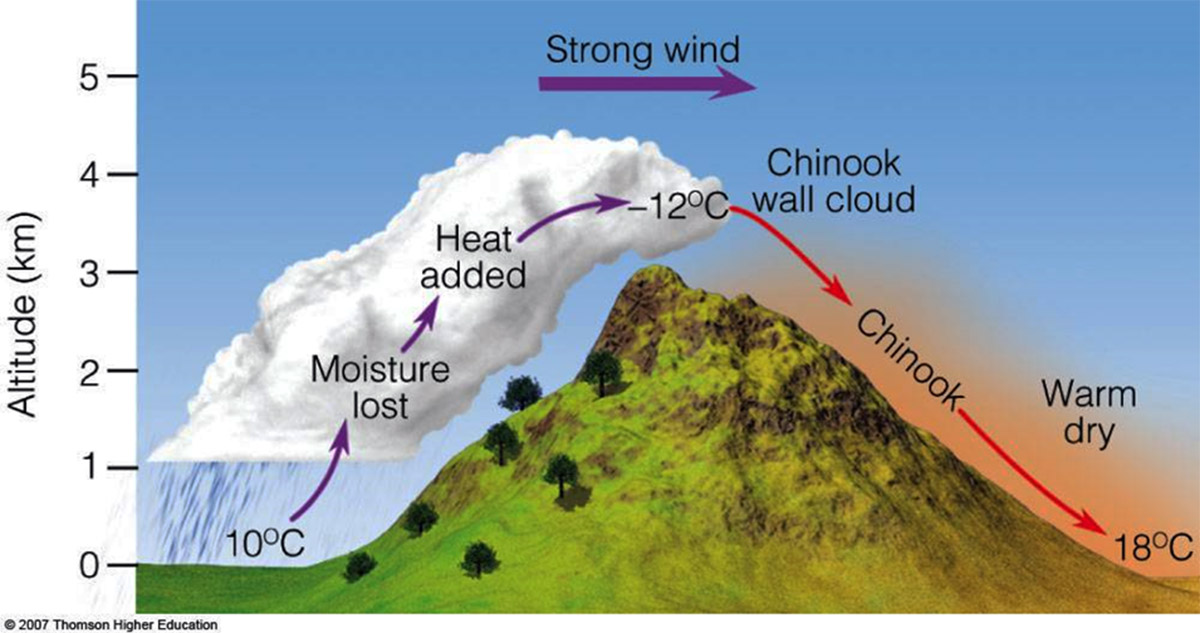
BUT EXACTLY WHAT FöHN WINDS ARE
Föhn is a warm, dry, downslope wind descending the lee side of the European Alps as a result of synoptic-scale, cross-barrier flow over the mountain range. The air in the near-surface flow originates at or above the main crest of the Alpine barrier and achieves its warmth and dryness as a result of adiabatic descent.
The föhn often replaces a retreating cold air mass from a polar or arctic front, producing dramatic temperature rises that reach 10 degrees Celsius and occasionally even 20 degrees Celsius or more, sometimes in a matter of minutes. This is especially true of the so-called south föhn, which blows from northern Italy, where the air is warm, -to the north of the Alps (Austria, Germany, Switzerland), where the air is cooler and could be cold arctic air as just described.
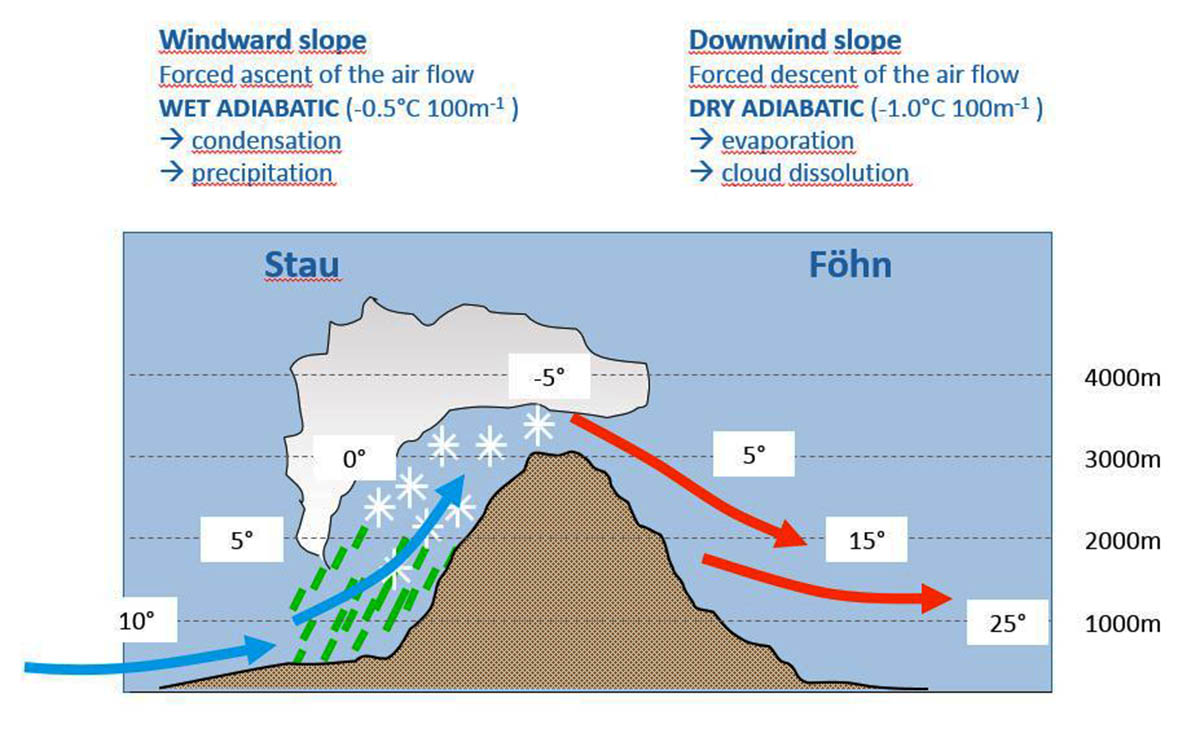
On the windward side, there is an opposite situation with wetter conditions, condensation, and orographic precipitation. A typical situation is when northerly flux delivers tons of snow in Switzerland and Austria while in northern Italy spring conditions develop even in full winter.
The Alpine föhn has been extensively studied by European scientists, and it is recognized as the type of wind for similar downslope winds, resulting from cross-barrier flow, in other parts of the world. In other mountain ranges, the föhn has a variety of local names, including chinook in the Rocky Mountains in North America as in the image below.
EXTREME MELTING OVER PART OF ANTARCTICA THIS YEAR
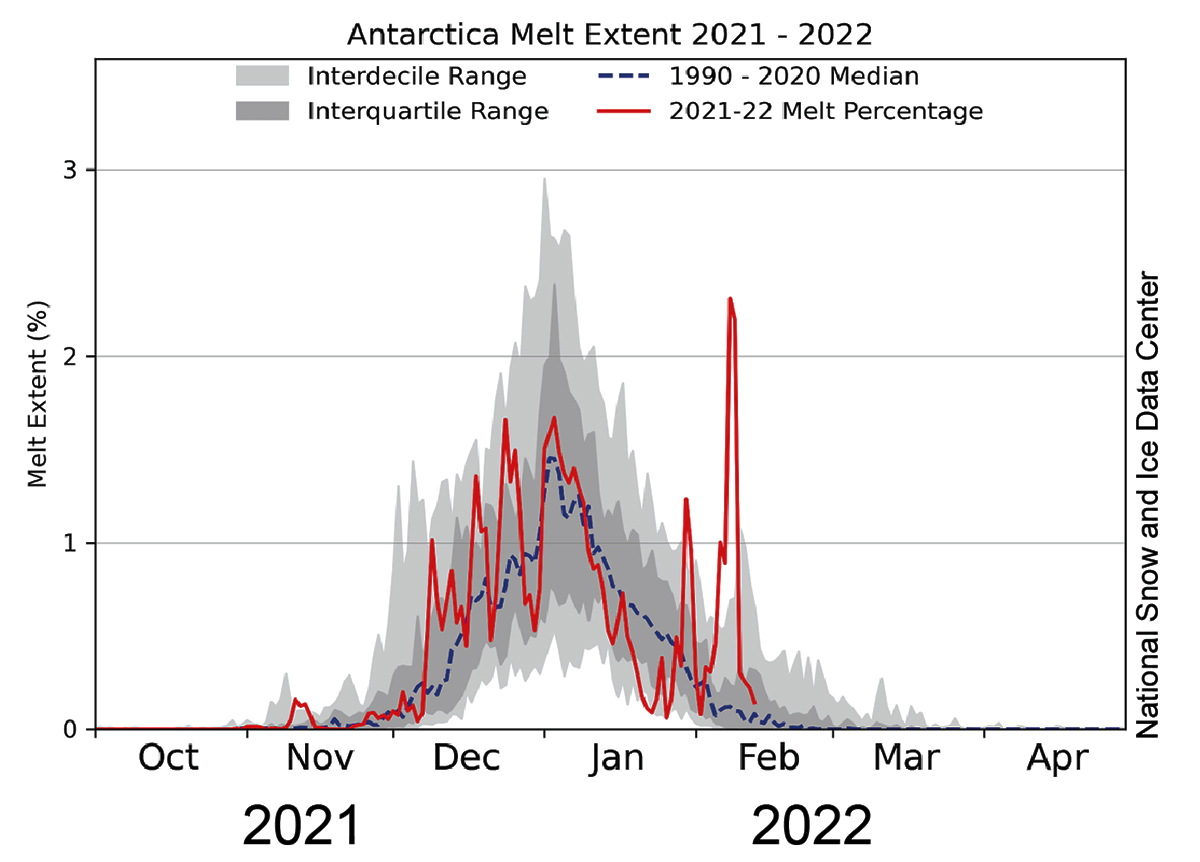
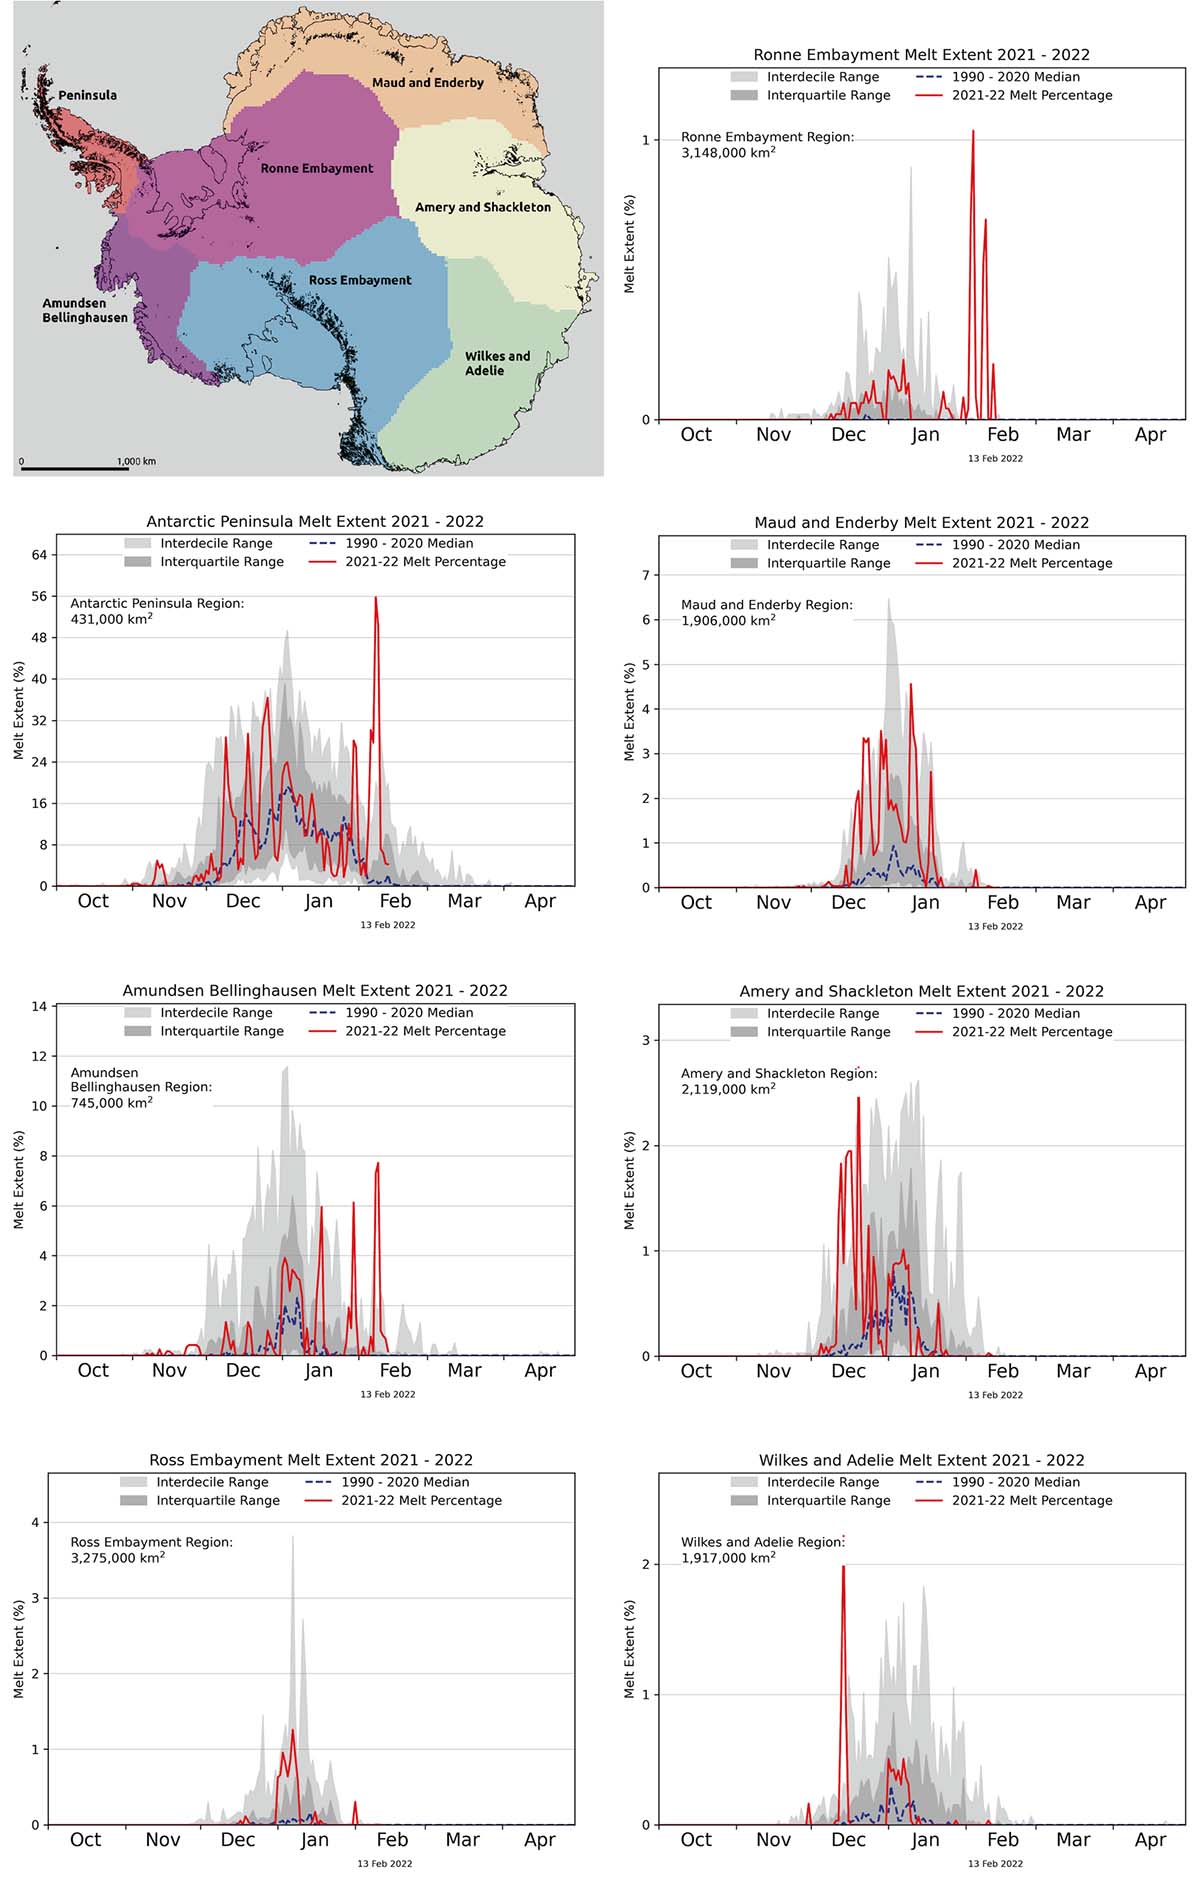
The image below credits L. Lopez, NSIDC, M. MacFerrin, CIRES, and T. Mote, University of Georgia, shows daily melt extent as a percent of the ice sheet for the 2021 to 2022 season through February 13, and the average values and ranges for the reference period.
It is indeed apparent how in early February Antarctica was hit by an extreme melting event, mainly caused by the just mentioned synoptic pattern.
In total, the number of surface melt days was above average over most of the Antarctic Peninsula and over the Dronning Maud Land and Enderby Land region, but below average in the Amery Ice Shelf and Amundsen-Bellingshausen regions.
The image below credits L. Lopez, NSIDC, M. MacFerrin, CIRES, and T. Mote, University of Georgia shows on top the total melt days for the Antarctic Ice Sheet from November 1, 2021, to February 13, 2022. Down Antarctica melt days as a difference from average relative to 1990 to 2020 reference period.
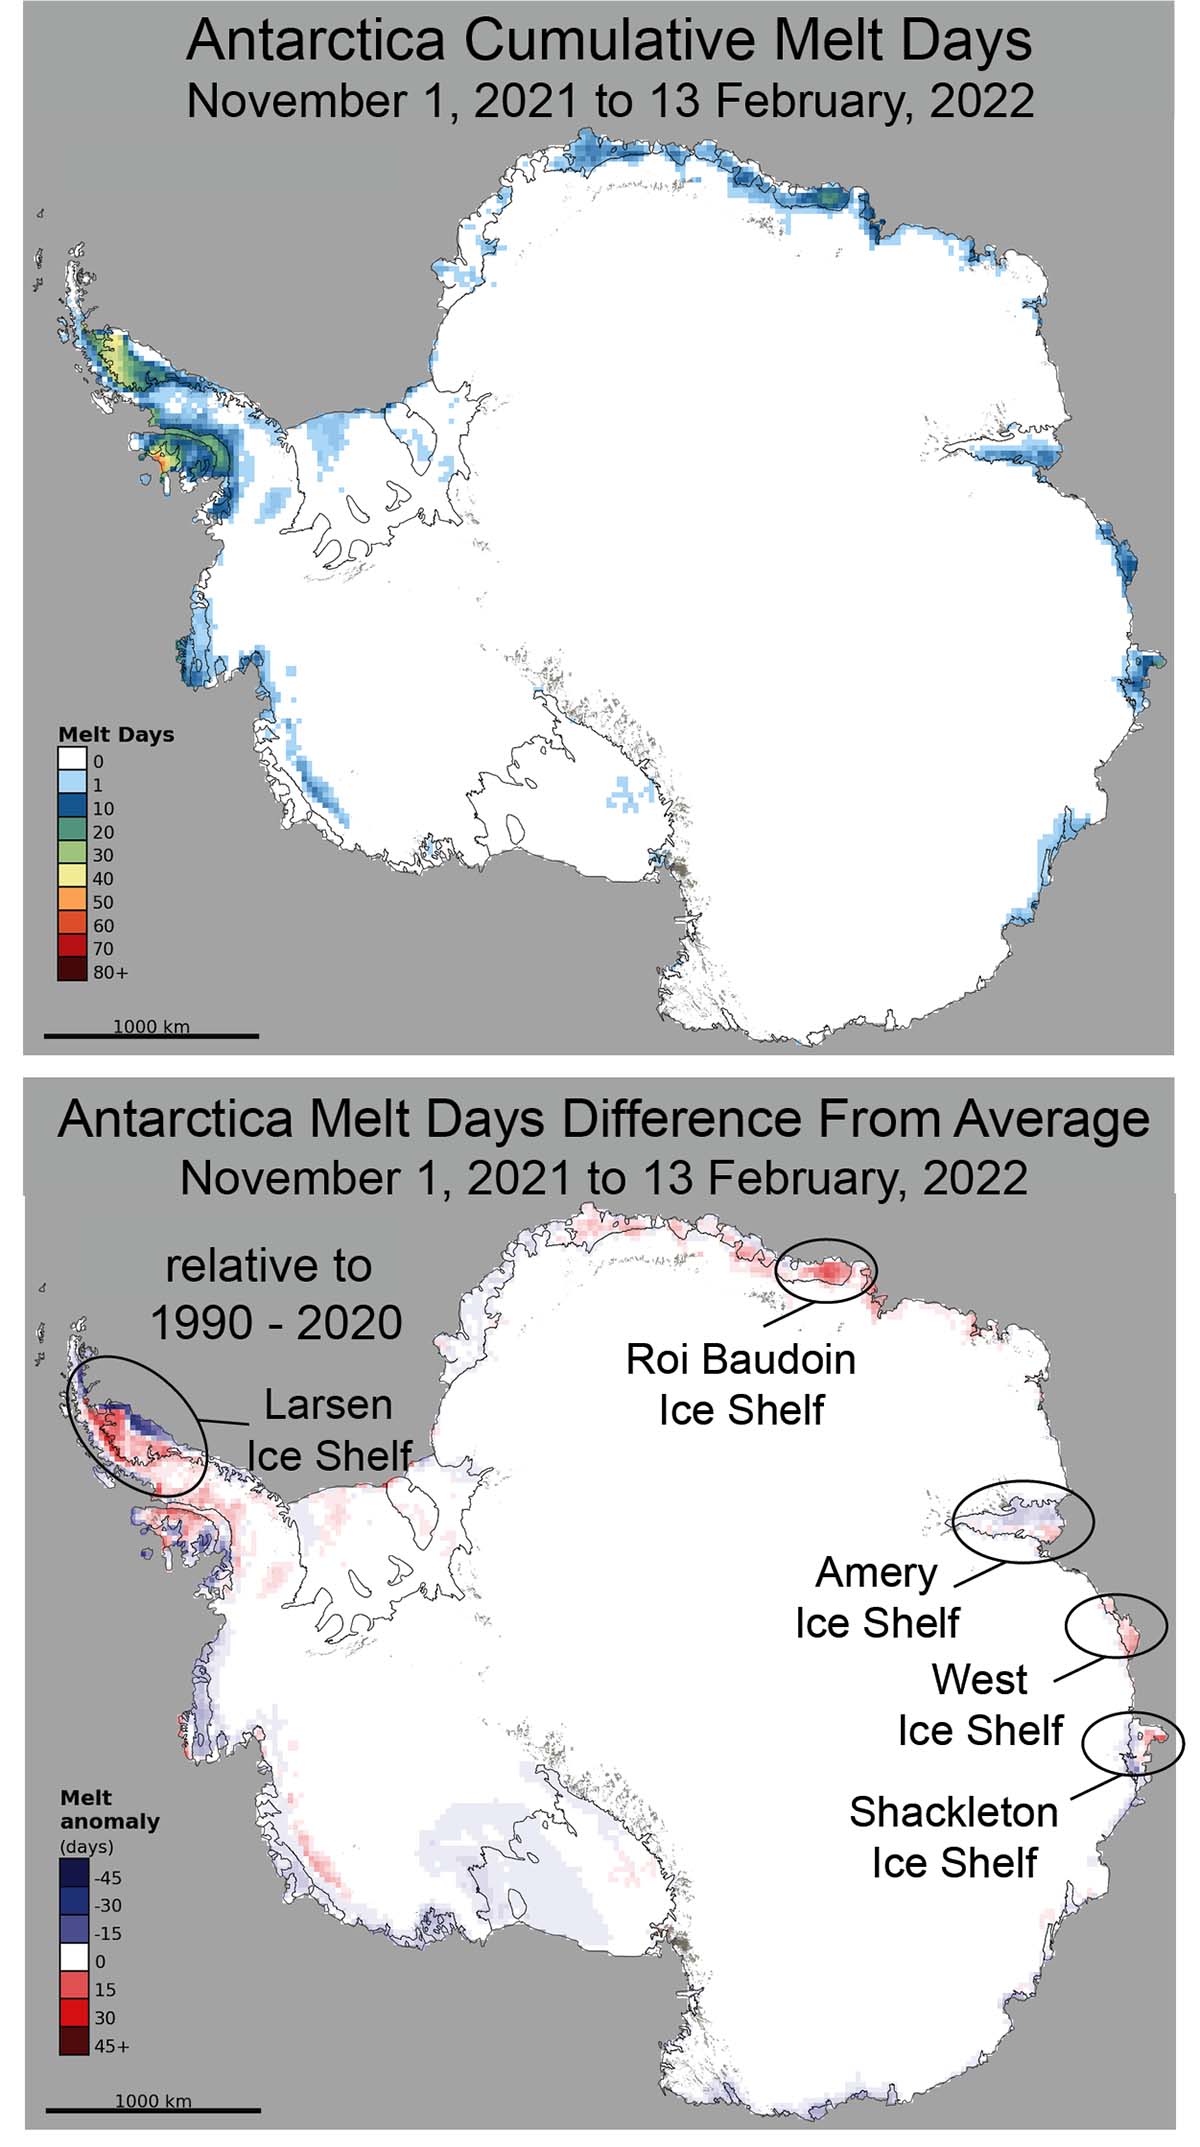
The image below credits L. Lopez, NSIDC, M. MacFerrin, CIRES, and T. Mote, University of Georgia show regional daily melt extent for seven Antarctic regions. Surface melting was limited to near-coastal areas everywhere except the Antarctic Peninsula this year.
In the Amundsen Bellinghausen, Antarctic Peninsula, and Ronne Embayment is noticeable how the synoptic pattern produced such an intense melt event in terms of the extent involved.
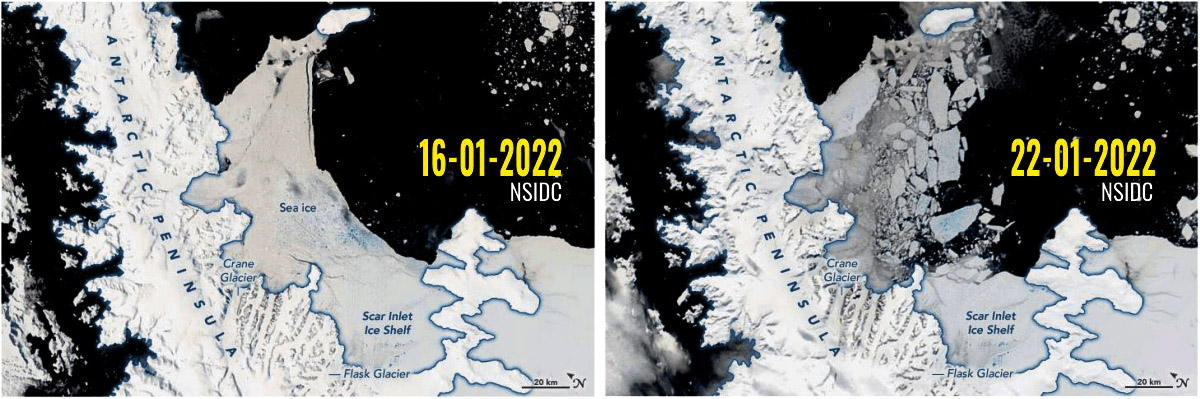
As a consequence of all these events, multiyear fast ice in the Larsen B embayment, in place continuously since early 2011, showed widespread meltwater flooding with some deeper ponds and some areas drained by narrow fractures. Between January 16 and the 21st, the sea ice of the Larsen B ice shelf, linked to the Antarctic Peninsula, crumbled and disintegrated.
It is often emphasized that the melting of ice shelves does not actually contribute to sea-level rise because ice shelves are buoyant and already displace water. This is not actually completely true, because ice shelf melting produces freshwater, which has a lower density than salty seawater.
This means that the volume of seawater displaced by an ice shelf is less than the volume occupied by the same mass of freshwater. The volume difference is around 2.6%, and it has been calculated that if all extant sea ice and ice shelves melt, the average global sea level would rise by roughly 4 centimeters.
If all the ice in the West Antarctic Ice Sheet should melt, the global sea level would rise by 3.2 m. The Antarctic Peninsula Ice Sheet would contribute 0.24 m or 0.79 feet to global sea-level rise on full melting, and currently contributes 0.22±0.16 millimeters or 0.009±0.6 inches per annum. The East Antarctic Ice Sheet has a sea-level equivalent of approximately 60 meters or about 197 feet.

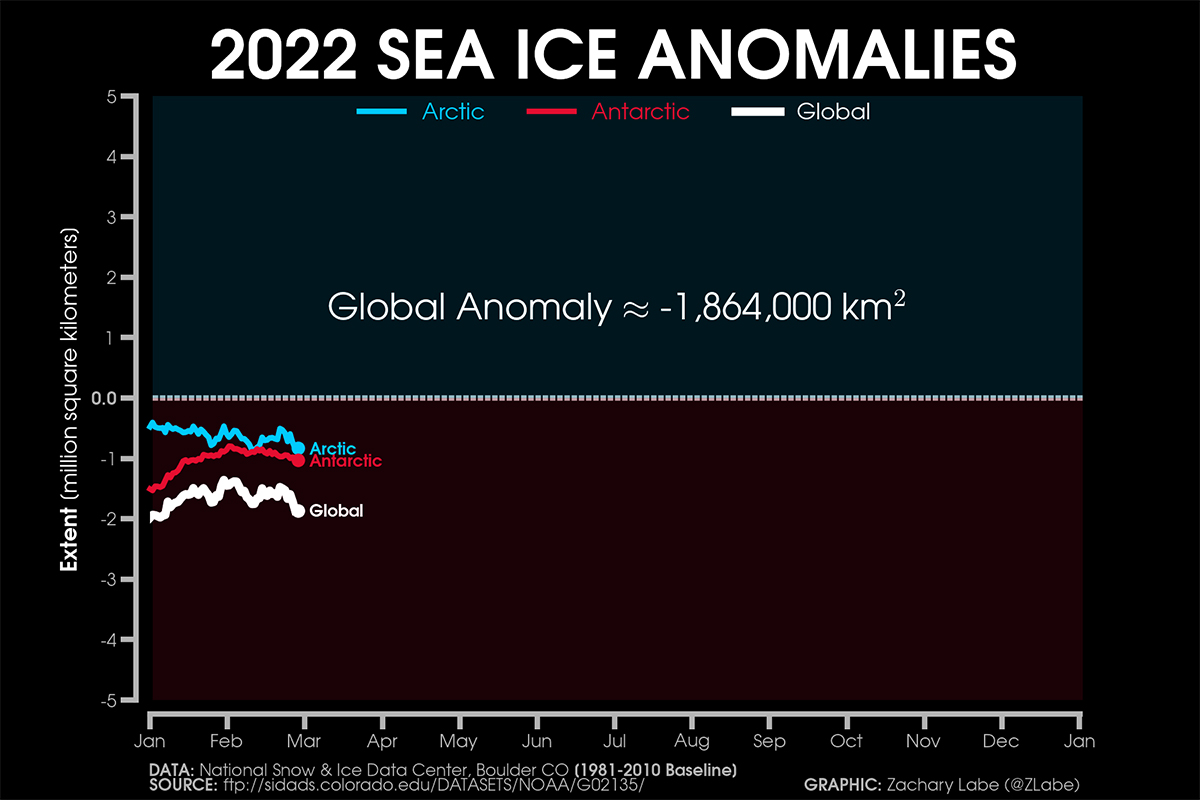
Both the Arctic and Antarctic Sea Ice extent push the global anomaly at -1.864 million square kilometers or about 0.720 million square miles. In the image below the current sea ice extent anomalies for the Arctic and Antarctic, source NSIDC, DMSP SSM/I-SSMIS F-18 edited by Zachary Labe. Anomaly is based on 1981-2010 climatology
We will keep you updated on this and much more, so make sure to bookmark our page. Also, if you have seen this article in the Google App (Discover) feed or social media, click the like button (♥) to see more of our forecasts and our latest articles on weather and nature in general.