Rapid disintegration of part of the Larsen B ice shelf, already dramatically collapsed in 2002, occurred two weeks ago, between January 19-20, 2022. This breakup is the latest in a series of remarkable events in the Larsen B embayment over the past twenty years triggered by several factors. This year, a warmer-than-average summer and a series of remarkable foehn storms triggered this huge umpteenth collapse.

Continuously present for the past more than 10 years, landfast sea ice in the Larsen B embayment is breaking out again. Between January 16 and the 21st, sea ice linked to the Antarctic Peninsula’s crumbled and disintegrated.
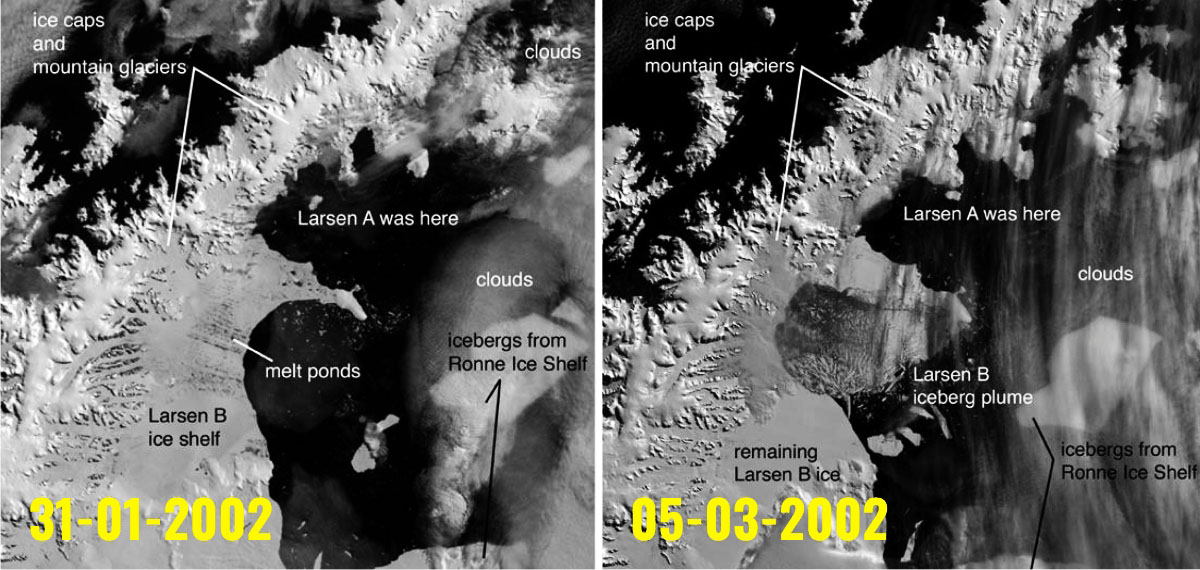
Indeed this breakup is the latest in a series of remarkable events in the Larsen B embayment over the past twenty years. In early 2002, the shelf abruptly fractured. From 31 January 2002 to March 2002 the Larsen B sector partially collapsed and parts broke up, with 3,250 square kilometers (1,250 square miles) of ice suddenly gone, an area comparable to the US state of Rhode Island.

Ice shelves have attracted a great deal of scientific and media attention in recent years, partly because spectacular ice shelf break-up events have been interpreted by some of the natural symptoms of global warming.
Three broad types of ice shelves can be recognized: glacier ice shelves, consisting of the floating margins of outlet or valley glaciers; sea ice shelves, or areas of locally grounded fast ice fed by surface snowfall and basal freezing; composite ice shelves, basically a mix of the two.
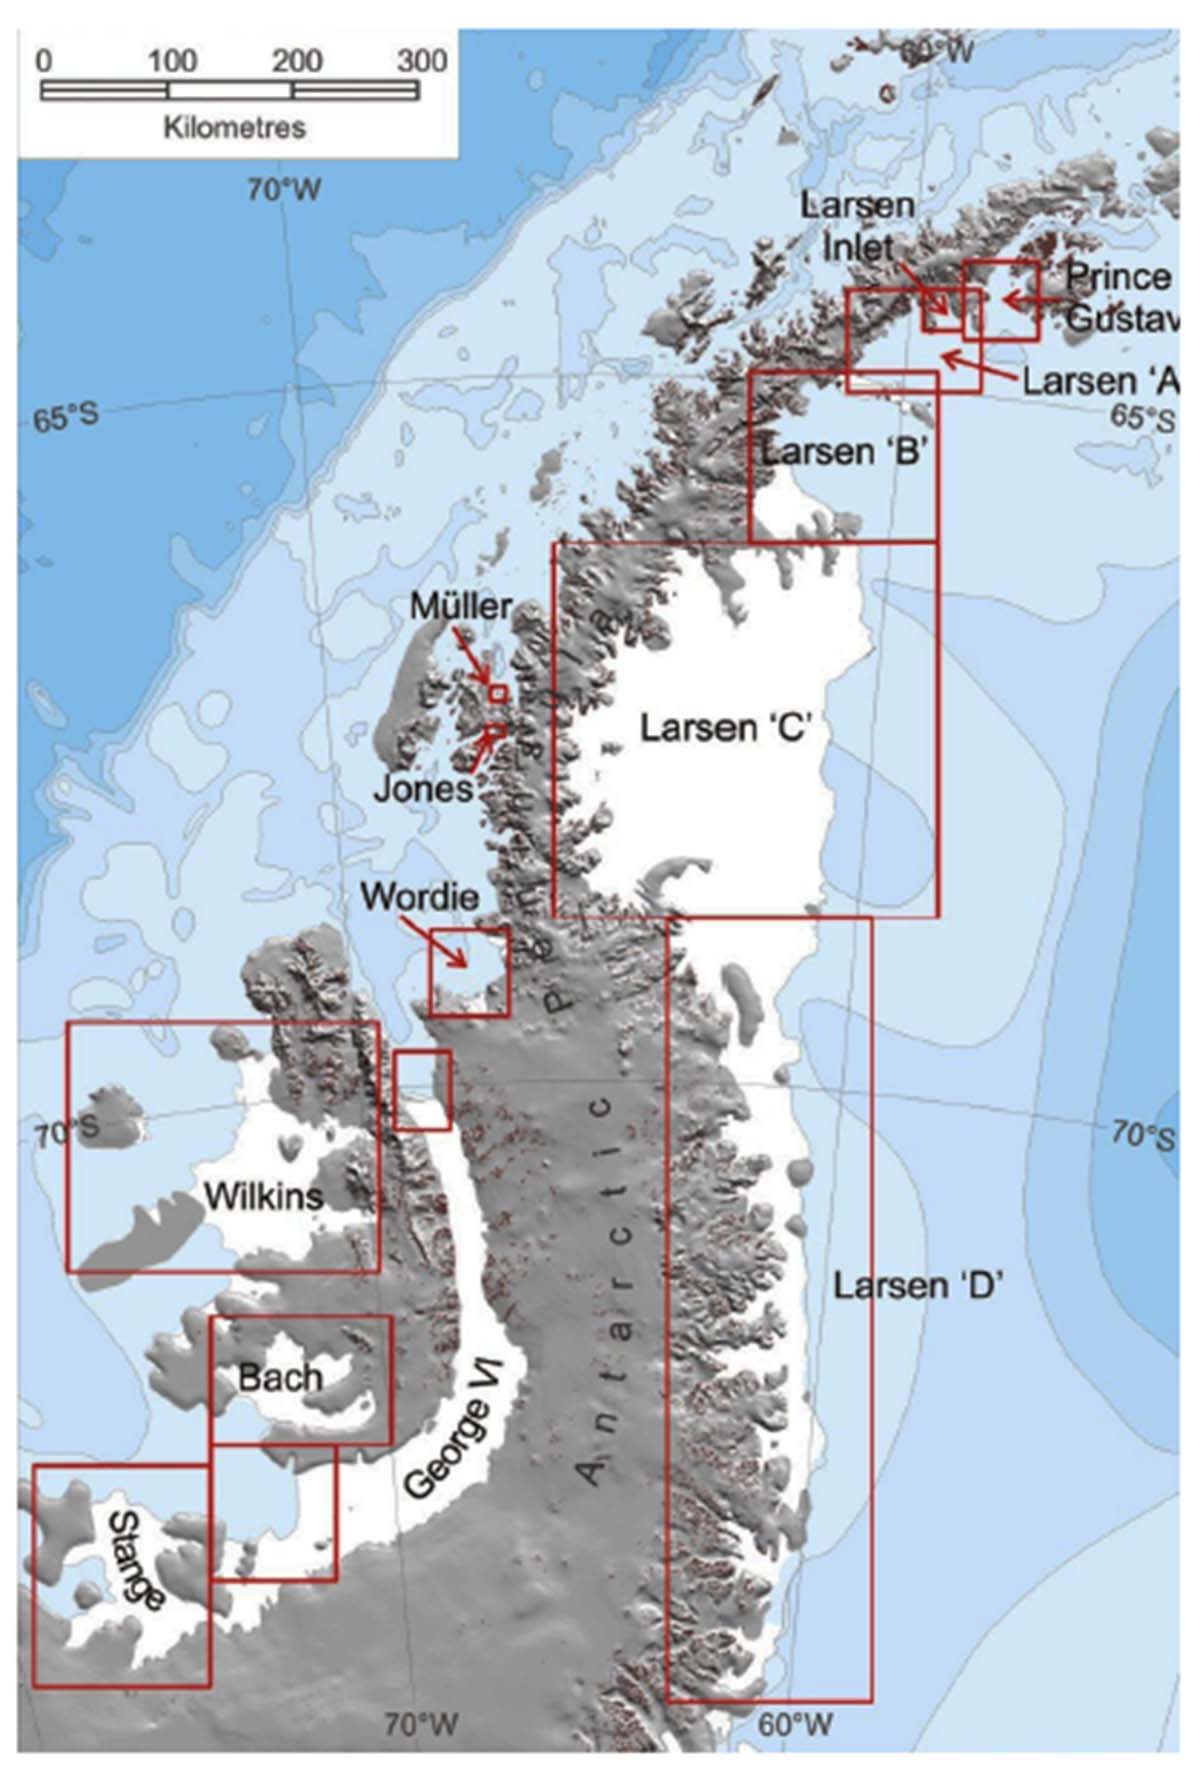
Ice shelves are confined to high polar settings where glacier ice is below the pressure melting point. The Larsen Ice Shelf is a series of shelves that occupy or occupied, different embayments along the coast of the Antarctic Peninsula. From north to south, the sections are called Larsen A, which is the smallest, Larsen B, and Larsen C, which is the largest.
Further south, Larsen D and the much smaller Larsen E, F, and G are also named by scientists working in the area. In the image above you can see where they are located. The name of the whole Larsen ice shelf comes from Captain Carl Anton Larsen, a former master of a Norwegian whaling vessel, who sailed along the ice front as far as 68°10′ South during December 1893.
SUMMER 2022 IN ANTARCTICA
Summer in Antarctica is definitely warmer so far this year. As a direct consequence, this January Antarctic sea ice was the second-lowest ice extent in the 44-year record. The image below shows the Antarctic sea ice extent as of February 2, 2022, along with daily ice extent data for five previous years. 2021 to 2022 is shown in blue.
As you can see from the NSIDC image below, at the beginning of February sea ice extent is running at the same pace of season 2017-2018. Regionally, ice extent is tracking below levels observed for 2017 in the Indian and Pacific sectors, but above levels for that year in other sectors.

In the image below, the average temperature for November and December shows a massive positive anomaly up to 4 °C over a large part of Antarctica. The image shows the departure from mean air temperature, in degrees Celsius, at the 925 hPa level. Yellows and reds indicate higher than average temperatures; blues and purples indicate lower than average temperatures.
Although the interior of the East Antarctic Ice Sheet was quite warm, this region typically does not approach the melting temperature. However, coastal areas of the continent had average to above-average surface melting, but here temperature approaches more easily and frequently the melting point during the summer season.

The weather pattern of this summer has seen the strong Amundsen Sea low and a high positive Southern Annular Mode (SAM) so far bringing snow and windy conditions to the southwestern side of the Antarctic Peninsula. On the other side, the northern part of the Antarctic Peninsula experienced the most significant surface melting. Strong, warm winds flowed east and downslope on the eastern side, forcing the melting.
In the image below, we can see the daily total melt as a percent of the total ice area of the region through January 2022, and the average values and ranges for the 1990 to 2020 reference period. Credit L. Lopez, NSIDC, M. MacFerrin, CIRES, and T. Mote, University of Georgia.

As it is clearly visible in the image above, several recursive melting peaks occurred in December and in January, causing extreme melting well above the long-term average.
As a consequence, multiyear fast ice in the Larsen B embayment, in place continuously since early 2011, showed widespread meltwater flooding with some deeper ponds and some areas drained by narrow fractures.
The close-up image below shows the Larsen B embayment with deep meltwater fractures, and the remnant of the older Larsen B, north and south of the new Larsen B. This image was acquired from the Moderate Resolution Imaging Spectroradiometer (MODIS) instrument on the NASA Terra satellite on December 21, 2021.

HOW A SHELF BREAK-UP WORKS?
A Large number of melt ponds forming on the ice shelf surface allows crevasses to penetrate the full thickness of the shelf. Water-filled crevasses can propagate downwards essentially without limit, because water pressure at crack tips are higher than cryostatic pressures, allowing tensile stresses to pull the ice apart.
In the absence of surface water, longitudinal strain rates are not generally sufficiently high to promote rift formation, but when surface crevasses are filled by water, the altered force balance led to a full-depth rifting nearly simultaneously over large portions of the ice shelves.
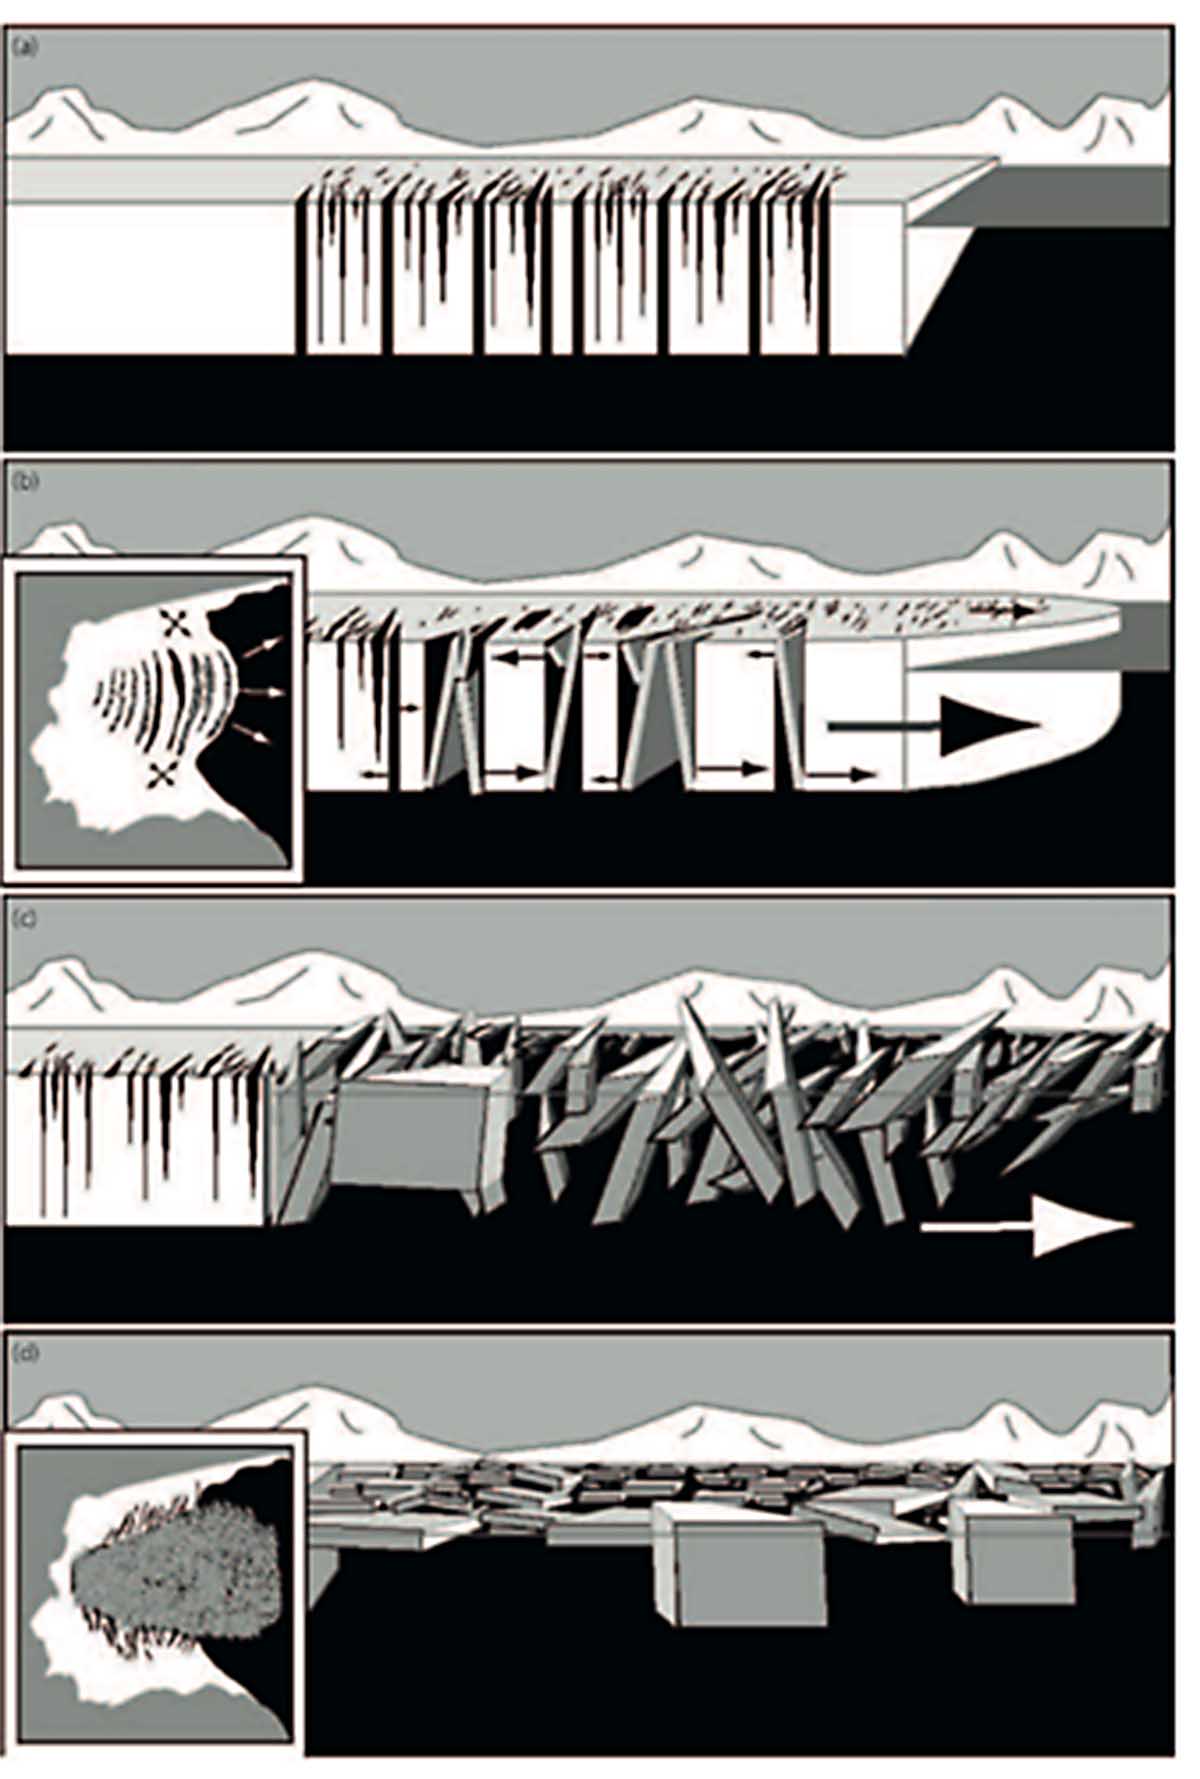
The force exerted by large blocks as they turn over during calving also appears to be a significant factor in the ice shelf collapse, in a kind of domino effect. In the image above the hypothetical mechanism of catastrophic ice shelf break-up.
Up to down, first, the longitudinal extension with inputs of ponds meltwater drives crevasses formation through the ice shelf. Rolling icebergs create extra horizontal force in the second sketch while the rapid ice disintegration event happened due to a chaotic massif iceberg spreads outwards in the third. The aftermath sees a significant fraction of capsized icebergs.
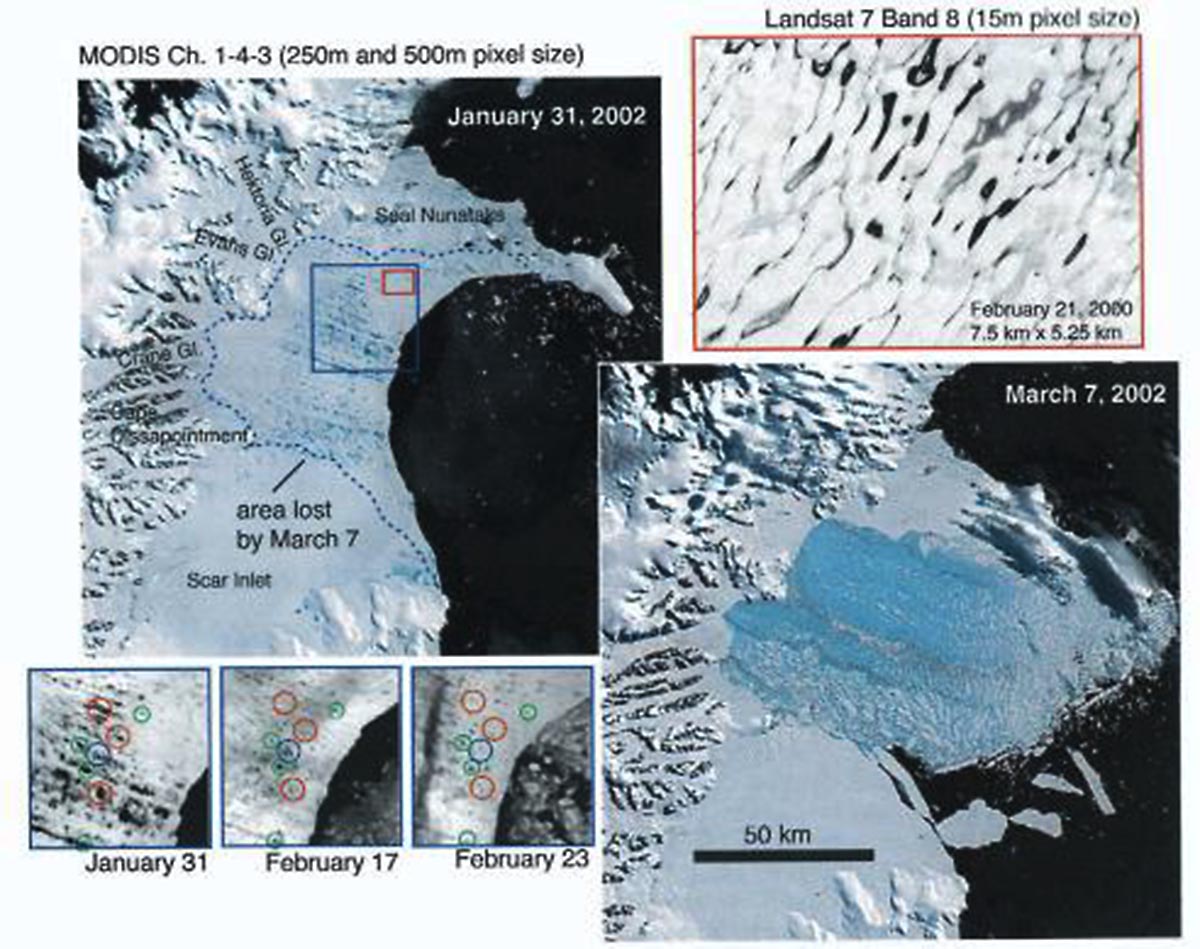
This mechanism was fully observed and documented during the catastrophic break-up of Larsen B in 2002. The final break-up followed an unusually warm summer during which large numbers of melt ponds formed on the ice shelf surfaces. After this phase, in only a few days 1200km2 of shelf fragmented into a mixture of kilometer-scale tabular icebergs and innumerable smaller pieces.
Most of the 3370 km2 of ice shelf break-up occurred between 23 February and 7 March 2002 but the break-up of the Ice Shelf was preceded by a decade of surface lowering, during which surface elevation was reduced by up to 0.27 meters every year on average.
Break-up of ice shelves also affects the dynamics of outlet glaciers that formerly fed into the shelf. For example, following the 2002 collapse of Larsen B, several glaciers underwent dramatic acceleration and thinning. A great speed-up occurred on several glaciers within months of ice shelf collapse. Glacier speed-up was greatest near the terminus, leading to high longitudinal strain rates and crevassing.
The acceleration and ice surface lowering propagated upstream over the ensuing months and continued for at least 2 years. This behavior is almost certainly the result of loss of back stress on the glaciers following ice-shelf removal.

Marine sediments in areas of recently vanished Antarctic ice shelves show that open-water conditions prevailed in the Mid Holocene, about 6 thousand years ago, prior to ice shelf regrowth in the last few millennia. Larsen B, however, appears to have existed continuously since before the Last Glacial Maximum until its recent disintegration
Has been recently observed how the extent of ice shelves collapse coincides with the -9°C mean annual isotherm, suggesting an apparently well precise temperature control on summer melting. In the image above detail of the ice shelf’s location and the -9°C isotherm with the red line. East (right) of the red line temperatures are warmer.

In July 2017, also a large section of the Larsen C shelf broke away to form an iceberg known as A-68. The ice shelf originally covered an area of 85,000 square kilometers (33,000 sq mi), but following the disintegration in the north and the breakaway of icebergs A-17 and A-68, it now covers an area of 67,000 square kilometers (26,000 sq mi).
The crack in the Larsen C ice shelf has been growing for years and after months of expectations, the final split was detected by NASA’s Aqua satellite between 10-12 July. The iceberg was one of the largest recorded. Some of this ice is still floating between the Weddel Sea and South Georgia and may remain in the area for decades, while parts of the iceberg may drift north into warmer waters.

The rift in the Larsen C Ice shelf in Antarctica. Photograph: Nasa/John Sonntag/PA
It is often emphasized that the melting of ice shelves does not actually contribute to sea-level rise because ice shelves are buoyant and already displace water. This is not actually completely true, because ice shelf melting produces freshwater, which has a lower density than salty seawater.
This means that the volume of seawater displaced by an ice shelf is less than the volume occupied by the same mass of freshwater. The volume difference is around 2.6%, and it has been calculated that if all extant sea ice and ice shelves melt, the average global sea level would rise by roughly 4 centimeters.
If all the ice in the West Antarctic Ice Sheet should melt, the global sea level would rise by 3.2 m. The Antarctic Peninsula Ice Sheet would contribute 0.24 m to global sea-level rise on full melting, and currently contributes 0.22±0.16 mm per annum. The East Antarctic Ice Sheet has a sea-level equivalent of approximately 60 m.

WHY LARSEN B ICE SHELF BROKE-UP AGAIN?
Scientists are still investigating the reason for the breakup, but the early clearing of seasonal sea ice along the Antarctic Peninsula and data we commented above, together suggest that the austral summer has been indeed warm and wet.
More, looks like the Antarctic Peninsula was grazed by an atmospheric river the day before the land-fast ice breaks up. Likely there were some intense foehn winds and swells on the exposed front to help destabilize the ice pack. But evidence further suggests that foehn winds, influenced by a large atmospheric river, helped destabilize the ice pack, as shown in the image below.

BUT WHAT EXACTLY IS FOEHN WIND?
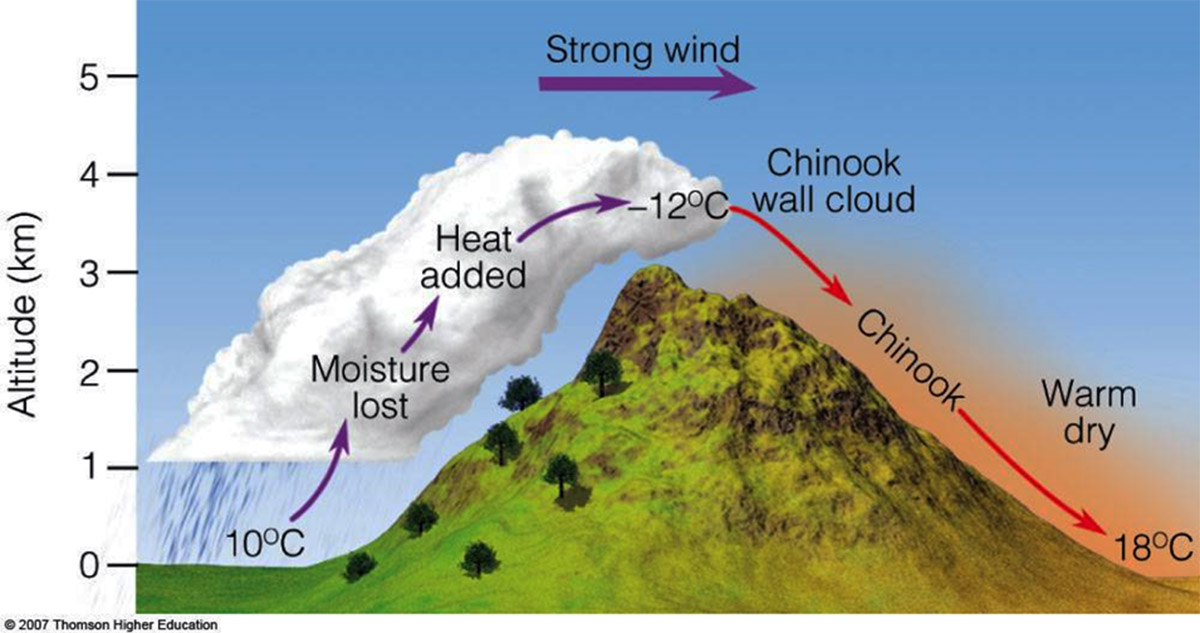
Foehn is a warm, dry, downslope wind descending the lee side of the European Alps as a result of synoptic-scale, cross-barrier flow over the mountain range. The air in the near-surface flow originates at or above the main crest of the Alpine barrier and achieves its warmth and dryness as a result of adiabatic descent.
The foehn often replaces a retreating cold air mass from a polar or arctic front, producing dramatic temperature rises that reach 10°C and occasionally even 20°C or more, sometimes in a matter of minutes. This is especially true of the so-called south foehn, which blows from northern Italy, where the air is warm, -to the north of the Alps (Austria, Germany, Switzerland), where the air is cooler and could be cold arctic air as just described.

On the windward side, there is an opposite situation with wetter conditions, condensation, and orographic precipitation. A typical situation is when northerly flux delivers tons of snow in Switzerland and Austria while in northern Italy spring conditions develop even in full winter.
The Alpine foehn has been extensively studied by European scientists, and it is recognized as the type of wind for similar downslope winds, resulting from cross-barrier flow, in other parts of the world. In other mountain ranges, the foehn has a variety of local names, including chinook in the Rocky Mountains in North America as in the image below.
The Antarctic Peninsula foehn event has occurred just after the largest melt event resulting from a strong foehn effect of this melting season according to MAR-GFS. In the image below you can see the peak gusts over the Larsen B ice shelf in meters per second. The highest wind speed has been recorded between January 18-19.
Satellite images of the often-cloudy region show the breakup that occurred between January 19-21, 2022. Sea ice cracked and drifted away from the coast, along with icebergs from the fronts of Crane Glacier and its neighbors to the north and south. Therefore, strong and warm winds were likely to play a decisive role in triggering the shattering of the ice shelf.

Nevertheless, the primary input it is certainly to be searched in the extremely warm temperatures recorded in the northern part of the Antarctic peninsula. Coastal areas of Antarctica had average to above-average surface melting.
We already discussed at the beginning as weather patterns of this summer have seen the strong Amundsen Sea low and a high positive Southern Annular Mode (SAM) so far, and the northern part of the Antarctic Peninsula experienced the most significant surface melting.
Strong, warm foehn winds recursively flowed east and downslope on the eastern side, forcing the melting. In fact, the most significant surface melting occurred in the northern part of the Antarctic Peninsula as it is clearly visible in the image below.
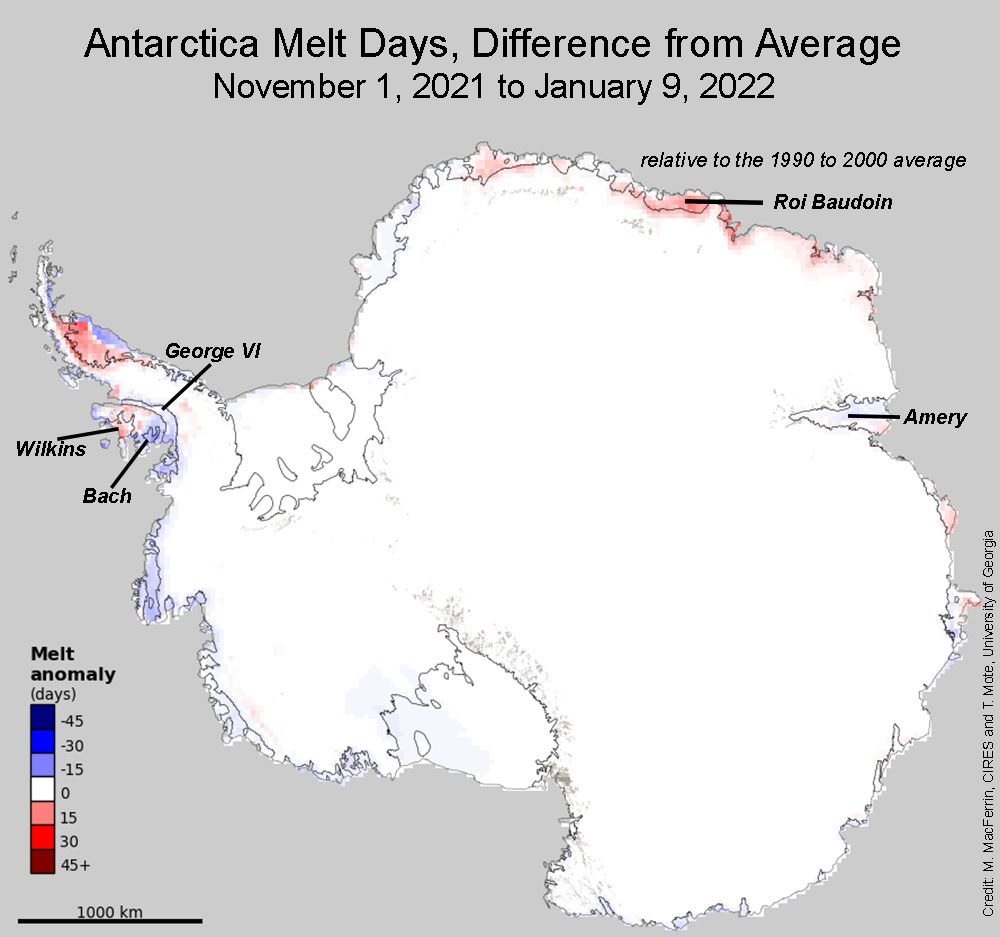
The image of the Antarctic Ice Sheet shows melt days from November 1, 2021, to January 9, 2022, just before the collapse of the Larsen B occurred. The difference from average is relative to the 1990 to 2020 reference period. Reds indicate areas of more melt; blues indicate areas of less melt.
Over the Larsen B ice shelf, melt days were between 15-30 higher than the climatology. Here, a series of windstorms have resulted in several brief early-season melt events due to the frequent foehn events. On the other side, this pattern brought snow and windy conditions to the southwestern side of the Peninsula.
We will keep you updated on this and much more, so make sure to bookmark our page. Also, if you have seen this article in the Google App (Discover) feed or social media, click the like button (♥) to see more of our forecasts and our latest articles on weather and climate.
SEE ALSO: