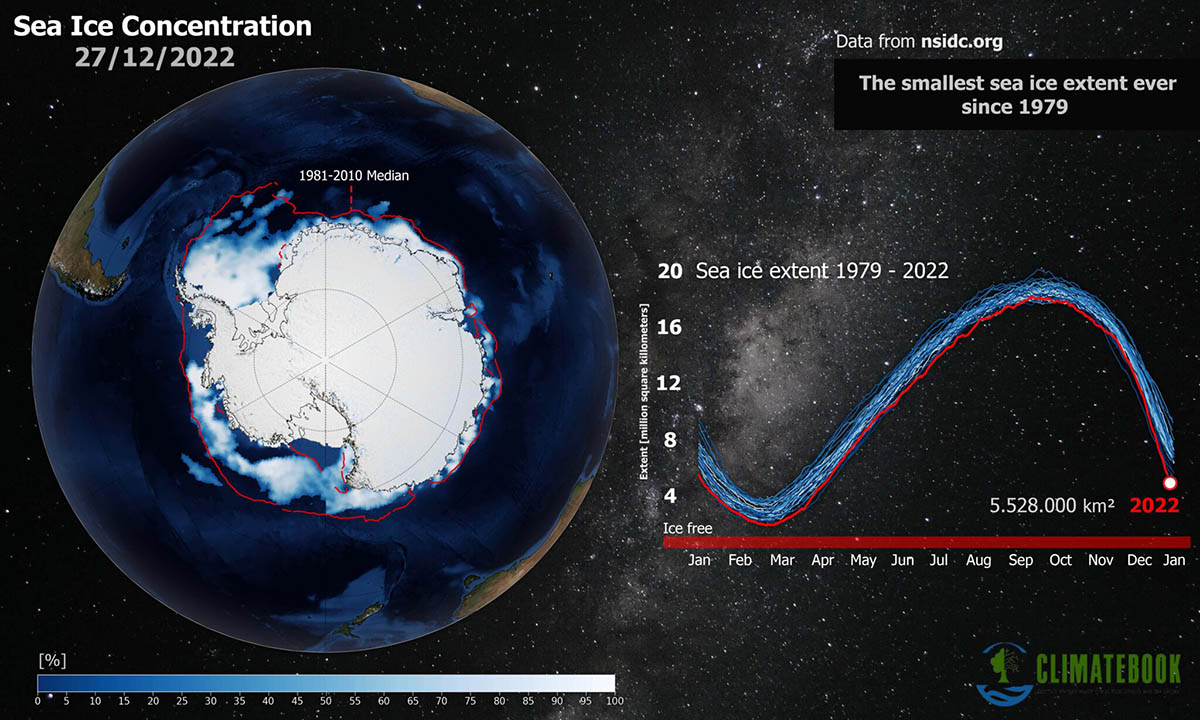
At the end of December, sea ice in Antarctica reached its lowest extent on record. Yet, in the long-term Antarctic sea ice still shows an increasing trend which is opposite to what has been observed so far in the Arctic. Globally, the sea ice anomaly in the two poles is about three million square kilometers, possibly reaching the lowest sea ice extent ever recorded.
SEA ICE EXTENT
Sea ice extent is one of the most critical aspects of the polar climate system. This is why increasing focus and consideration have been given in recent years. It is mainly because the Arctic has shown a massive and rapid decrease in the sea ice extent lately. Another reason is that sea-ice reduction in the Arctic amplifies the warming trend of the northern hemisphere, mainly due to ice-albedo feedback.
On the contrary, despite moderate warming, the sea ice area and volume around Antarctica showed no significant trend in the last 40 years and a slow increase on average. But in 2015, something changed, and we will soon explain how in the image below, the present sea ice extent anomaly.
map source climatebook
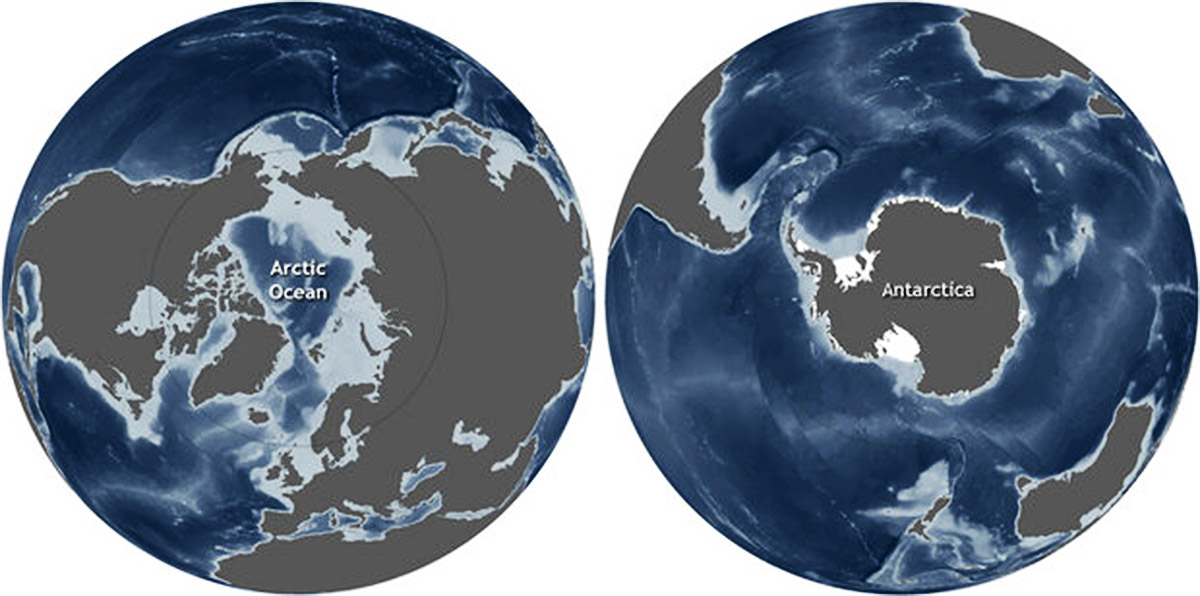
The Arctic and Antarctic regions are geographic opposites, not just because they stand on opposite ends of the Earth’s globe. They have opposite land-sea arrangements. In Antarctica, oceans surround the coldest continent on Earth. In the Arctic, the coldest and smallest ocean on Earth, is surrounded by the land masses of Eurasia, North America, Greenland, and Iceland.
These differences in the arrangement of land and water contribute to differences in each polar region’s climate, mainly due to different oceanic and atmospheric circulation patterns. These two aspects are crucial for sea ice evolution.
Antarctic sea ice normally peaks in September or October and reaches a minimum in February. In some places, sea ice melts completely in the summer. These two maps below from 2021 provide an example of how Antarctic sea ice typically varies between the annual minimum and maximum.
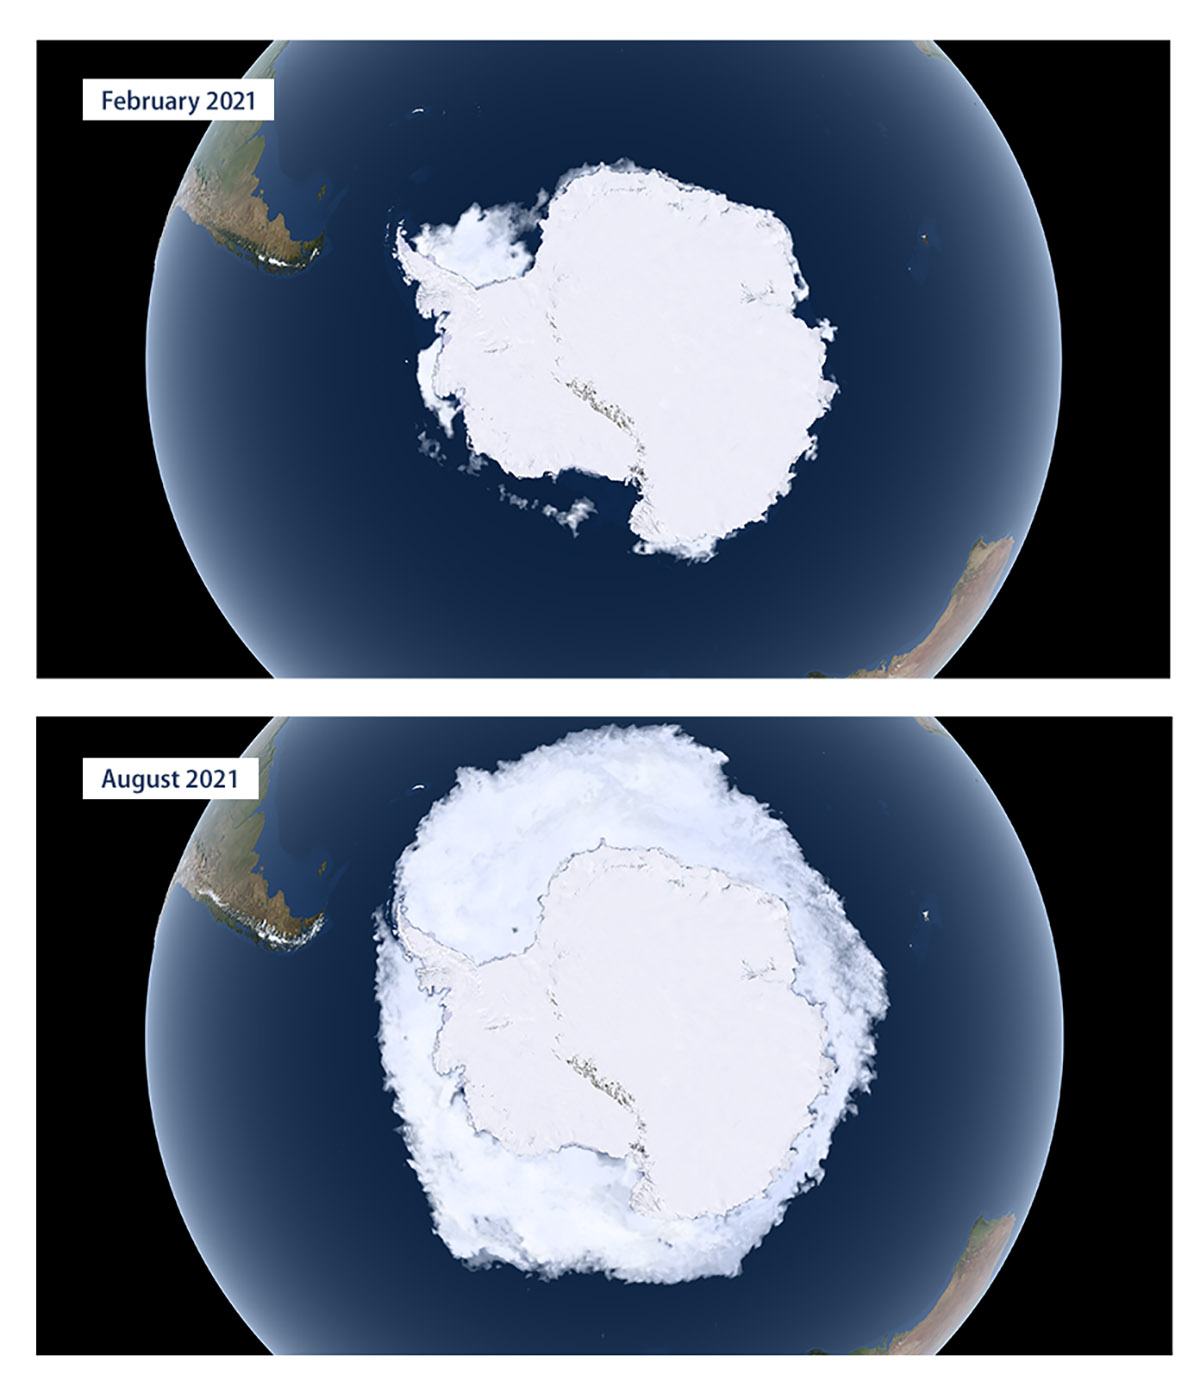
The cold waters around Antarctica allow rapid sea ice formation in winter. At its maximum extent in September, sea ice cover is generally between 18-19 million square kilometers.
It shrinks to about 3 million square kilometers in summer, generally in February. This is a much larger fluctuation than in the Arctic, where the configuration of the continents encourages the retention of ice for longer periods.
More, unlike the Arctic, where the average sea ice area has been decreasing by about 4% per decade, the average area of Antarctic sea ice has been increasing at a rate of about 1.7 % per decade. Measures have been taken continuously since 1978.
Whether such an increase is a sign of meaningful change is still uncertain because ice extents vary considerably yearly around Antarctica. In three consecutive September from 2012 to 2014, satellites observed new record highs for winter sea ice extent. These highs occurred while the Arctic saw record lows.
In the image below, the solid lines indicate 12-month running averages, while the dotted lines indicate the overall trend. Units of extent refer to the extent of change from the average. The source is the National Snow and Ice Data Center.
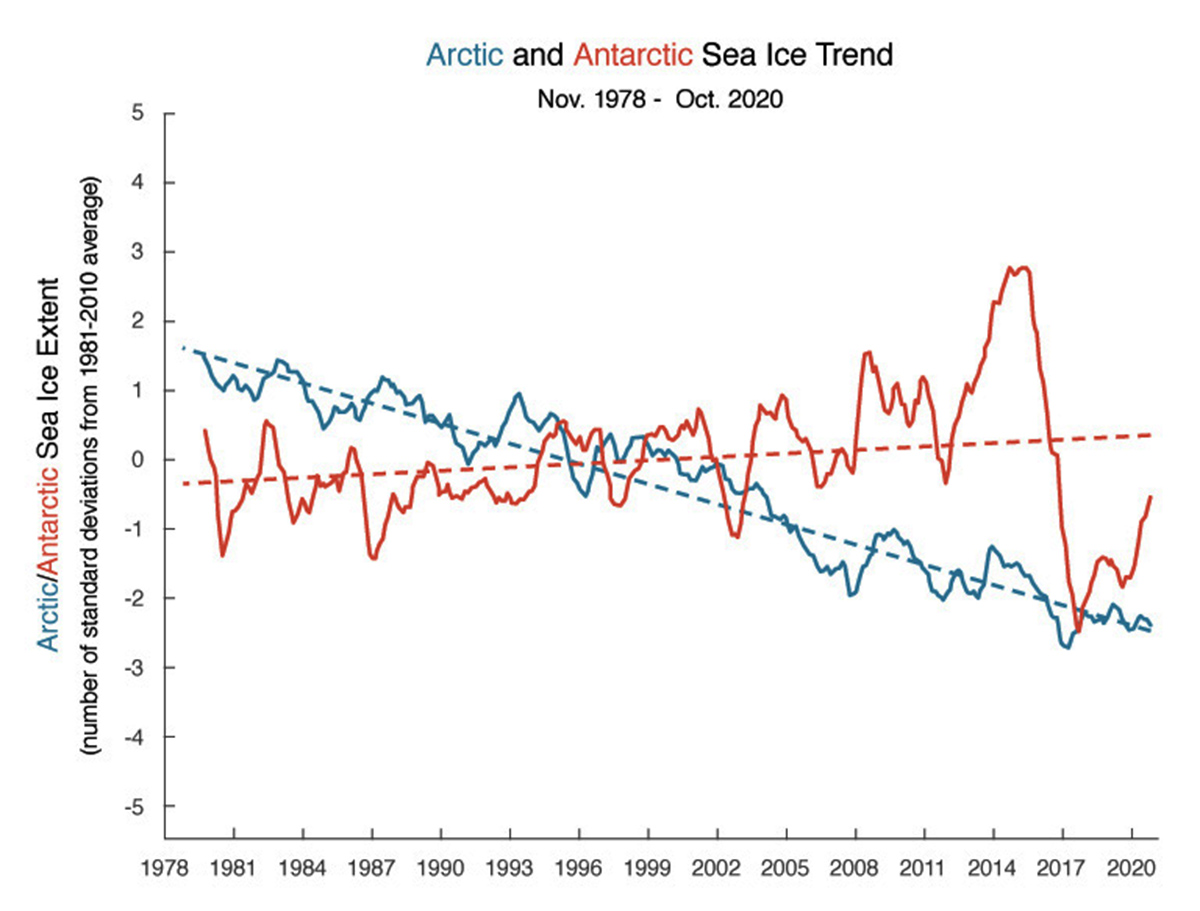
Satellite-based observations started in the late 1970s and show that rapid changes have been occurring in the Arctic. Here, the ice coverage declined at a substantial rate. In contrast, in the Southern Hemisphere, the long-term sea ice extent increased slowly, although at a smaller rate than the Arctic’s reduction.
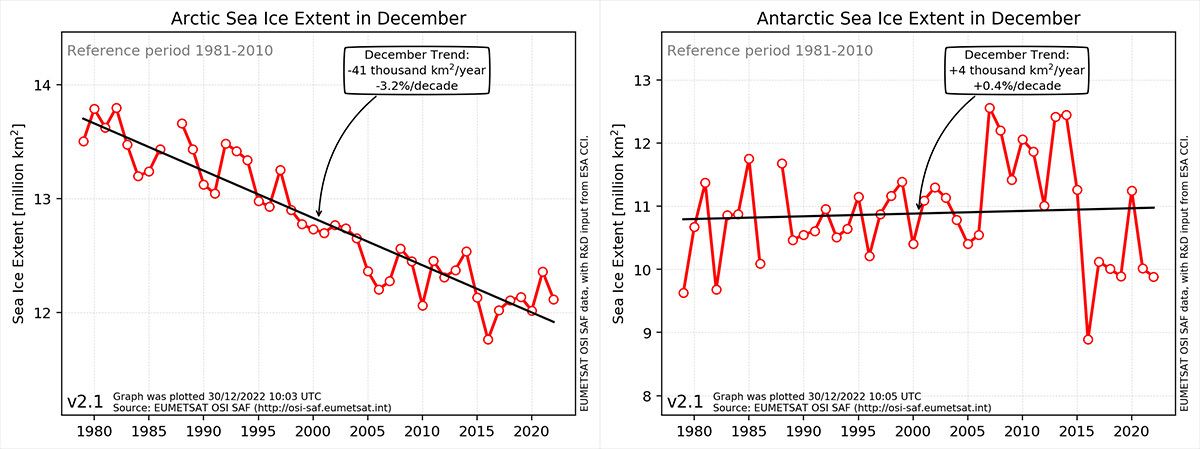
The annual trend is very similar to observations made in December. In the image below, we can see how in December, the Arctic is losing, on average, 41 thousand square kilometers every year. The December trend of Antarctic Sea ice is very weak, with an increase of 4 thousand square kilometers yearly, which means an area increase equal to 0.4% every ten years.
In the video below, you can see the evolution of maximum Antarctic sea ice concentration at the end of the winter season (end of September) and minimum Antarctic sea ice concentration at the end of the summer season (end of March) from 1979 to 2021. The source is OSI SAF
But this year, following the record low sea ice extent observed in late February 2022, sea ice concentration anomalies for the Antarctic region show a large reduction compared to December’s average.
Overall, below-average concentrations dominate in all the sectors around Antarctica. The end-of-December 2022 situation is visible for each of the five main sectors in the image below graphic Zachary Labe.
Sea ice extent anomaly is particularly marked in the Bellingshausen and Amundsen Seas. The area without ice is the largest ever recorded.

Despite such an important negative sea ice anomaly, in November below, average air temperatures in the Antarctic have been recorded. Otherwise, the largest warm anomalies were found in the Northern Hemisphere.
In the very informative graphic by Zachary Labe, we can visualize what we just wrote. Colored bars showing the average November temperature are plotted against Latitude. While almost everywhere on the planet, temperatures were higher than average, especially in the Arctic, Latitude south to about 70 degrees in the Southern Hemisphere experienced negative temperature anomalies.

As with other recent months, almost all of the Earth’s surface had above-normal temperatures in November. However, significant regional cooling brought down the global average, including in western North America, Australia, and Antarctica.
This November snapshot is given in the image below, thanks to Berkeley Earth. Data are plotted against the 1951-1980 average.
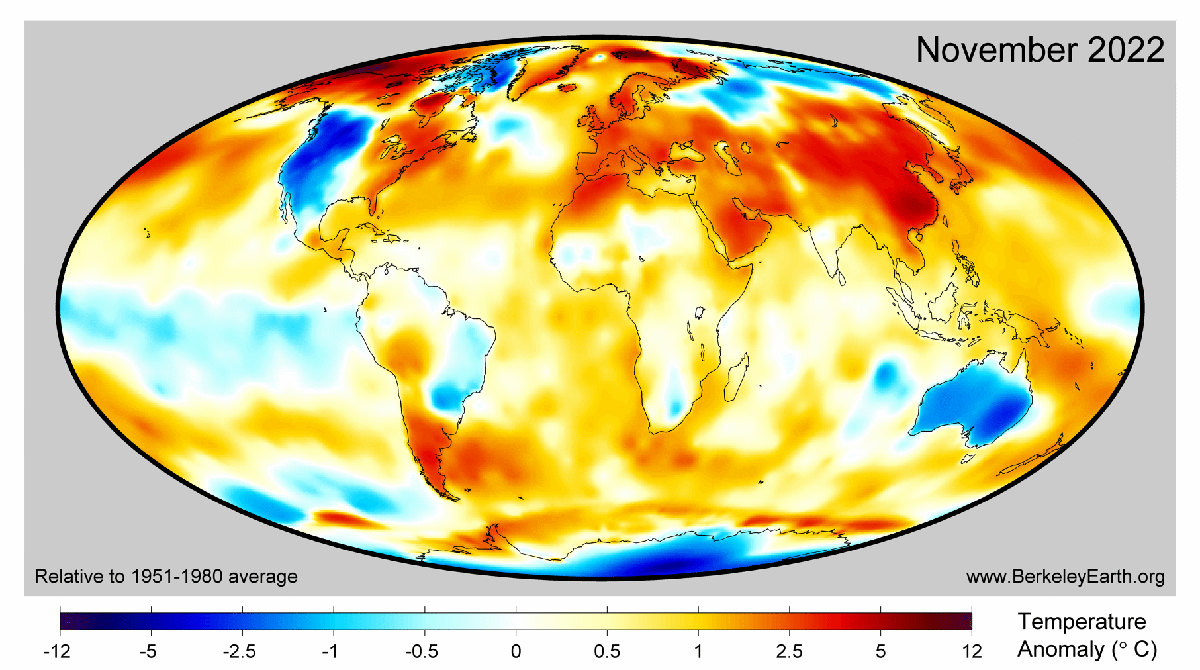
We can see how continental Antarctica shows below-average temperatures, except for the Antarctic Peninsula. This indicator tells us that winds flowing around Antarctica and the sea temperature were milder than average, but not the continent.
It was not only the month of November that was colder. Generally, the year 2022 was below average. Although continental Antarctica is losing ice mass in the long term due to amplified melting at an average rate of about 150 billion tons per year, in 2022, we can see a small increase. In the image below, we can see the ice mass losses over Antarctica since 2004.

Now in the southern hemisphere is summer, and each day with 24 hours of light in Antarctica receives about 500 Watts per square meter of sunshine. This means the melting rate is at its highest.
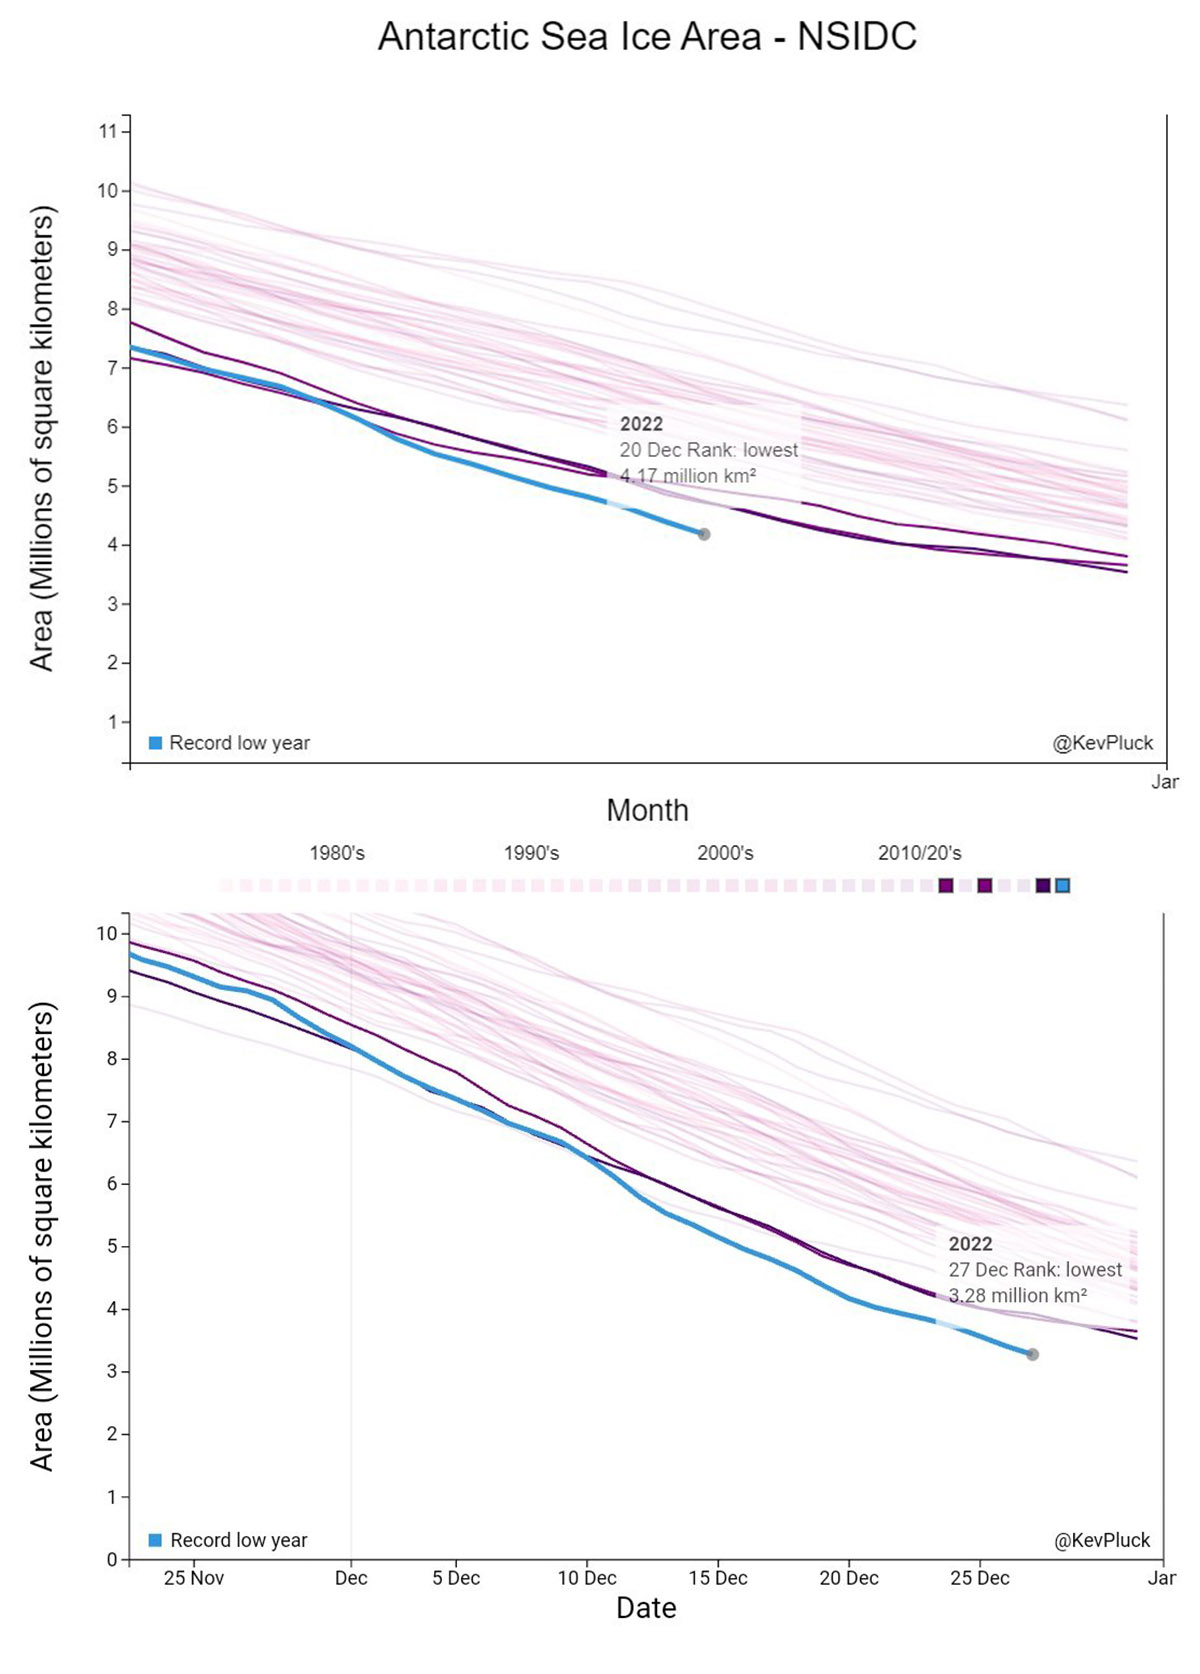
In the image below, we can see what difference a week makes in the Antarctic during the Southern Hemisphere summer and when Earth is also closest to the sun. The left image refers to 20 December, and the right image refers to 27 December 2022.

Antarctic Sea Ice Area now is 580,000 square kilometers lower than the record low for the end of December. According to NSIDC, on 20 December, it was at 4.17 million square kilometers and just a few days ago was already as low as 3.28 million square kilometers. Graphic courtesy Kevin Pluck in the image below.
In the image below, we can see the current Antarctic sea ice extent. The gray line indicates 1981 to 2010 average extent for the day shown. The graph also includes a green line earlier season, 2021-22, for comparison.
The graphic is uploaded daily with one-day lag by the National Snow and Ice Data Center of Colorado Boulder.

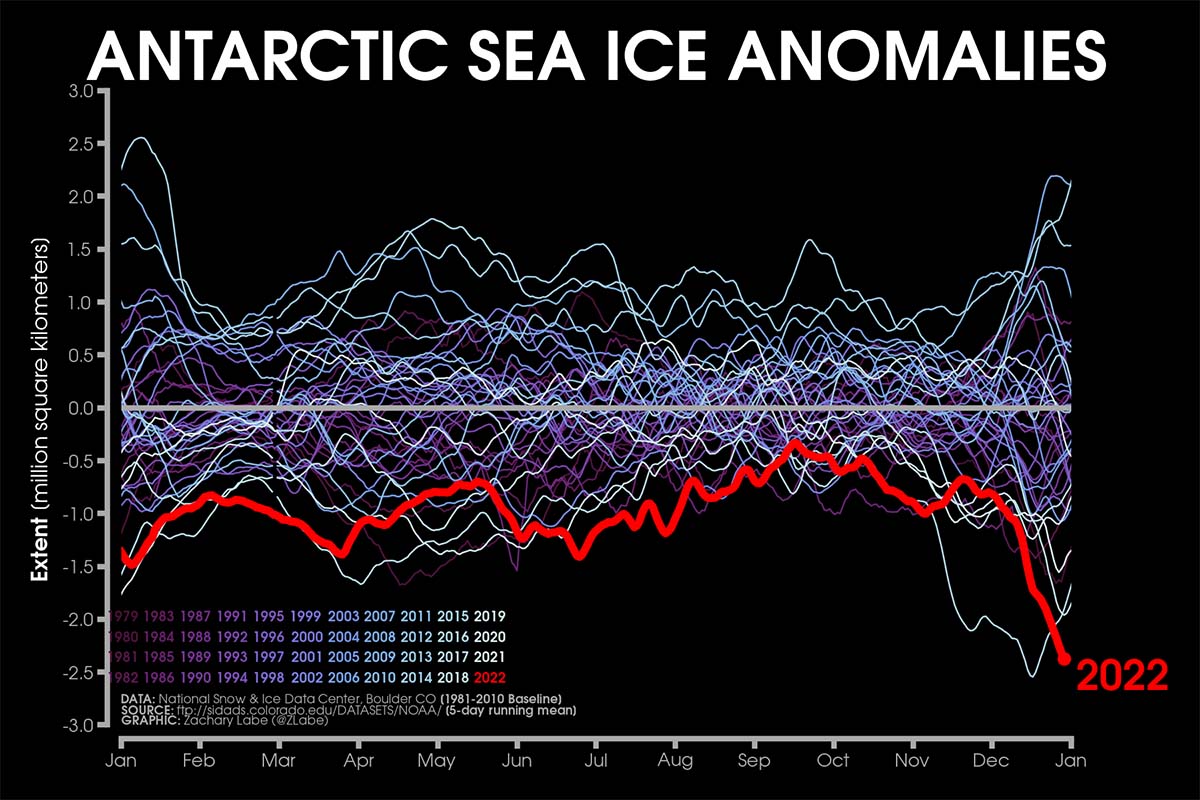
The next image below shows the Antarctic sea ice extent anomalies for each year from 1979 to 2022. Data comes from satellites (NSIDC, DMSP SSM/I-SSMIS). Anomalies are calculated by averaging five days from the 1981-2010 climatological baseline, plotted with a red line. The graphic was updated on 29 December 2022.
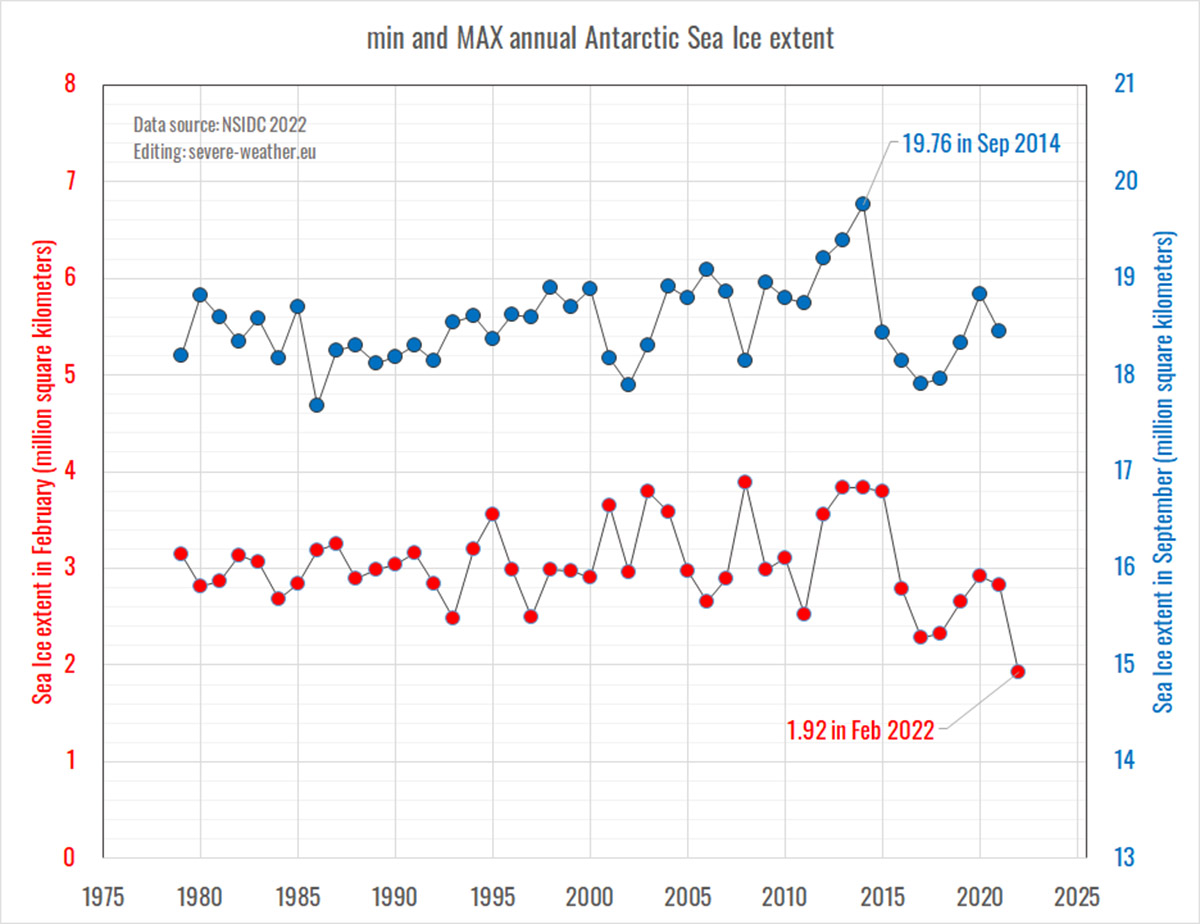
THE RECORD LOW SET ON 25 FEBRUARY, 2022
Although 25 February 2022 did not represent the most negative anomaly of the Antarctic record, it was so for the end of February when the usual annual climatic minimum occurs.
This is also clearly evident in the image below, which shows the Antarctic sea ice extent anomalies stretching from January 1979 to the present-day thanks to satellite era, NSIDC, DMSP SSM/I-SSMIS.
While overall sea ice extent has only slightly increased since the late 1970s, the rate of increase began to accelerate in 2000, and ice extent reached a record high in 2014. But then something unexpected happened. It dropped drastically over the next three years, reaching a record low in 2017.
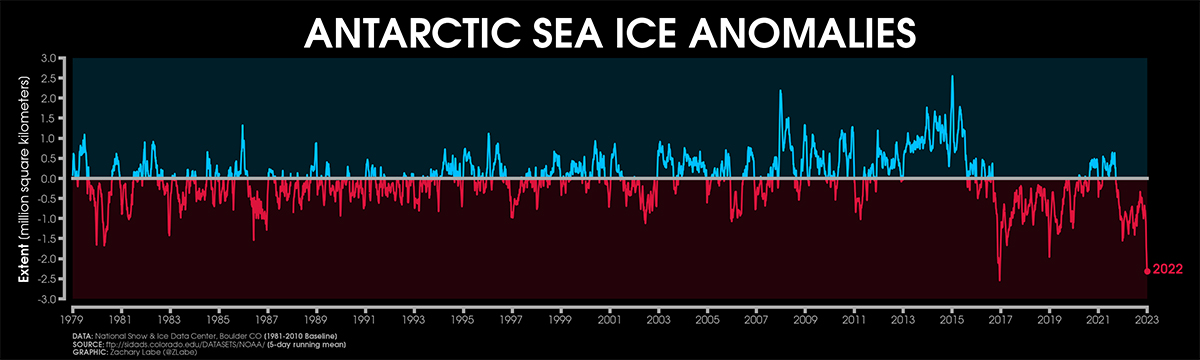
The year-to-year variability and the long-term sea ice extent increase of about 1.7% have been documented since the beginning of the satellite era, in the season 1978-79. In the 2000s, several highly positive anomaly peaks occurred. In contrast, several negative anomalies have been observed in the last few years.
When looking at this curve from a different perspective, we can see at least three short-term trends. In the image below, redrawn from the original one set by Zachary Labe, we highlight the recent sea ice variability and the short trends.
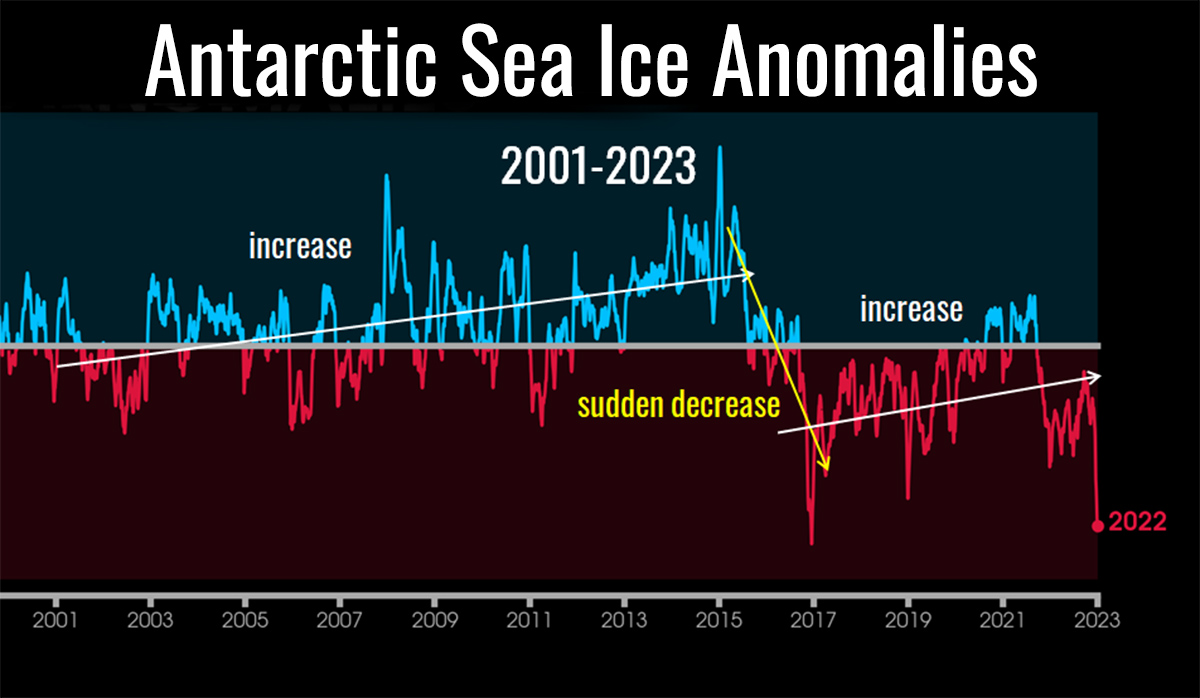
The slow increase observed in the 2000s, and particularly evident in the period 2011-2015 when sea ice extent was substantially always above average, ended sharply in 2016. A rapid and extensive decrease with massive negative anomalies peaked in 2017. In the following four years, sea ice extent was continuously below the 1981-2010 average.
From 2017 on, a new slow increase has been observed, and in 2021 the sea ice extent showed periods of positive anomalies again. The three main negative peaks occurred at the end of 2016, 2018, and February 2022. The positive peaks follow an increasing trend too. But now, the large end-of-2022 negative anomaly raises an essential question about how Antarctic sea ice will evolve and how sea ice in the Arctic will behave in parallel.

SEA ICE DECLINING AND ICE SHELVES OF THE ANTARCTIC PENINSULA
Within Antarctic sea ice, there is a variation from place to place around the continent. On a regional scale, sea ice extent has increased slightly in the eastern Ross Sea sector, while it has reduced around the Antarctic Peninsula.
It is the region that likely experienced the greatest climate modification lately, and it is also the area of Antarctica where several ice shelves are showing signs of weakness.
In short, Antarctic sea ice shows a nearly flat trend, but large-scale variations make the trend very noisy.

Rapid disintegration of part of the Larsen B ice shelf, which already dramatically collapsed in 2002, occurred between January 19-20, 2022.
This breakup was the latest in a series of remarkable events in the Larsen B embayment over the past twenty years triggered by several factors. In 2022, a warmer-than-average summer and a series of remarkable foehn storms triggered this huge umpteenth collapse.

It is often emphasized that melting ice shelves does not contribute to sea-level rise, which is likely one of the biggest issues for future generations. It is supposed to be like this because ice shelves are buoyant and already displace water. This is not completely true because ice shelf melting produces freshwater, which has a lower density than salty seawater.
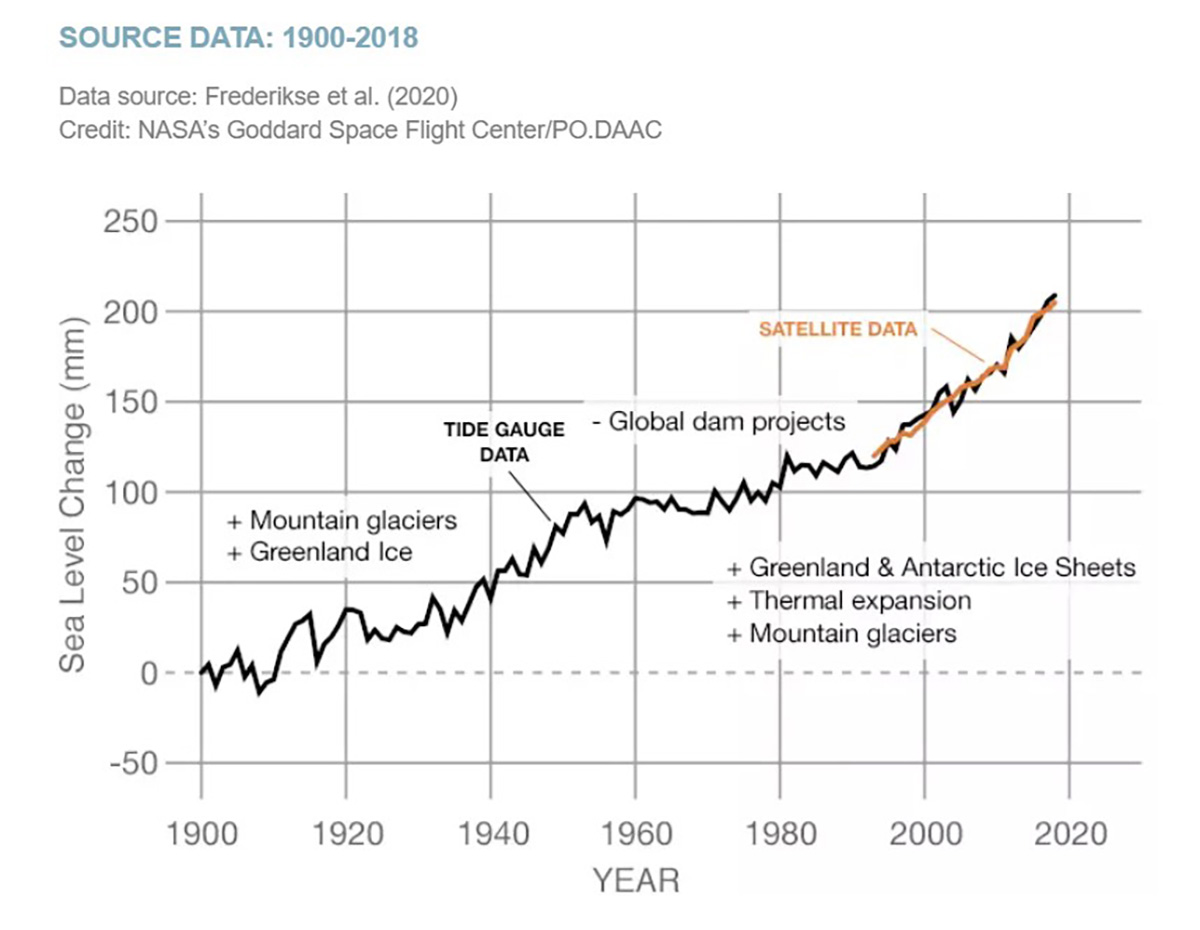
This means that the volume of seawater displaced by an ice shelf is less than the volume occupied by the same mass of freshwater. The volume difference is around 2.6%. It has been calculated that if all the existing sea ice and ice shelves melt, the average global sea level will rise by roughly 4 centimeters. In the end, sea level rise is caused primarily by two factors related to global warming: the added water from melting ice sheets and glaciers and the expansion of seawater as it warms.
If all the ice in the West Antarctic Ice Sheet melted, the global sea level would rise by 3.2 m. The Antarctic Peninsula Ice Sheet would contribute 0.24 m or 0.79 feet to global sea-level rise on full melting and currently contributes 0.22±0.16 millimeters or 0.009±0.6 inches per annum. The East Antarctic Ice Sheet has a sea-level equivalent of approximately 60 meters or about 197 feet.
The Arctic and Antarctic Sea Ice extent now push the global anomaly at -1.864 million square kilometers or about 0.720 million square miles. In the image below, the current sea ice extent anomalies for the Arctic and Antarctic, source NSIDC, DMSP SSM/I-SSMIS F-18 edited by Zachary Labe. Anomaly-based on 1981-2010 climatology
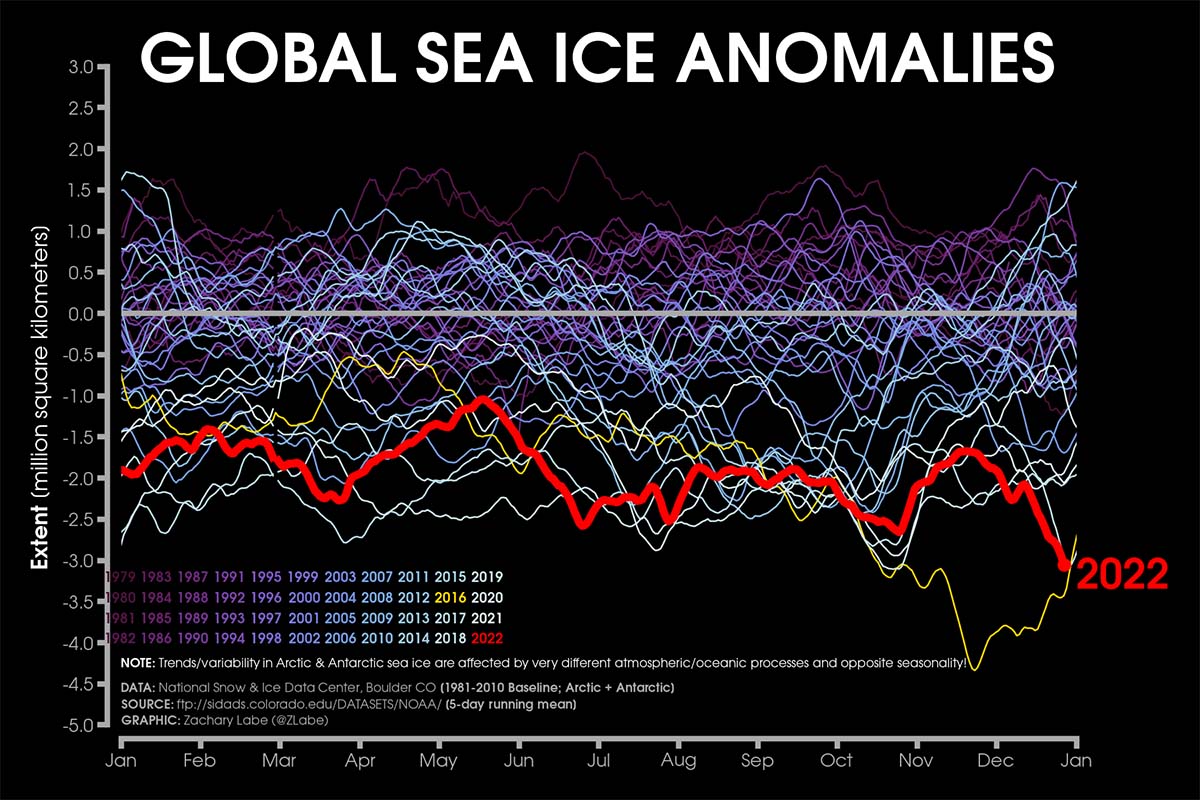
The Global sea ice extent anomaly (Arctic + Antarctic) for each year from 1979 to 2022 is plotted in the image above and updated to 27 December 2022, when the negative anomaly was greater than 3 million square kilometers.
We will keep updating the sea ice extent in the Arctic and Antarctic seas and much more. So make sure to bookmark our page. Also, if you have seen this article in the Google App (Discover) feed or social media, click the like button (♥) to see more of our forecasts and our latest articles on weather and nature in general.