Hurricane season 2020 has been very active so far, with many records broken in a short period of time. A short break has now begun, with the activity slowly shifting to the Caribbean sector, aided by the incoming MJO wave.
2020 HURRICANE SEASON SO FAR
The hurricane season was quite astonishing so far and marked as hyperactive. As of September 23rd, there were 23 named storms, which is almost 3-times more than the long term average (8.3) for this time period. 20 storms out of those 23, had the earliest formation date on record.
As an example, the average date for the formation of the 8th storm of the season is September 24th. This means that the 2020 hurricane season is running 15 storms ahead of schedule.
The image below, produced by Sam Lillo (@splillo), shows the number of storms per a specific area. We can see the activity was high in the Gulf of Mexico, extending up to the east coast of the United States.
We witnessed over 78 named storm days, which is twice the average number (38.9). 8 hurricanes have developed so far, which is twice the amount in the long term average period of 1981-2010 (4.1). The only number that was lower than the long term average, are the major hurricane days.
But the 2020 hurricane season has even more numbers to show. Nine storms have made landfall on the mainland United States, which ties the record from 1916.
September is also the busiest month of the season, with recorded 10 storm formations in 2020. This broke the previous record of 8 storm formations in September, achieved in 2002, 2007, and 2010.
The 2020 hurricane season has also seen 3 storms forming in a single day, tying the record from August 1893. And for a brief period of time, there were 5 storms active at the same time in the Atlantic. That is not a new record, but it is only the second time in the known history to have 5 or more storms active at the same time. The current record was set on September 11t, 1971, with 6 active storms at the same time.
The image below shows the storm tracks for the 2020 Hurricane season so far. The image is provided by Wikipedia, based on the official data from the National Hurricane Center.
We usually also look at the energy output of a hurricane season, in addition to its numbers. It is measured/calculated as the Accumulated Cyclonic Energy index, or ACE.
The image below from Sam Lillo (@splillo), shows the current energy output (ACE) of the season, which is running above average. But it is not very high or near record-breaking, despite the high storm numbers. There were only 2 major hurricanes, which usually have the highest energy output. The strongest storm of the season so far was a category 4 hurricane Laura, which was the strongest hurricane on record to make landfall in the U.S. state of Louisiana. It produced sustained wind speeds up to 240 km/h (150 mph).
OCTOBER APPROACHES
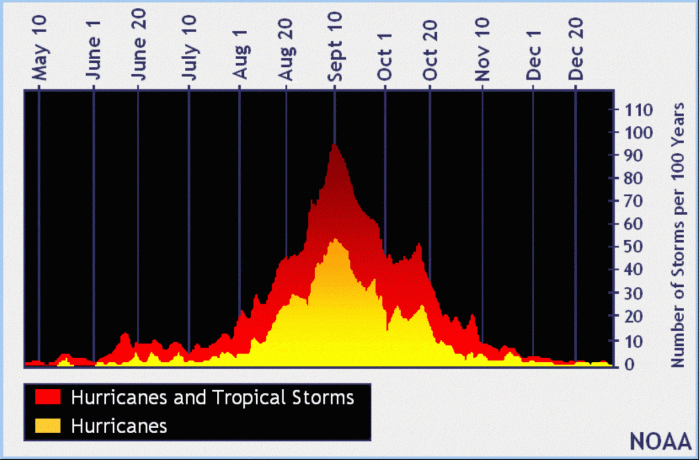
The month of October is usually a more quiet month than September, in a hurricane season. But as we can see on the storm frequency graph below from NOAA, October usually presents a secondary “peak” of activity, both with tropical storms and also hurricanes. But the graph shows data per 100 years, so not every year follows the same pattern.
An important change from September to October is the shift of activity closer to the mainland United States. The image below highlights the usual storm development areas in October. As the African easterly wave slowly shuts down, the Caribbean area usually takes over as the source region of storms.
Looking at the historical October data, we can see that the highest frequency of storms comes from the Caribbean area and the Gulf of Mexico. There is still activity in the Atlantic, but shifting towards the west, as the east slowly shuts down.
THE MJO WAVE IS COMING
So what can we expect from the October 2020 hurricane season? The current trends tend to suggest a typical October pattern. The sea surface temperatures are still very warm in the Atlantic, with the Caribbean area reaching above 30°C (86°F).
Sea surface temperatures are usually very warm at this time every year, but the anomalies reveal that they are still several degrees above normal in the broader Caribbean area. We can see the colder than normal sea surface temperatures in the northern Gulf of Mexico, left behind by Hurricane Sally.
Just as the Ocean stage is set, we are tracking an MJO wave approaching the Atlantic from the west. It is set to initiate tropical activity in the first two weeks of October.
But what is this MJO wave? Unlike the polar regions or the mid-latitudes, we have no warm or cold fronts in the tropics. Here, the weather consists mostly of convective weather (thunderstorms) and large-scale pressure and wind variability. A lof of the tropical variability is driven by invisible wave-like features in the atmosphere.
The largest and most dominant source of short-term tropical variability is the Madden-Julian Oscillation (MJO). MJO is an eastward moving disturbance (wave) of thunderstorms, clouds, rain, winds, and pressure. It moves around the entire planet on the equator in about 30 to 60 days.
The MJO consists of two parts: one is the enhanced rainfall (wet) phase and the other is the suppressed rainfall (dry) phase. The graphic below fromNOAA Climate shows the basic dynamics of the MJO. Increased storms and rainfall on one side and reduced storms and drier weather on the other side. What we can see here, is that on the top, the air is diverging (moving away) over the wet phase, and converging (moving together) over the dry phase. This horizontal movement of air is referred to as the Velocity Potential in the tropics.
We can track the entire MJO wave movement, by looking at the larger scale air movement, and the areas where the air is rising and where it is subsiding. The graphics below show just that. They show the horizontal movement of air at different altitudes. 200 CHI is the velocity potential in the upper layers, and the 850 CHI is in the lower levels. We see the wet phase (green) of the MJO wave moving east, from the Pacific into the Atlantic.
It is obvious that in the first half of October, the MJO will pass over the Caribbean area, lowering the pressure and providing a strong boost to thunderstorm activity. The precipitable water forecast also shows that a high amount of moisture will be available for any system that forms.
We produced a high-resolution video, which shows the forecast of atmospheric rivers in the Caribbean area. Take notice of the final frames, as you can see the cyclonic air movement out from the Caribbean, as the pressure is dropping and convection increases. This video is a great display of just how fluid the atmosphere really is.
An MJO wave also brings along a lower wind shear environment. That is another factor that helps in storm development and organization. There will be however a higher wind shear area closer to the mainland United States (red colors), as a low-pressure system parks over the eastern half of the United States.
The sea surface temperatures look to remain above normal, providing enough fuel for potential storm development. The second image below shows the Ocean Heat Content. It takes into account the depth of the sea, and how warm the waters are at depth. We can see a large pool of high available heat energy, as the warmer waters run down quite deep. That provides a thick layer of warm water for the storms to draw energy from.
Looking at the more near term forecasts, we have to use the ensemble models, which are already starting to show a shift of activity in the Caribbean when going into October. Below we can see the individual calculations in the ensemble system, simulating low-pressure areas spawning in the Caribbean. A higher number means lower pressure.
Pressure anomalies also show a potential low-pressure zone developing in the western Caribbean, also as a response to the MJO wave moving into the region.
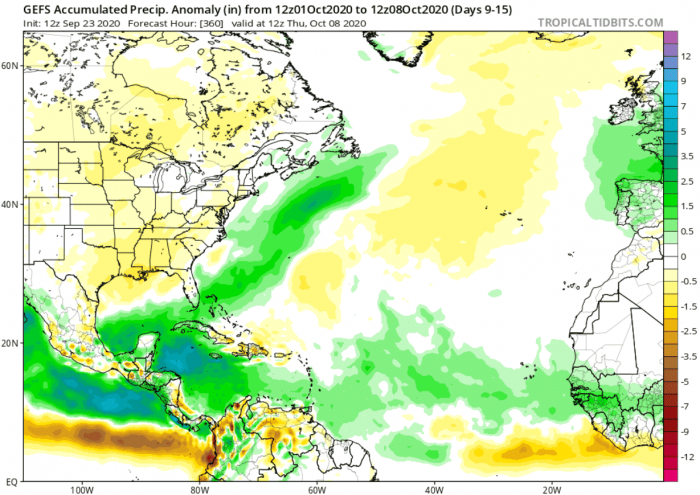
Precipitation forecast shows the increased precipitation from the Caribbean, tracking up towards Florida and further northeast. The main area to watch is the higher precipitation zone we see on the map in the western Caribbean. it corresponds well to the overall dynamics that are in play. This could be a reagin of new tropical storm formation.
A limiting factor could be the increased wind shear over the Gulf area. But this is highly dependant on the larger scale pattern over North America, so could be subject to change. We can see that the Caribbean area has low wind shear, and is a favorable environment to produce tropical storms and even potential hurricanes.
The Caribbean area is definitely of concern, as the MJO wave moves over, creating favorable conditions for tropical storm development. Conditions will allow formation, but it is not yet clear what the conditions will be for strengthening and organization.
The likely path of the forming storms will be towards the north and northeast. This puts Florida at risk of landfall if storms start to organize. October is actually the statistical peak of tropical storm landfalls in Florida. The current October trends are starting to show the same pattern emerging, that would steer emerging storms into Florida and the southern Gulf coast.
We will keep you updated on further development, so make sure to check back for new updates.
Read more about:
Busy hurricane season 2020 continues. We are out of traditional hurricane names, the Greek alphabet is now in use


