Daylight is slowly expanding towards the Polar region as we’re going further into spring. This means we can observe some pretty spectacular imagery on the Arctic region sea ice extent we couldn’t see weeks ago during the polar night. Over the last few weeks, some clear days finally opened the skies so we can see various areas within the Arctic circle in detail. Let’s take a look over the most impressive parts of the Arctic region.
Novaya Zemlya
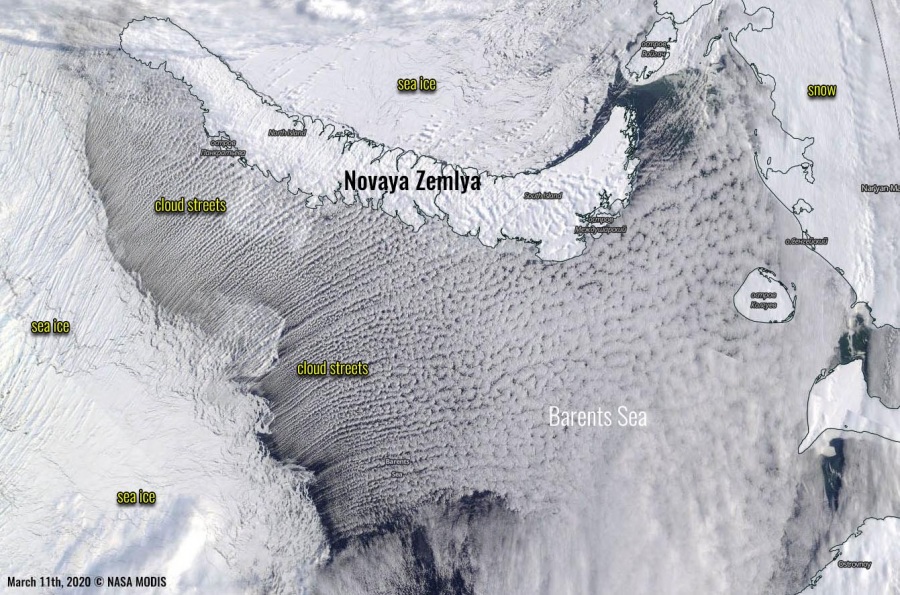
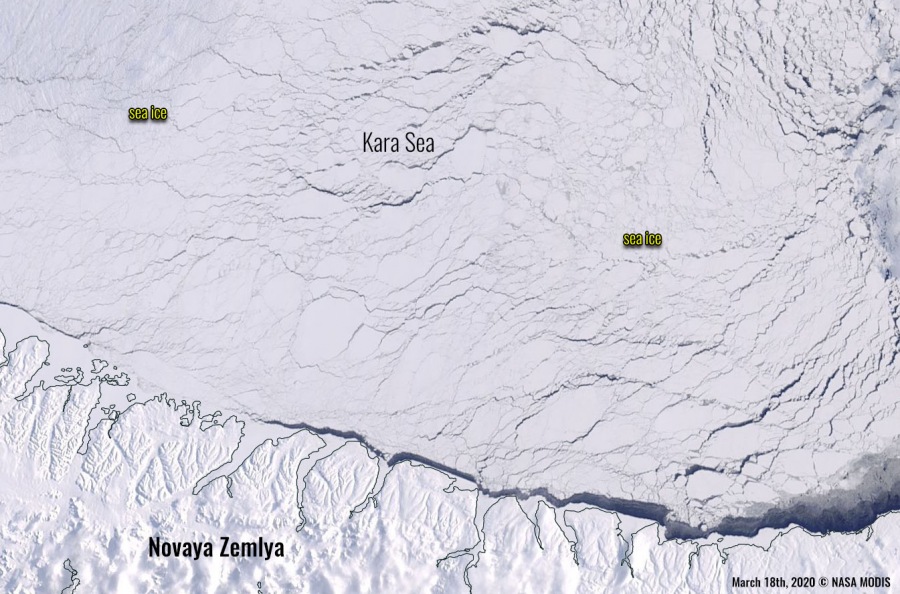
Novaya Zemlya is an archipelago in the Arctic Ocean in northern Russia. West of Novaya Zemlya in the Barents Sea, and to the east is the Kara Sea. The two main islands are often blasted with Arctic air mass a normally we would be seeing sea ice surrounding the islands. We can see the sea ice is only to the east of Novaya Zemlya (Kara Sea), but no ice west of it over the Barents Sea – that is a well-below average sea ice extent (see more details at the bottom). The first image indicates a textbook example of a very cold Arctic (or better said Polar) air mass advection over the Barents Sea, coming from the polar ice cap. Convective cloud streets are visible – their orientation indicates strong and cold winds are blowing onto the warmer sea below. The gap between the ice and the cloud streets occurs as the cold winds need some time and space (a distance of open water) to pick up enough moisture to start forming horizontal convective rolls (clouds). The second image is revealing a lot of cracks in the sea ice shield over the Kara Sea.
Svalbard
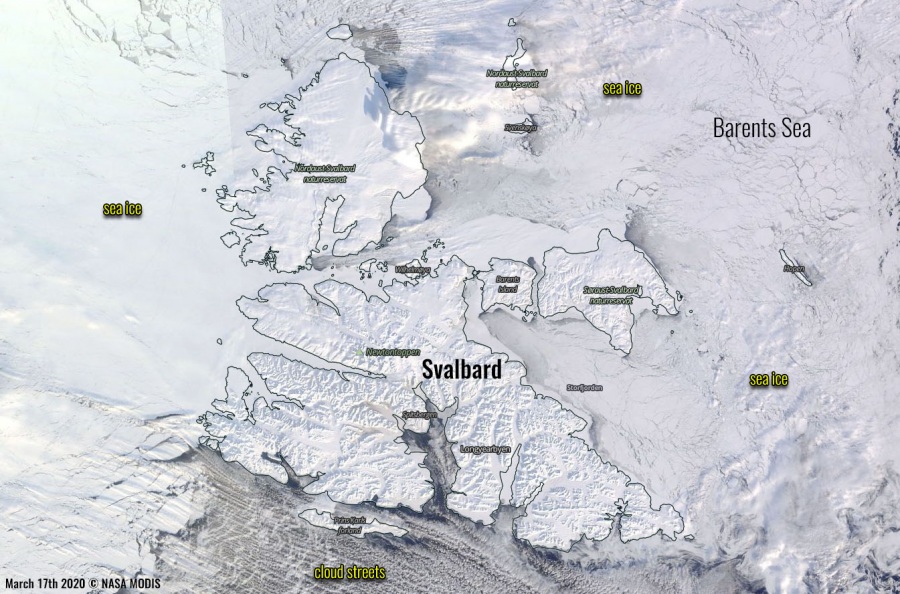
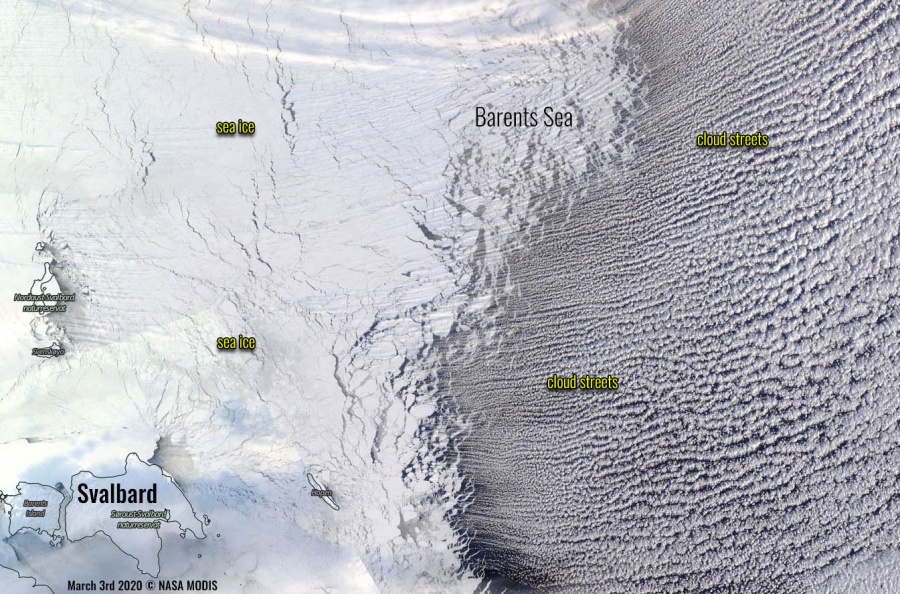
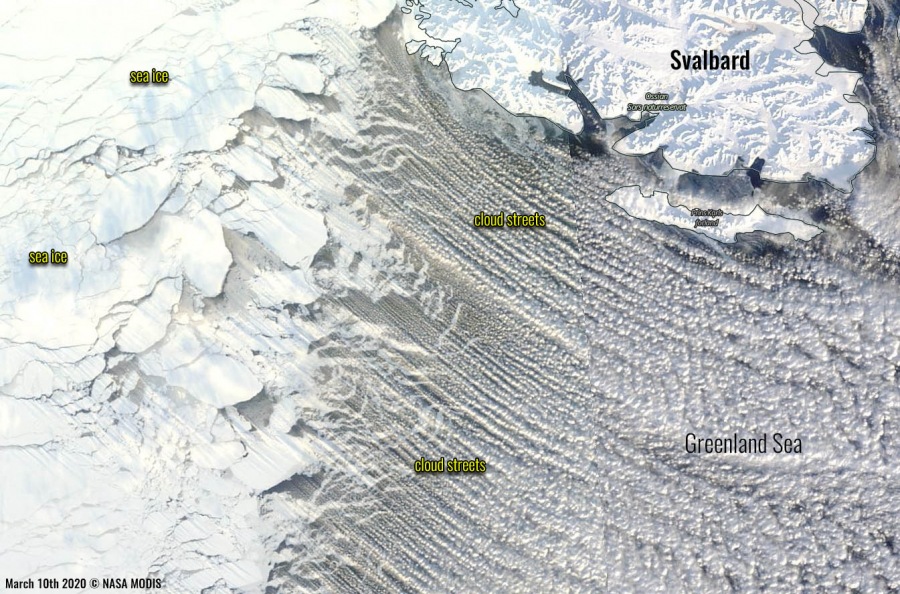
Svalbard is a Norwegian archipelago in the Arctic Ocean. Situated north of mainland Europe, it is about midway between continental Norway and the North Pole. Similar to Novaya Zemlya, Svalbard is normally surrounded by sea ice due to its favorable location north of 74 °N latitude. The sea ice is missing west of the archipelago, but it is fully spread along the Barents Sea part, although with lots of cracks. Early March imagery revealed some very impressive cloud streets from the polar ice cap to Barents and Greenland Seas. Notice also how the sea ice is falling apart over the Greenland Sea with huge icebergs visible.
Iceland
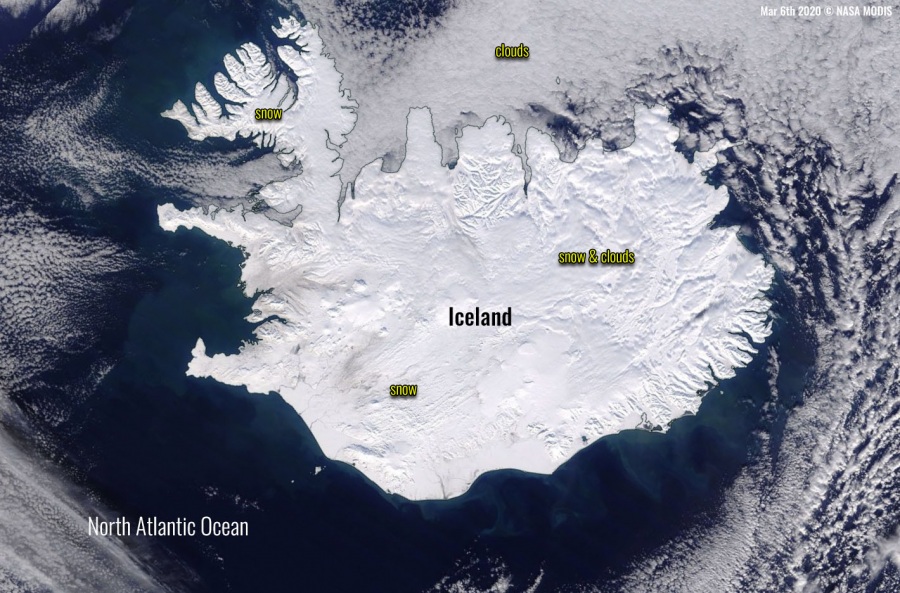
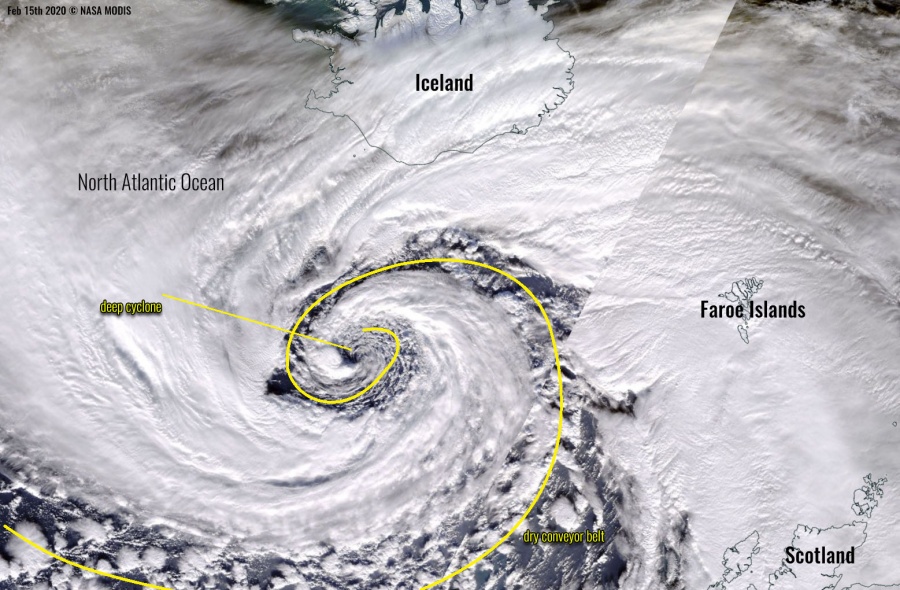
Iceland is a Nordic island country in the North Atlantic, its name would suggest it’s the land of ice. However, Iceland is warmed by the Gulf Stream and has a temperate climate, despite a high latitude just outside the Arctic Circle. Its high latitude and marine influence keep summers chilly, with most of the archipelago having a polar climate. This year, the more or less positive North Atlantic Oscillation (NAO index), there were numerous intense North Atlantic extratropical cyclones. Such patterns resulted in a lot of snowy days across Iceland, so we can see the whole country was often covered with snow. Given Iceland’s’ rough and dynamic climate, it’s not easy to find clear skies across the whole island, March 6th was the closest this year. The second image reveals one of these extremely deep and photogenic deep lows – this was one of the most intense extratropical cyclones on record (North Atlantic), storm #Dennis.
Greenland
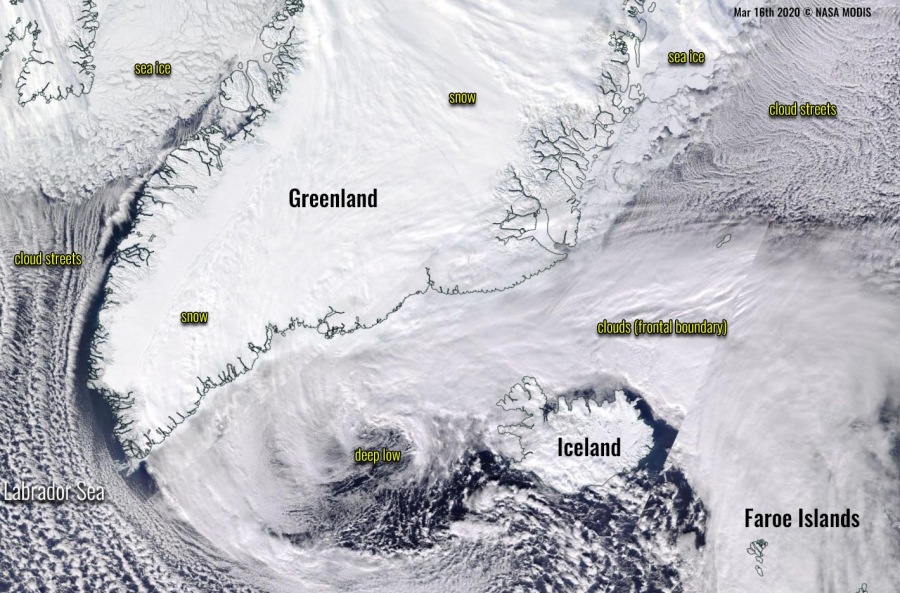
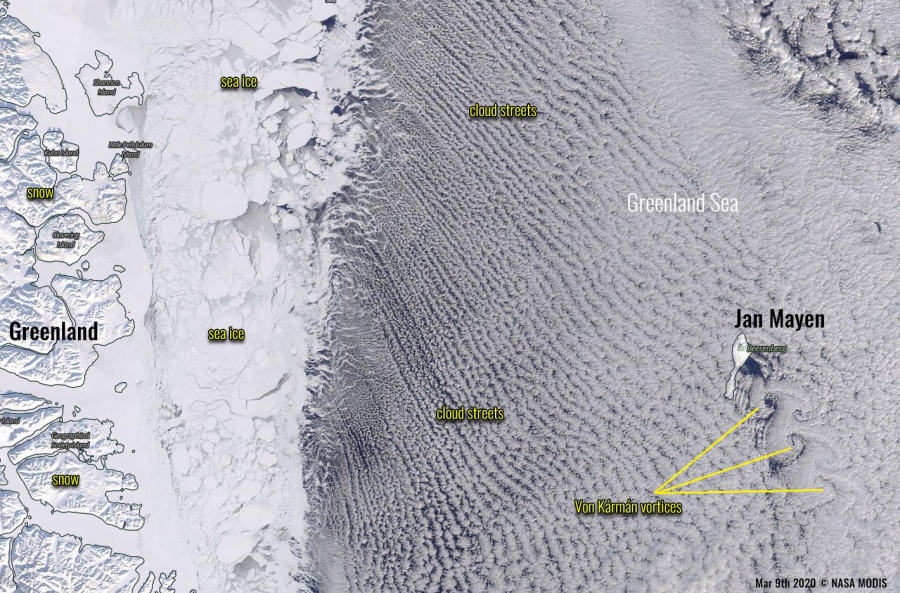
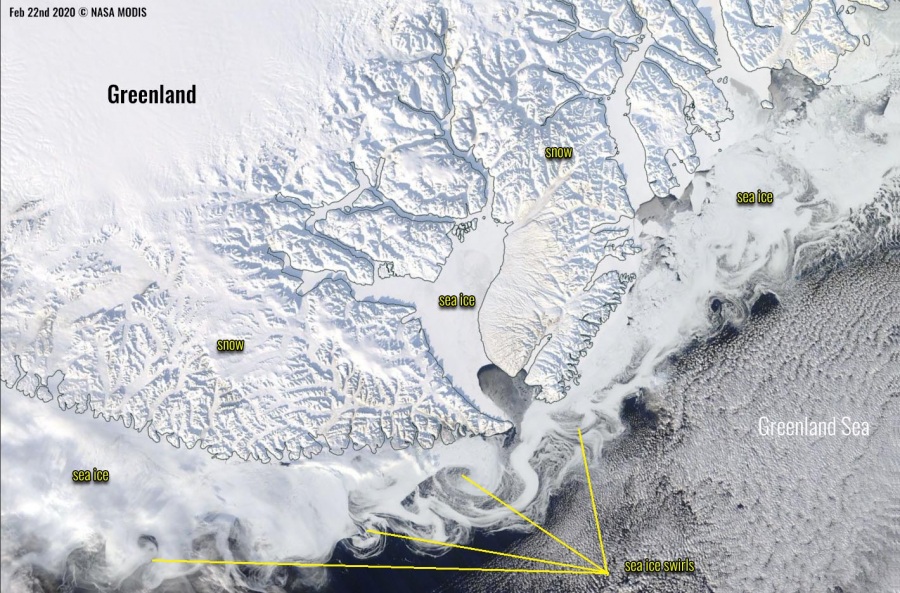
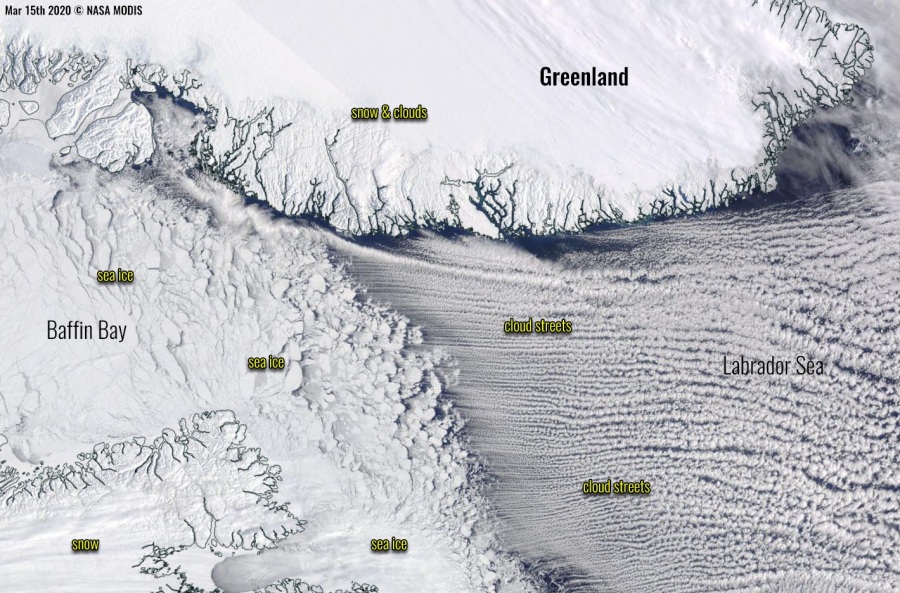
Greenland is the world’s largest island located between the Arctic and Atlantic oceans, east of the Canadian Arctic Archipelago. It is an autonomous territory within the Kingdom of Denmark. Due to its thick ice cap and Polar climate, Greenland often has very high surface pressure. This creates very tight pressure gradients against the surface lows coming from the North Atlantic, often developing convective cloud streets. We can see an example of deep low located southeast of Greenland on the 16th of March, with cloud streets along the Labrador Sea to the west of Greenland. Cloud streets are often seen along from the polar ice cap into the Greenland Sea. On the second image we can also see a very nice example of Von Kármán vortices, produces on the lee side of the Jan Mayen island. The flow of atmospheric air over obstacles such as islands sometimes gives birth to von Kármán vortex streets (vortices). When a cloud layer is present at the relevant altitude, the streets become visible. The third image indicates the sea ice swirls along the edge of the polar ice cap in the Greenland Sea. Swirls are a result of the combination of winds and currents steered the ice into the interlocking swirls. We can also see the fjords are covered with sea ice.
Baffin Bay and Labrador Sea
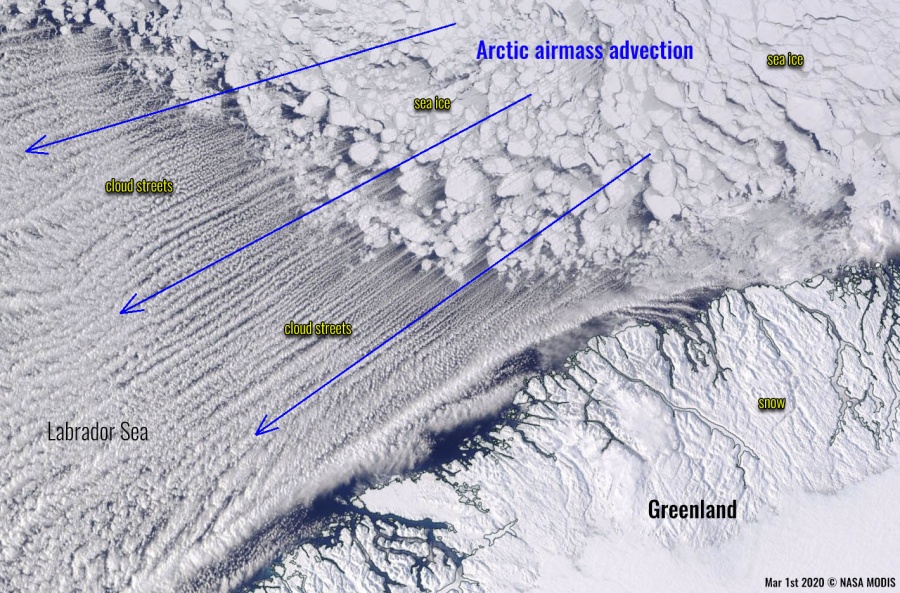
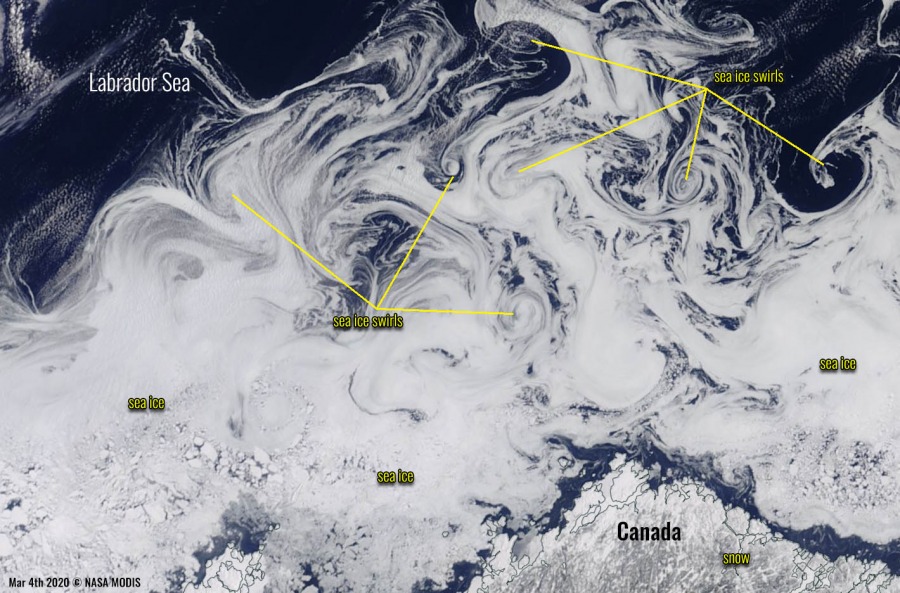
The Labrador Sea is an arm of the North Atlantic Ocean between the Labrador Peninsula and Greenland. It connects to the north with the Baffin Bay through the Davis Strait. While the Baffin Bay is normally covered with sea ice during winter, the position of the Labrador Sea between the continental shelves to the southwest, northwest, and northeast often reveals the textbook cloud streets from the ice cap over the Baffin Bay. We can see two examples of early and mid-March Arctic airmass advection and very long convective cloud rolls. The third image reveals an exceptional detail of sea ice swirls along the western side of the Labrador Sea, close to the Canadian land.
Hudson Bay
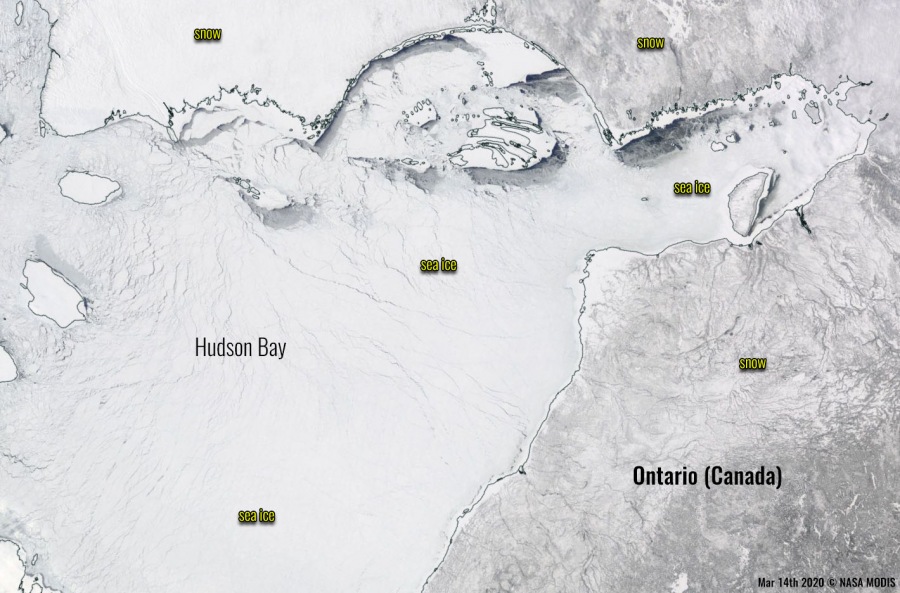
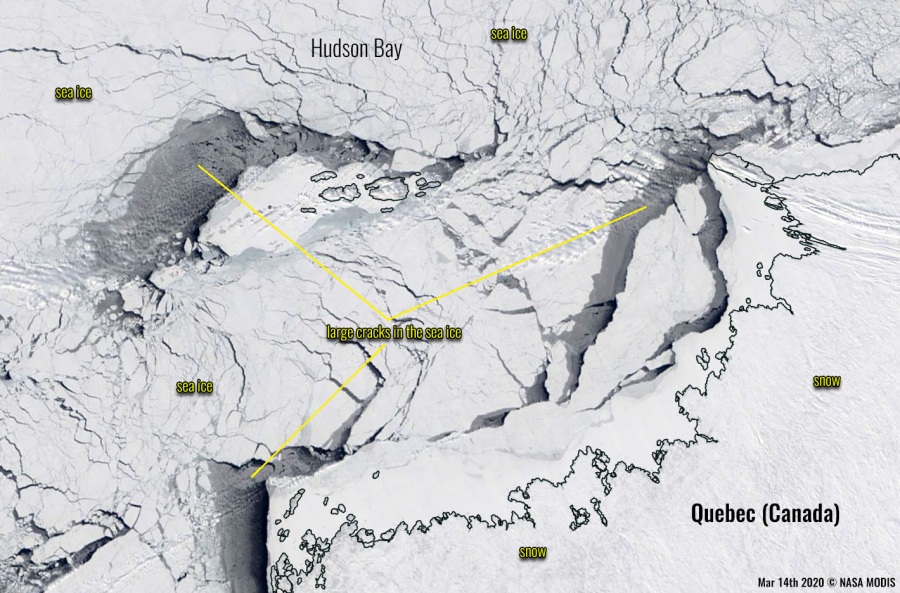
Hudson Bay is a large body of saltwater in northeastern Canada. Although not geographically apparent, it is for climatic reasons considered to be a marginal sea of the Arctic Ocean. During winter, Hudson Bay is completely covered with sea ice. As the winter translates into spring, the cracks in the ice shield appear, imagery is from March 14th. The second image indicates huge cracks across the eastern part of the sea.
Newfoundland
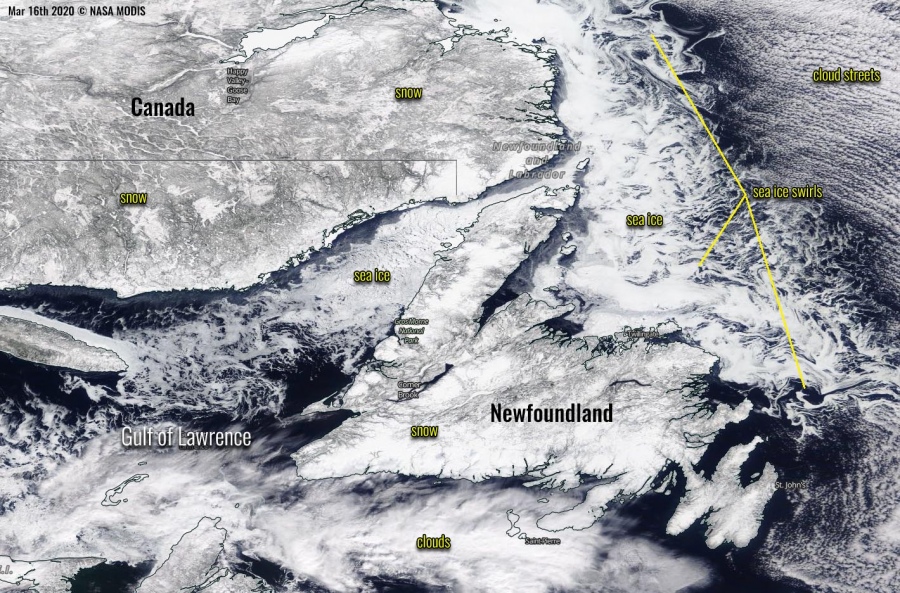
Newfoundland is a large island off the east coast of the North American mainland. The island is separated from the Labrador Peninsula by the Strait of Belle Isle and from Cape Breton Island by the Cabot Strait. It blocks the mouth of the Saint Lawrence River, creating the Gulf of Saint Lawrence. It is known by its robust climate, related to the often very dynamic Northwest Atlantic lows, literally exploding when deep troughs push from Arctic Canada towards North Atlantic. It can be extremely cold one day, but very warm the next day, depending on the cyclone tracks. With the often cold advection from interior Canada, sea ice accumulates over the Gulf of Lawrence and along the western part of Labrador Sea. The combination of winds and currents steer the ice into the interlocking swirls here as well.
Alaska & Bering Sea
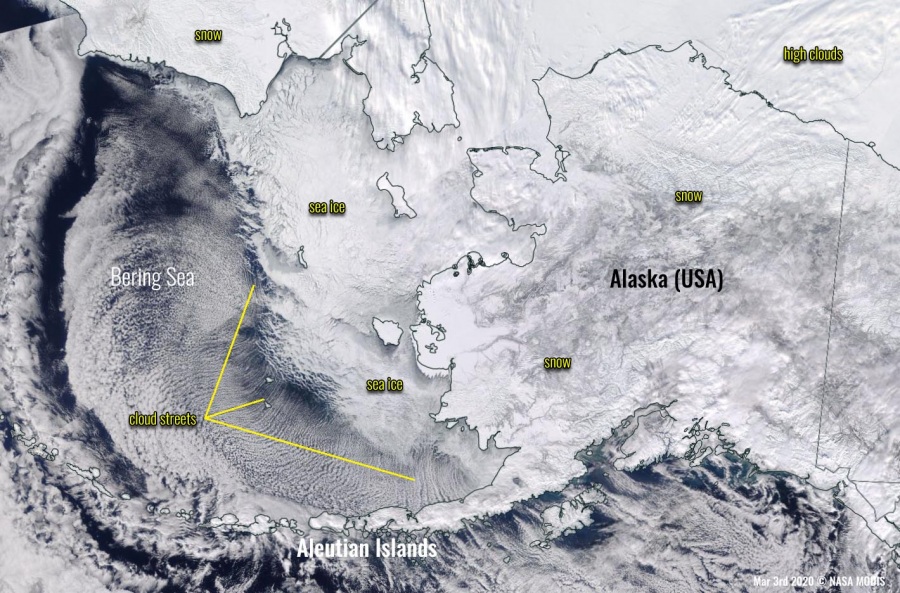
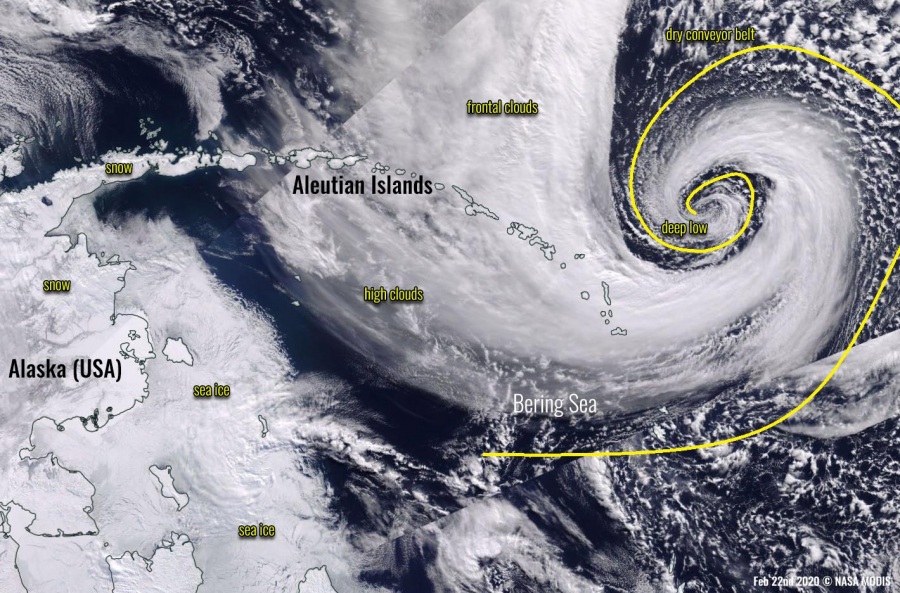
Alaska is a state located in the northwest extremity of the United States West Coast, just across the Bering Strait from Asia. Interior Alaska has extremely low temperatures during winter, while deep extratropical cyclones over the North and Northwest Pacific often push into the Aleutian Islands. We can see such an example in the second image. Normally, the Bering Sea has a large sea ice shield across its northern parts while Arctic advection from the Polar ice cap through the Bering Strait results in convective cloud rolls over the sea further south. Sometimes even in the lee side of the Aleutian Islands archipelago.
Kamchatka Peninsula
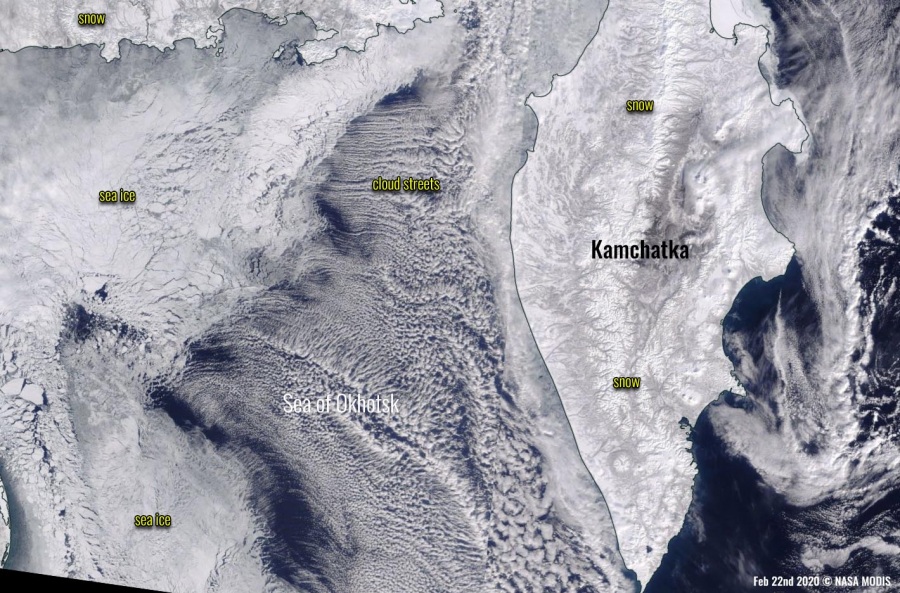
The Kamchatka Peninsula is a long peninsula in the Russian Far East. The Pacific Ocean and the Sea of Okhotsk make up the peninsula’s eastern and western coastlines. The peninsula of normally covered with snow during winter, given its favorable position to the Arctic region and cold outbreaks from Russia. A large part of Sea of Okhotsk is covered with sea ice, while the open part of the sea, therefore brings convective cloud streets developing when Arctic air mass pushes in during the outbreaks.
Arctic sea ice extent:
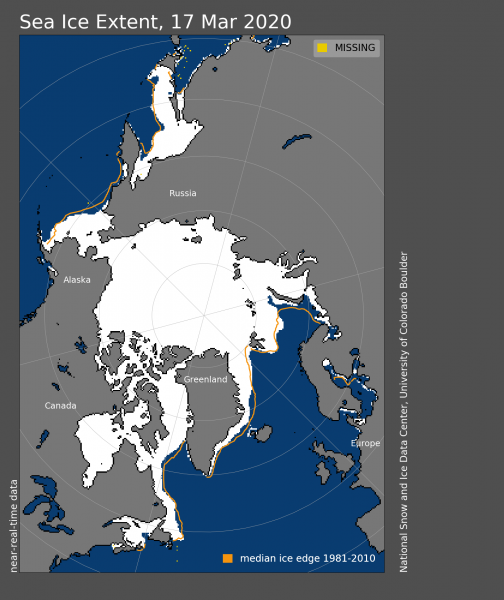
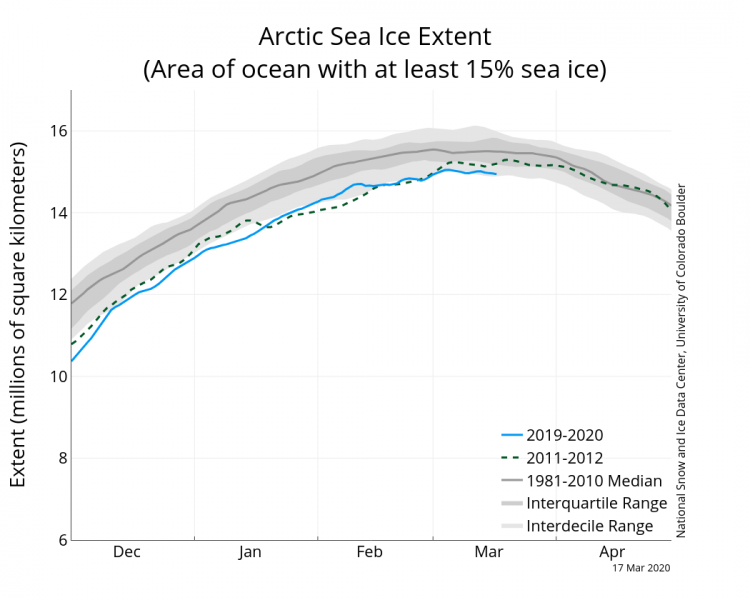
Arctic sea ice extent is yet again tracked below average, ranking as the thirteenth lowest monthly average in the satellite record – February 2020. Over the past few months, the Arctic Oscillation was in a persistently positive phase, led to very mild winter over Europe. Mainly due to unusually low sea level pressure over the Atlantic side of the Arctic Ocean and high pressure over Eastern Eurasia, extending eastward into Arctic Canada. Because of this, the sea ice loss has been less extreme than during the previous years, but still running well-below average.
Arctic sea ice extent for February 2020 was 14.68 million square kilometers (5.67 million square miles), the thirteenth lowest in the satellite record. This was 620,000 square kilometers (239,000 square miles) below the 1981 to 2010 February average and 710,000 square kilometers (274,000 square miles) above the record low mark for February set in 2018. At the end of February, ice extent was below average over parts of the Barents and Kara Seas, and the eastern Greenland Sea.
See also:
Spectacular details of Arctic air mass advection from the ice shield towards the North Atlantic
