The El Niño event has now been officially marked as a strong event. But, the latest data shows that it is behaving unusually, lacking a strong atmospheric presence in the circulation. It is still forecast to maintain its strength and impact the Winter Weather across the United States, Canada, and the rest of the Northern Hemisphere.
An El Niño event can tell us a lot about the current state of the atmosphere. You will see how El Niño is growing, how it works, and how it is expected to influence the upcoming Winter season of 2023/2024 on many levels.
OCEANIC AND ATMOSPHERIC PHENOMENA
El Niño is a warm phase of the ENSO, which stands for “El Niño Southern Oscillation.” This region of the equatorial Pacific Ocean shifts between warm and cold phases. Typically, there is a change in its phase around every 1-3 years.
We are currently entering a warm phase called El Niño. The cold ENSO phase is called La Niña, which was active over the past three winters. A (cold/warm) phase usually develops between late Summer and early Fall. It then lasts until Spring, but some events can last up to two or three years.
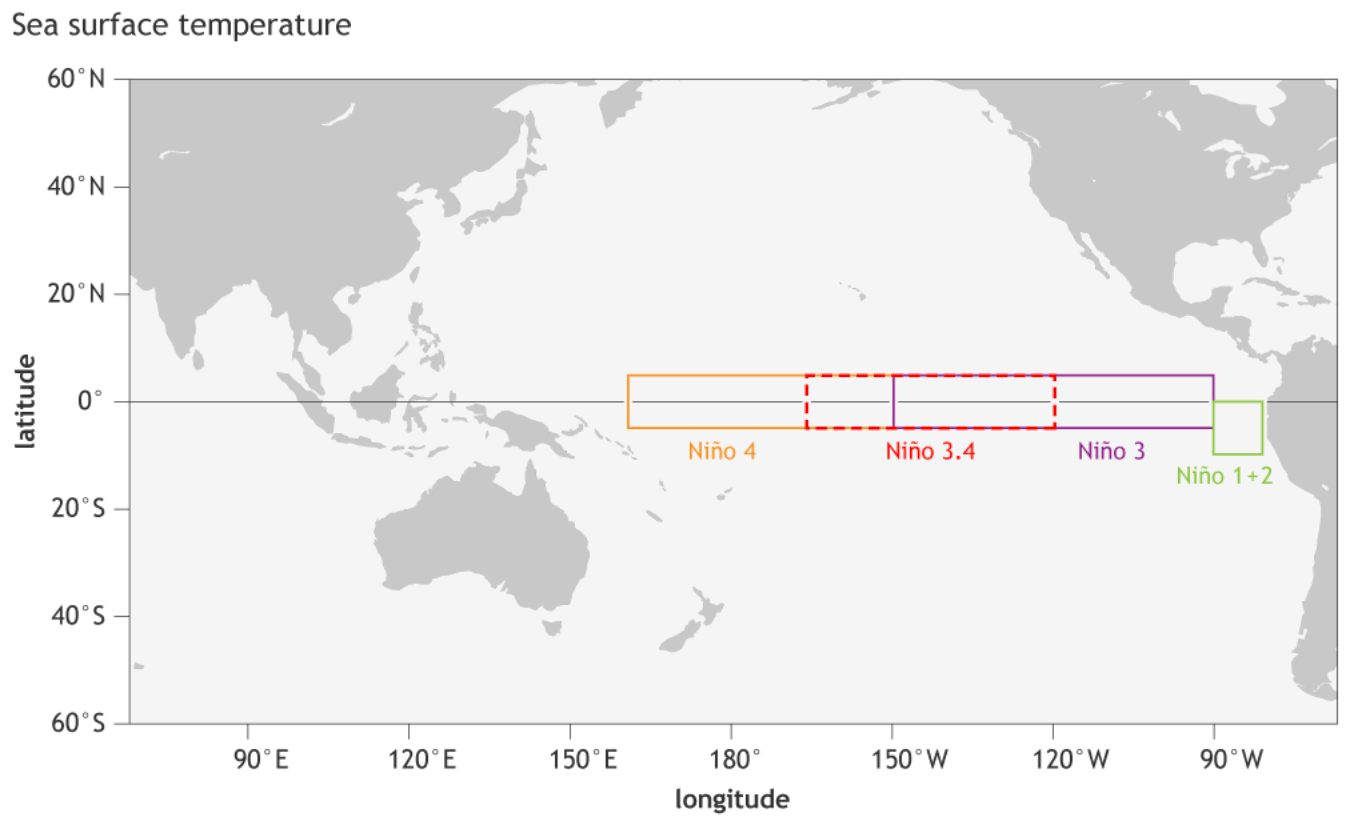
You can see the ENSO regions across the tropical Pacific below. Regions 3 and 4 expand over the east and west tropical Pacific. The main region is seen in the image as the Nino 3.4 region. This is where the main strength of a warm/cold event is calculated.
Each ENSO phase influences the pressure and weather in the tropics differently. It has a different accompanying circulation and thus produces a different atmospheric response.
This affects the overall global circulation over time, changing the seasonal weather patterns across the world.
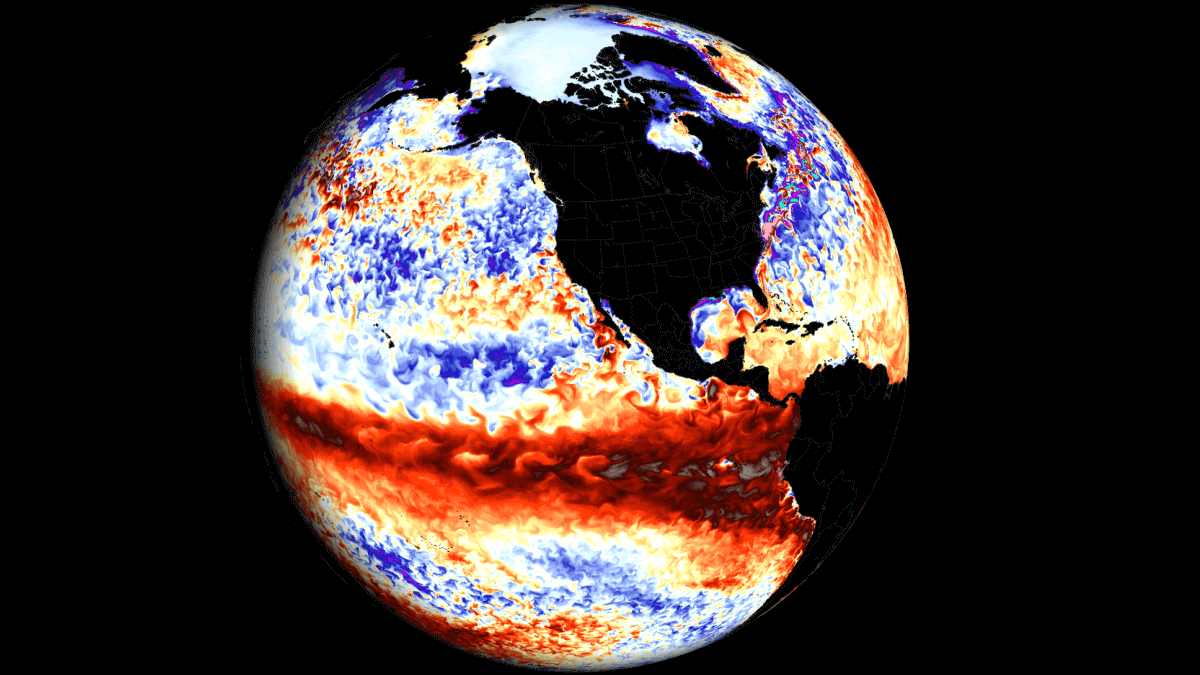
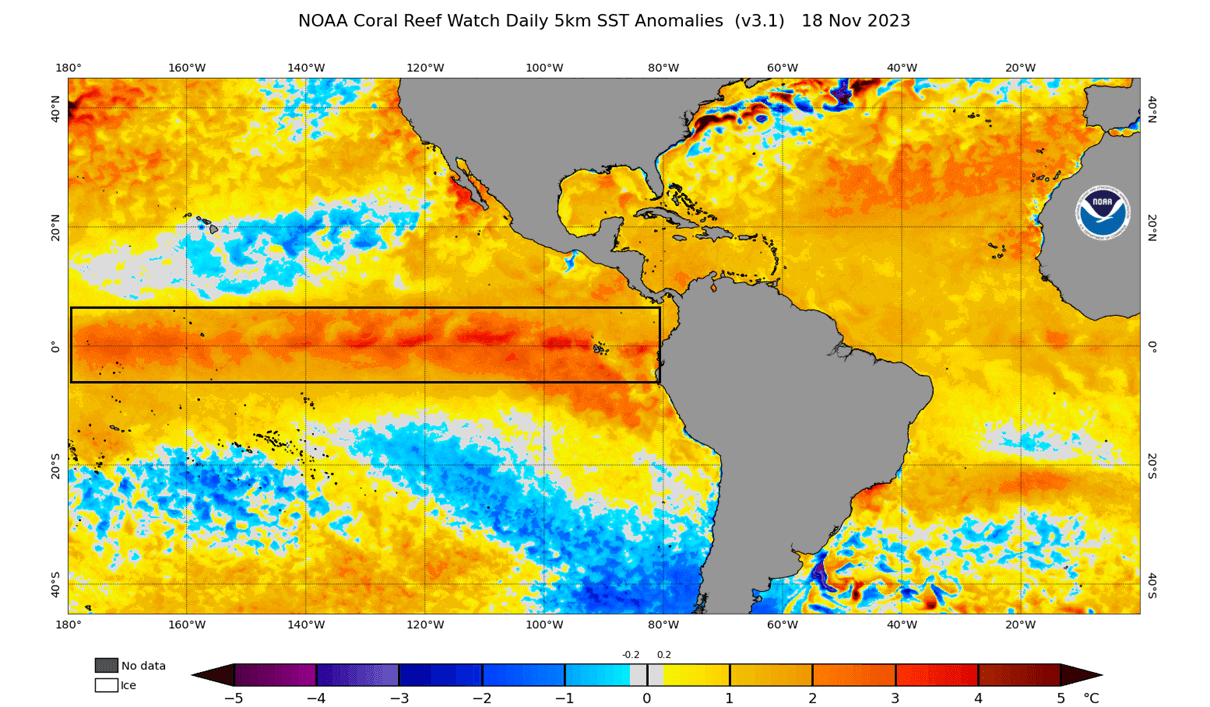
You can see the El Niño in the latest ocean anomaly analysis for November 2023. It stands out as a warm belt of above-normal ocean temperatures across the tropical Pacific Ocean. This anomaly affects the atmosphere but also indicates pressure pattern changes on a global scale.
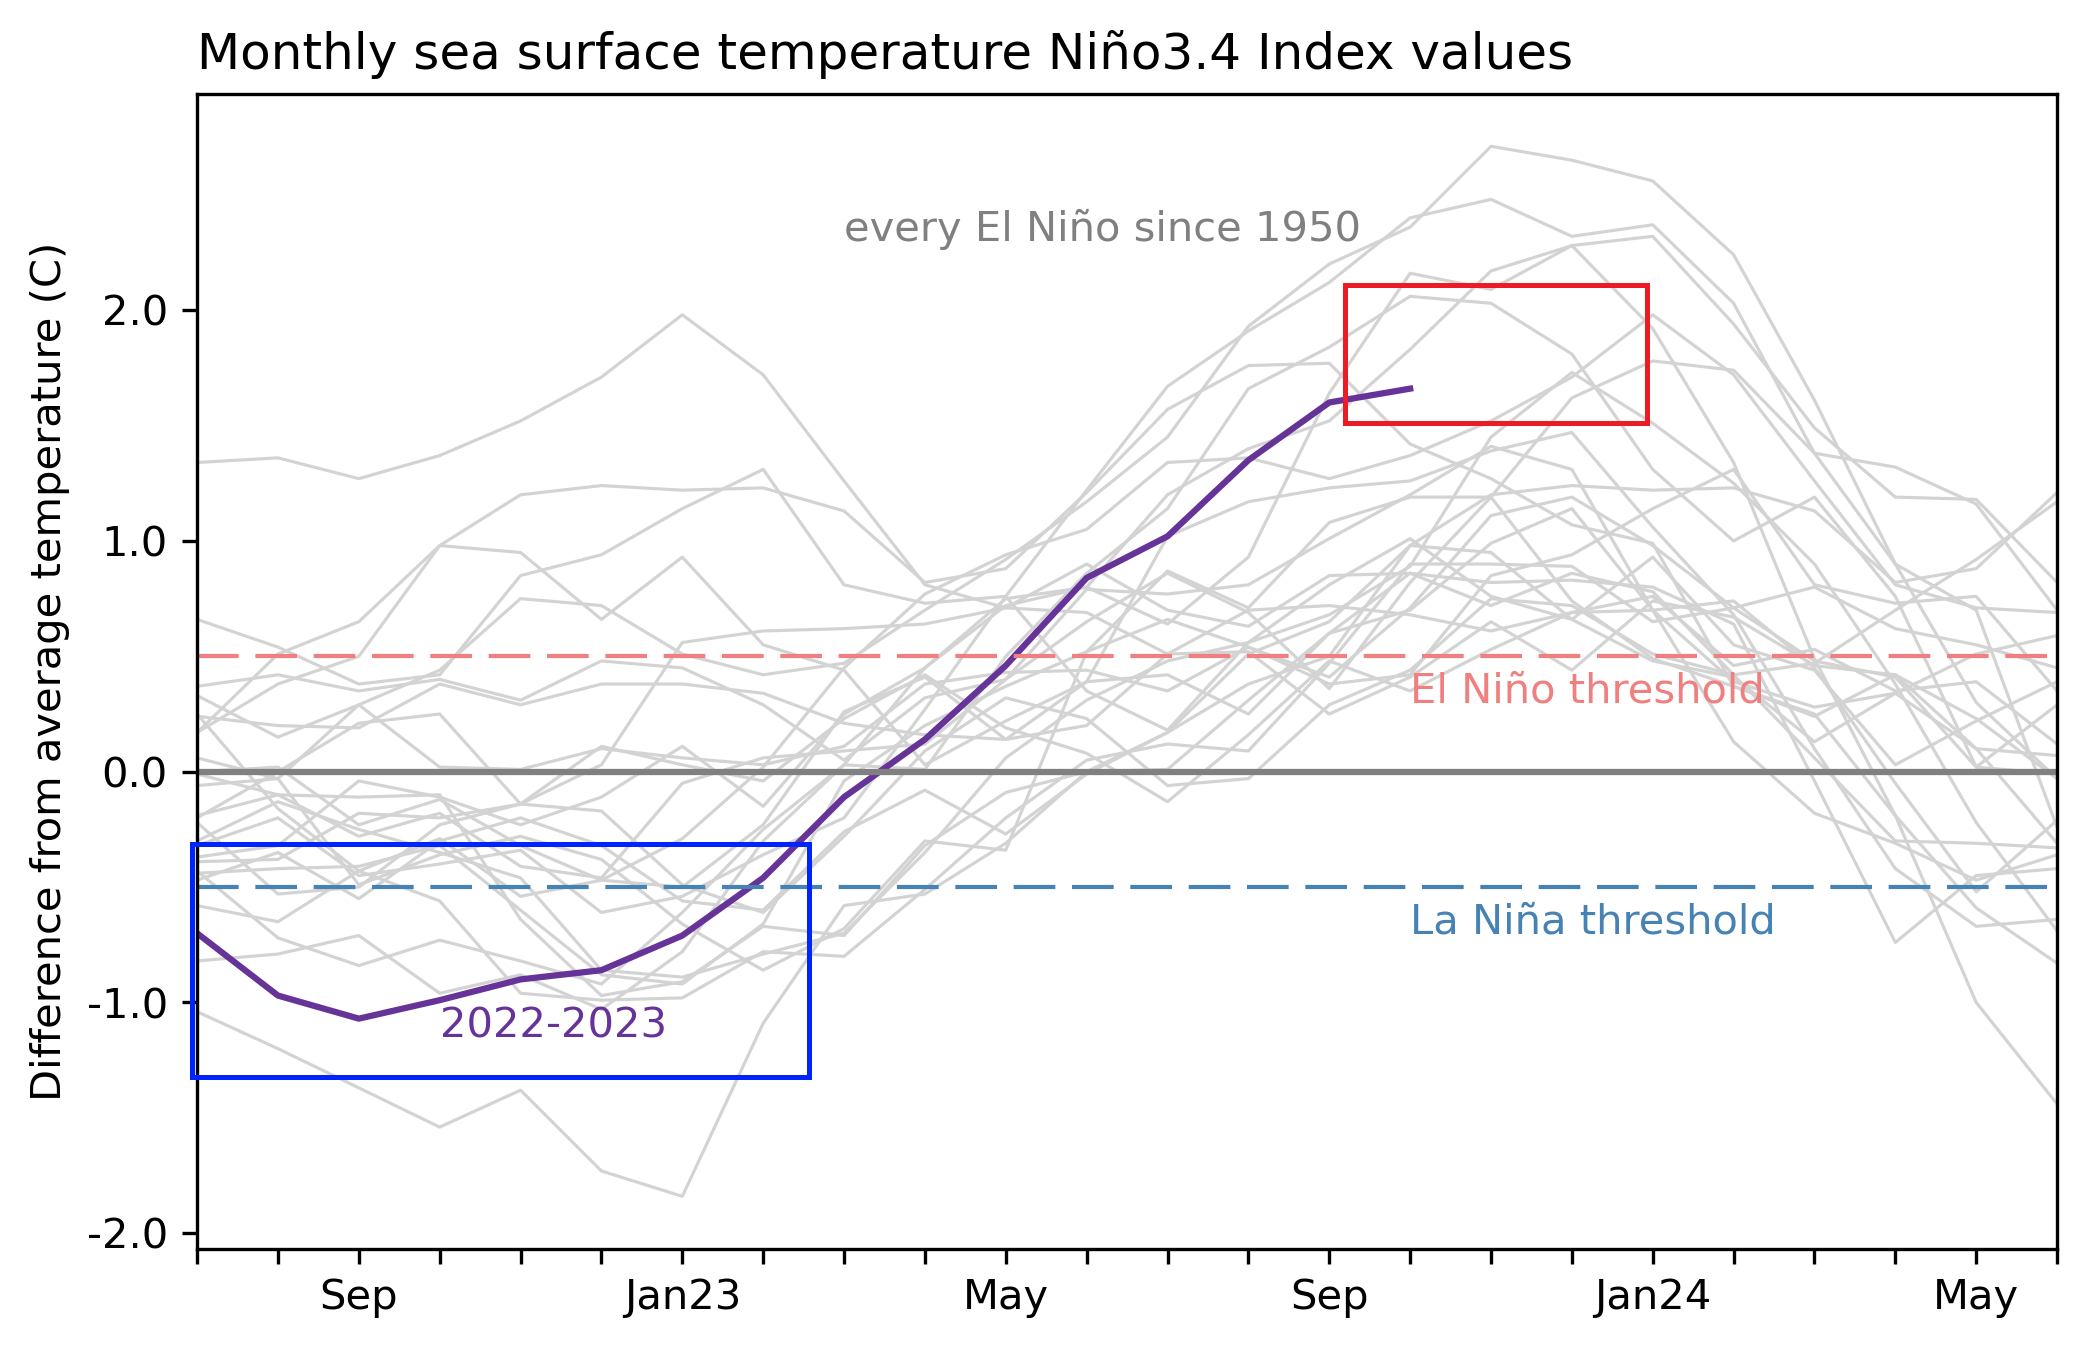
Below is the ENSO region anomaly data for the 2022/2023 seasons. Notice the rapid rise in ocean temperatures this year during Summer. The red box shows the projected peak values of the El Niño event over the Winter 2023/2024.
Below is a video that shows the fast transition from the cold ENSO phase to the emerging El Niño from last Winter to last Summer. It gives a good idea of how fast these changes really are, and you can see how it is being driven by winds and surface currents.
Below is the NOAA ocean anomaly analysis for September, when the El Niño was starting to power up. The warm anomalies affect the atmosphere but also indicate pressure pattern changes on a global scale.
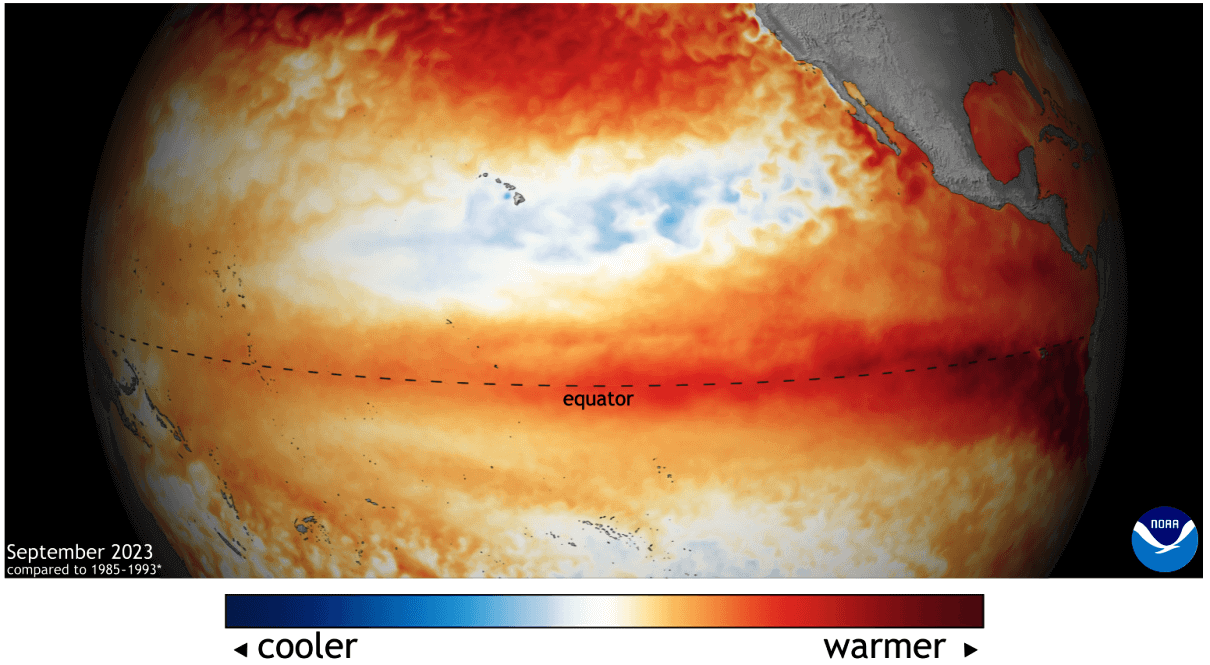
These pressure changes in the tropics then spread into the global circulation over time, affecting seasonal weather over both Hemispheres. We can observe a global shift in pressure patterns during the emergence of an ENSO phase.
But, the effect of this anomaly is usually more influential during the peak of its phase in Fall and Winter. In many cases, the weather effects of these ocean anomalies can last well into the spring season.
BELOW THE SURFACE
Another important aspect of ocean changes is the sea level height. In the image below, you can see sea level height anomalies from the Sentinel-6 satellite provided by NASA.
You can see an ocean sea level rise in the tropical Pacific, a clear sign that El Niño is active. This is the latest image currently available, showing data for late October. Image by NASA JPL
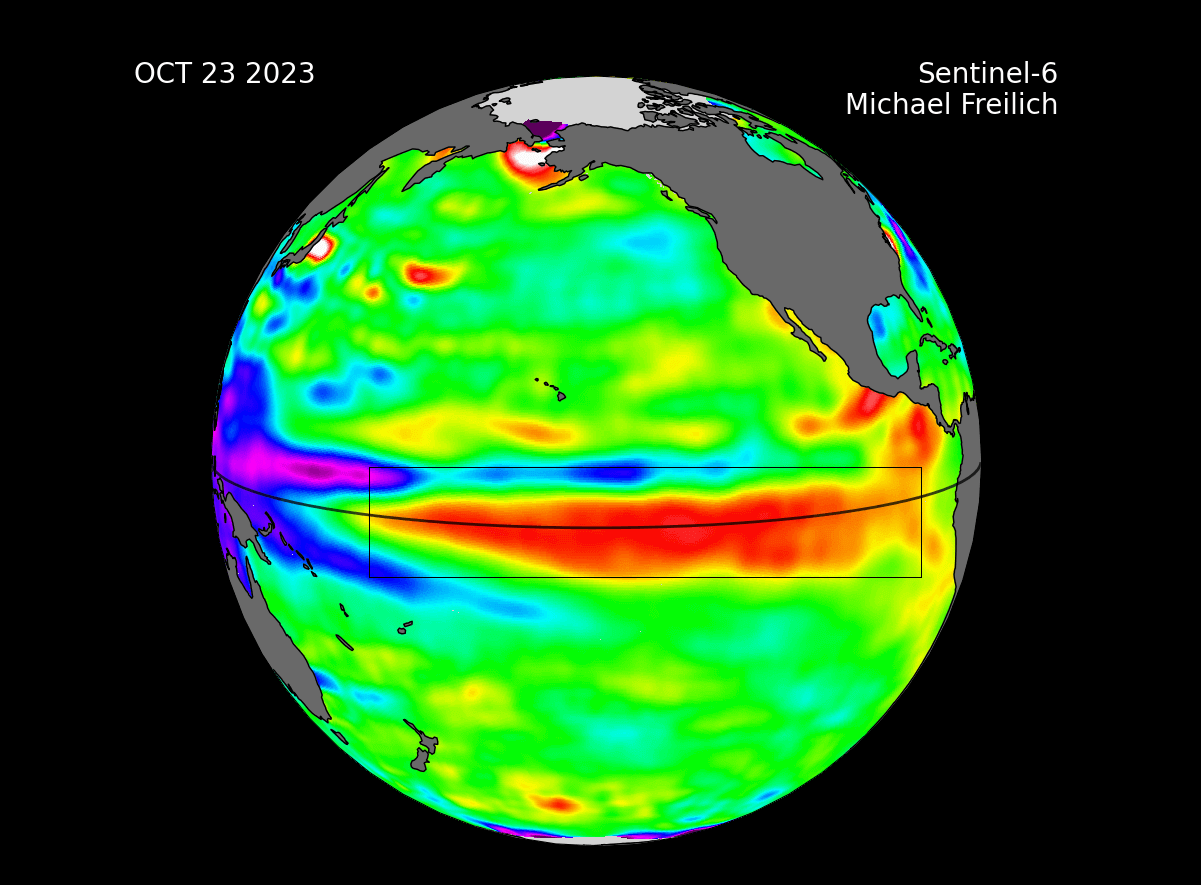
As described by NASA: “The data shows Kelvin Waves at the ocean surface and hundreds of miles wide, moving from west to east along the equator”.
But what are these Kelvin waves?
Kelvin wave is a long ocean wave that propagates eastward across the equatorial regions toward the coast of South America. Along the way, the upper ocean layer of relatively warm water thickens, and the sea level rises. It is the main precursor to an El Niño event.
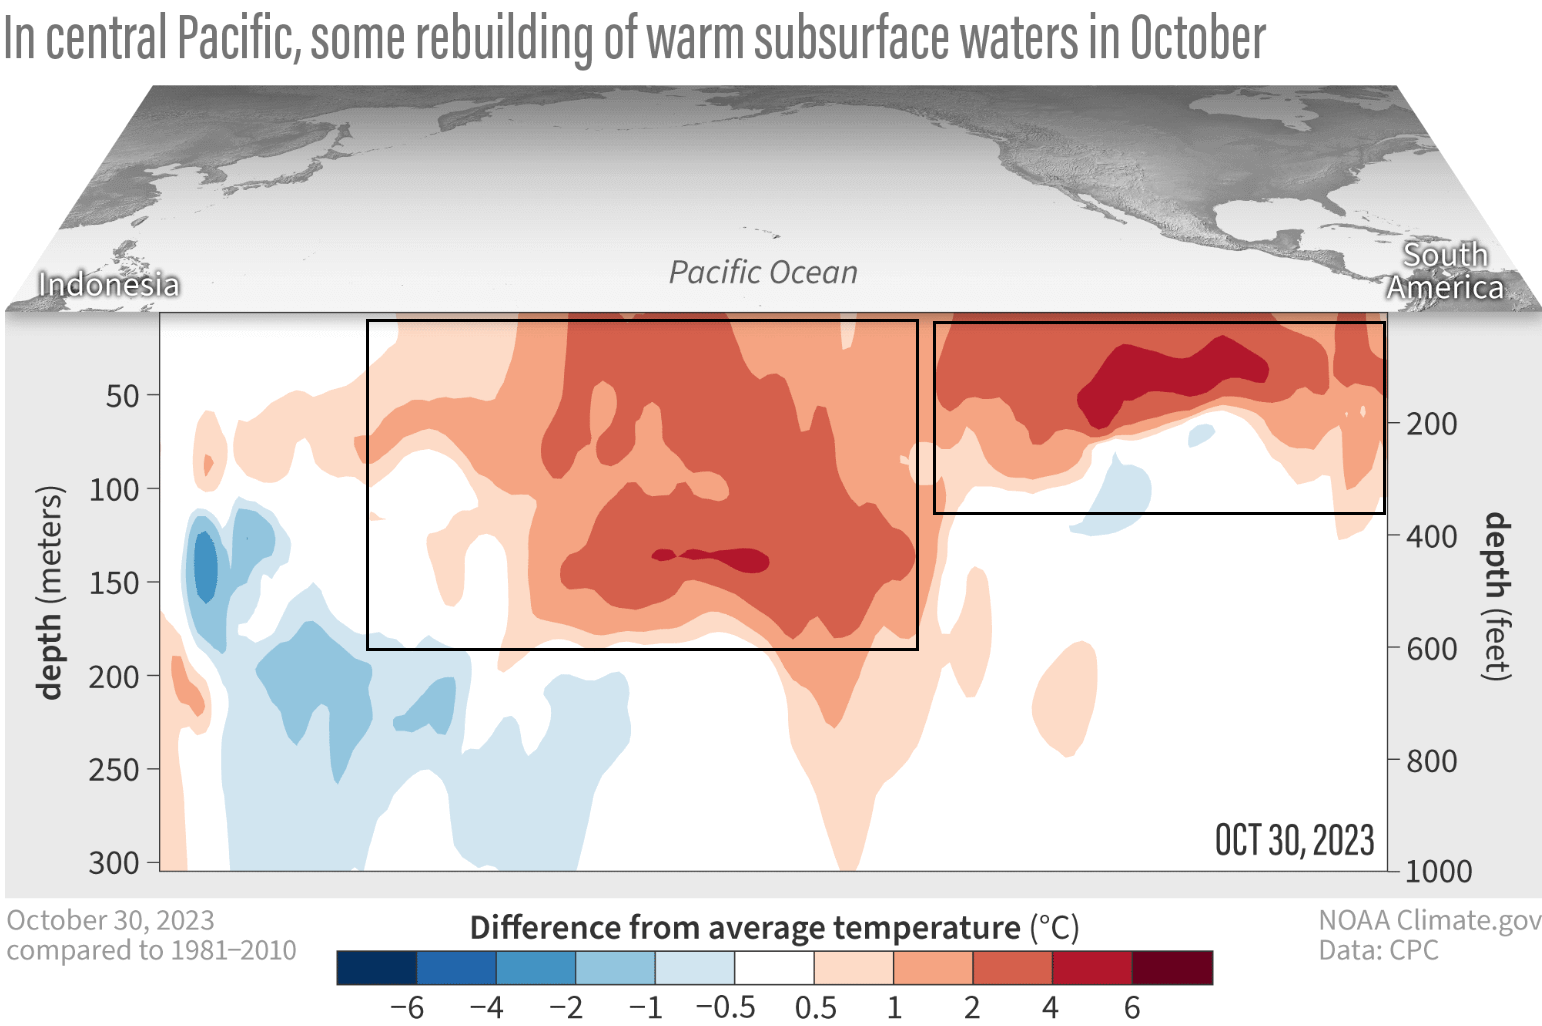
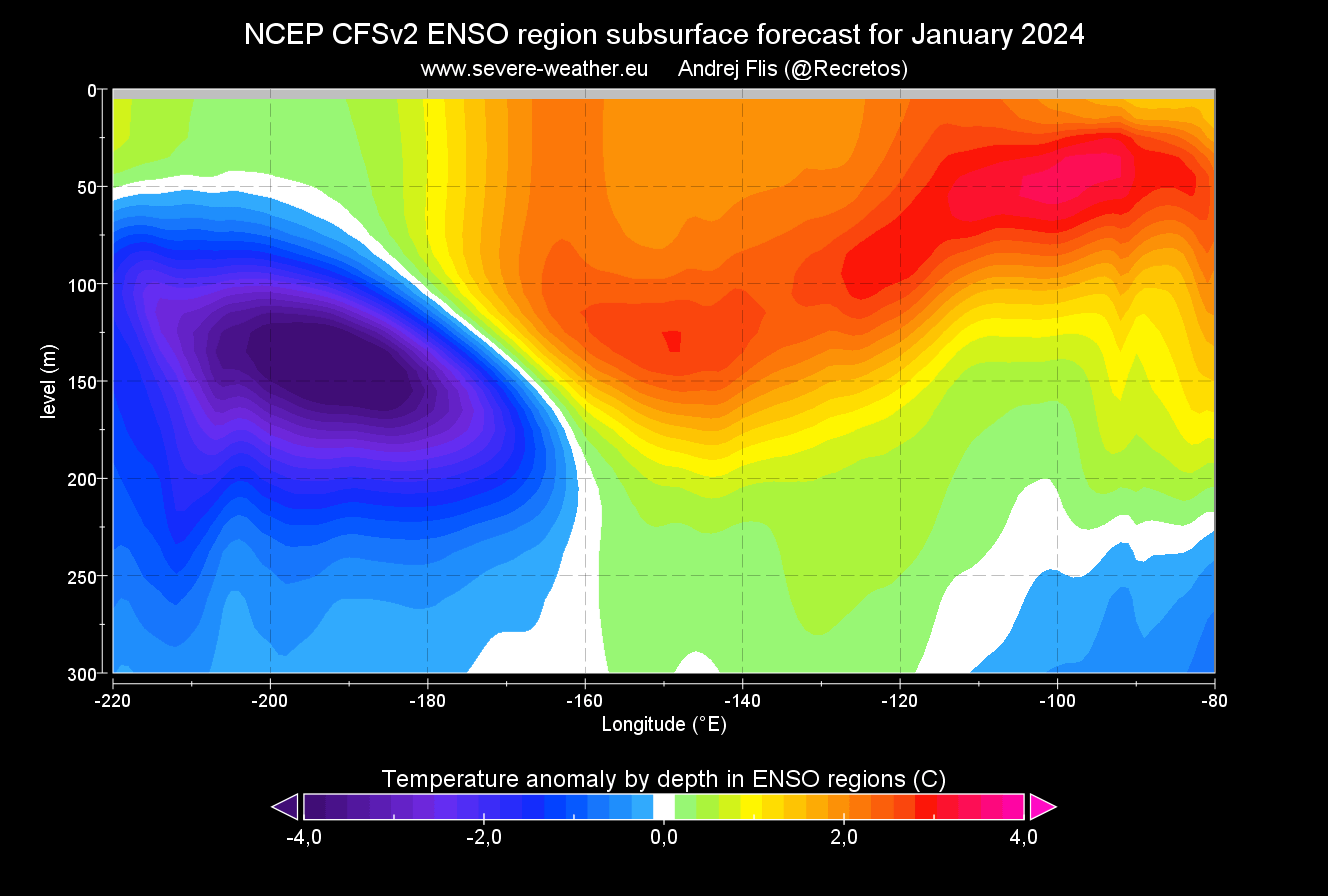
The latest subsurface image below shows a stable warm pool down to at least 100 meters depth (330 feet) in the east. A Kelvin Wave warm pool reaches 200 meters (660 feet) deep in the central regions. This image shows the subsurface anomalies across the ENSO regions.
The combination of all these factors was enough for the Climate Prediction Center to issue an official El Niño advisory in July, upgrading it from a watch. The latest outlook gives a greater than 95% chance of El Niño impacting the Winter season of 2023/2024 and the Spring of 2024.
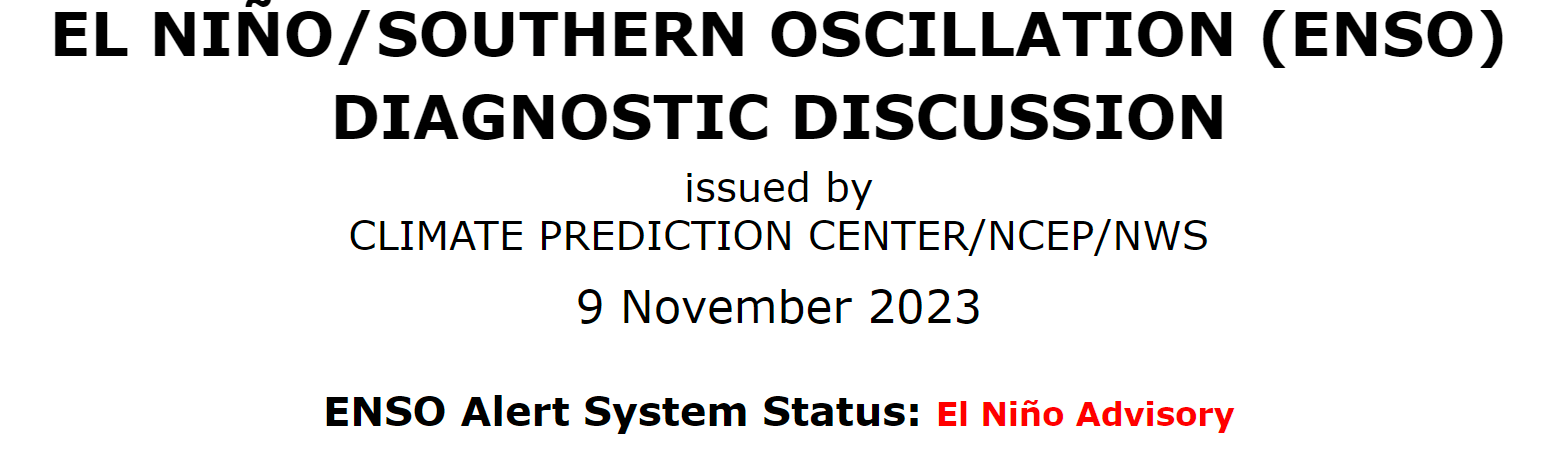
In their latest discussion, they write: “Above-average sea surface temperatures (SST) across the equatorial Pacific Ocean were indicative of a strong El Niño, with anomalies increasing in the central and east-central Pacific in the past month.
There is a 35% chance of this event becoming “historically strong” for the November-January season. In summary, El Niño is anticipated to continue through the Northern Hemisphere spring (with a 62% chance during April-June 2024“.
It means that the current and expected atmospheric conditions will be consistent with a strong El Niño event to impact the upcoming weather seasons into 2024.
ATMOSPHERIC MOTION
The following image below from NOAA Climate shows the typical circulation during an El Niño event.
Rising air over the central and eastern Pacific causes more storms and precipitation and lowers the pressure over the region. At the same time, the air is descending in the western Pacific, causing stable weather and high-pressure conditions.
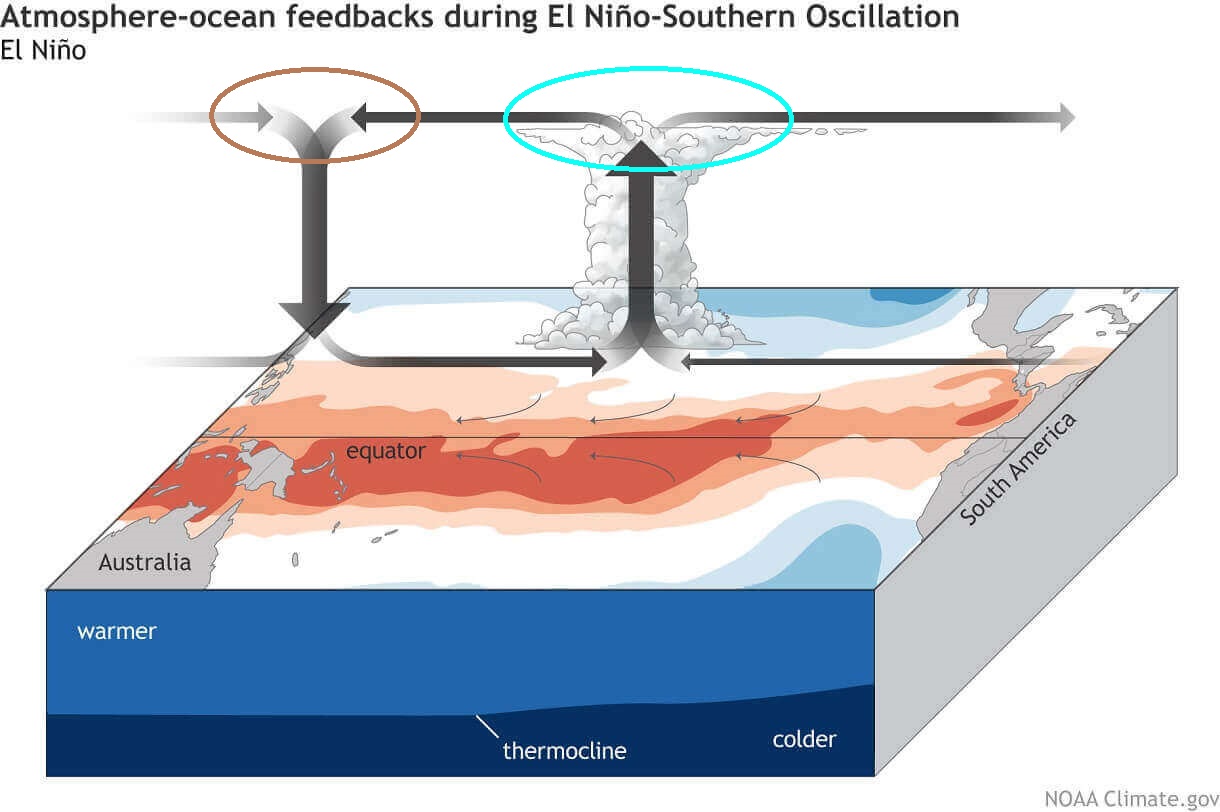
This is the more direct way that ENSO impacts the tropical rainfall and pressure patterns, affecting the ocean-atmosphere feedback system. Through this ocean-atmosphere system, the ENSO later influences the weather globally.
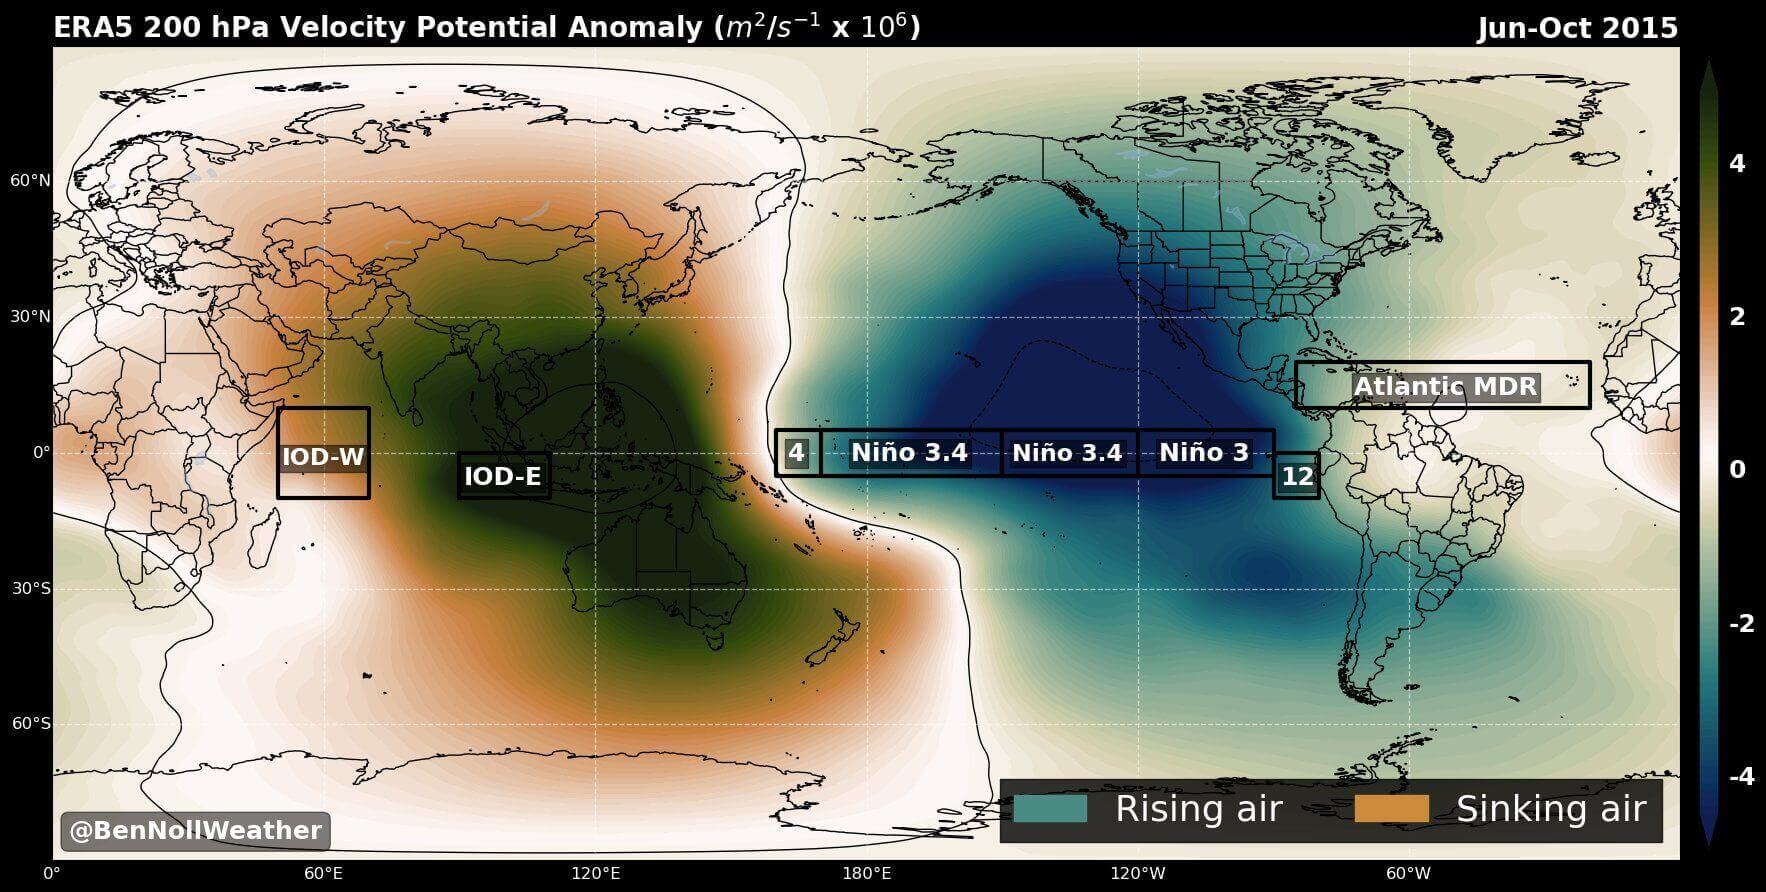
We can see this atmospheric motion using a special parameter called the “velocity potential.” In simple terms, it shows us where the atmosphere is rising and where it is sinking. Rising motion means lower pressure and precipitation, and sinking motion means higher pressure and drier conditions.
In the image below, this motion is presented in blue (rising air) and brown (sinking air) colors. The image shows the El Niño of the 2015 season. It had a typical strong rising area over the eastern and central Pacific and sinking in the west. Images by meteorologist Ben Noll.
But if we look at the same graphic that shows the December forecast, we can see a big lack of rising motion over the main ENSO regions. This is rather unusual, indicating a weaker El Niño fingerprint in the basic atmospheric circulation.
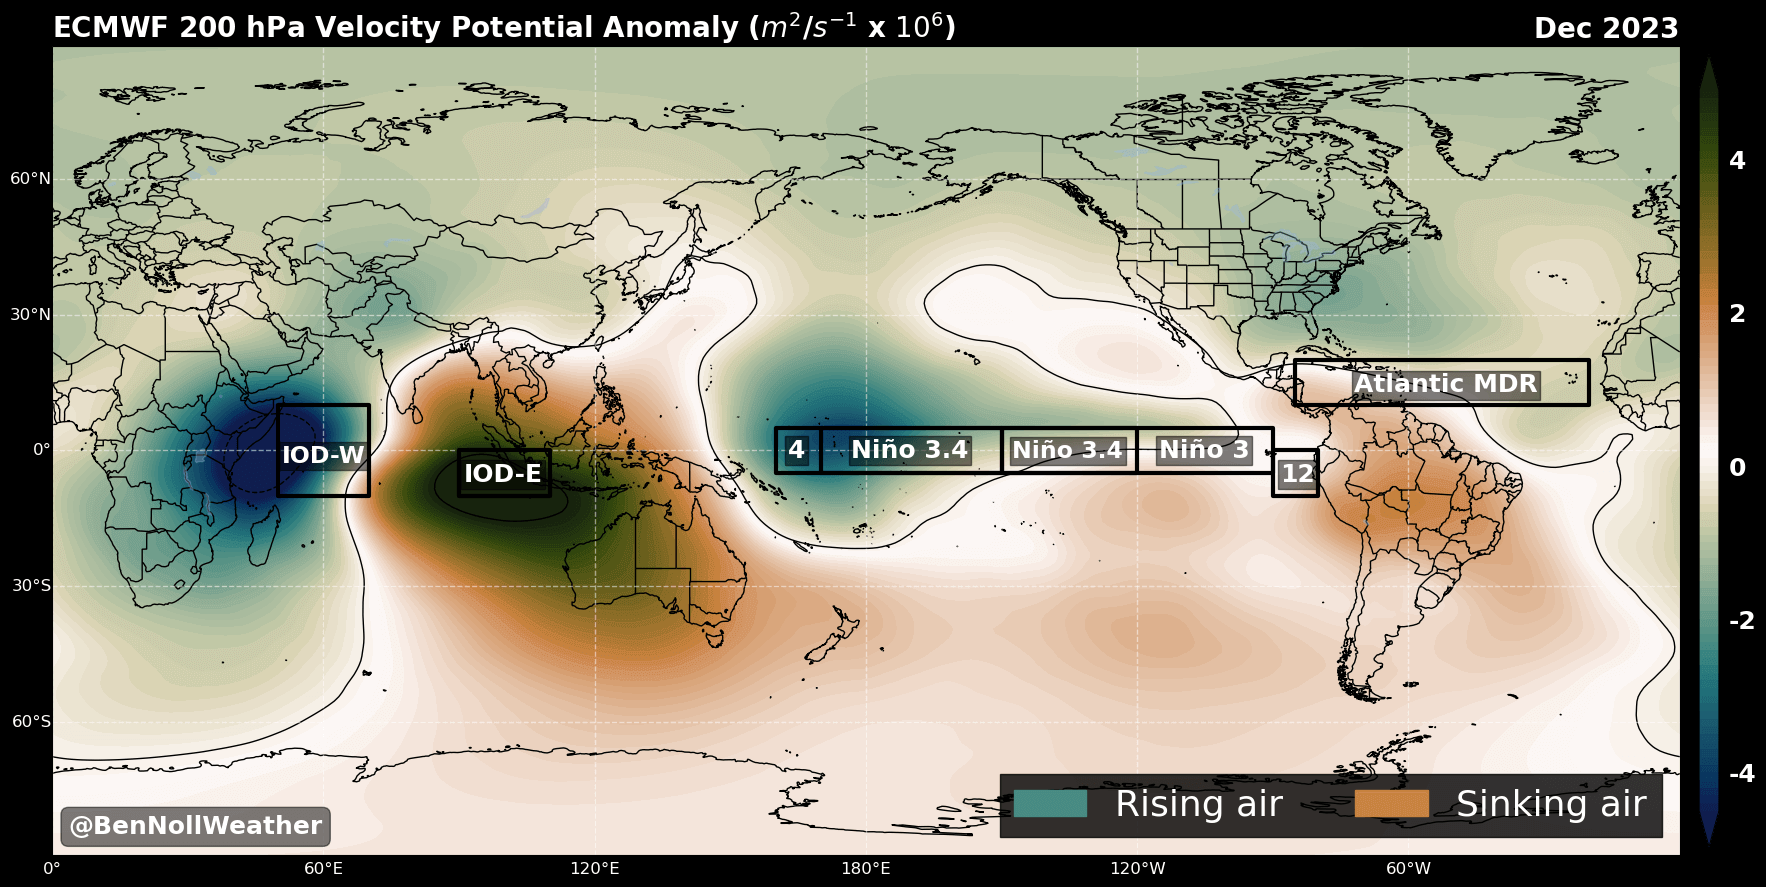
The latest GDAS analysis from Alex Boreham does show more rising motion in the past 90 days. But when comparing it to previous strong El Niño events, it does lag behind in atmospheric “coupling.”

But a weaker fingerprint does not mean no effect at all. Far from it, actually. The next image below by NASA shows the high-altitude wind speeds across the Northern Hemisphere. In the marked area, you can see the stronger winds appearing in the subtropical jet stream region.
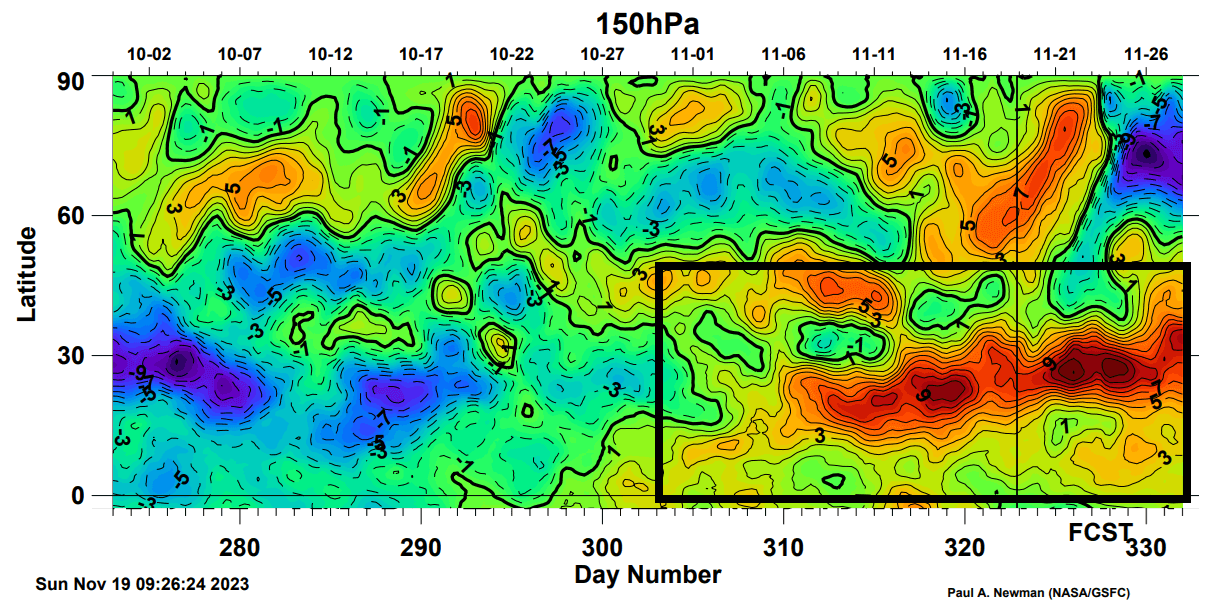
So, a process has been in motion in the past two weeks and is forecast to continue. The subtropical jet stream is shown to gain strength, impacting the weather across the United States in the coming weeks.
But how can ENSO shift between cold and warm phases, and how does it strengthen and weaken? The simplest answer is that it happens because of a complex relationship between pressure, winds, and ocean currents.
OCEANIC WINDS
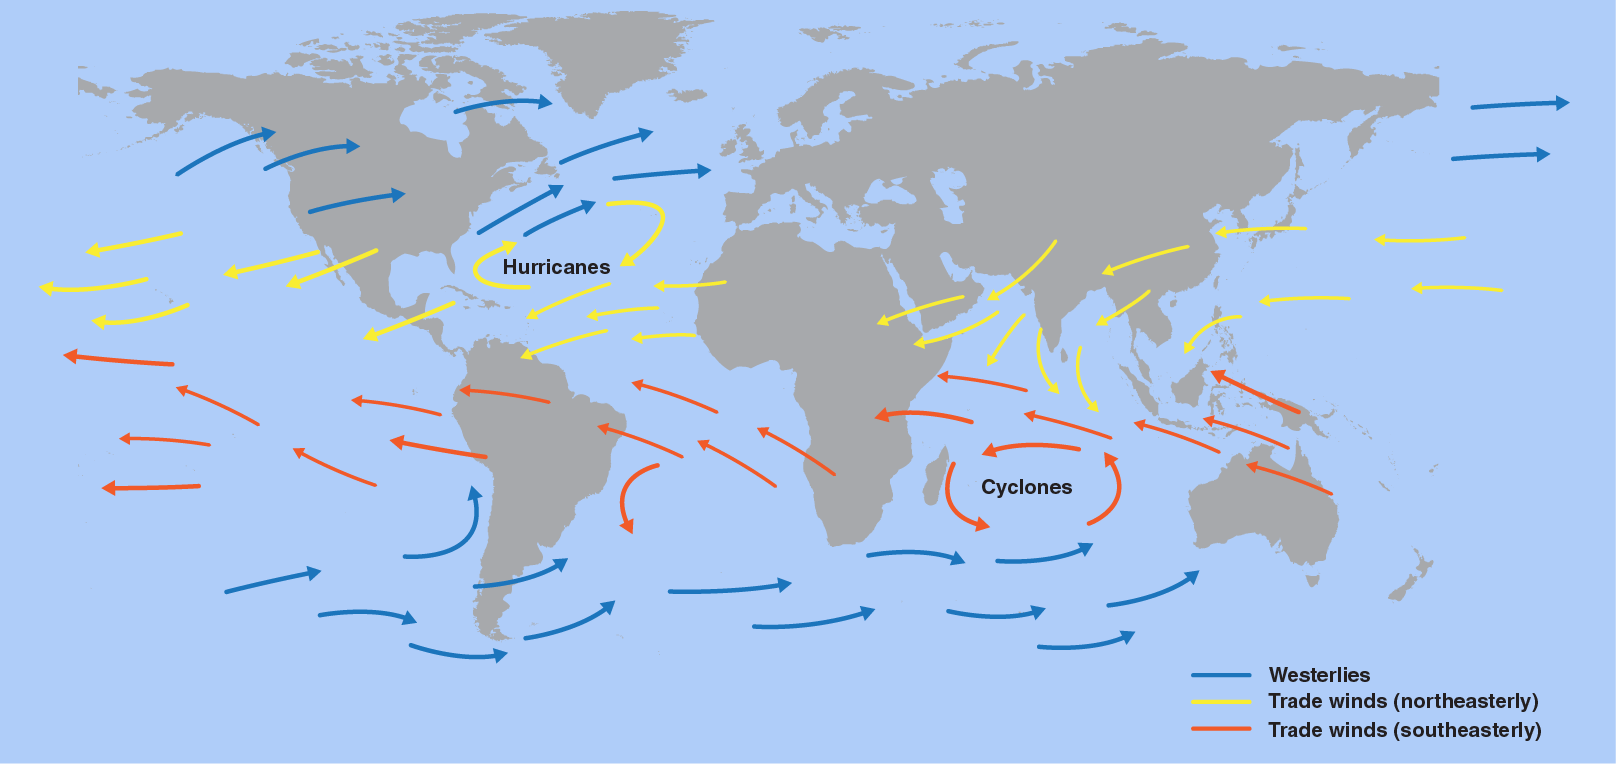
Global trade winds can start or stop a certain ENSO phase by overturning the ocean surface layers and changing the ocean currents and temperature profiles. Trade winds are steady and persistent winds, blowing towards (and along) the equator in both Hemispheres.
You can see the location of the global trade winds in the image below. Across the ENSO regions, they are predominantly easterly winds with a natural tendency to cool the ocean surface. For an El Niño to form and thrive, we need westerly winds or weak trade winds.
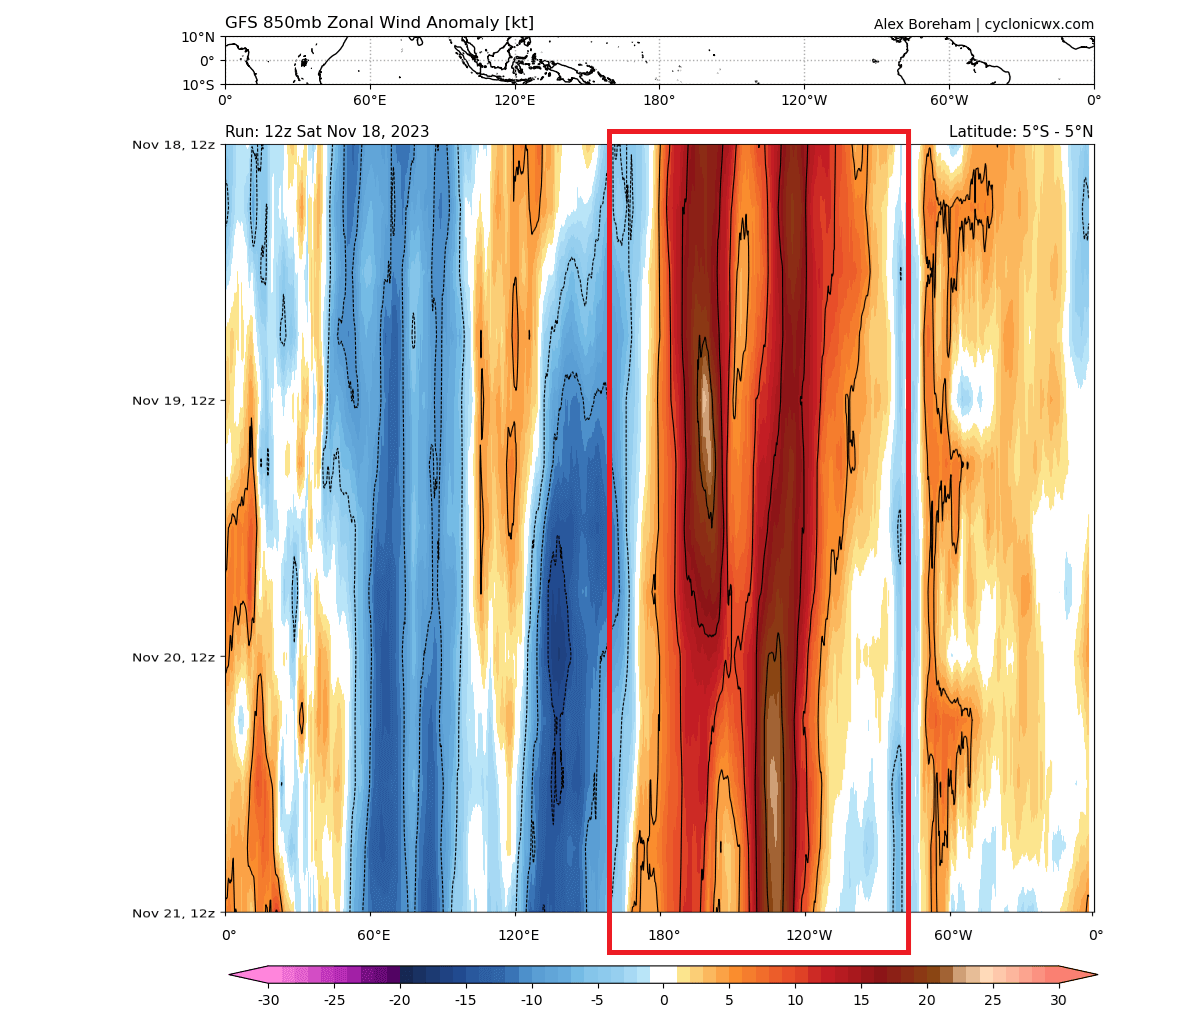
Below is the latest zonal (westerly) wind anomaly forecast for the tropical Pacific region. You can see a strong positive anomaly marked in the ENSO regions. That supports further warming of the central ENSO regions, pushing warmer water to the east.
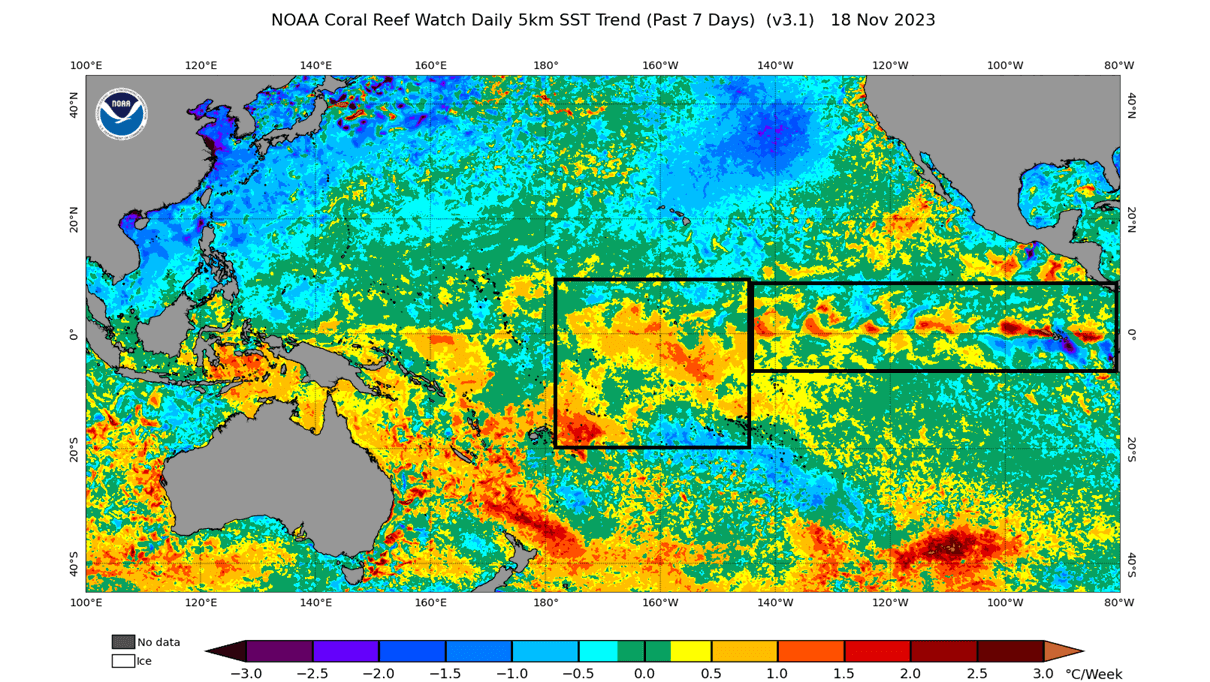
Such an episode of trade wind reversal is also called a westerly wind burst (WWB). As the trade winds cool the ocean surface, a westerly wind burst actually warms the ocean surface.
We can see this effect in the image below, which shows the ocean surface temperature change in the past seven days. Widespread temperature increase is seen across the central tropical Pacific and the eastern ENSO regions under the westerly wind anomaly.
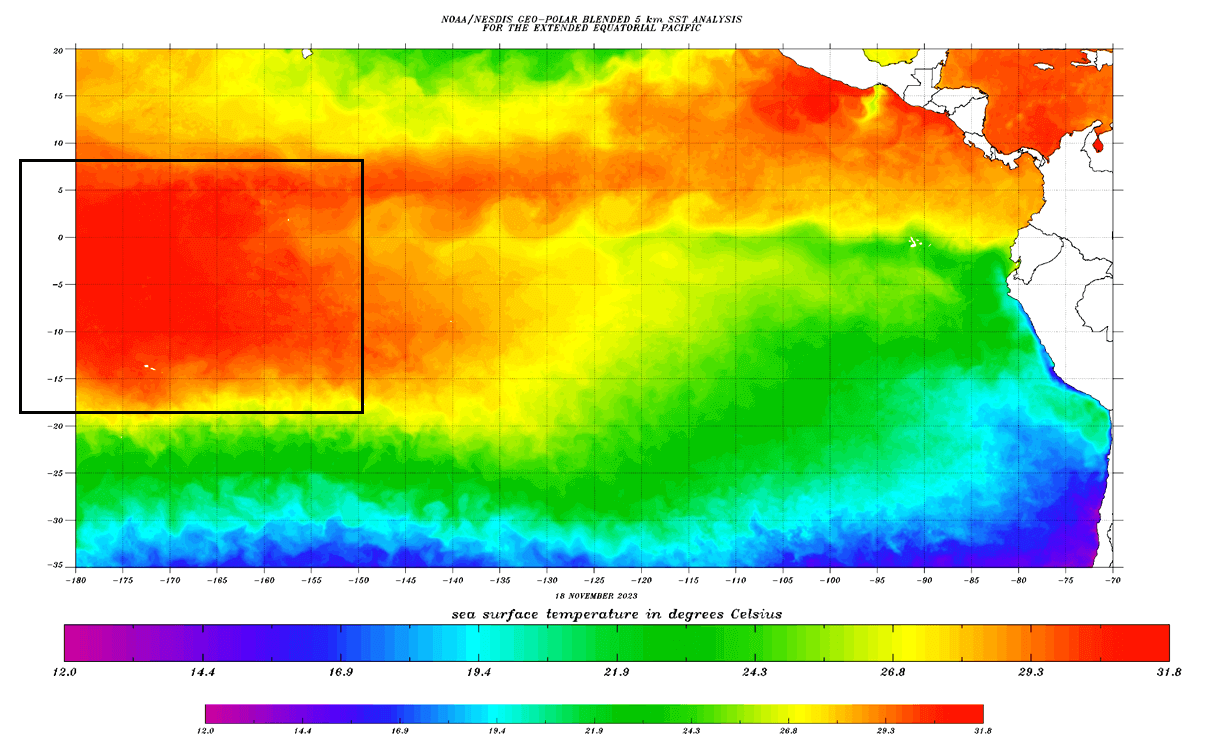
The raw temperature effect can be seen across the tropical Pacific. You can see a large area of ocean temperatures exceeding 31 degrees Celsius (88 Fahrenheit). The westerly wind anomaly is helping to push that warmer pool of water east and also affects the ocean below the surface.
With all this latest data in mind, what do the latest model calculations tell us for future El Niño development?
El NINO FORECAST DATA
Below is an analysis/forecast graphic showing the long-range forecast for the main ENSO region by different models. The forecast average has it around a +2 degrees anomaly by mid-winter. That is considered a strong El Niño event, expected to have a considerable weather influence.

Looking at the extended long-range forecast from ECMWF, you can see the ensemble consensus for a strong El Niño event, peaking around +2 above normal. Also, you can see an interesting development over 2024, with an almost equal chance for a new El Niño or a change to a cold La Niña for 2024/2025.

The Winter 2023/24 multi-model ocean forecast by Copernicus shows a strong El Niño event expanding across the entire tropical Pacific. An event of this magnitude is strong enough to have a profound atmospheric response continuing into the Spring season.

Looking at the subsurface forecast by the CFS, we can still see a strong warm pool being present in the top 150 meters (500 feet) in January 2024. This signals a healthy El Niño event, with a cold pool already indicated to emerge over the western Pacific in 2024, reducing the chance for a double El Niño event.
We know what to expect in the oceans based on all this forecast data. But what can we expect in the atmosphere and our weather from this strong El Niño event?
El NINO IN THE WEATHER PATTERNS
During an El Niño winter season, there is typically a strong and persistent low-pressure area in the North Pacific. That pushes the polar jet stream further north, bringing warmer-than-normal temperatures to the northern United States and western Canada.
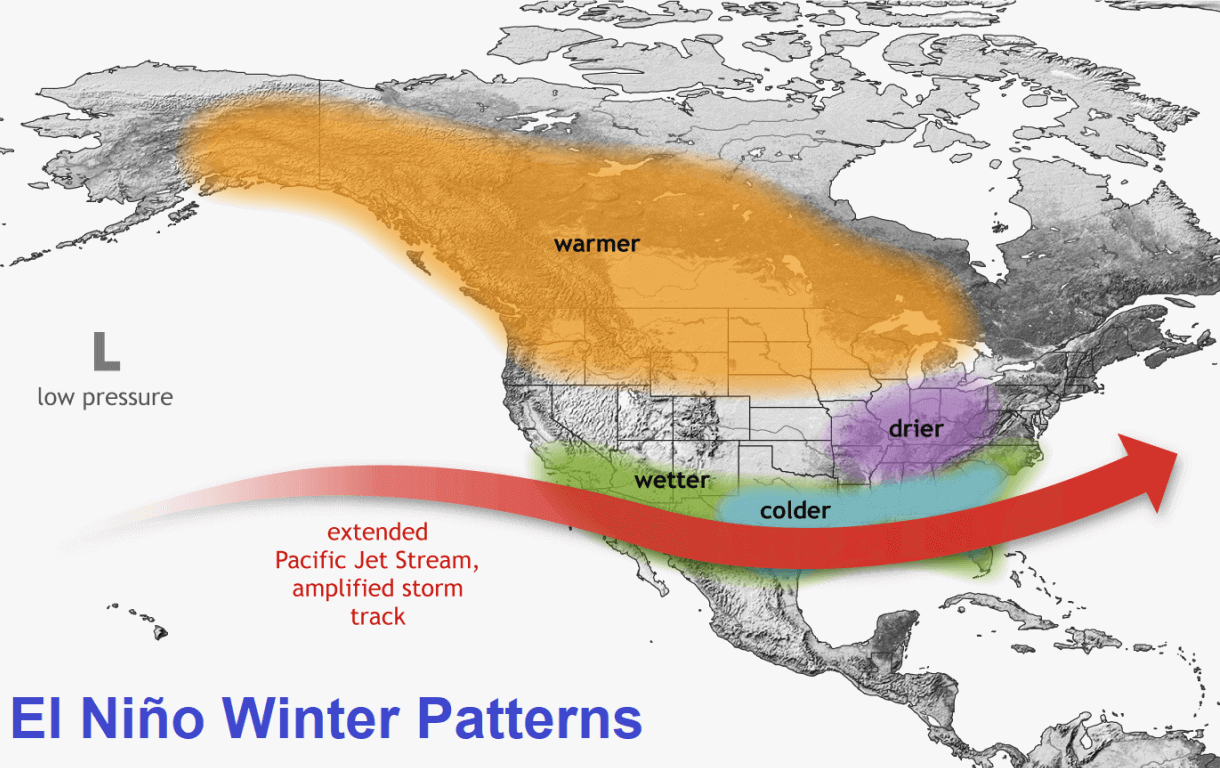
The southerly Pacific jet stream gets amplified during an El Niño. That means more low-pressure systems and storms over the southern half of the United States, with lots of precipitation and cooler weather.
You can see that in the jet stream forecast below for January 2024. It shows the typical strong subtropical jet stream over the southern United States, as expected during an El Niño Winter. Image by meteorologist Ben Noll.
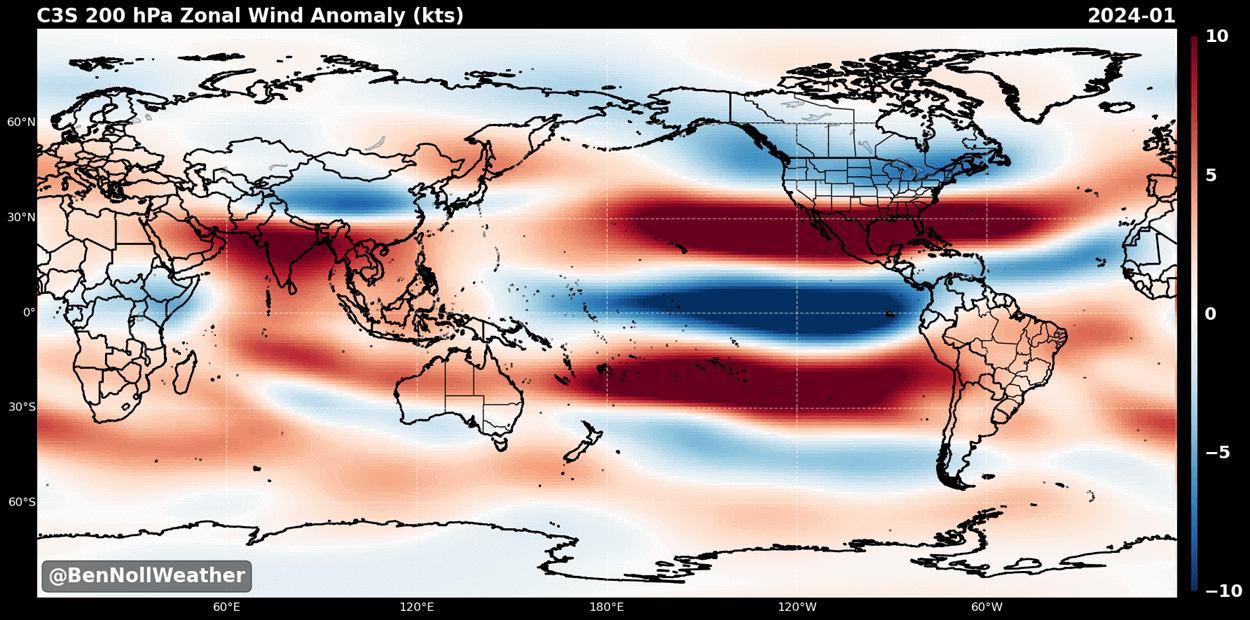
A stronger subtropical jet supports moisture transport into the southern United States, increasing the odds for snow events in the southern states and across the Mid-Atlantic. But it all depends if enough cold air is available.
Below is the latest pressure forecast for meteorological Winter across North America. You can see low pressure over the North Pacific and the southeastern United States. This is a very textbook El Niño pattern.
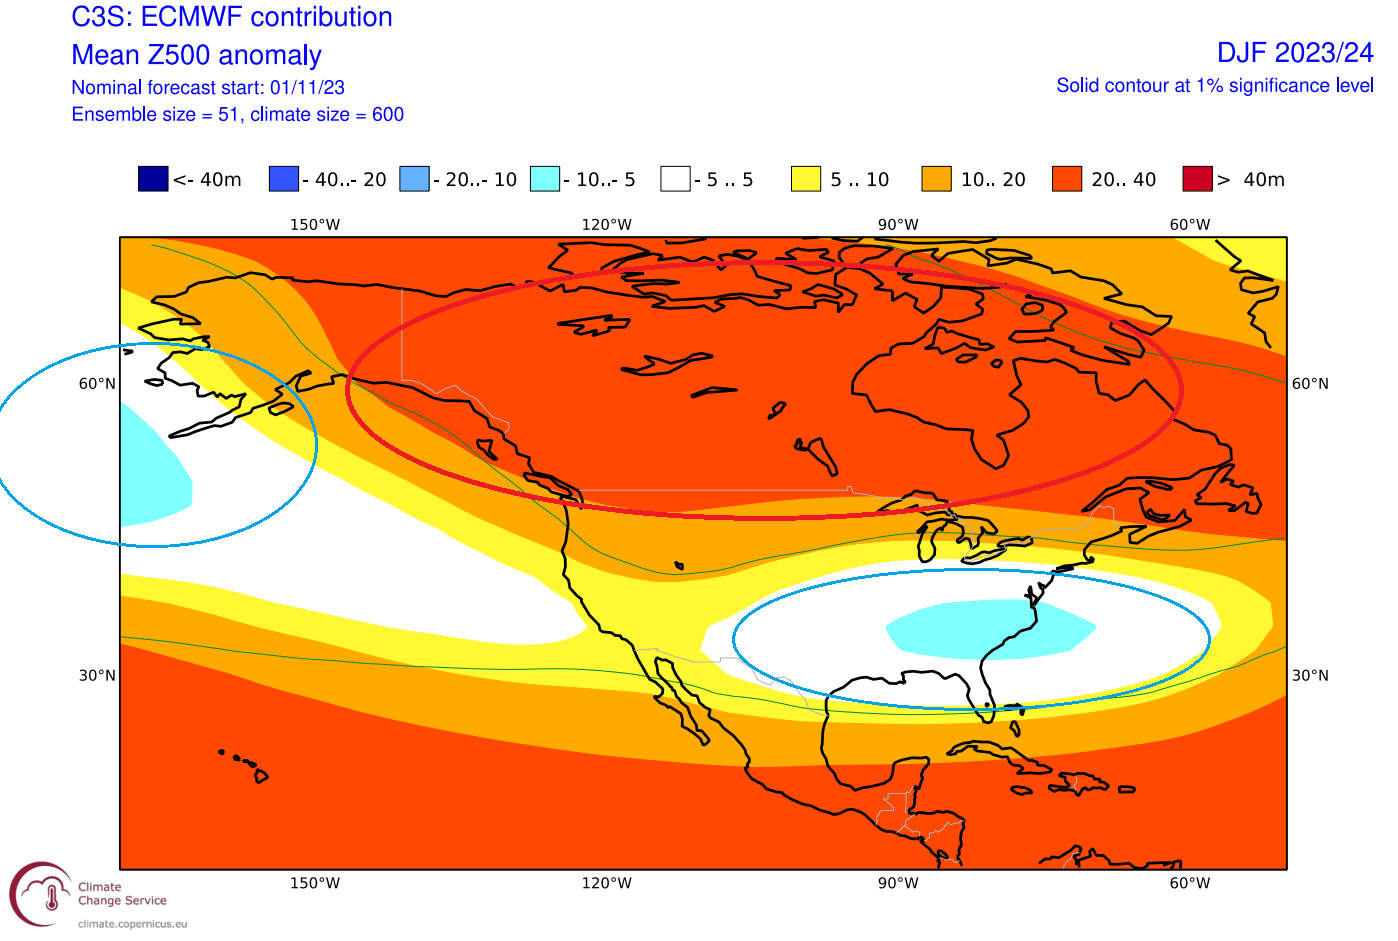
Such a pattern has good potential for winter storm events in the mid and late-winter seasons across the Midwest and northeastern United States.
Looking at the temperature anomalies in previous El Niño winters, you can see colder temperatures in the southern half of the United States and parts of the eastern United States. The northern United States is warmer than usual, with warm anomalies continuing deep into southern Canada.

Below is a new image by NOAA Climate, which shows the number of past El Niño events that were warmer or colder in the past. A pattern is seen that El Niño winters are mainly colder than average across the southern half of the United States and up into the northeast.

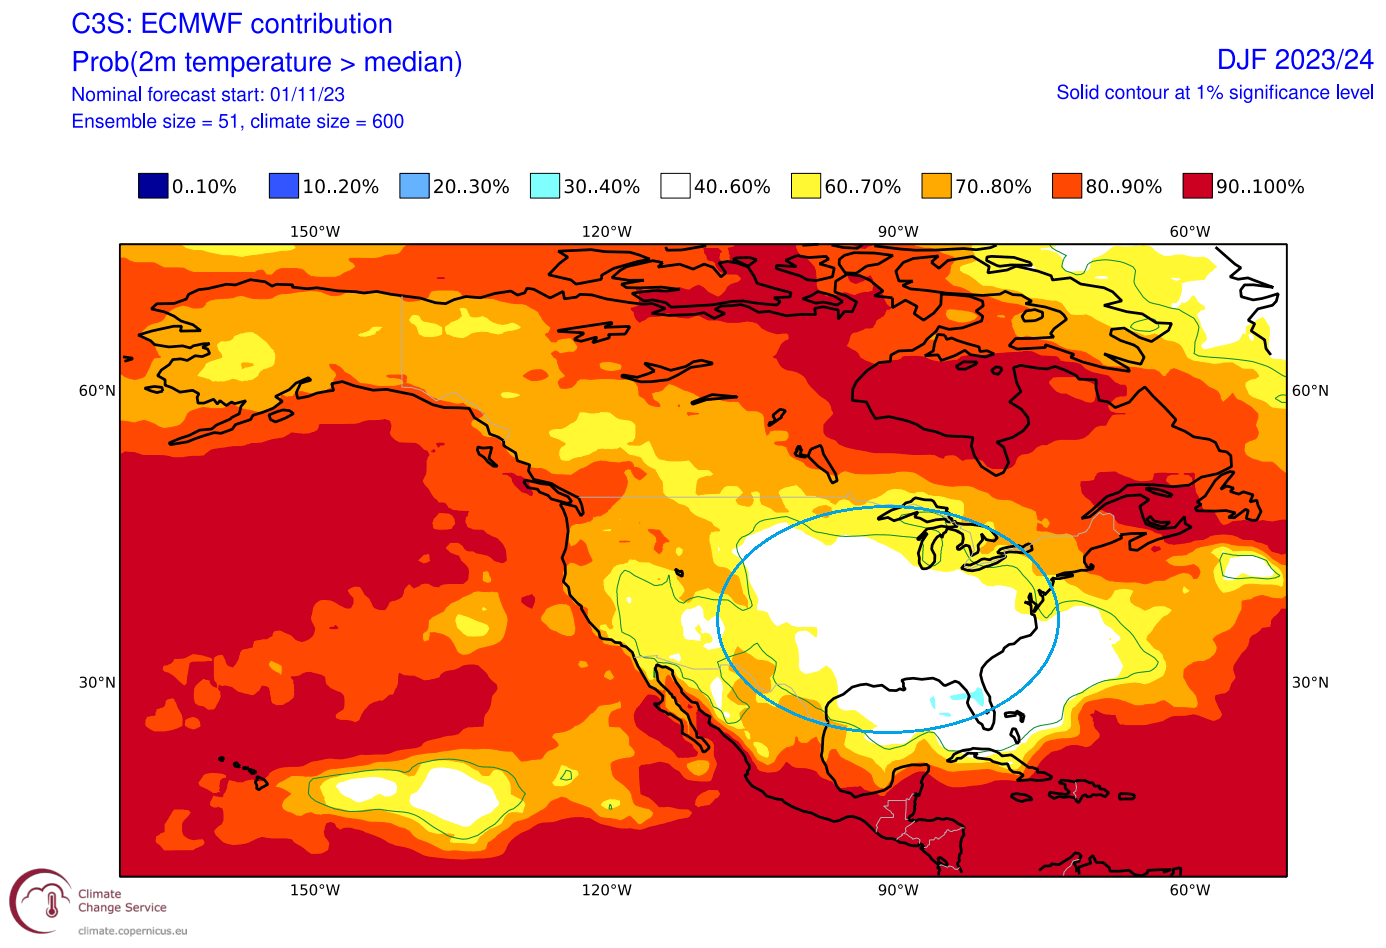
The latest airmass temperature forecast for Winter 2023/2024 shows a similar pattern. You can see a large area of normal temperatures. The southeastern, eastern, and central United States have the highest chance of seeing cooler or colder temperatures than normal.
Looking at precipitation, you can see that an average El Niño winter brings more precipitation to the southern half of the United States, especially in the Southeast. However, drier winter conditions prevail in the northwestern United States and around the Great Lakes.

El Niño also influences the Winter snowfall patterns, as seen in the image below. Some of the areas with more snowfall during an El Niño include New England, parts of the mid-Atlantic, parts of the mid-south, the southeastern United States, as well as the plains, four corners, and southwest. Image by meteorologist Ben Noll.

That is mainly due to low-pressure systems trailing across the southern United States along the stronger jet stream. More moisture increases the chances of snowfall in the southern half if cooler air is available.
Less snowfall is usually seen across the deep southern United States, Ohio Valley, Midwest, northern Plains, northern Rockies, and parts of the Pacific Northwest.
It is hard to find two similar winters in the data. So, despite knowing what these ocean anomalies can mean for the winter weather, each year has its distinct flavor and can create different weather outcomes locally.
We will keep you updated on global weather development and long-range outlooks, so make sure to bookmark our page. Also, if you have seen this article in the Google App (Discover) feed, click the like (♥) button to see more of our forecasts and our latest articles on weather and nature in general.
Don’t miss: