Winter 2023/2024 latest snowfall forecasts show a very dynamic pattern and strong contrasts from month to month. Also, thanks to the jet stream impact of El Niño, both North America and Europe are in for more than just a simple snowfall season.
In our previous article (linked at the bottom), we looked at temperature, precipitation, and pressure forecast for the upcoming winter. But now we are going to focus on snowfall data and break it down month by month.
A 3-month average can hide many different weather scenarios. So, we decided to break the snowfall forecast into monthly graphics. This way, we can show you just how different each winter month will be when it comes to snow.
DECEMBER OPENS WITH SNOWFALL
Since we will be talking about the snowfall forecast in this article, we have to look at the current weather pattern across the Northern Hemisphere. Because it just happens that a colder weather pattern is developing right at the start of the meteorological winter.
Meteorological winter begins on December 1st in the Northern Hemisphere and lasts three months, ending on the last day of February.
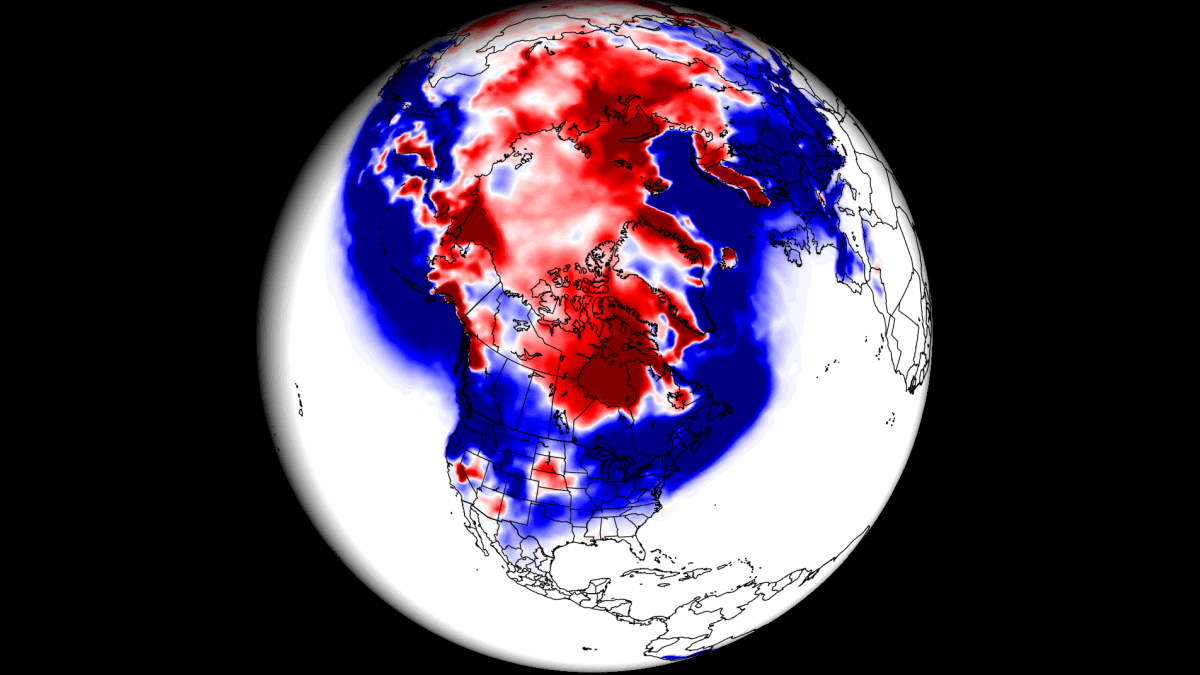
In the image below, you can see the pressure anomalies on the doorstep of winter. A large area of strong high-pressure anomalies is the main driver over the Northern Hemisphere. That disrupts the circulation, helping to push the colder air out of the polar regions.
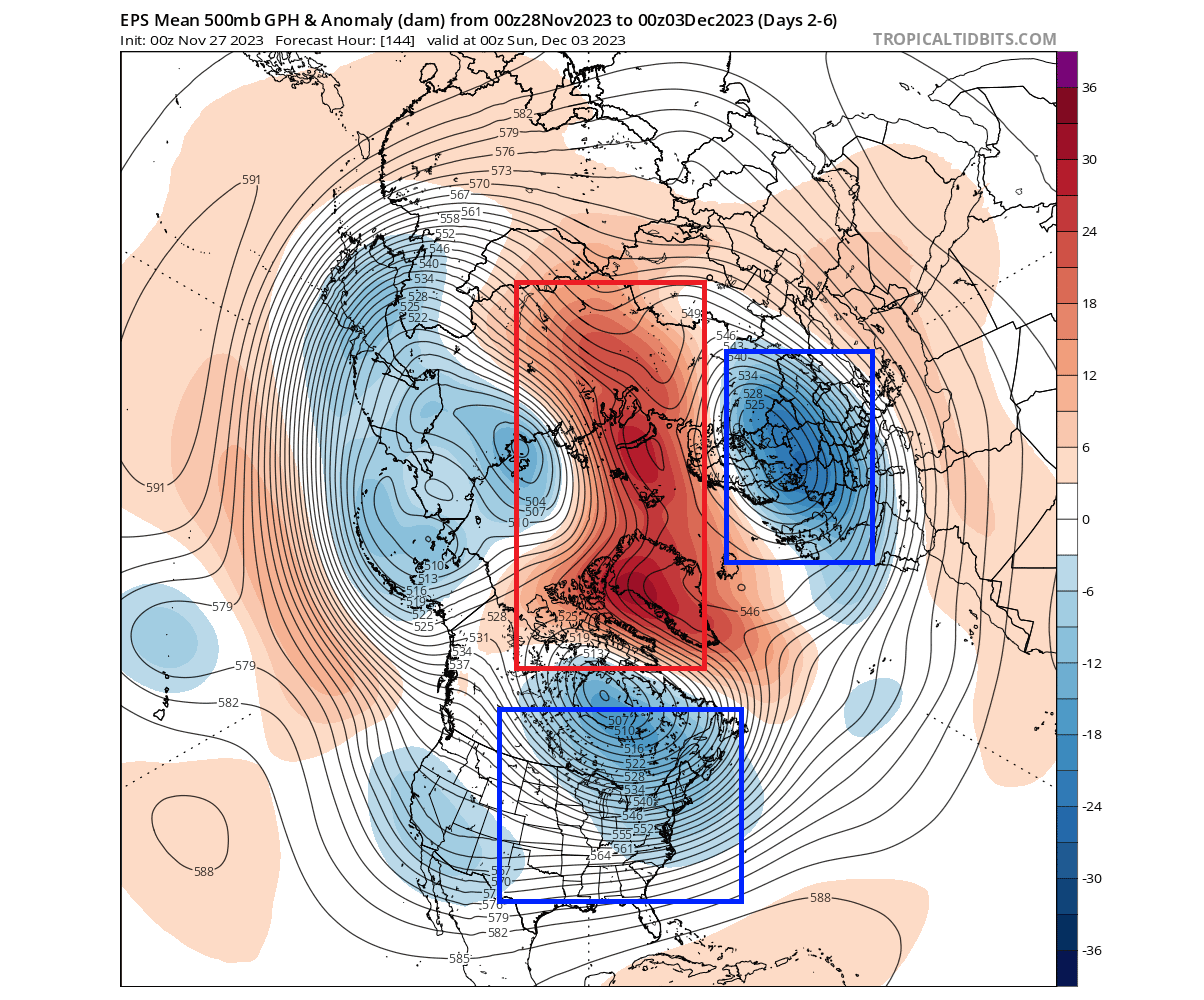
The areas marked in blue are the low-pressure anomalies, which pull the cold air from the north down into the eastern United States and Europe.
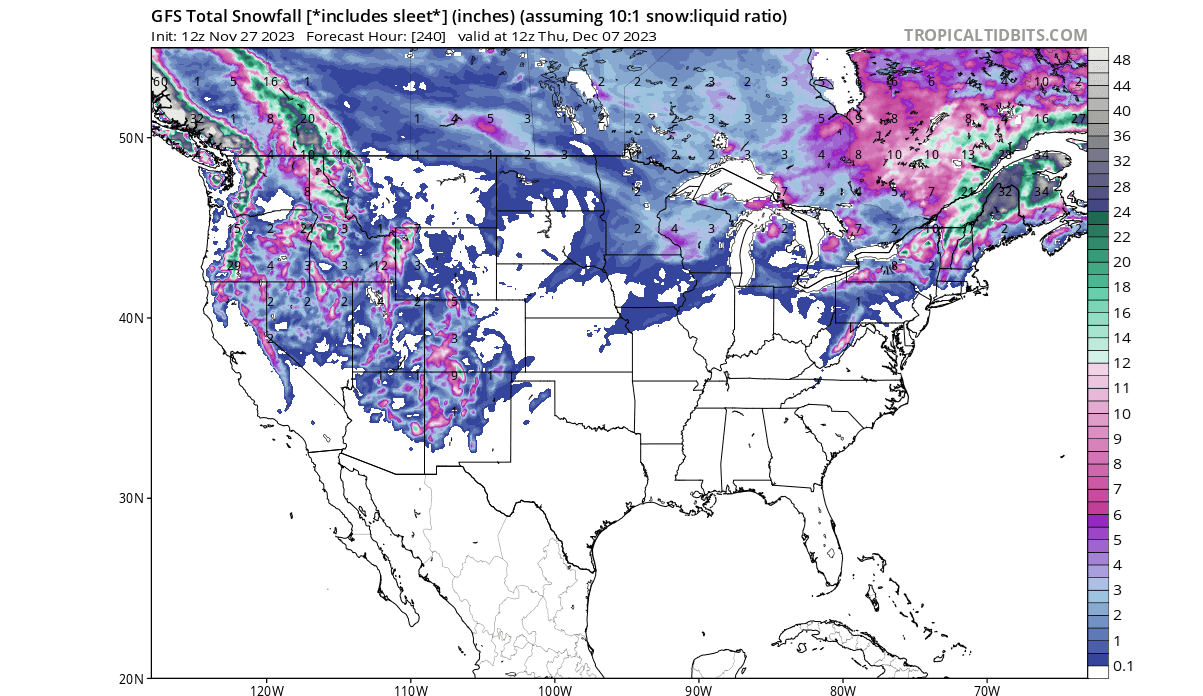
Looking at the total snowfall forecast for the next 10 days, you can see quite a large area with expected snowfall. For example, the western United States across the Rockies and some lover elevations, parts of the Midwest, the Northeast with lake-effect snow, and even some areas into the central Plains can see snowfall in this period.
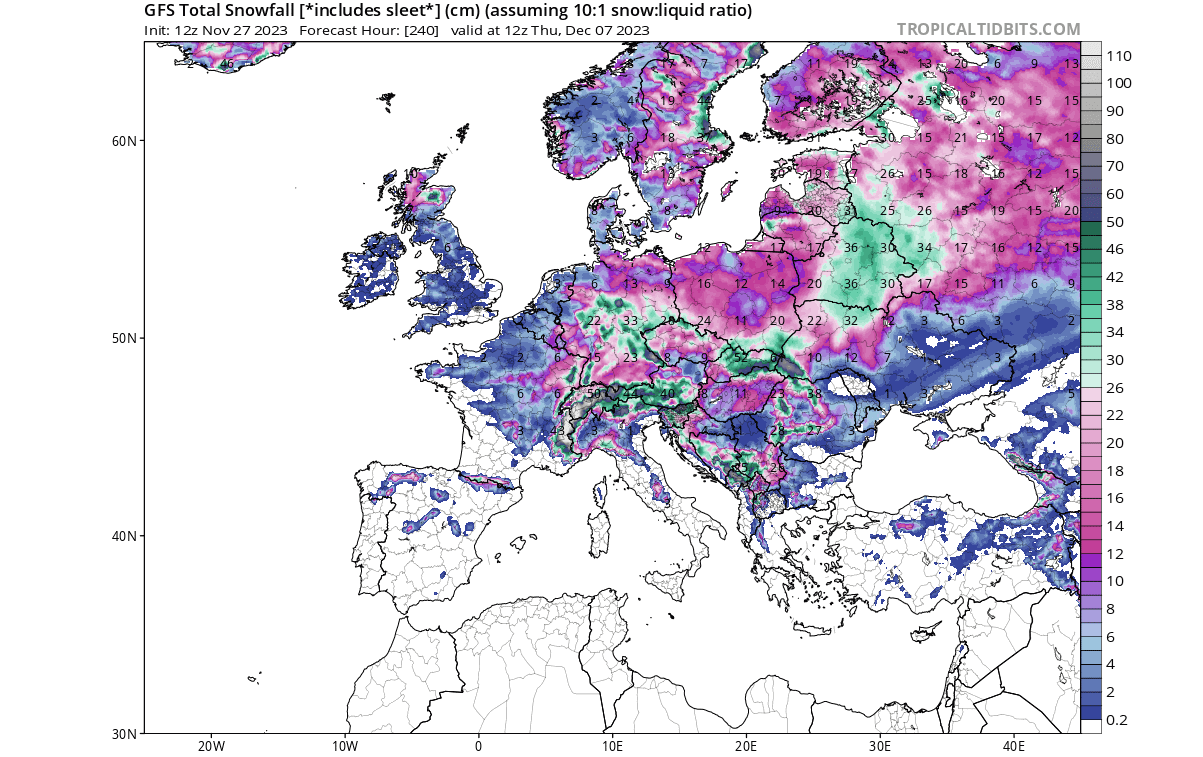
Europe also shows an exceptionally large extent of early winter snowfall in the forecast. Only some areas across the south and west will be too warm to see snowfall, the courtesy of a strong cold air outbreak over the continent.
We talk about this cold early winter pattern for a very simple reason. This is the best way to show you why a 3-month average forecast is not always as bad (or good) as it may seem, as there are many individual patterns/events that can hide inside.
This current event is just one example of how quickly the weather pattern can turn wintery across the United States or Europe, despite what a long-term average forecast might suggest.
WINTER 2023/2024 FINAL SNOWFALL PREDICTIONS
We will look at the latest snowfall predictions by using two well-established long-range weather forecasting systems. The first is the ECMWF, and the second model is the UKMO.
You will first see the average snowfall forecast for the meteorological winter period (December-January-February), and then we will do a monthly breakdown. There are a lot of details in the monthly forecast that the whole seasonal average does not show.
ECMWF WINTER 2023/2024 SNOWFALL PREDICTION
We usually start with the ECMWF, as it is the most often used and highly regarded seasonal forecasting system.
First, we have the seasonal average image for Europe. Overall, you can see a very weak snowfall forecast. Most of the continent is predicted to have less snowfall than normal, except for the Alps and higher parts of northern Europe.
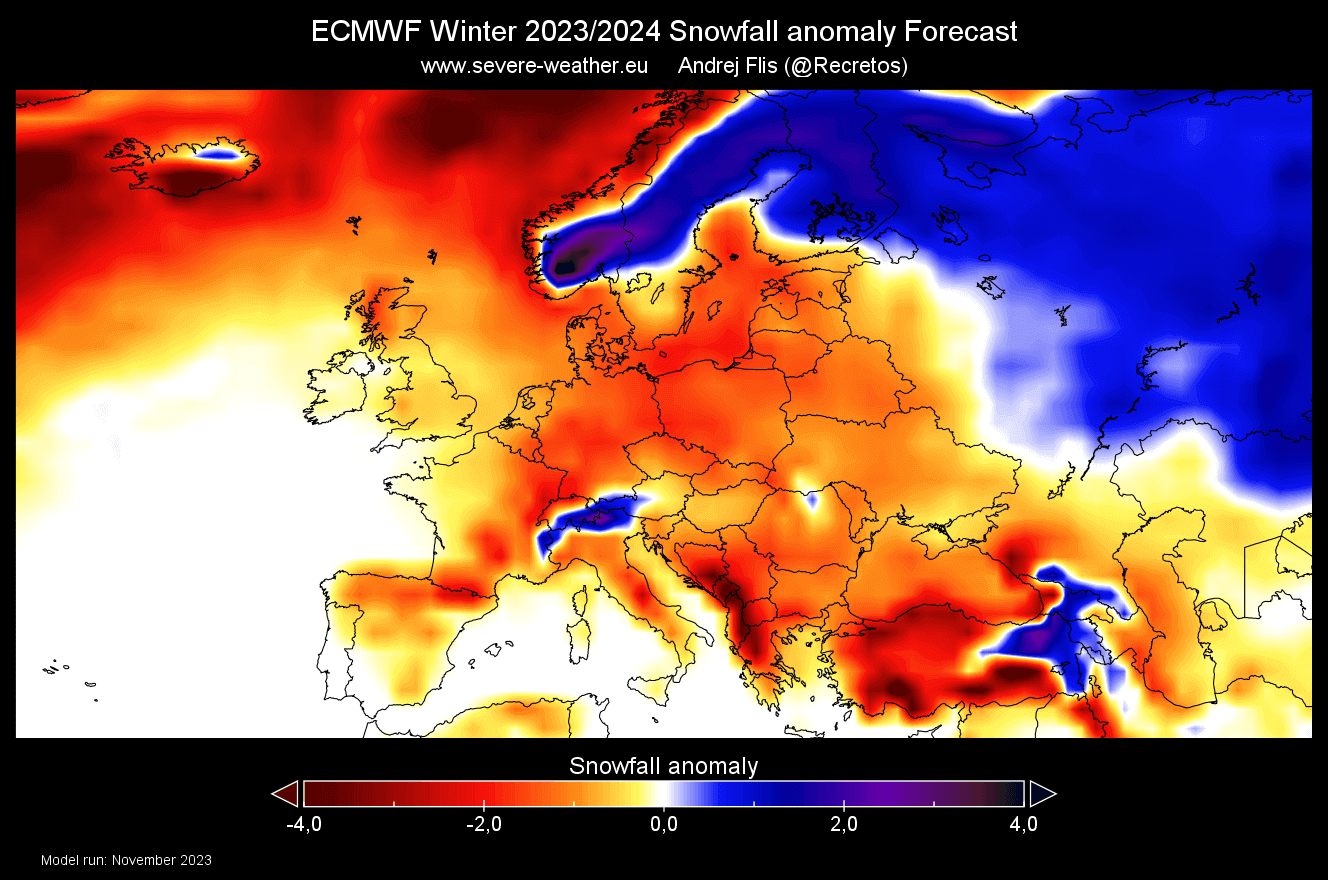
Compared to the forecast from the previous month, the latest forecast shows much more total snowfall over the continent. Especially over parts of central Europe, the northwest, and the north.
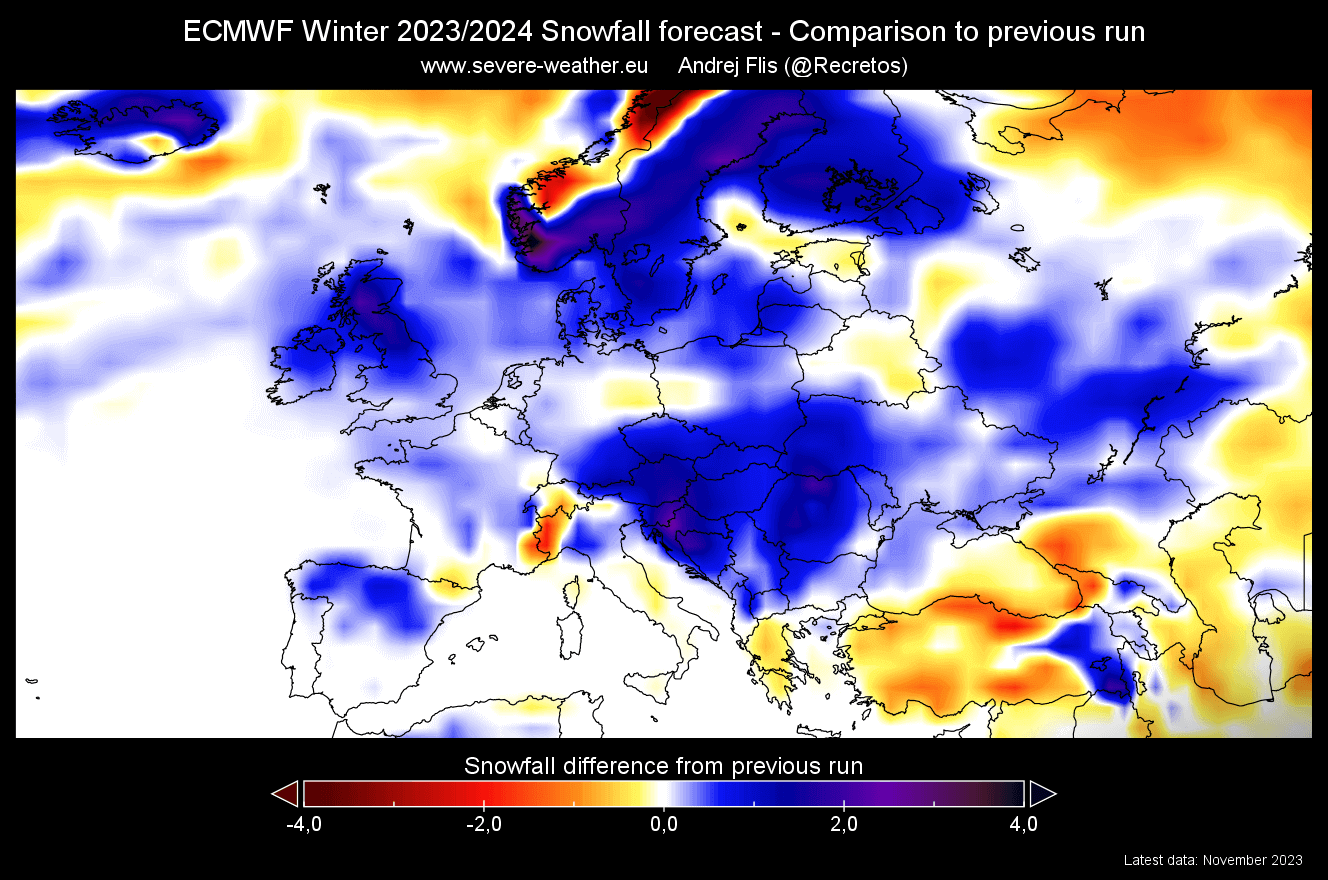
But as you will see in the monthly images, the reason for such a strong increase is the very low snowfall amount in the previous forecast.
The December snowfall forecast shows most of the continent with strong negative snowfall amounts, apart from the far north. This is due to a more westerly to southwesterly flow over most of Europe, which is rich in precipitation but also warmer.

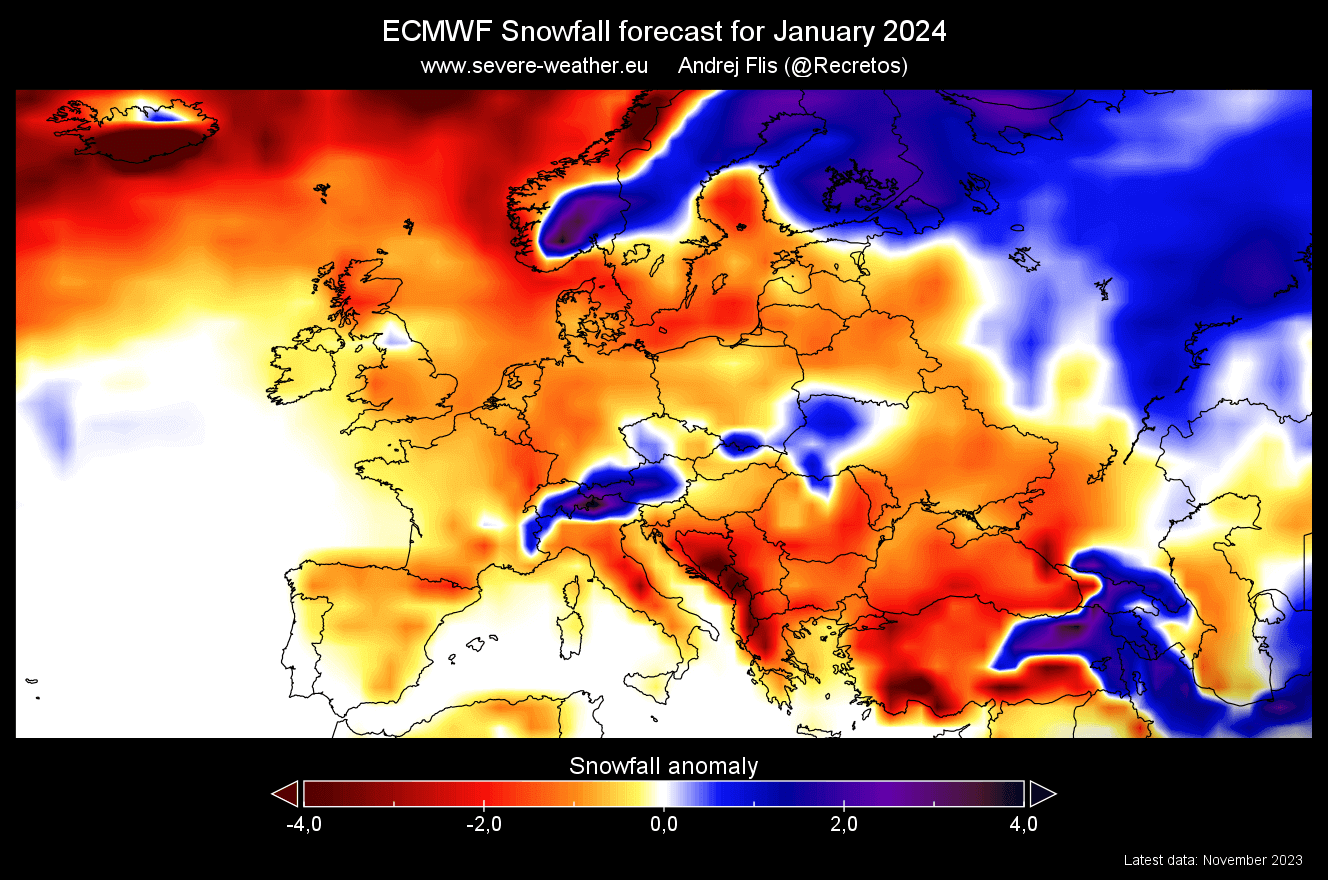
In the January forecast, the pattern does improve, and you can see more areas across central Europe starting to have increased snowfall.
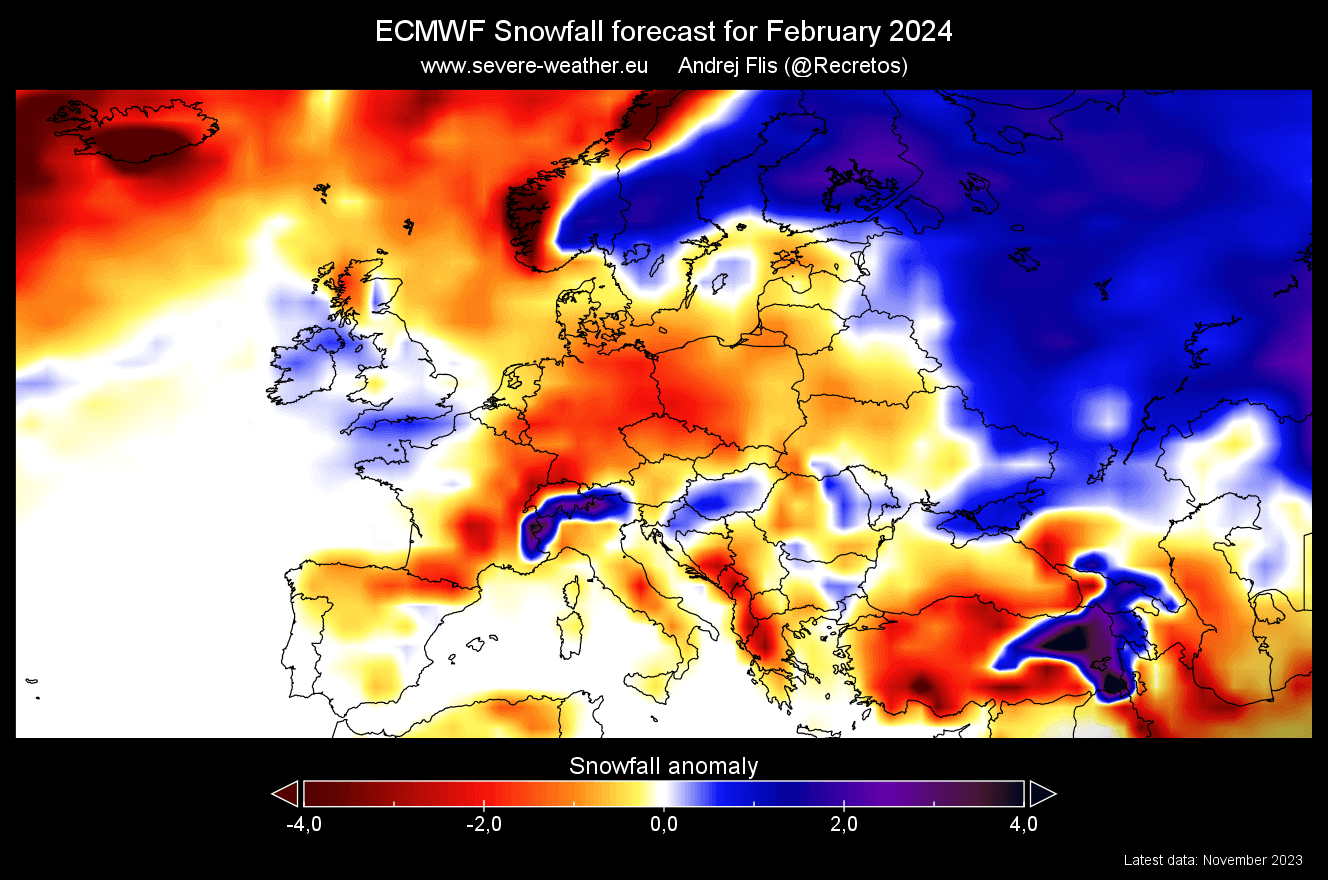
February shows no major improvement over the previous month, but we do still have some areas across central Europe with more snowfall than normal, and across the northwest.
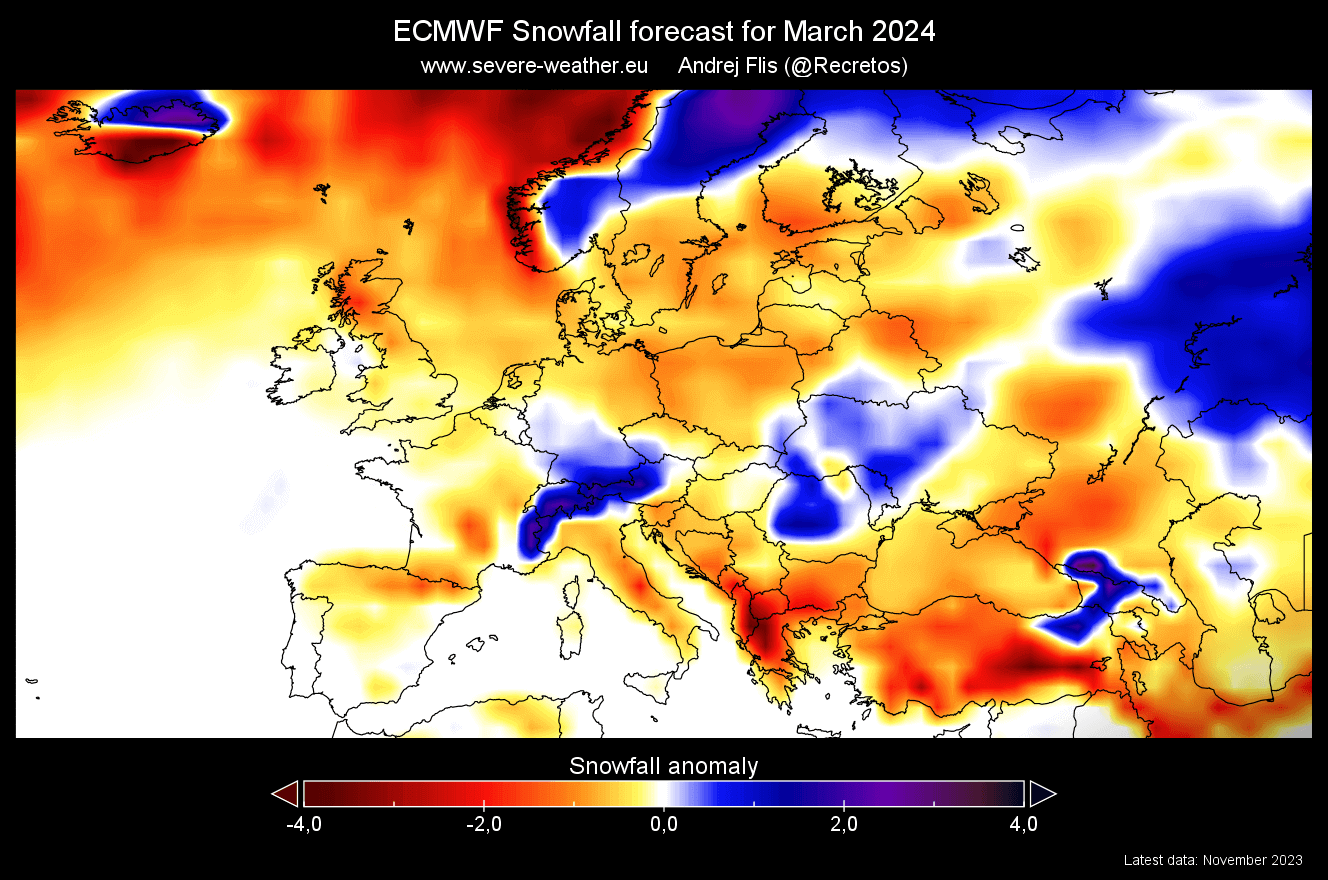
Looking at March below, we know that this month can still be cold and usually provides snowfall. The ECMWF forecast shows more snowfall across the higher elevations, still much more than in the previous forecast run.
NORTH AMERICA ECMWF SNOWFALL FORECAST
Over North America, we see a very interesting snowfall forecast. ECMWF suggests more snowfall than usual across much of the central Plains, northern Plains, the southern United States, and the upper Midwest. This is a strong snowfall forecast, which is, at the moment, more unique to the ECMWF model.
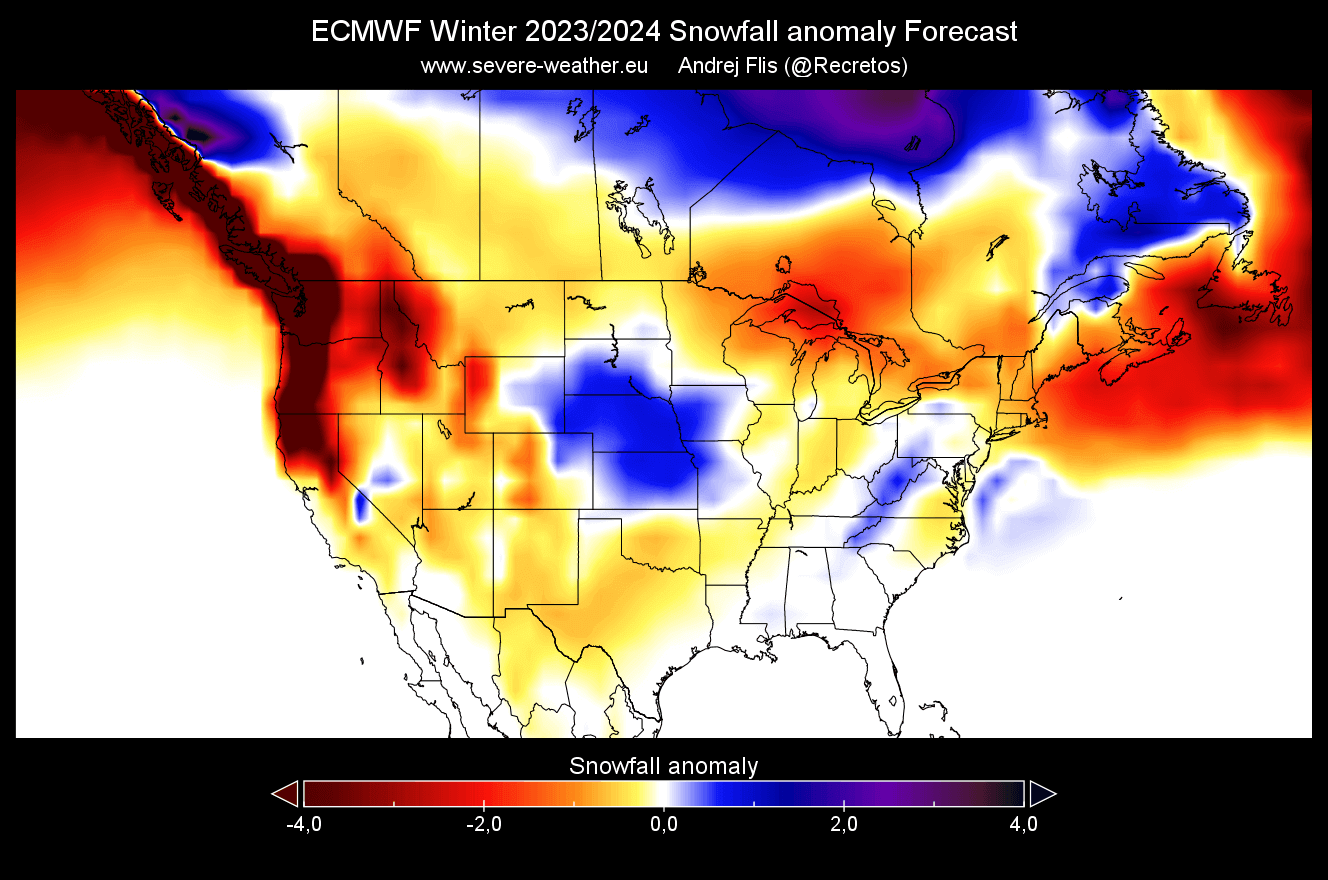
Looking at Canada, you can see increased snowfall across the southern and southeastern parts of the country, while less snowfall is forecast across the west coast of North America.
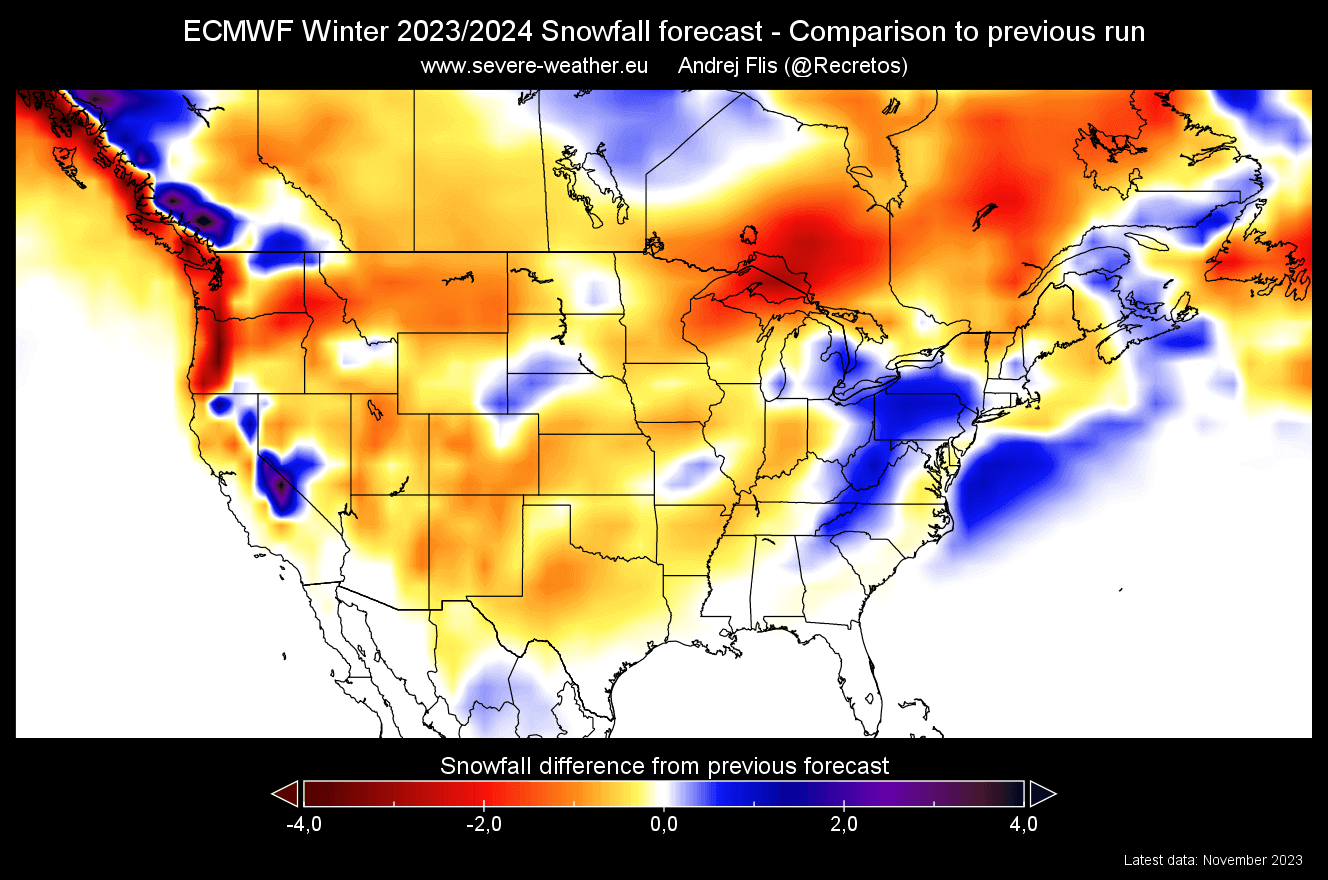
Below is an image that compares the latest forecast to the previous one from October. You can see that more snowfall is being forecast in the eastern United States, and some parts across the upper/central Plains.
But this change does not start in the December snowfall forecast below. You can see an increased snowfall potential across the central Plains and over the southwest. But most other parts are forecast to receive less snowfall than normal.
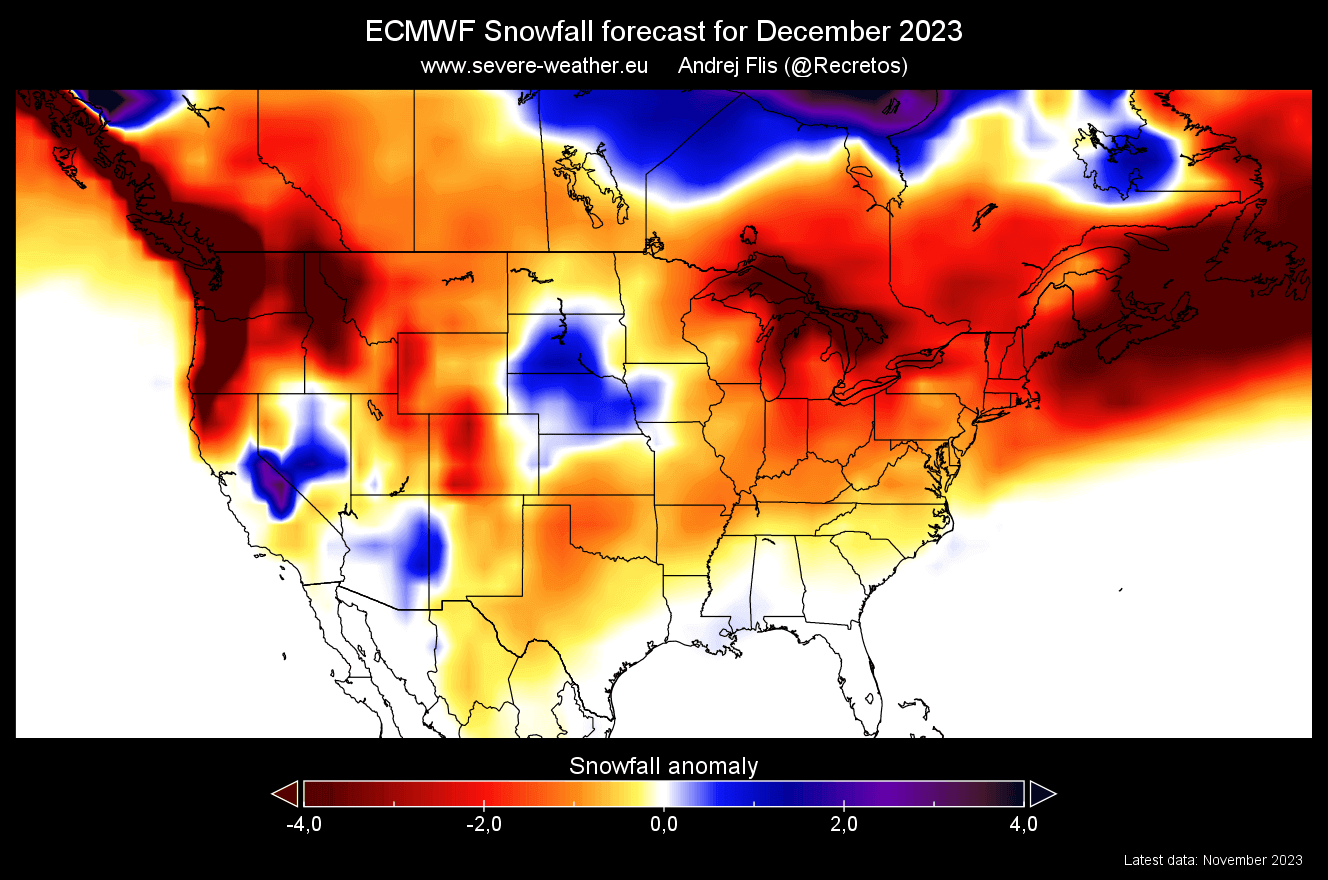
Based on the latest short-term data, however, it does seem that there will not be such a December snow deficit across the eastern United States.
January snowfall forecast shows a shift in the weather patterns and much-improved snowfall amounts. An increased snowfall potential is now seen over the central and northern Plains, across the Midwest, the northeastern United States, and the Appalachian Mountains.

The January snowfall forecast also shows increased snowfall across southeastern Canada, while much less snowfall than normal is forecast across the Pacific Northwest.
Looking at the February snowfall forecast, you can see another strong snowfall forecast for the central and eastern United States, including the states up in the northeast. This is where the large amount of snowfall comes from in the 3-month average across the eastern United States.

Canada shows above-normal snowfall over the east/southeast. Continued snow deficit is forecast across the western United States and the Pacific Northwest.
And looking at the updated March snow forecast, it shows less snowfall across much of the central and eastern United States, exactly where we have seen the largest positive anomalies in the previous month. More snowfall is forecast across the Rockies and up into the northern Plains.
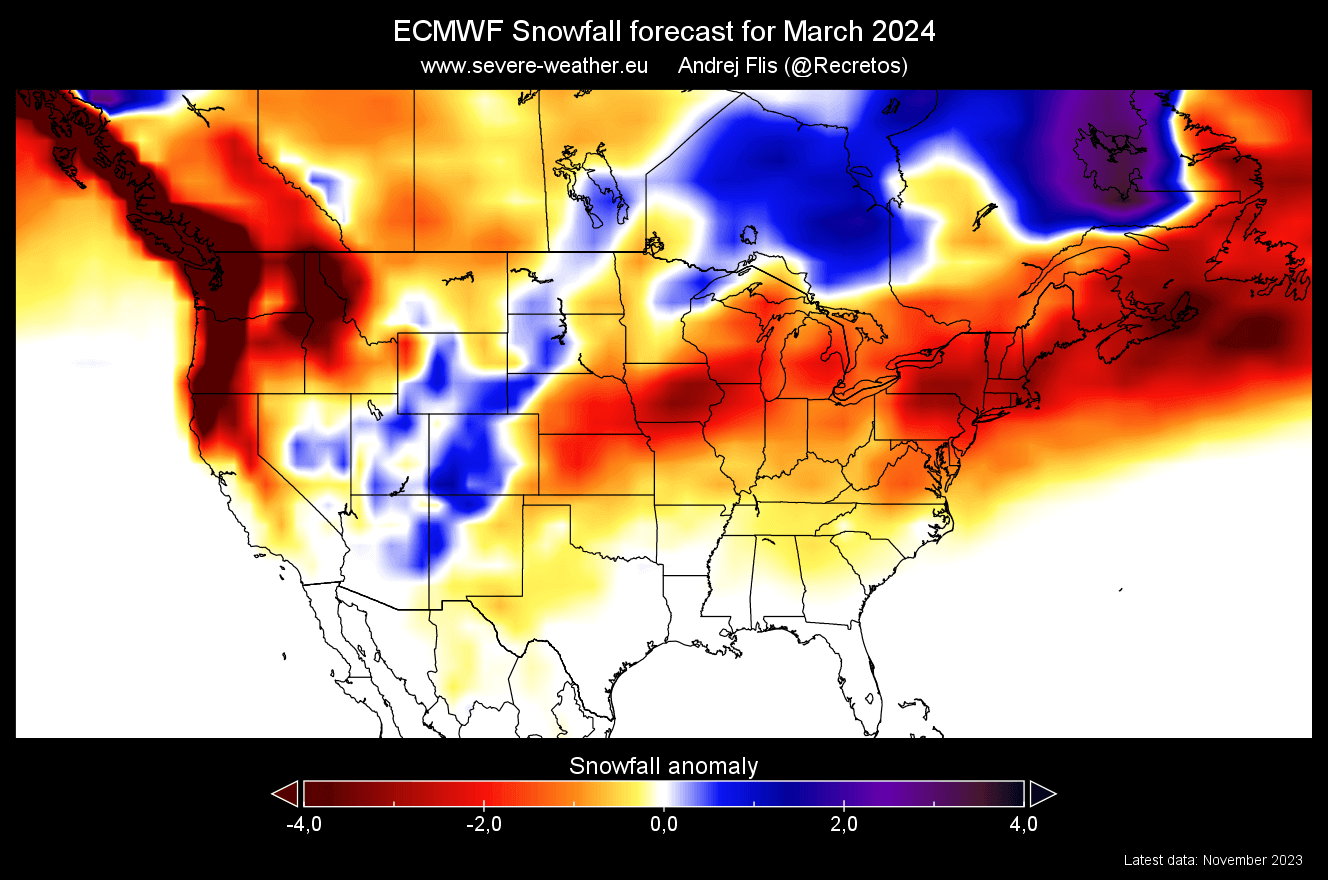
It is common to see more snowfall being forecast for higher elevations and more northern areas in March. That is because, for snowfall, we need cold/freezing air temperatures. And as we enter the early spring days in March, that cold tends to move into higher elevations and northern latitudes.
But don’t forget that March and even April can still feature cold air outbreaks and can bring snow events down to the central states or events into the southern United States in some cases.
UKMO WINTER 2023/2024 SNOWFALL FORECAST UPDATE
Long-range weather forecasting is a hard task. We look at trends and probabilities, but the variation is still key. The more forecast data you can look at, the better idea you can get what the most possible scenario is.
It’s never a good idea to only look at one single forecast solution. For that reason, we also use the UKMO long-range forecasting system along the ECMWF. It is run by the United Kingdom Met Office.
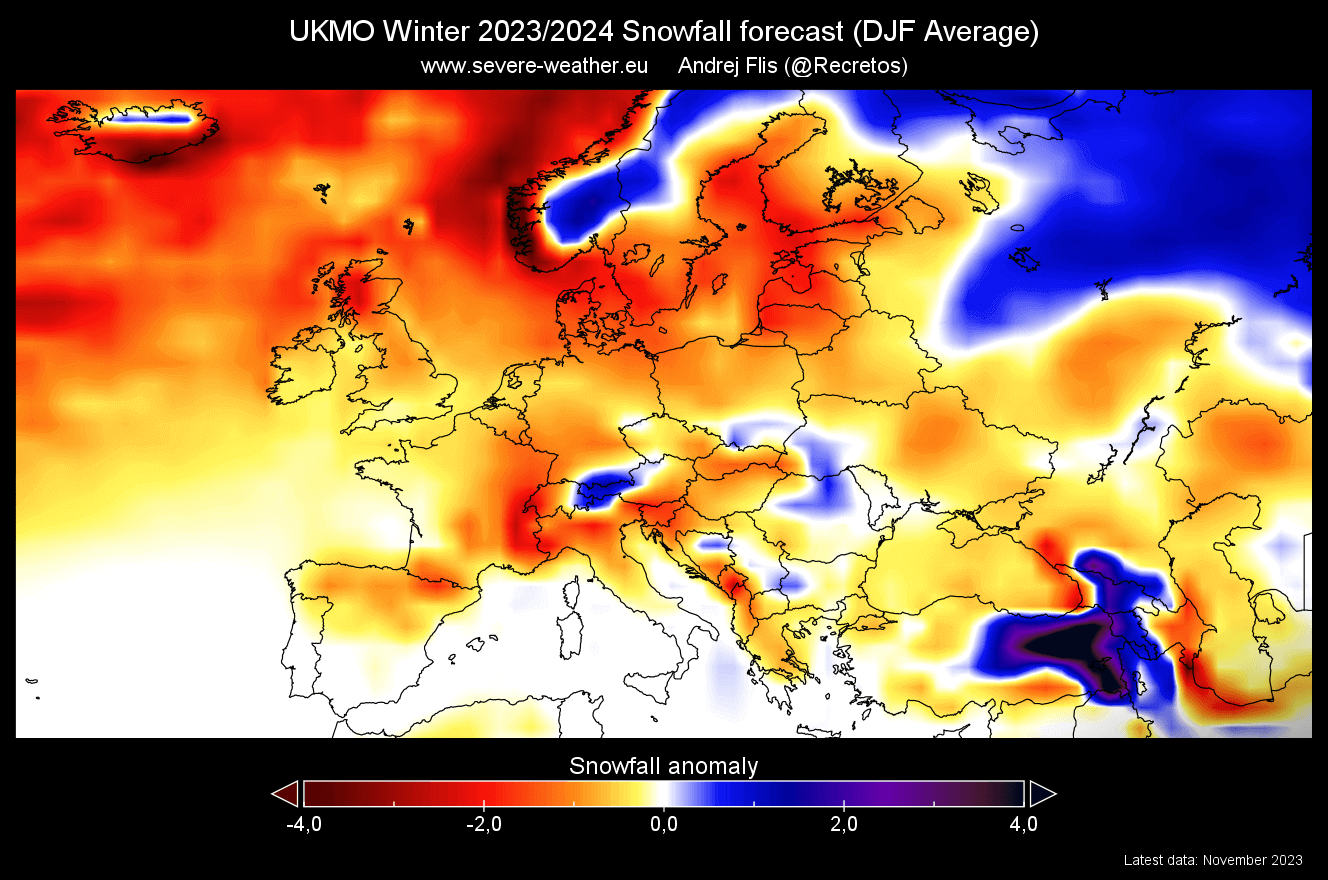
First, looking at the seasonal average for Europe, we can see overall less snowfall than normal. But like the ECMWF, we see some higher elevations across central and northern Europe with increased snowfall.
For UKMO, we also have a graphic that shows the change in the snowfall forecast compared to the previous run. It shows that the latest UKMO data has increased the snowfall potential over several parts of Europe, especially central. But why do most areas still show below normal in the total forecast above?
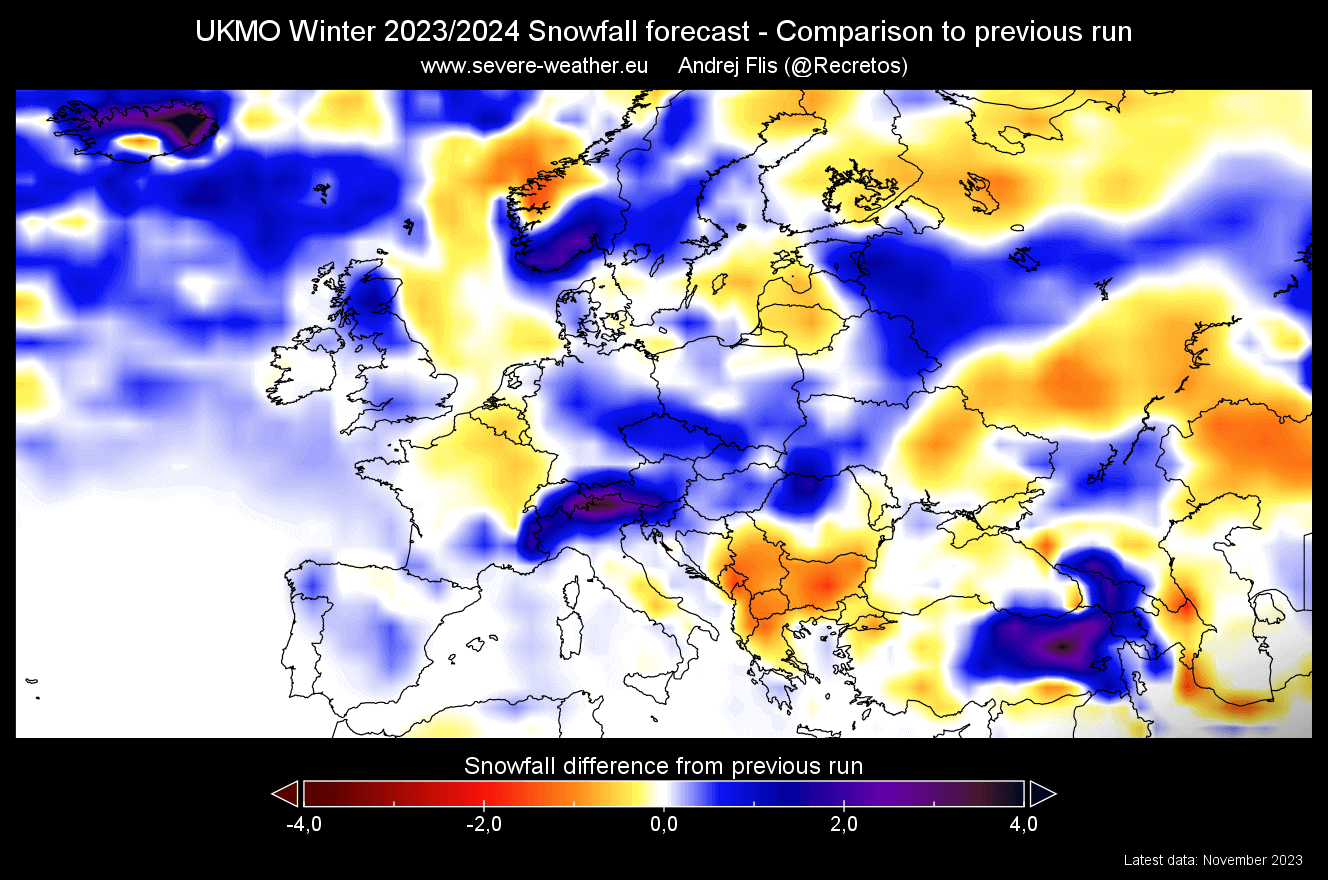
To explain that, let us say a country was forecast to have -60% of normal snowfall in the previous forecast but is now forecast to have -30% snowfall in the latest forecast. That is still a below-normal forecast but is actually a +30% improvement in snowfall amount from one forecast to another.
That is why we tend to compare one forecast to another to see if the trend shows increasing snowfall amounts with new data or lowering it. But now, let’s return to monthly forecasts.
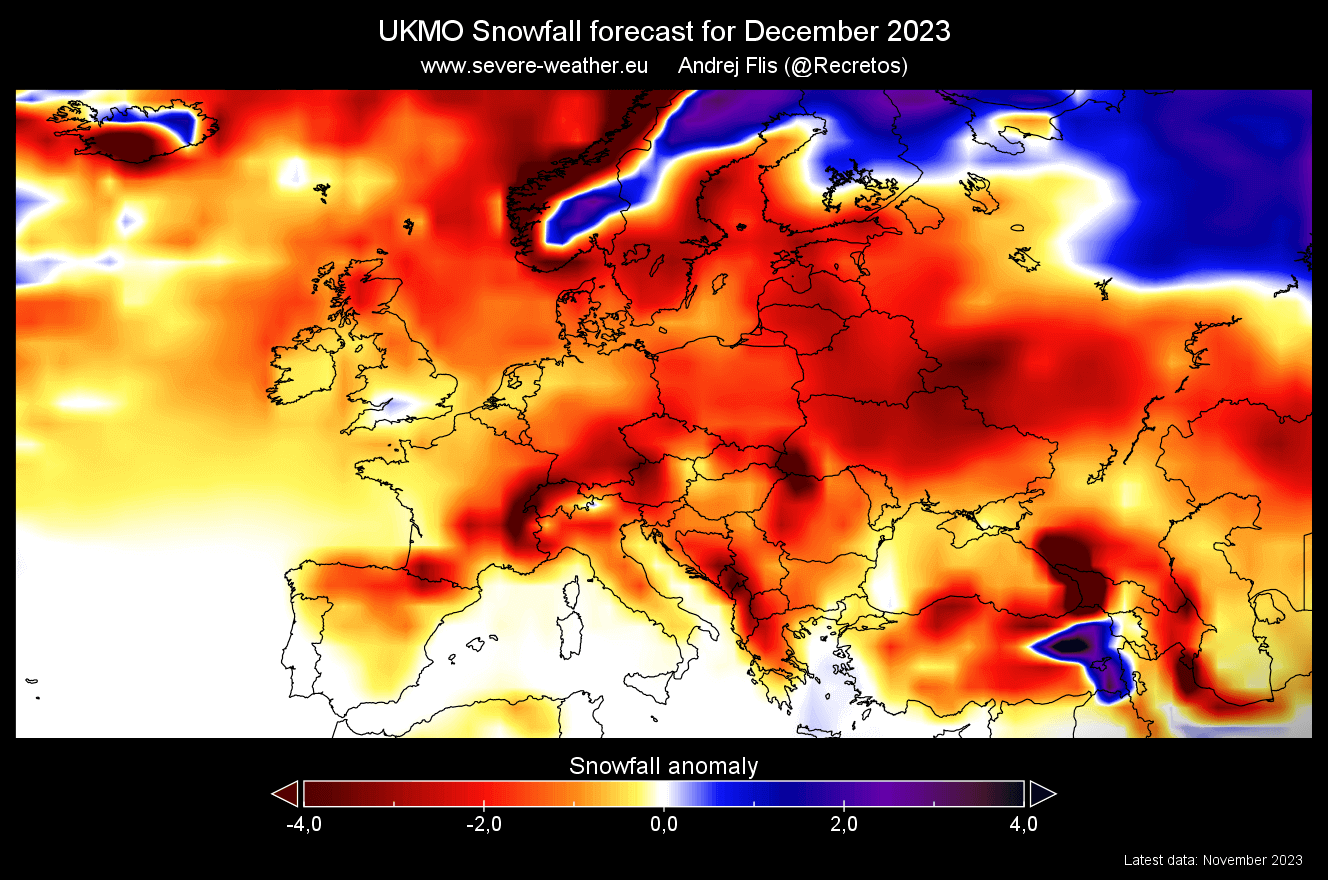
The December snowfall forecast shows a very weak outlook, with most of the continent having less snowfall than normal. This is pretty much identical to ECMWF, which gives this scenario a higher probability.
Looking at the January snowfall forecast, there is some improvement over higher parts of central Europe.

But looking at the February snowfall forecast, you can see a much-improved snowfall forecast. More snowfall than normal is forecast over large parts of central and southern Europe.
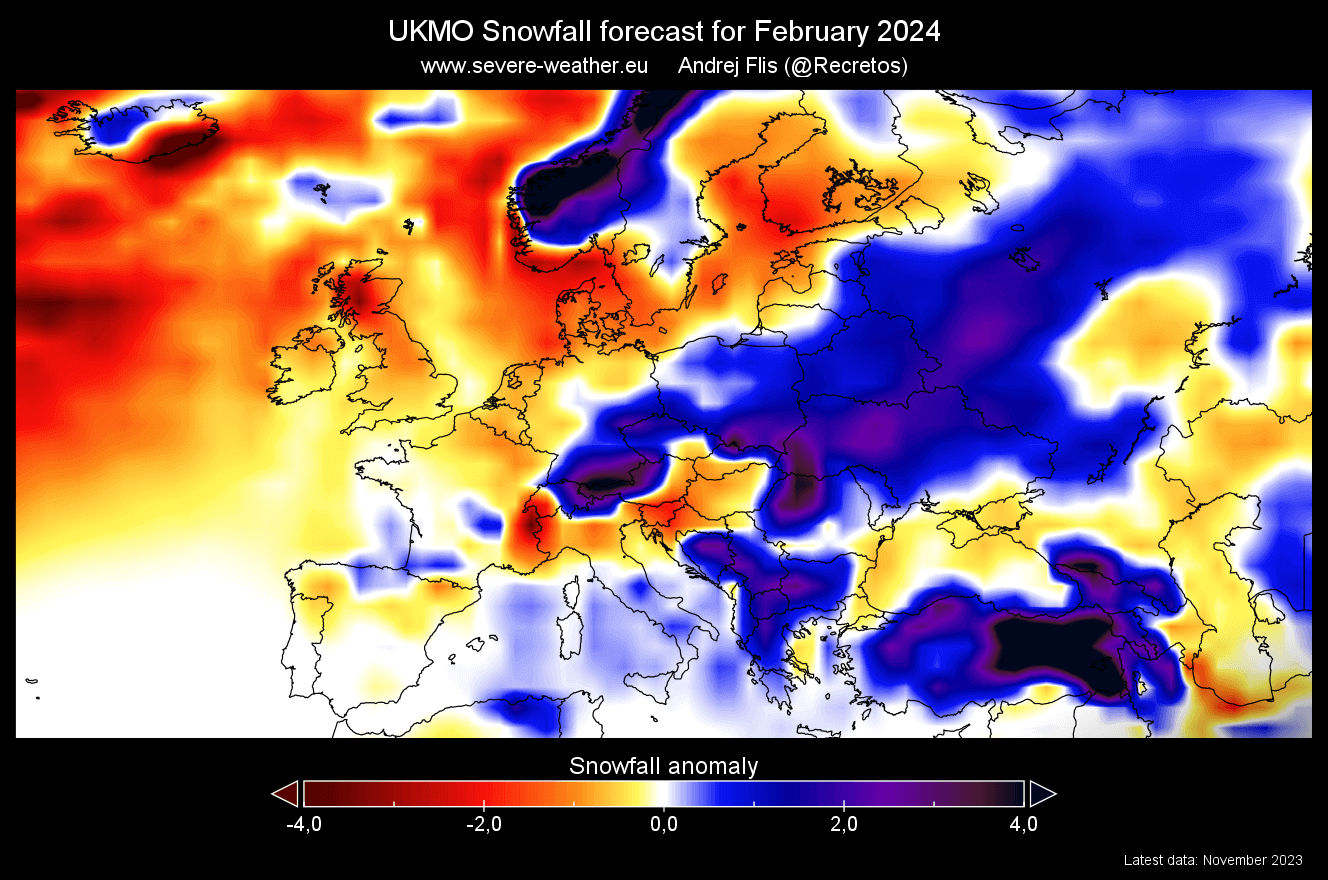
This is different than in the ECMWF model, but it is similar to what it showed in the previous forecast.
NORTH AMERICA UKMO SNOWFALL PREDICTIONS
The average seasonal forecast for the United States and Canada shows a generally lower snowfall amount over the 3-month period. But we do some areas with more snow, like the Rockies, northern Plains, and even south Texas.
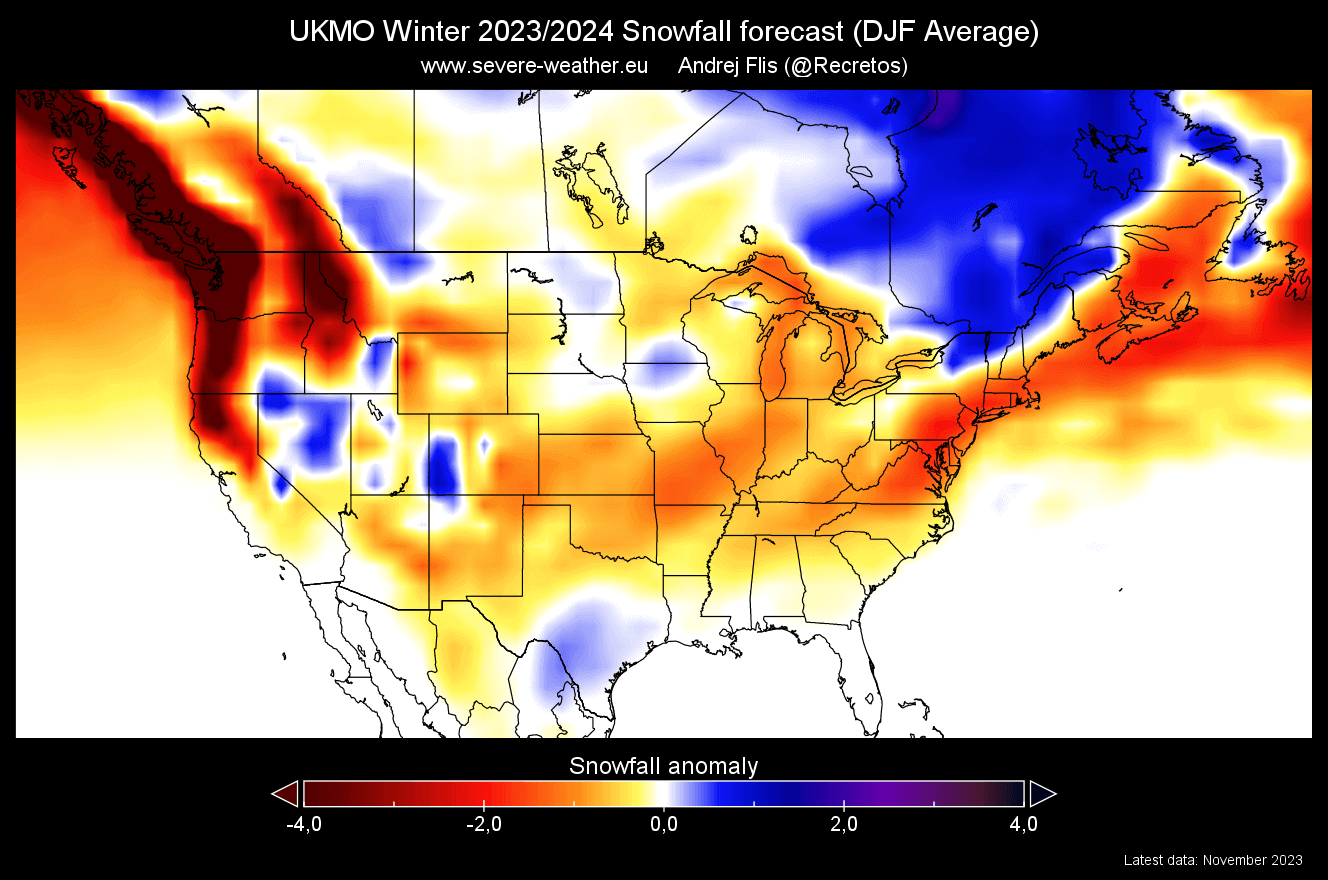
But what might seem like a generally below-average forecast is still much better than the previous forecast.
The image below shows the comparison to the previous UKMO forecast, and you can see that the latest one shows much-improved snowfall amounts over a large part of the United States. So, while the latest forecast might be just at or below average, the trend is increasing the overall snowfall amounts.
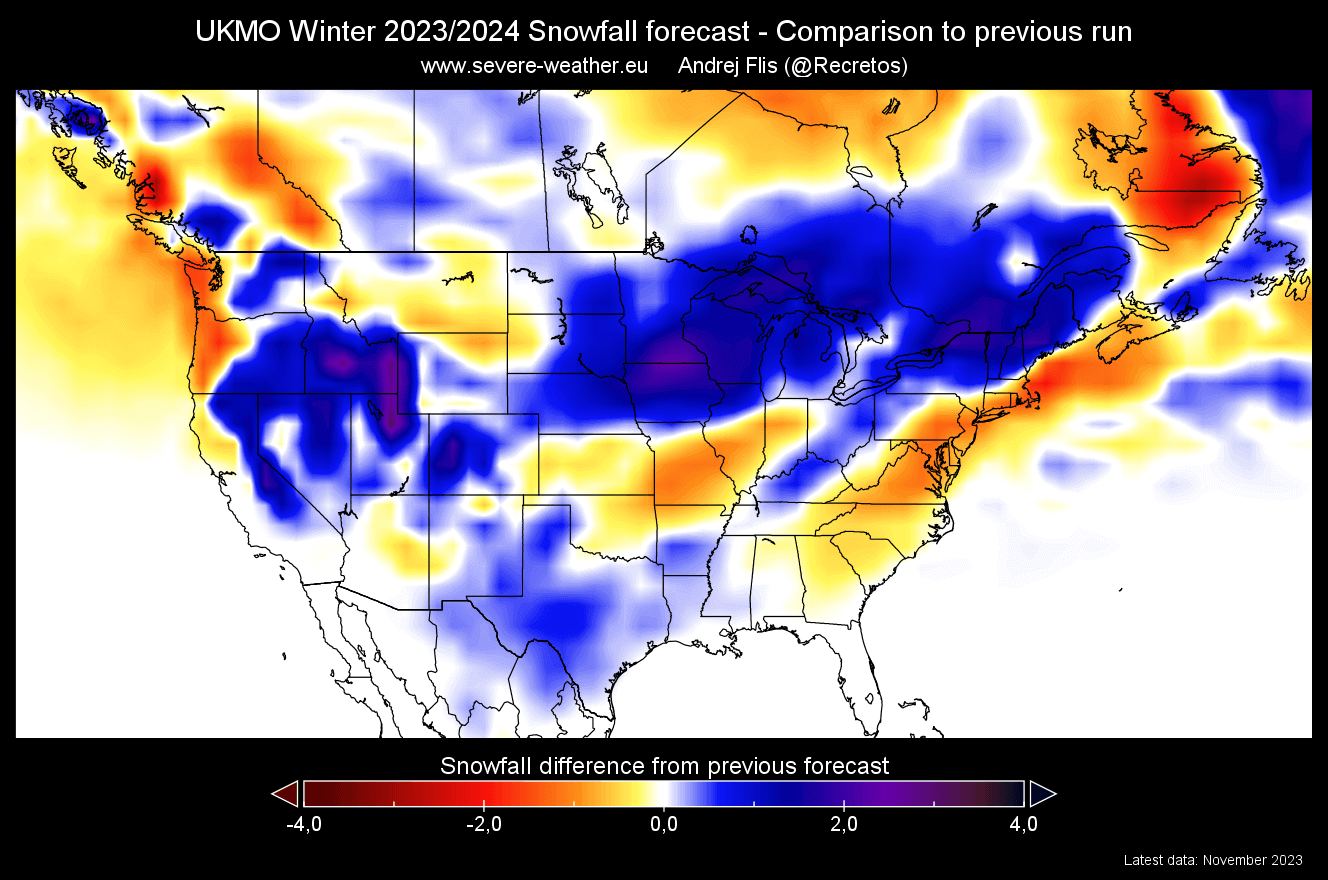
As we explained in the previous example, this means that while the overall forecast for one state can still be below normal, it now has more snow forecast overall.
For example, if a normal amount of total winter snow for one state is 90cm (3ft), the previous forecast shows 30cm (1ft), and the latest forecast shows 60cm (2ft). The latest forecast is still below normal but much better than the previous one.
The December snowfall forecast shows an increased snowfall potential across the northern Plains and the Rockies. Parts of the northeast also see more snowfall and a large area of eastern Canada.

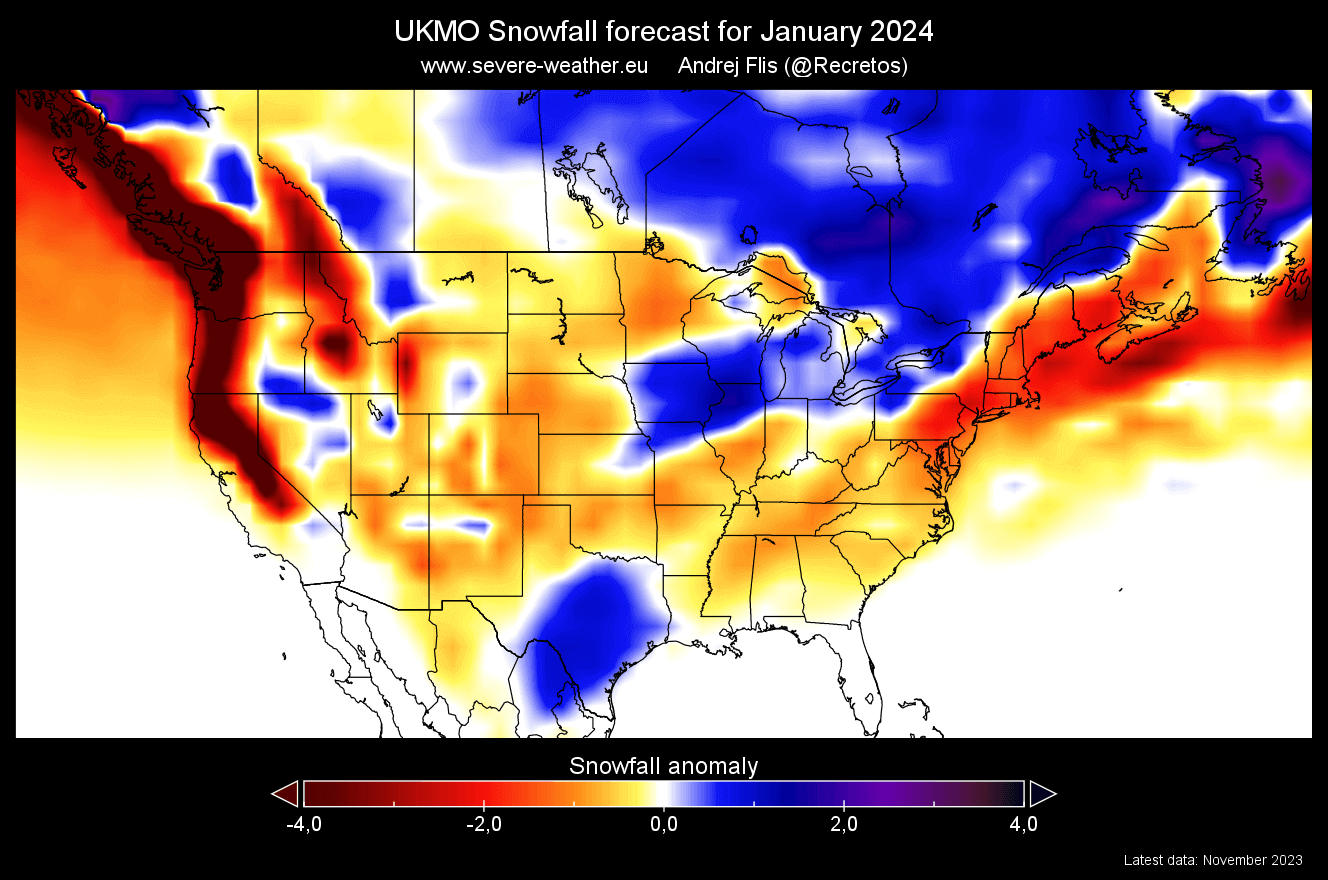
January snowfall forecast shifts the increased snowfall potential over the deep south, parts of the Midwest, and some higher elevations across the west. Less snowfall is seen over the northeastern United States, while eastern Canada remains under abundant snow.
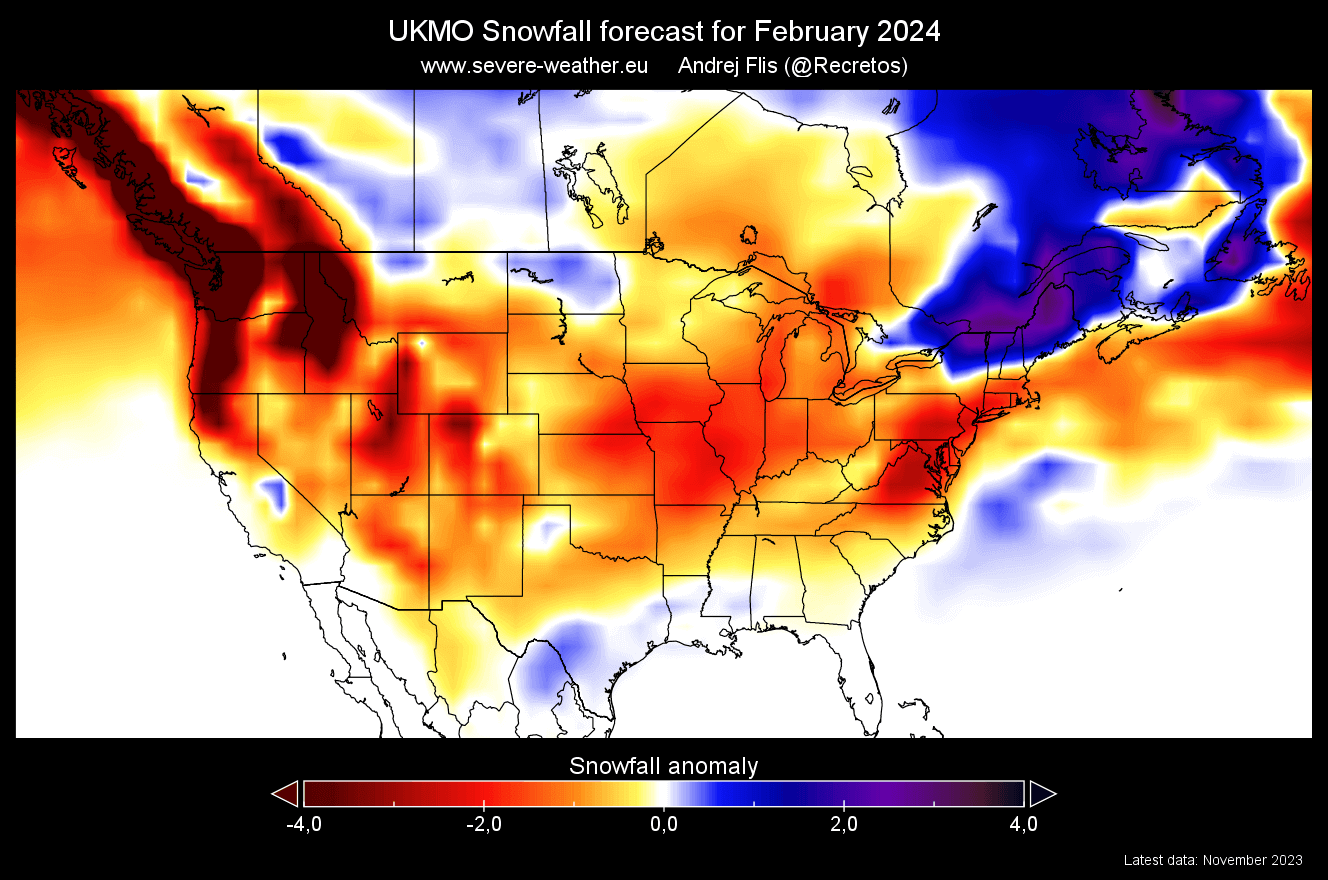
The UKMO February snowfall forecast shows a rather weak February snowfall forecast, which is a bit hard to believe. Especially since the ECMWF shows much more snowfall across the central and eastern United States and we also have the active El Niño event this winter (more on that in a second).
It is normal to have a different forecast between two models as the forecast length increases. Also, last year, the ECMWF performed better in this range than the UKMO model.
Now, we kinda have a good idea about the latest snowfall trends and forecasts. But we can also look at the past winter for an idea of what the next one might look like.
We know that a strong El Niño event is active this year, and this event is known to have a powerful influence on the snowfall patterns across North America. That is why we will look at the latest data on El Niño and how it usually impacts the snowfall pattern across the United States.
We will leave out Europe in this segment, as there is not enough reliable data to link a specific snowfall pattern there to an El Niño event.
OCEANS AND GLOBAL WEATHER
El Niño is a warm ocean temperature anomaly in a region of the equatorial Pacific Ocean. It is just one phase of a larger system (ENSO) that changes periodically between cold and warm ocean temperatures.
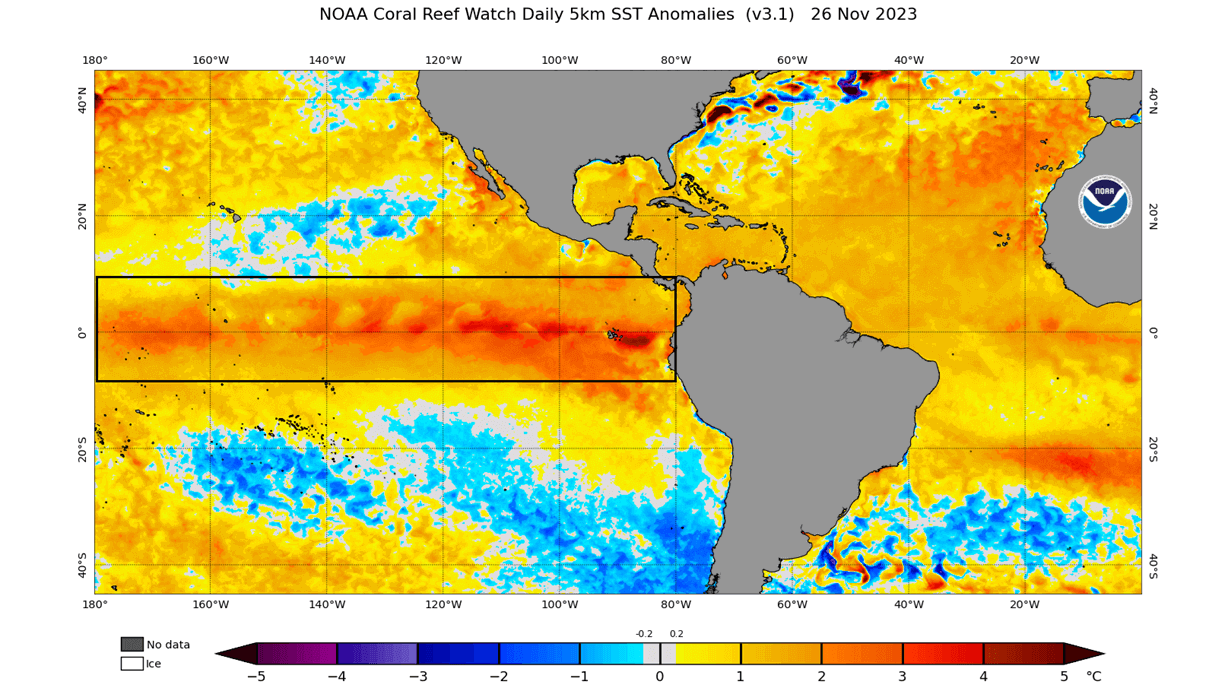
You can see the El Niño in NOAA’s latest ocean anomaly analysis below. It is an area of above-normal ocean temperatures across the equatorial Pacific Ocean. Peak ocean temperature anomalies are currently reaching well over 3 degrees Celsius above normal.
El Niño usually forms during weak trade winds, which can tell us much about the state of global circulation. This way, we can use these ocean temperature anomalies as a warning light on the dashboard of a car.
Below is a special video animation that we produced, and it shows the ocean surface anomalies from late Winter to Summer.
You can see the cold phase of the ENSO quickly breaking down over the winter, with warmer anomalies emerging in early Spring. Notice the motion of the anomalies on the ocean surface, driven by the trade winds.
These warm ocean anomalies were the early stages of the developing El Niño event.
Below, we have an IRI forecast probability image, which shows the long-range outlook of the ENSO anomaly. As forecasted, the El Niño conditions will last during Winter and early Spring. A weakening of El Niño is expected during Spring, with a large unknown as we go into mid-2024.

So, what exactly does this mean for the winter weather patterns and snowfall potential in the 2023/2024 Winter? To answer that, we have to take a closer look at the weather patterns over North America based on real observations.
ENSO does change the weather globally. But apart from the direct influence over North America and other closer regions, places like Europe have many other factors at play before any direct weather influence reaches this far from the Pacific Ocean.
NORTH AMERICA WINTER WEATHER PATTERNS
Typically, the first influence of these ocean anomalies is seen in the changes to the jet stream. The jet stream is like a large river of air at around 8-11km (5-7mi) altitude. It brings along moisture and precipitation, so it has a big effect on snowfall patterns.
The most typical pressure effect of an El Niño is the low-pressure area in the North Pacific. That usually weakens the polar jet stream but strengthens the subtropical jet stream over the southern United States.
The image below from NOAA Climate shows the average position of the jet stream during El Niño winters and the resulting weather patterns over the United States and Canada. You can see the stronger Pacific jet stream across the southern United States.
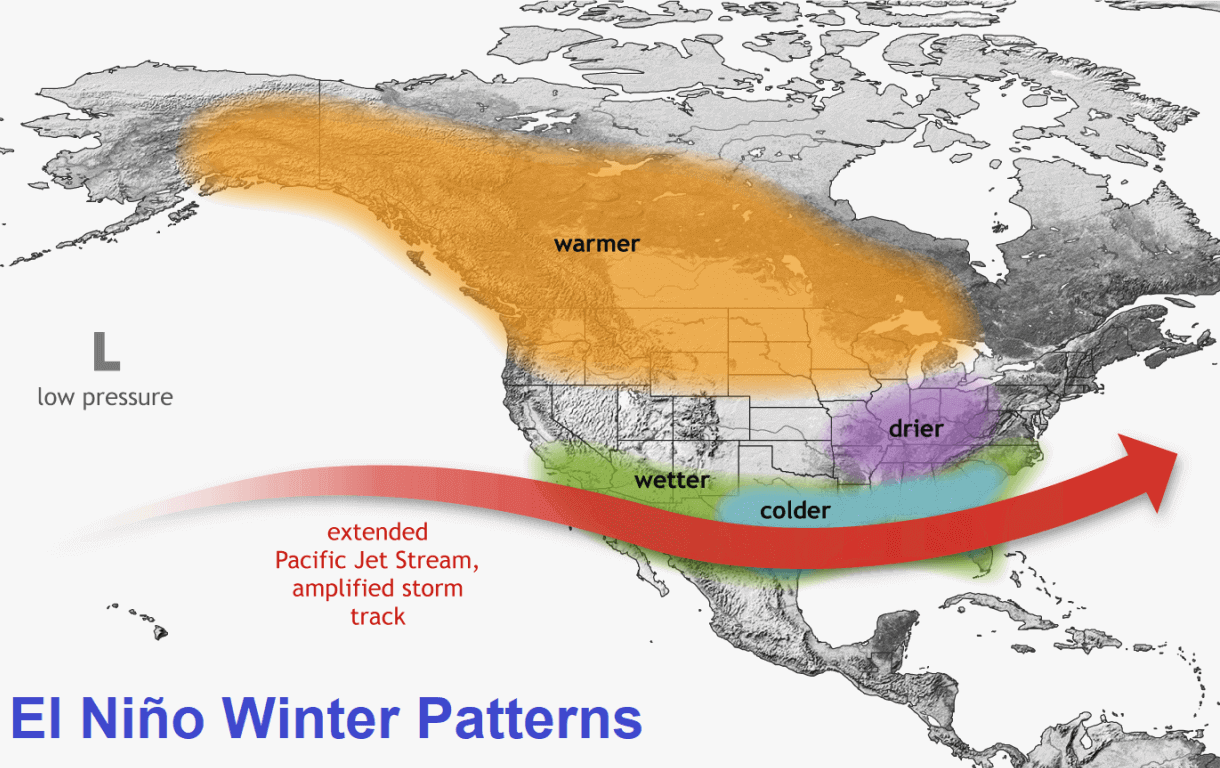
A stronger subtropical jet stream brings along lower pressure, cooler temperatures, and more moisture. That combination increases the snowfall potential across the central and eastern United States, provided enough cold air is available.
That can be seen in the image below by NOAA Climate, showing snowfall during El Niño winters. Some areas with more snowfall during an El Niño include the eastern United States, the southern United States, and the central and upper Plains.
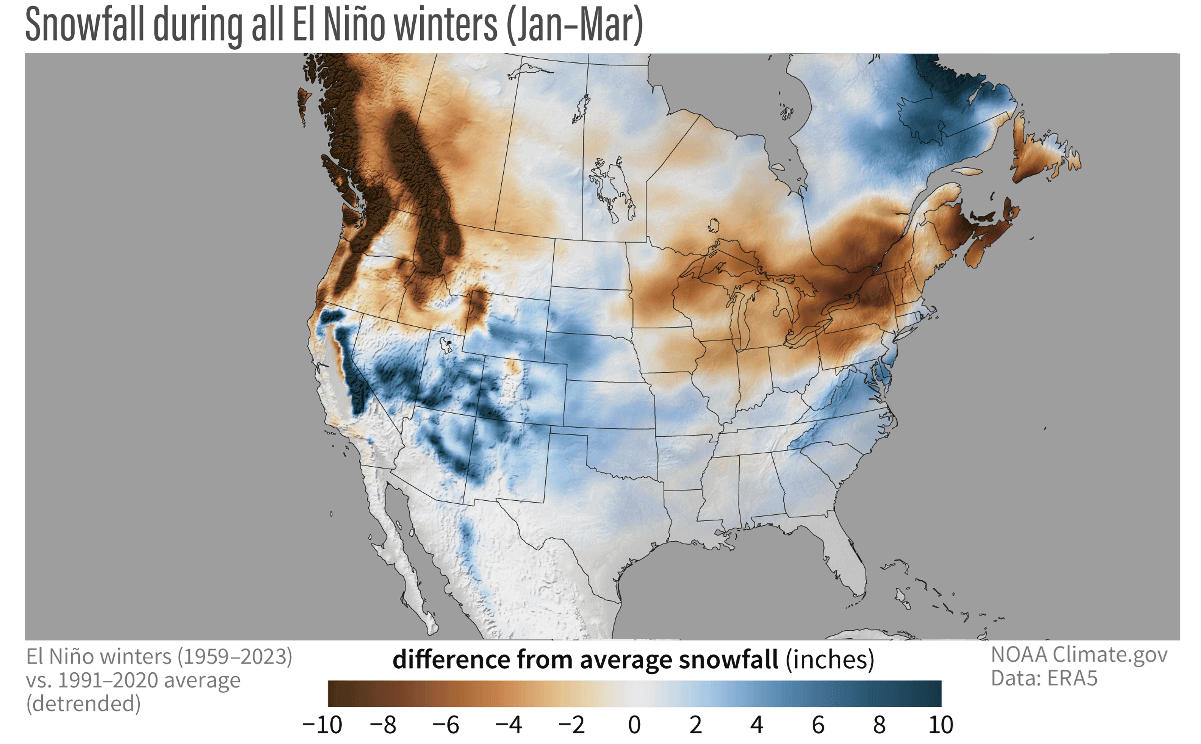
That is mainly due to low-pressure systems trailing across the southern United States. More moisture increases the chances of snowfall in the southern half if colder air is available.
Less snowfall is usually seen across the deep southern United States, Ohio Valley, Midwest, northern Plains, northern Rockies, and Pacific Northwest.
Actual snow amounts are always limited in the southern United States because it needs to be cold enough to snow. For that reason, there is usually much more snowfall during an El Niño in the higher and colder elevations of the southwestern United States.
There is less snowfall around the Great Lakes, interior New England, the northern Rockies, and the Pacific Northwest, extending up into western Canada.
We also have another winter snowfall map, but this one was produced by Rohan Shroff and only shows specific El Nino years in the mix. It shows years with similar oceanic and atmospheric patterns that we have seen this year. This is called “analog forecasting” where we look at past years with similar global configurations and look at their winter outcome.
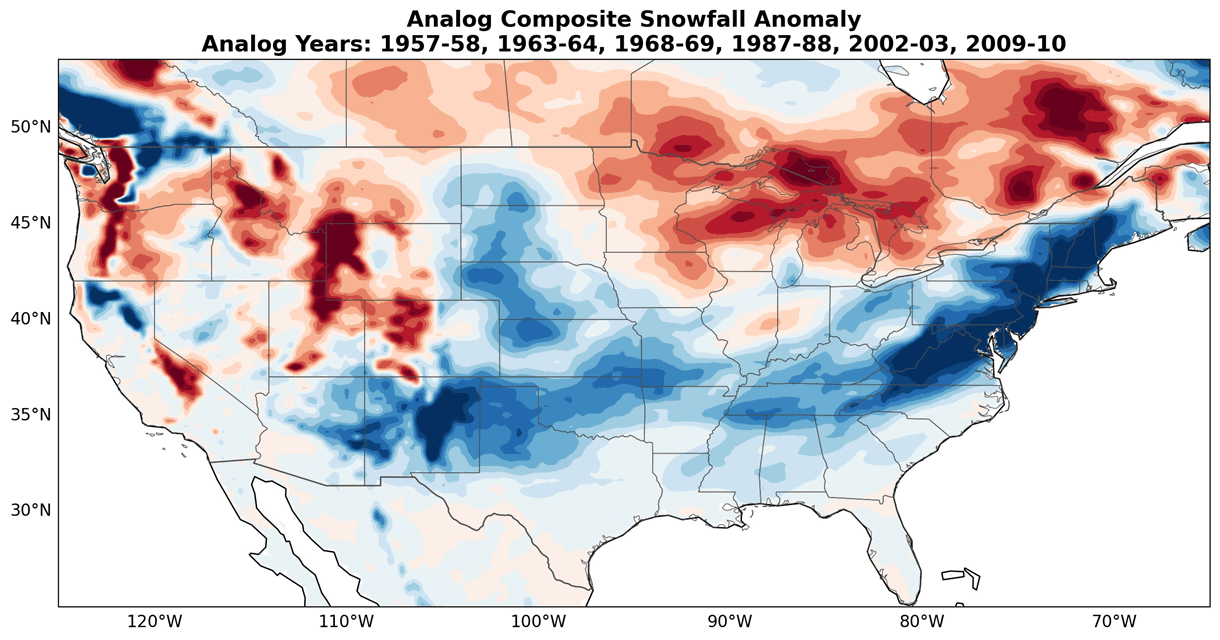
You can see that specific El Niño years, similar to this year, can produce very good snowfall amounts across much of the eastern United States, and especially the northeast. You can also see increased snowfall amounts across much of the south and the Plains.
This is essentially just an analysis of specific past winters. But just as 1+1=2, we can also see in weather how a combination of certain global factors can produce a similar winter season more than once.
Now, you know what to expect for snowfall in a typical El Niño Winter, and you know what the latest snowfall predictions are from top-of-the-class forecasting systems.
We will keep you updated on other developing weather trends, so bookmark our page. Also, if you have seen this article in the Google App (Discover) feed, click the like button (♥) there to see more of our forecasts and our latest articles on weather and nature in general.
Don’t miss: