The La Niña event in the Pacific has now passed its peak strength. But it will still have a lasting impact on the atmosphere and weather patterns over North America, together with a current Stratospheric Warming event. Later in the year, there is a chance for an El Niño event to emerge and impact the Winter season.
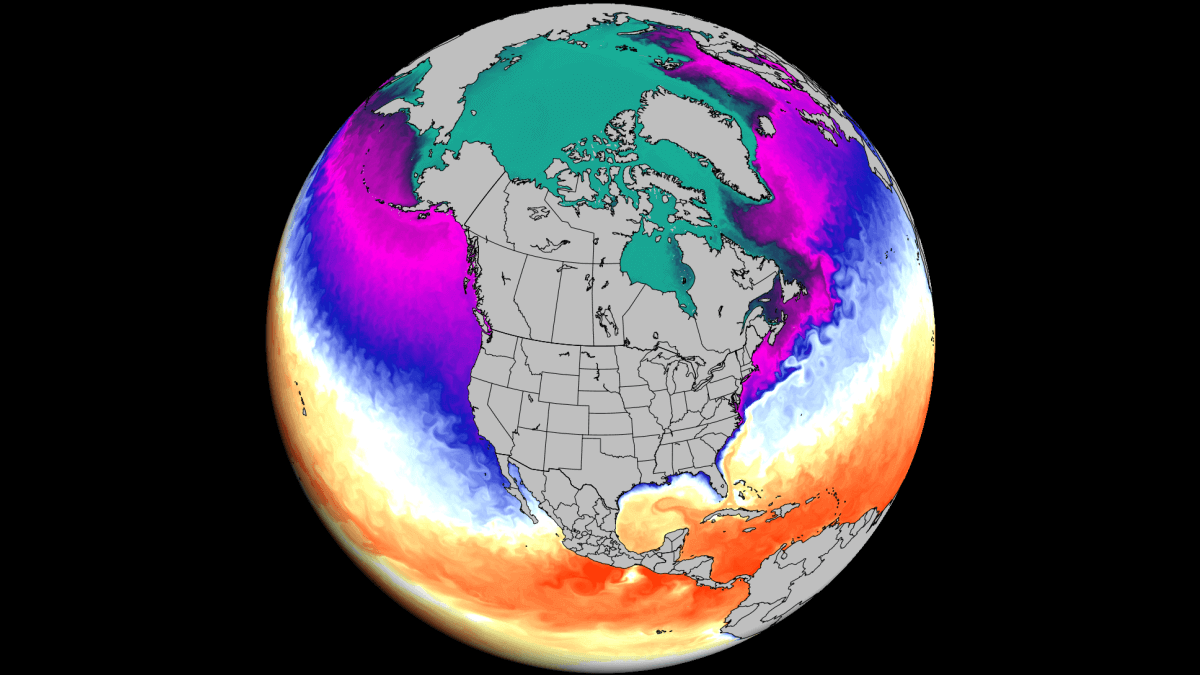
The global climate is very sensitive to large-scale ocean changes, especially the temperature and wind patterns. For this reason, we closely monitor these anomalies, as they can significantly influence seasonal weather patterns.
We will look at the latest changes across the Pacific and how the La Niña will work with a stratospheric warming event to produce the weather patterns over North America. Then, we will look at the latest long-range predictions and what would an El Niño event mean for the 2025/2026 weather seasons.
ENSO FROM WINTER TO SPRING
The El Niño and La Niña we mentioned are just opposite faces of the ENSO, which stands for “El Niño Southern Oscillation.” This is a region of the Pacific Ocean that periodically shifts between warm and cold phases. Typically, there is a phase change around every 1-3 years.
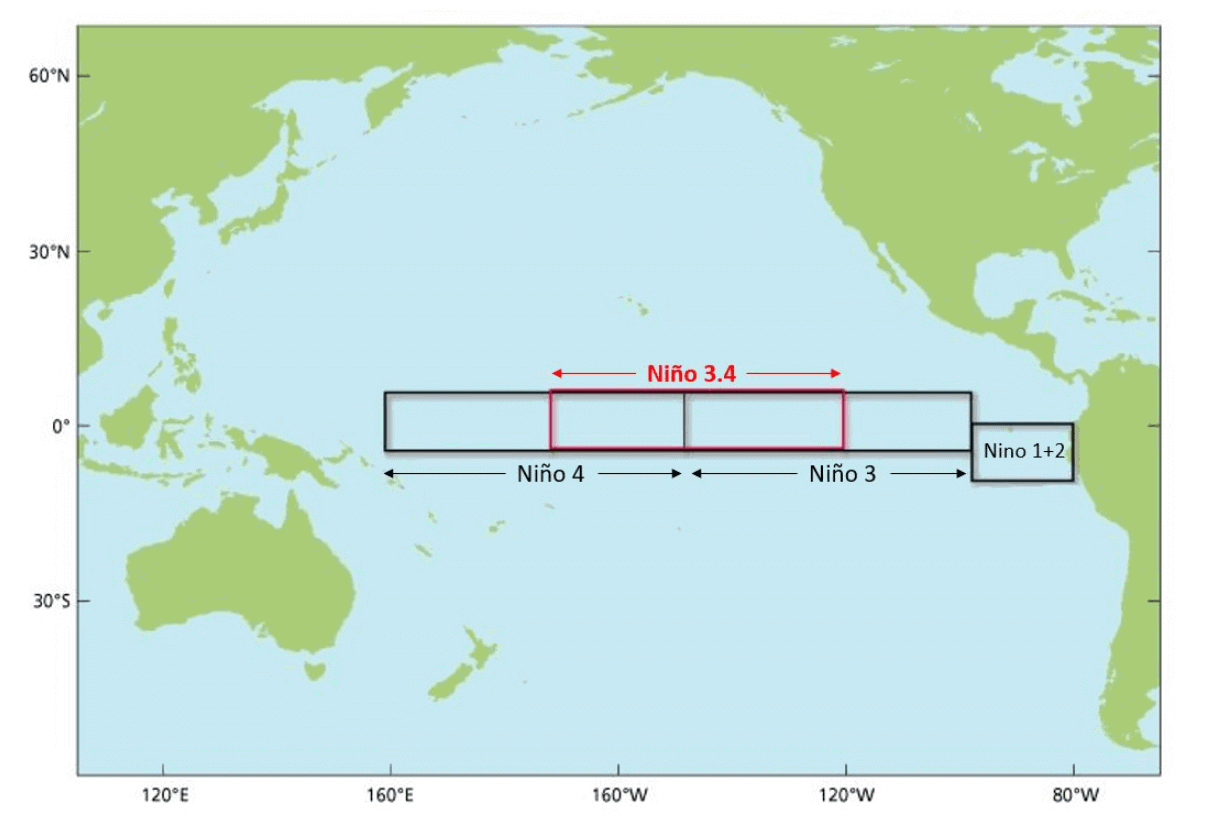
The image below shows the ENSO regions across the tropical Pacific. Regions 3 and 4 cover the eastern and western tropical Pacific. The main area covers the central parts, seen in the image as the Niño 3.4 region.
Each ENSO phase influences the pressure and weather in the tropics differently. This affects the overall global circulation over time, changing weather patterns across the world.
Each phase (cold/warm) usually develops between late summer and early Fall and typically lasts until Spring. But some events can last up to two or three years, as seen just a few years ago.
The cold ENSO phase is called La Niña, and the warm phase is El Niño. Besides the temperatures, one of the main differences between the phases is the pressure patterns they develop, seen below as high (H) and low (L) pressure zones.
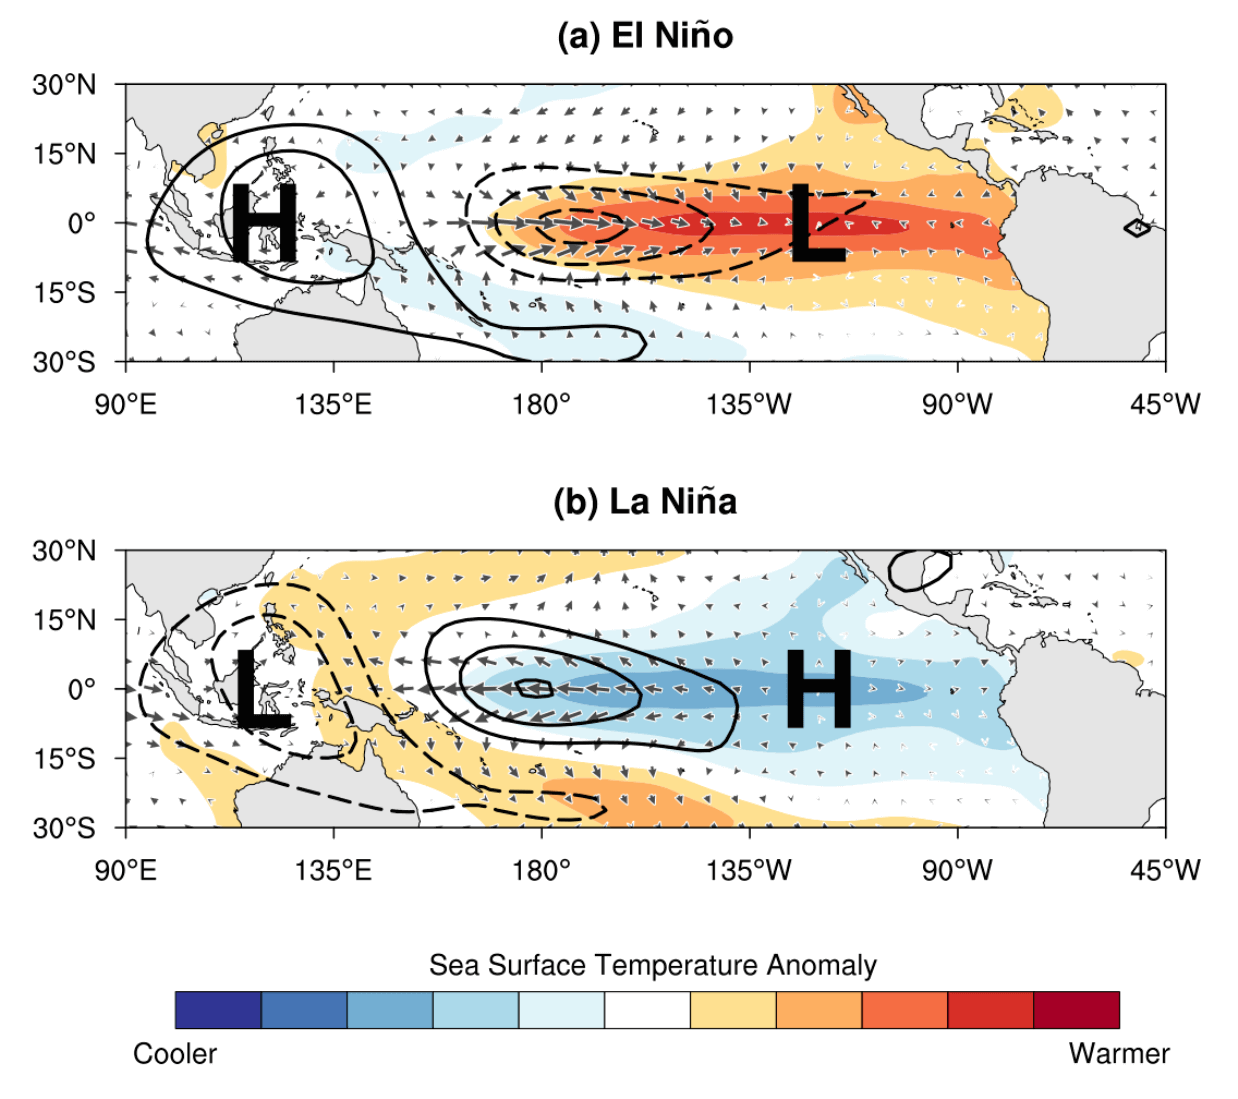
During an El Niño, the pressure over the tropical Pacific is lower, with more rainfall and storms in this region.
But during a La Niña, the pressure over the equatorial Pacific rises, creating stable conditions and fewer storms. These pressure changes translate into global circulation over time, affecting seasonal weather over both Hemispheres.
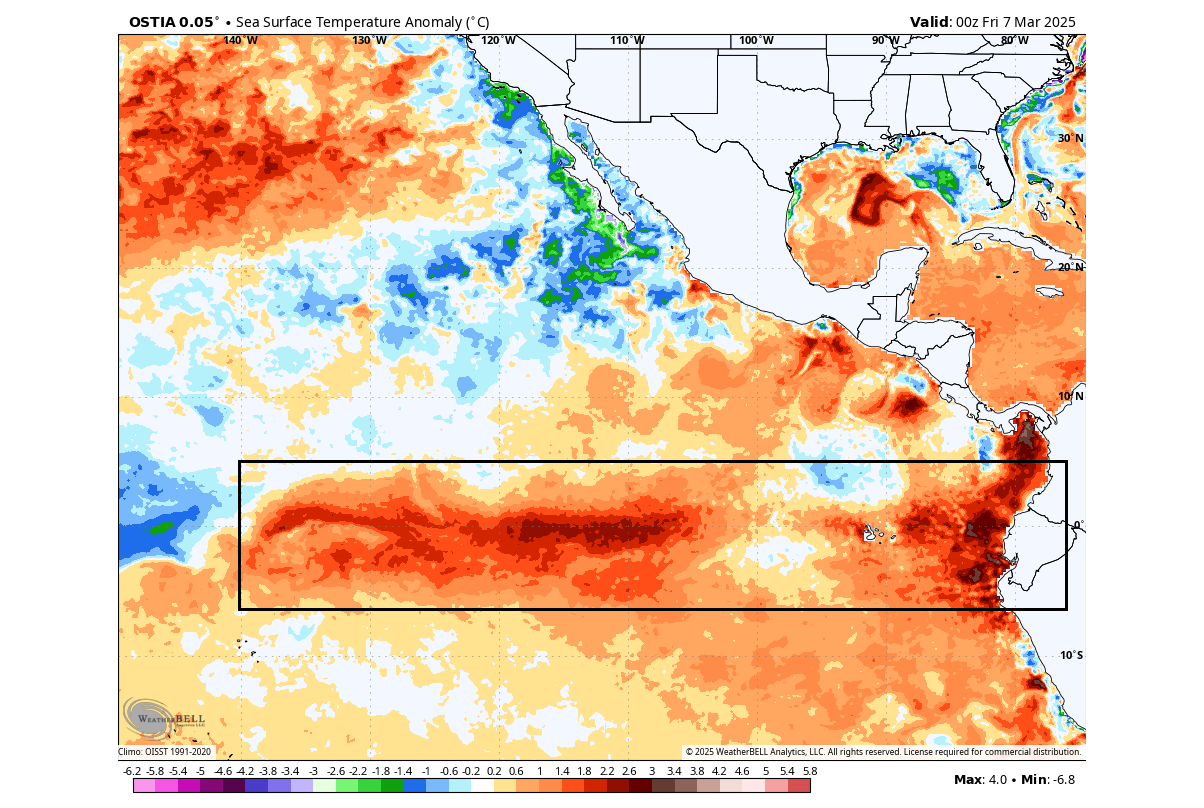
Below is the latest ocean analysis with the main ENSO regions marked in the image. You can see that colder-than-normal waters are present across the central Pacific region, a signature of the La Niña. But towards the eastern region, an unusual warm anomaly has recently emerged.
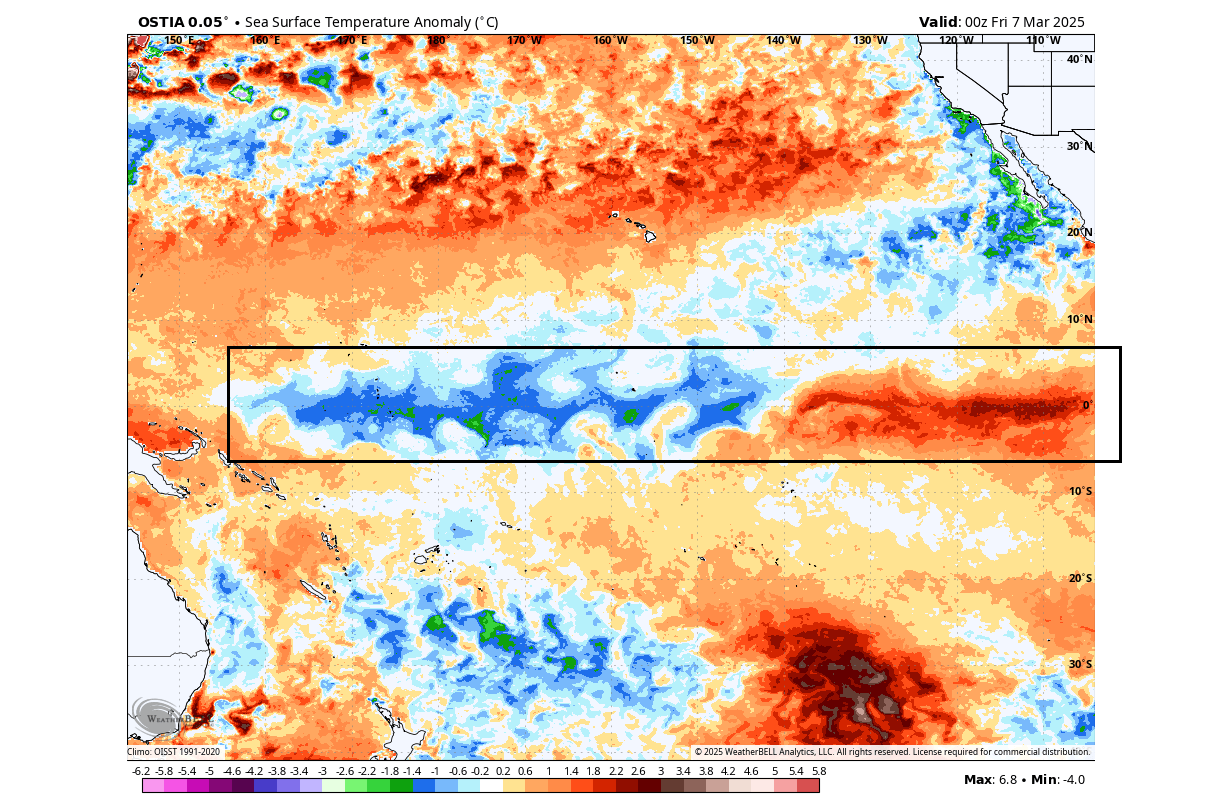
A stronger cooling phase has been ongoing since early December. That has produced the still visible cold “wave” shapes, which are from the trade winds pushing the surface waters.
But as mentioned, there are warm anomalies growing in the eastern ENSO region, driven by a westerly wind anomaly. This has started the downfall of La Niña, but it still has a healthy cold area in the central parts, as seen in the previous image.
Looking closer at the anomalies in the past month, we produced a video from the official weekly ocean analysis. As you can see, it shows the rapid spread of a warm anomaly in the eastern regions, pushing the cold out and into the central parts. Video was produced with images from cyclonicwx.com
But these anomalies involve more than just ocean surface temperatures. In the big picture, there are also wind patterns and subsurface anomalies at play.
A LARGE-SCALE ENSO CHANGE
The graph below shows the ocean temperature anomaly for the main ENSO 3.4 region since mid-December. You can see it has reached its lowest value after starting to cool down in early December, going below the -0.5 La Niña threshold. But since late February, you can see the impact of the emerging warm anomaly in the east.

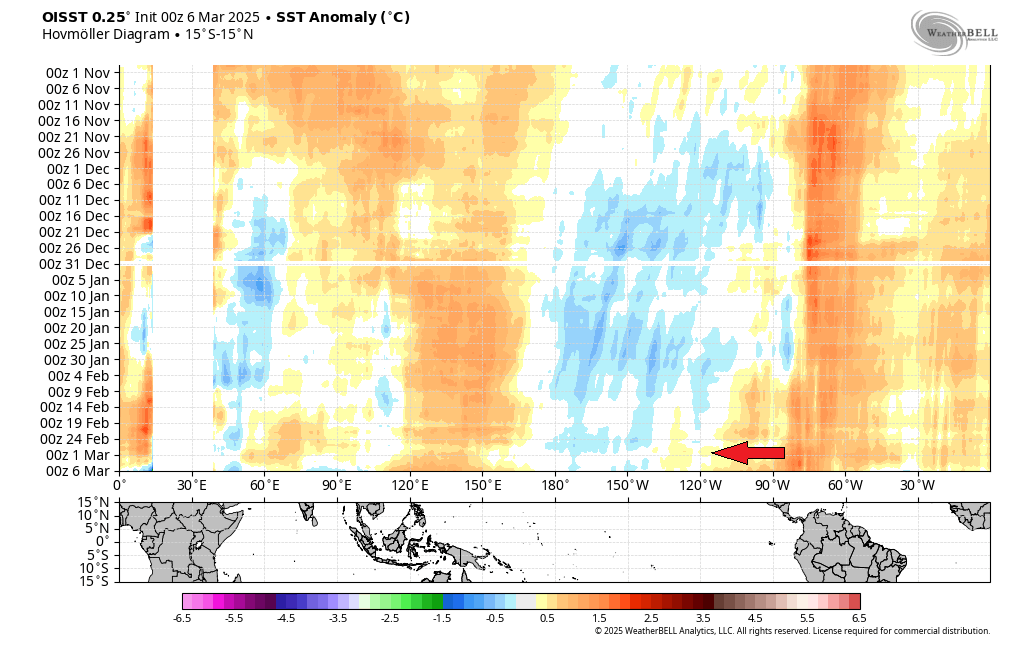
Looking at the wider region below, the graphic shows the ocean surface anomalies over time. Here, you can even better see the widespread cooling across the central Pacific area from November to February. But starting around two weeks ago, you can see the cold anomaly getting eroded from the east.
The easterly trade winds were an important driving force behind this ocean cooling. The image below shows the wind anomaly in the lower atmosphere. Blue anomalies are easterly trade winds that promote ocean cooling, but the yellow and red colors indicate a westerly anomaly that promotes ocean surface warming.
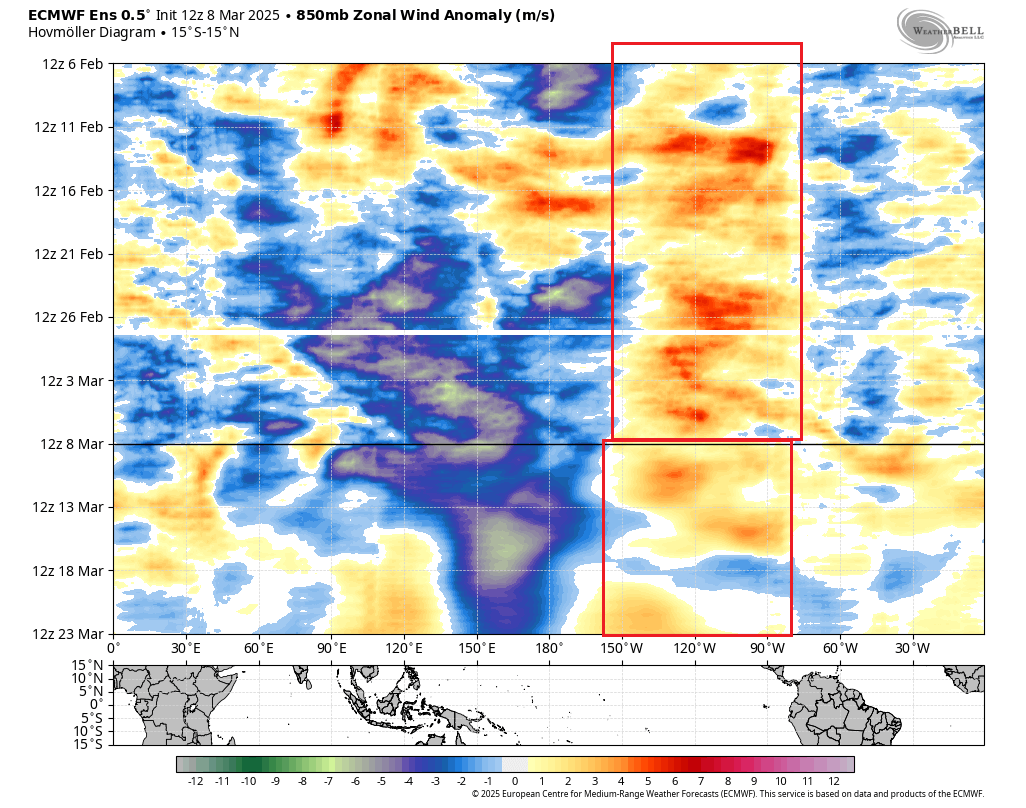
This way, we can see that a sustained westerly wind burst occurred in the eastern ENSO region, which helped to create the warm ocean anomaly. And you can also see in the forecast part that it will continue for at least two weeks.
The activity below the ocean surface is also very important. The next image shows the subsurface ocean anomaly by depth. You can see the cold pool of the currently active La Niña is still focused in the central Pacific basin down to around 150m (500ft) depth. But a warm anomaly is seen below the ocean to the west and deeper down, and at the surface levels to the east.
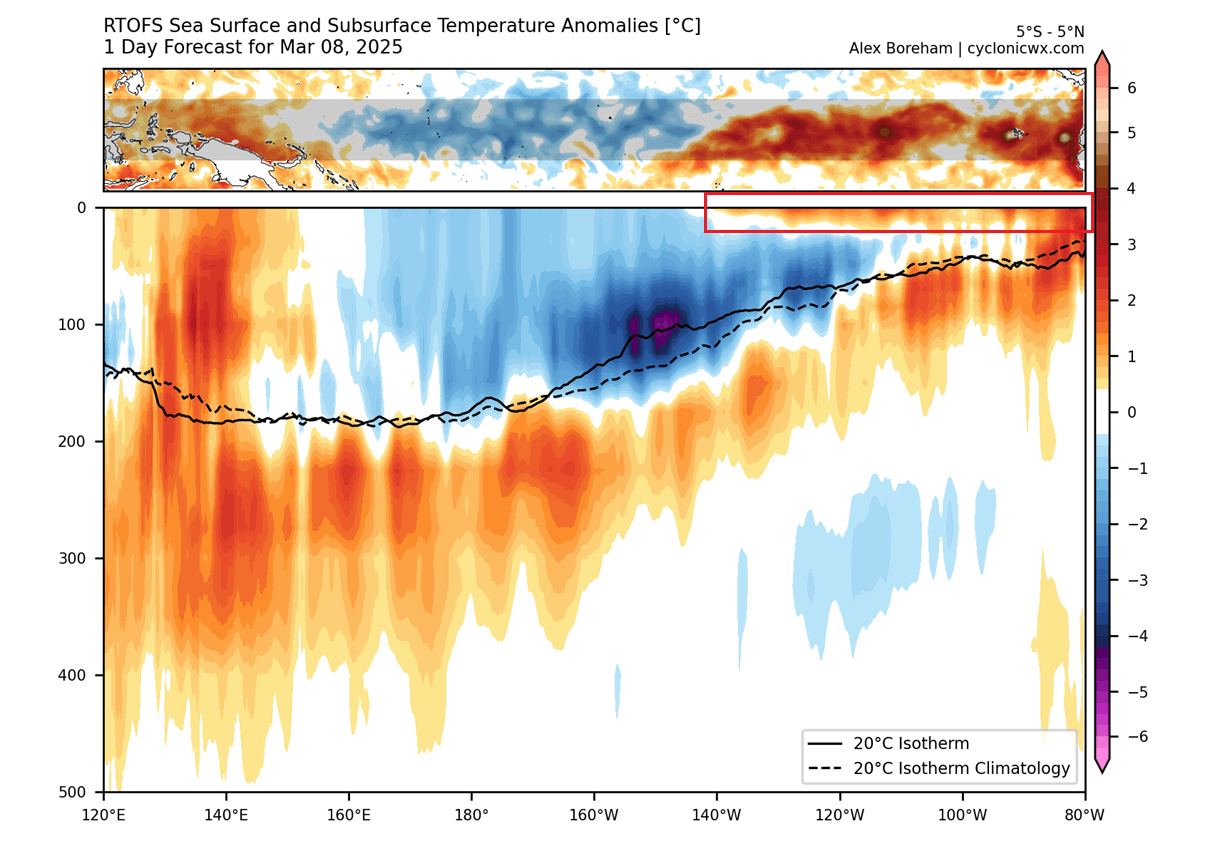
This shows that the surface warm anomalies in the eastern ENSO region are not really deep. They seem to be driven more by the current westerly wind anomaly than a real phase change from the depth.
But why are these anomalies even important? As you will see, a La Niña phase can still have an influence when going into Spring, and not just in winter, especially if the Polar Vortex joins the show.
A GRIP ON THE ATMOSPHERE
As mentioned, La Niña has a well-known atmospheric impact during the Winter and Spring seasons. Below is a typical Spring pressure anomaly pattern during or after a La Niña phase. You can see the high-pressure anomaly in the North Pacific, but more importantly, a low-pressure area over Canada and the northern United States.

A high-pressure area in the North Pacific allows a low-pressure area to expand over Canada and into the northern and central United States. This typically supports a more northerly flow, transporting colder/cooler air into the northern United States or parts of the Midwest and the northeast in Spring.
The image below shows an average La Niña temperature anomaly for the Spring season. It is produced from several decades of data, so it is just an average of many seasons. But you can still see that a La Niña event supports below-normal temperatures over Canada and the northern half of the United States and above-normal temperatures in the south.

We can’t say that this ocean cooling alone is the main reason for all the weather patterns in the United States and Canada. Other factors are also at play, and one is just now unfolding far above in the atmosphere. It is called the Sudden Stratospheric Warming event, and we will link our special article on that event below, with more in-depth information.
Below is the forecast for the mid-stratosphere (31km/18.5miles) around 8 days from now. It shows the stratospheric high-pressure system taking over the polar regions and splitting apart the Polar Vortex. This is the stratospheric warming even at its peak, with the warming wave completely taking over the mid-stratosphere.

Below is the vertical pressure anomaly image. You can see a high-pressure anomaly in the forecast part of the graphic. It shows the high-pressure anomaly developing in the stratosphere, and it is starting to make its way down as we go into mid-March. It is also starting to show some connection forming to the surface.
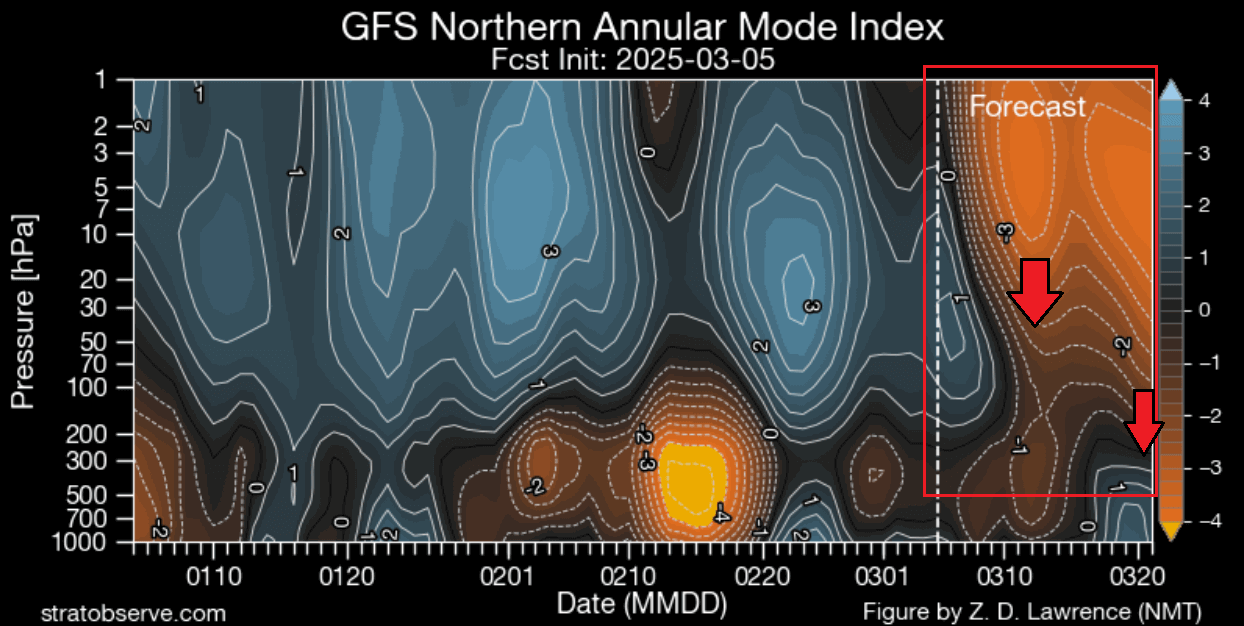
Any pressure or temperature anomalies take some time to reach the lower levels. For that reason, we tend to estimate the potential weather impacts in the 0-30 day period after an SSW. We usually see those effects manifest as high-pressure anomalies at (or around) the polar circle.
Below is the latest 30-day pressure forecast from mid-March to mid-April. You can see a high-pressure area in the Pacific, courtesy of the La Niña. But you can also see high-pressure blocking over Greenland and the polar regions from the Stratospheric warming.

That combination helps to create and stabilize a low-pressure anomaly over Canada and the United States. In early spring, this usually creates cooler conditions across the United States and can even bring some snowfall events to the northern parts of the United States.
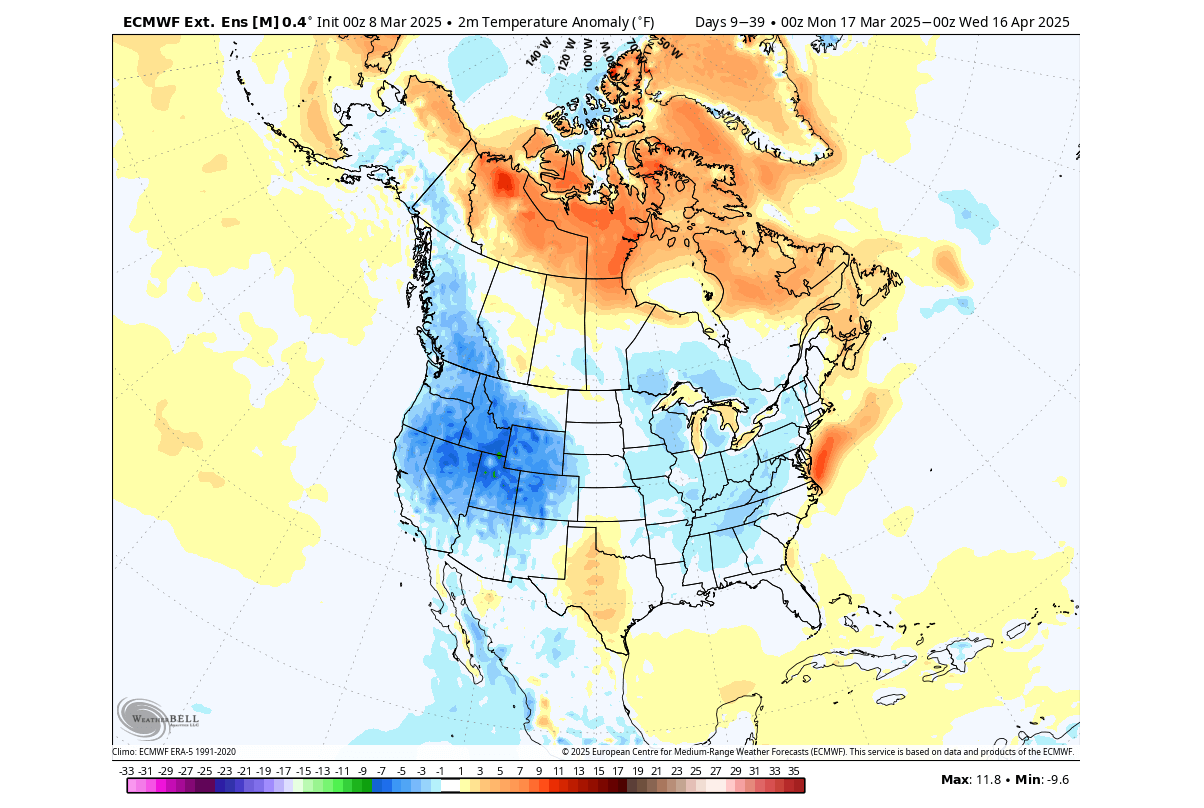
You can see this in the temperature forecast below, which shows the temperature anomaly for the same period. Colder than normal temperatures are forecast for the western United States, while the pressure changes from the La Niña and the stratospheric warming will bring some cooling to the eastern United States also.
But while the current season is in the grip of La Niña, some long-range forecasts are starting to show the first signs that an El Niño event could emerge in the 2025/2026 season.
EL NINO EMERGING FOR 2025/2026?
The first hint of a possible El Niño is already visible in the latest ECMWF ocean forecast for Summer, seen below. It shows a warm area spreading in the eastern tropical Pacific, with the cold anomalies disappearing. While this is not an official El Niño, you would expect these anomalies to appear in the long-range projections in early summer for one to develop later in the year.

The long-range ensemble forecast below shows the forecast for the main ENSO region. The La Niña conditions (below -0.5) will disappear during spring. But the extended range shows a lot of ensemble members moving into the warm anomalies and also above the 0.5 threshold of the El Niño event.

Below is also an extended analog forecast by the Physical Science Laboratory for the main ENSO region. It shows the cold phase that was active over Winter. But a weakening of the cold phase is forecast, with El Niño event chances increasing by late 2025 and increasing even higher in 2026.

But what would an El Niño event mean for the weather patterns, especially in Winter?
EL NINO’S IMPACT ON WINTER IN NORTH AMERICA
The main weather influence of these ocean anomalies can be seen in the changes to the jet stream. The jet stream is like a large river of air at around 8-11km (5-7mi) altitude. It brings along moisture and precipitation, so it has an important effect on temperature and snowfall patterns during the Winter season.
The most typical pressure effect of an El Niño is the low-pressure area in the North Pacific. That usually extends and strengthens the subtropical jet stream over the southern United States.
The image below from NOAA Climate shows the average position of the jet stream during El Niño winters and the resulting weather patterns over the United States and Canada. You can see the stronger Pacific jet stream across the southern United States.
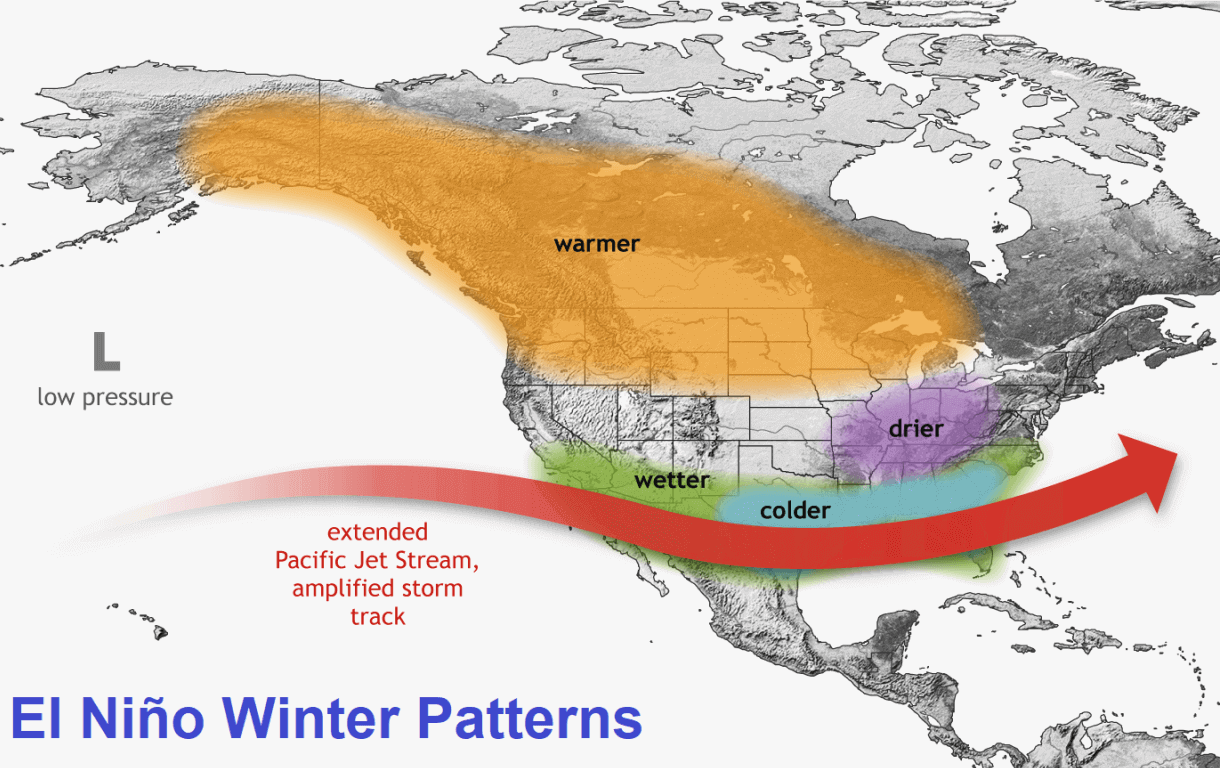
A stronger subtropical jet stream brings lower pressure, cooler temperatures, and more moisture to the southern United States. If enough cold air is available, that combination increases the snowfall potential across the central and eastern United States in an El Niño winter.
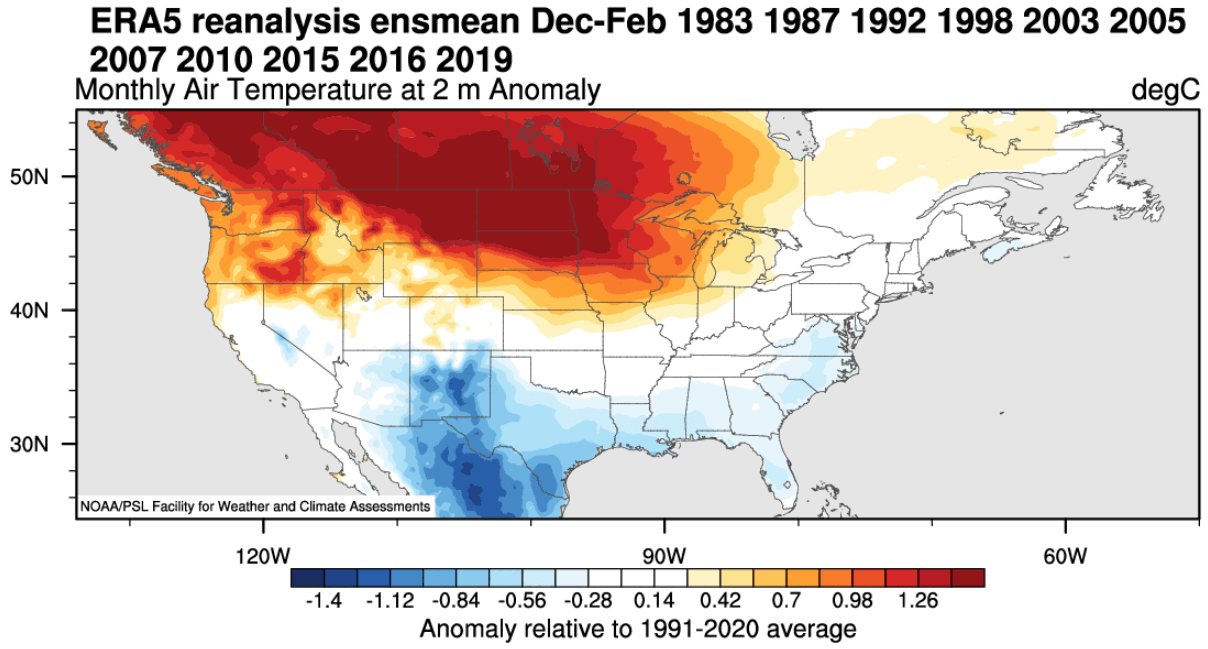
Below are temperature anomalies for the past El Niño winters. You can see that El Niño winters are usually colder in the southern half of the United States and parts of the eastern United States. The northern half of the country is warmer than usual, with above-normal temperatures also covering southern Canada.
Temperatures have a major role in snowfall potential. The image below shows snowfall anomalies during El Niño winters. Some areas with more snowfall during an El Niño include the eastern United States, the southern United States, and the central and upper Plains.
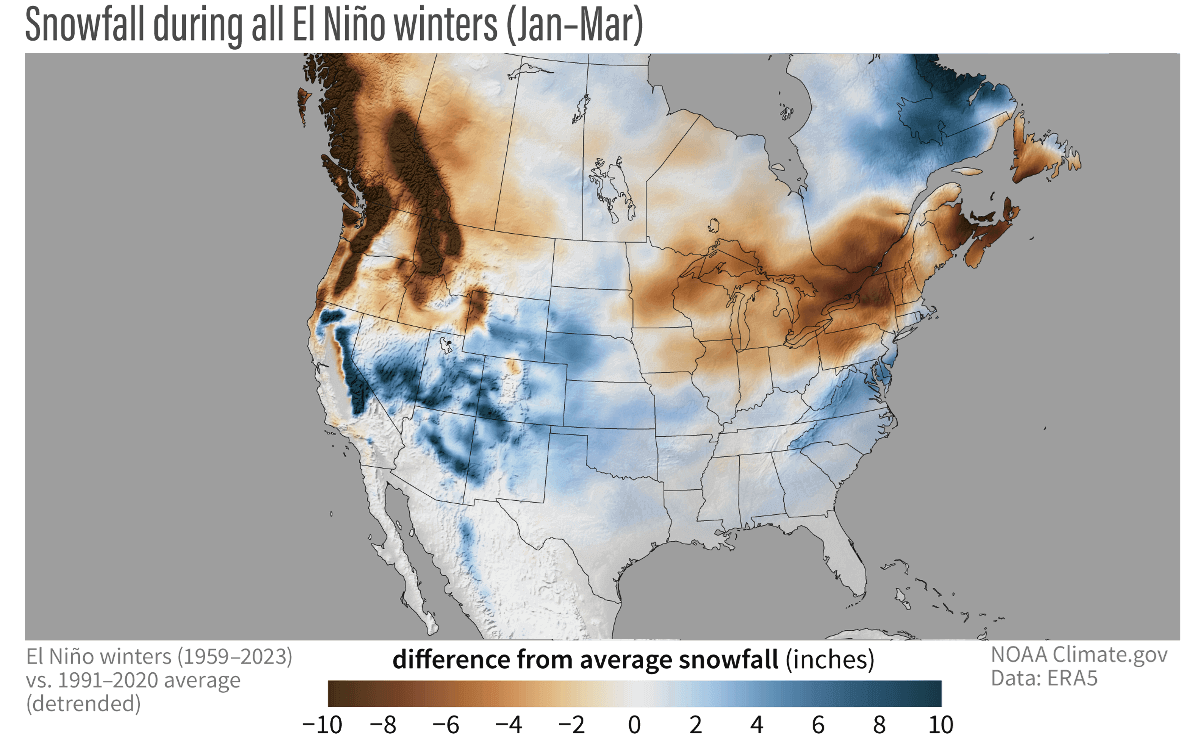
That is mainly due to low-pressure systems trailing across the southern United States. More moisture increases the chances of snowfall in the southern half if colder air is available.
Less snowfall is usually seen across the deep southern United States, Ohio Valley, Midwest, northern Plains, northern Rockies, and Pacific Northwest.
Actual snow amounts are always limited in the southern United States because it needs to be cold enough to snow. For that reason, there is usually much more snowfall during an El Niño in the higher and colder elevations of the southwestern United States.
There is usually less snowfall around the Great Lakes, interior New England, the northern Rockies, and the Pacific Northwest, extending into western Canada.
This is essentially just an analysis of specific past winters. But just like 1+1 equals 2, we can also see in the weather how a combination of certain global factors can produce a similar winter season more than once.
We will keep you updated on other developing weather trends, so bookmark our page. Also, if you have seen this article in the Google App (Discover) feed, click the like button (♥) there to see more of our forecasts and our latest articles on weather and nature in general.