The upcoming 2026 Atlantic hurricane season is expected to be heavily influenced by a rapid transition in the tropical Pacific. Latest ocean data confirms that a strong El Niño event is developing, which has a known significant impact on tropical storm activity across the Atlantic Basin and on U.S. landfalls.
During a typical El Niño event, an atmospheric bridge forms, changing the vertical wind shear and atmospheric motion across the Main Development Region in the Atlantic. These conditions strongly impact tropical cyclone development, leading to significant changes in the number of storms and coastal landfalls in the United States and Canada.
In this article, we will analyze historical data to see exactly how El Niño events affect tropical activity. Then we will focus on the latest 2026 hurricane season forecasts from the ECMWF and NOAA to evaluate how the 2026 Super El Niño will impact tropical development and United States landfalls.
The Atmospheric Bridge: How ENSO Alters Global Circulation
There is now no doubt that a warm ENSO phase will be a major global weather driver in 2026/2027. This area of the Pacific Ocean alternates between warm and cold phases every few years.
ENSO phases usually cause a global disturbance to the weather system. But we can also understand them as an “indicator light” on a car’s dashboard, signaling major changes in the global weather system.
In the image below, you can see a direct comparison between ocean temperature anomalies for each of the two ENSO phases, the warm El Niño and the cold La Niña. Both phases show real data from their 10 strongest events, revealing a clear ocean signature for each phase and the gigantic scale of these anomalies.
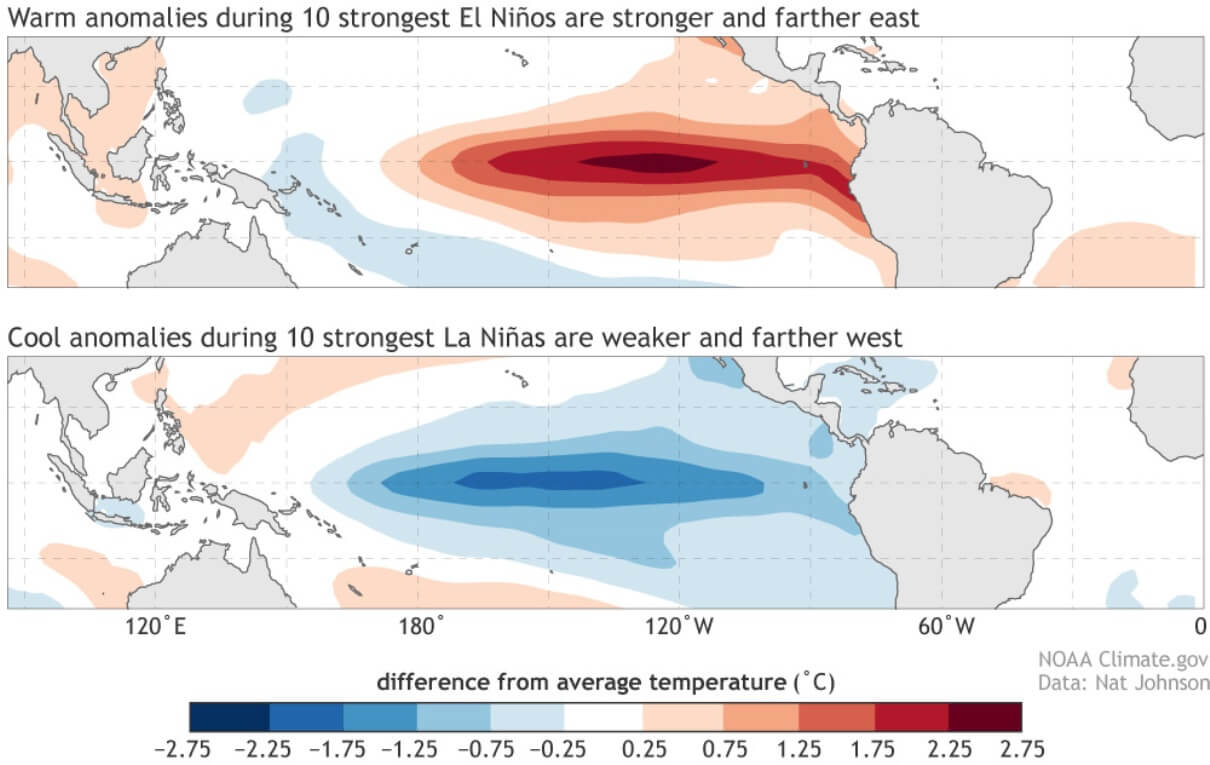
Besides ocean temperature, each phase also brings different pressure and rainfall impacts on the tropics, which, down the line, result in a very different impact on the global weather circulation.
We are now entering a strong El Niño cycle, so we can look at the usual changes it makes to the atmospheric circulation. The upward and downward atmospheric motion in the tropical regions is called a Walker Cell, and is especially sensitive to strong ENSO events. The schematic below shows the change in atmospheric motion during a moderate and strong El Niño event, impacting the global weather system.
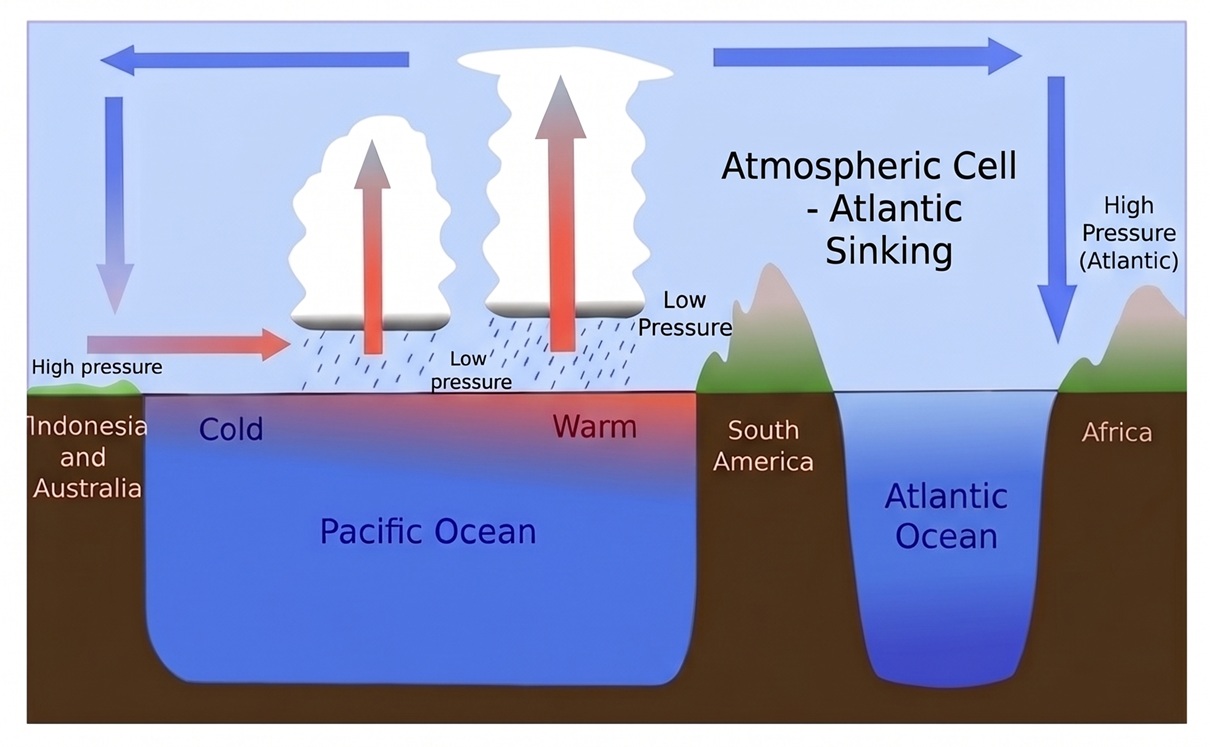
Generally, an El Niño causes a pressure drop in the central and eastern tropical Pacific and a high-pressure zone over the western Pacific. On the other side of the El Niño, we can also detect sinking air over the tropical Atlantic, suppressing clouds and storms during the hurricane season.
The official hurricane season for the Atlantic basin runs from June 1 to November 30. The peak of the Atlantic hurricane season is September 10, with most activity occurring between August and October.
When it comes to the Atlantic hurricane season analysis and forecasting, we tend to focus on a specific area, called the Main Development Region (MDR). This is a large area of the tropical North Atlantic Ocean where the most powerful tropical cyclones and hurricanes form. It generally spans from the west coast of Africa to the Caribbean Sea, bounded by the 10 to 20 degrees north latitude, as seen on the schematic below.
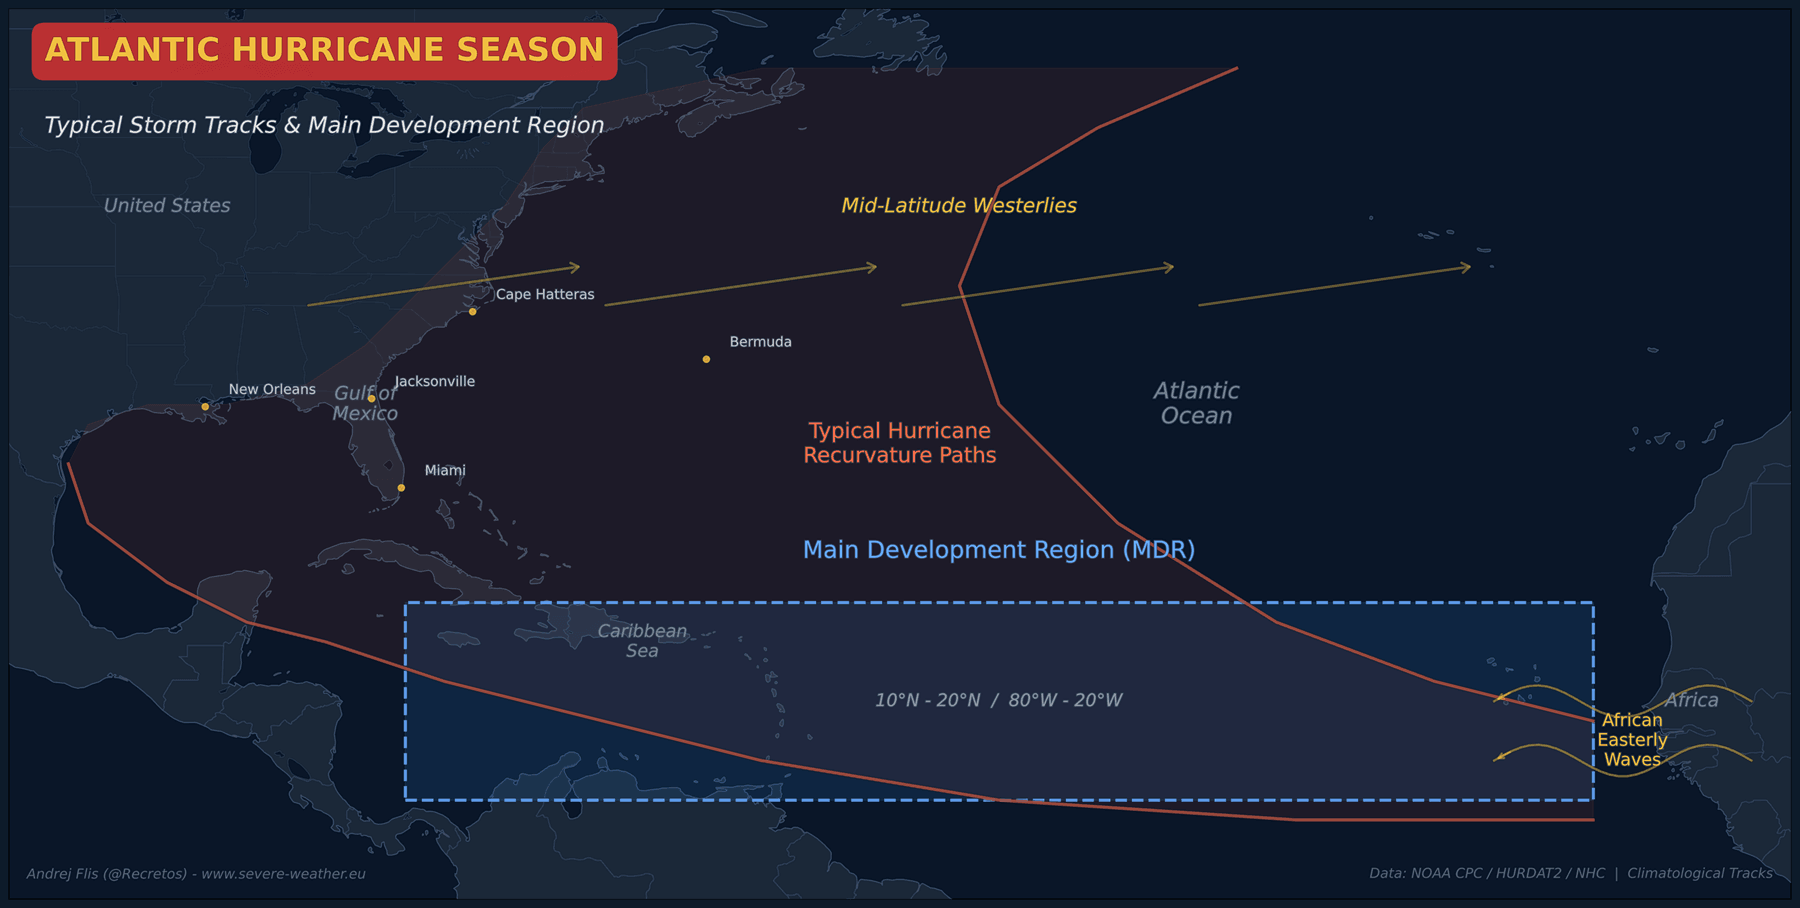
You can also see the area where most tropical systems tend to form and move, recurving out into the Atlantic, while some reach the United States, Caribbean, and can even reach Canada as strong extratropical storms.
Why is the MDR Important:
Storm Breeding Ground: Almost 80% of all major hurricanes and the vast majority of long-track storms begin developing in this zone. So any atmospheric changes in this region can have a strong impact on hurricane development.
African Easterly Waves: Most storms in the MDR originate as atmospheric disturbances that emerge off the coast of West Africa. As they progress westward across the deep tropical Atlantic, they can develop into tropical depressions or major hurricanes, if the atmosphere allows it.
Tropical Storm Ingredients: The MDR is favored for storm development because it provides the exact conditions needed for strong tropical storm development: warm sea surface temperatures (must exceed 26°C/79°F), weak atmospheric wind shear, and abundant mid-level moisture.
But during a strong ENSO phase, these atmospheric ingredients and conditions can change substantially, for better or worse. And this year, we are now starting a massive real-time atmospheric experiment, with a strong El Niño on the way.
Oceanic Analysis: Tracking the Rapid 2026 El Niño Rise
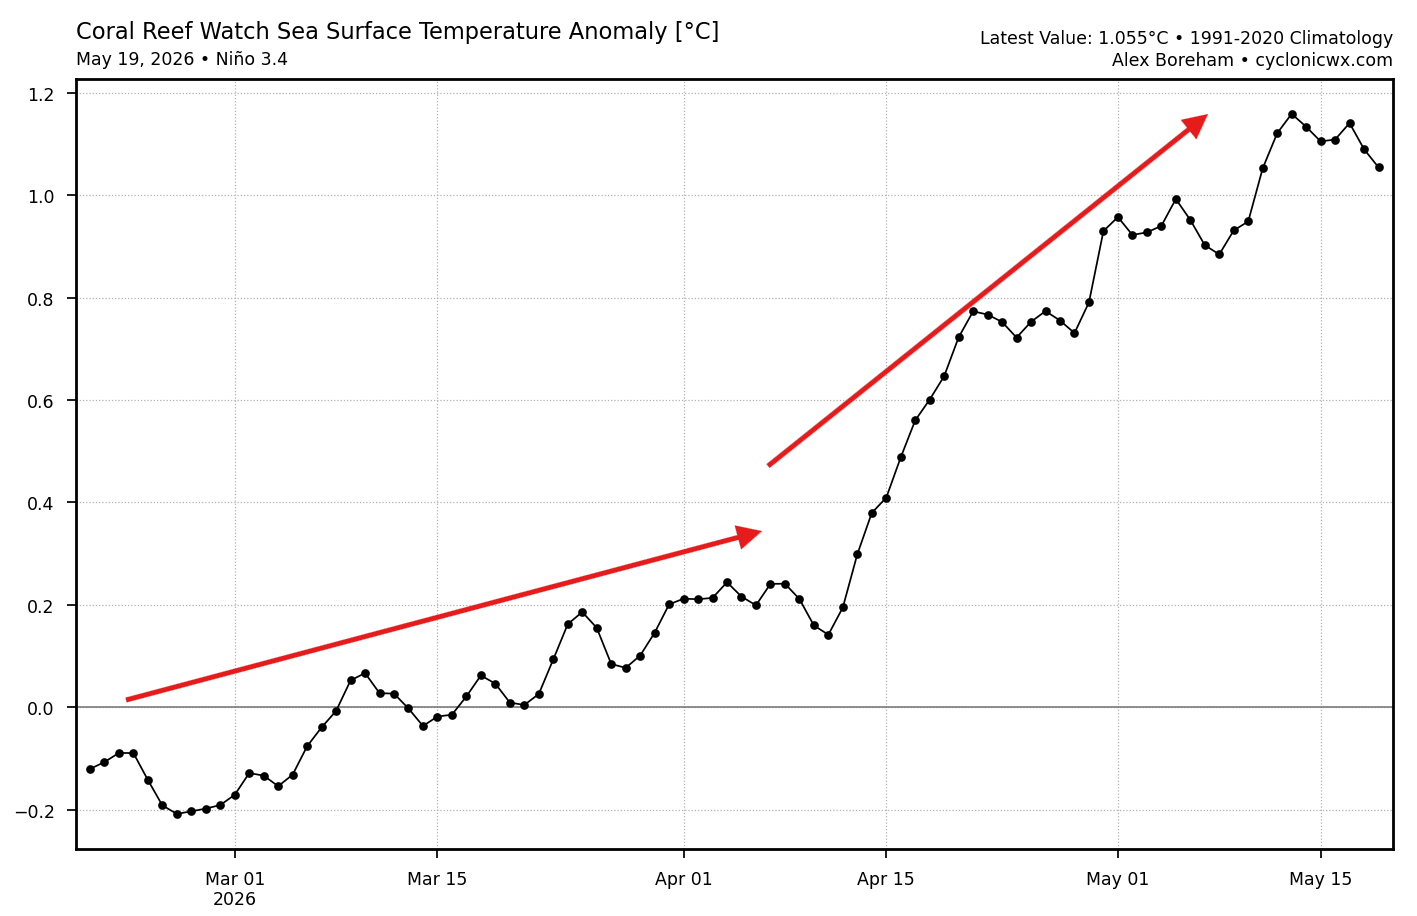
The analysis graphs below show the anomaly data for the past 3 months in the main ENSO region. You can see rapidly rising ocean anomalies since January, with a faster increase in recent weeks. The official threshold for an El Niño event is +0.5, sustained over a seasonal period, so we are already well within the El Niño event start window.
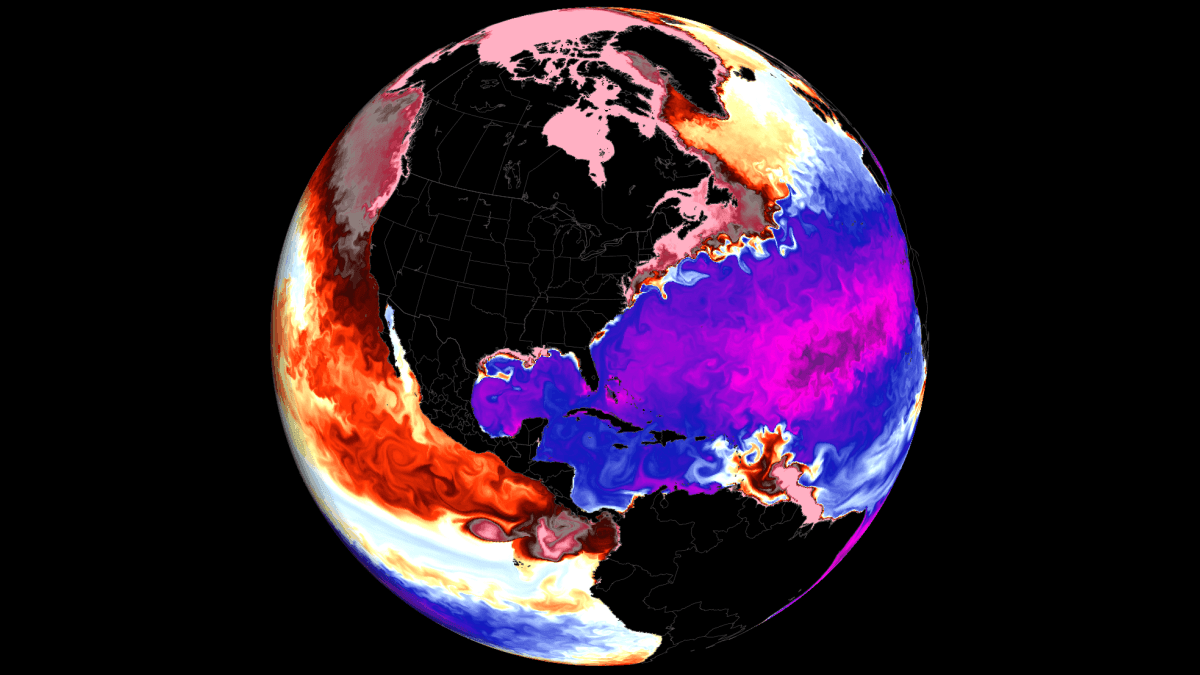
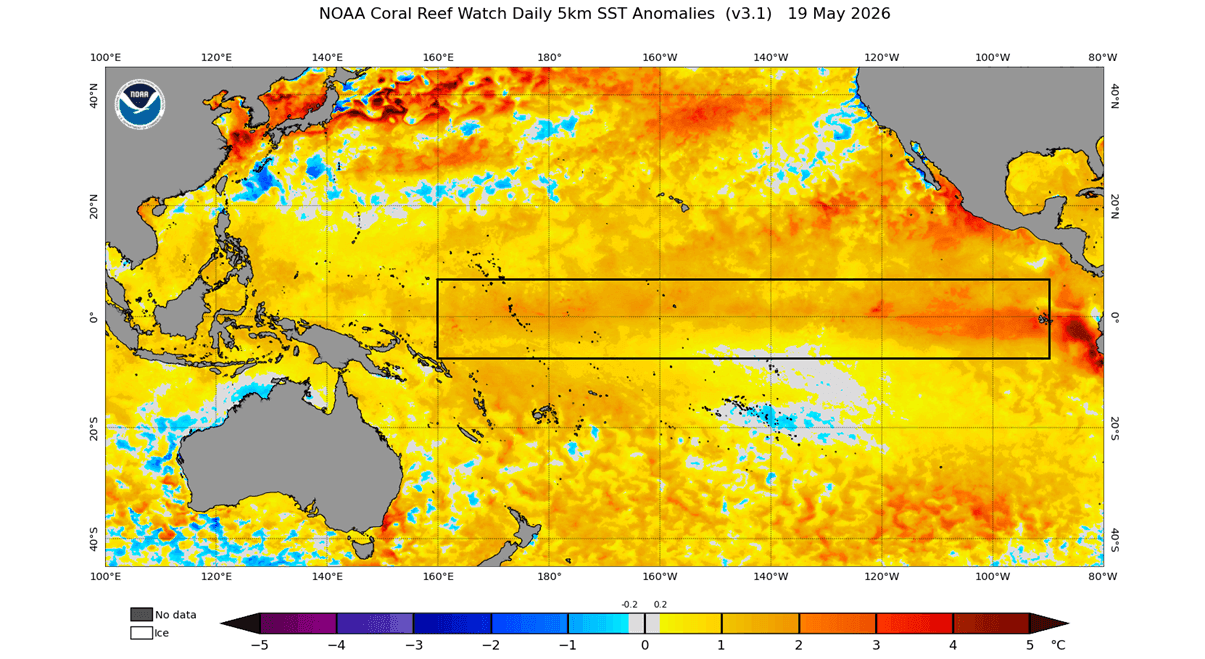
The latest ocean analysis below shows the main ENSO region with emerging warm anomalies. The strongest anomalies are usually found in the eastern parts, which we can see are already peaking at +2 degrees above normal, expected to go much higher, as an oceanic Kelvin Wave is starting to rise from the depths. Analysis by CRW
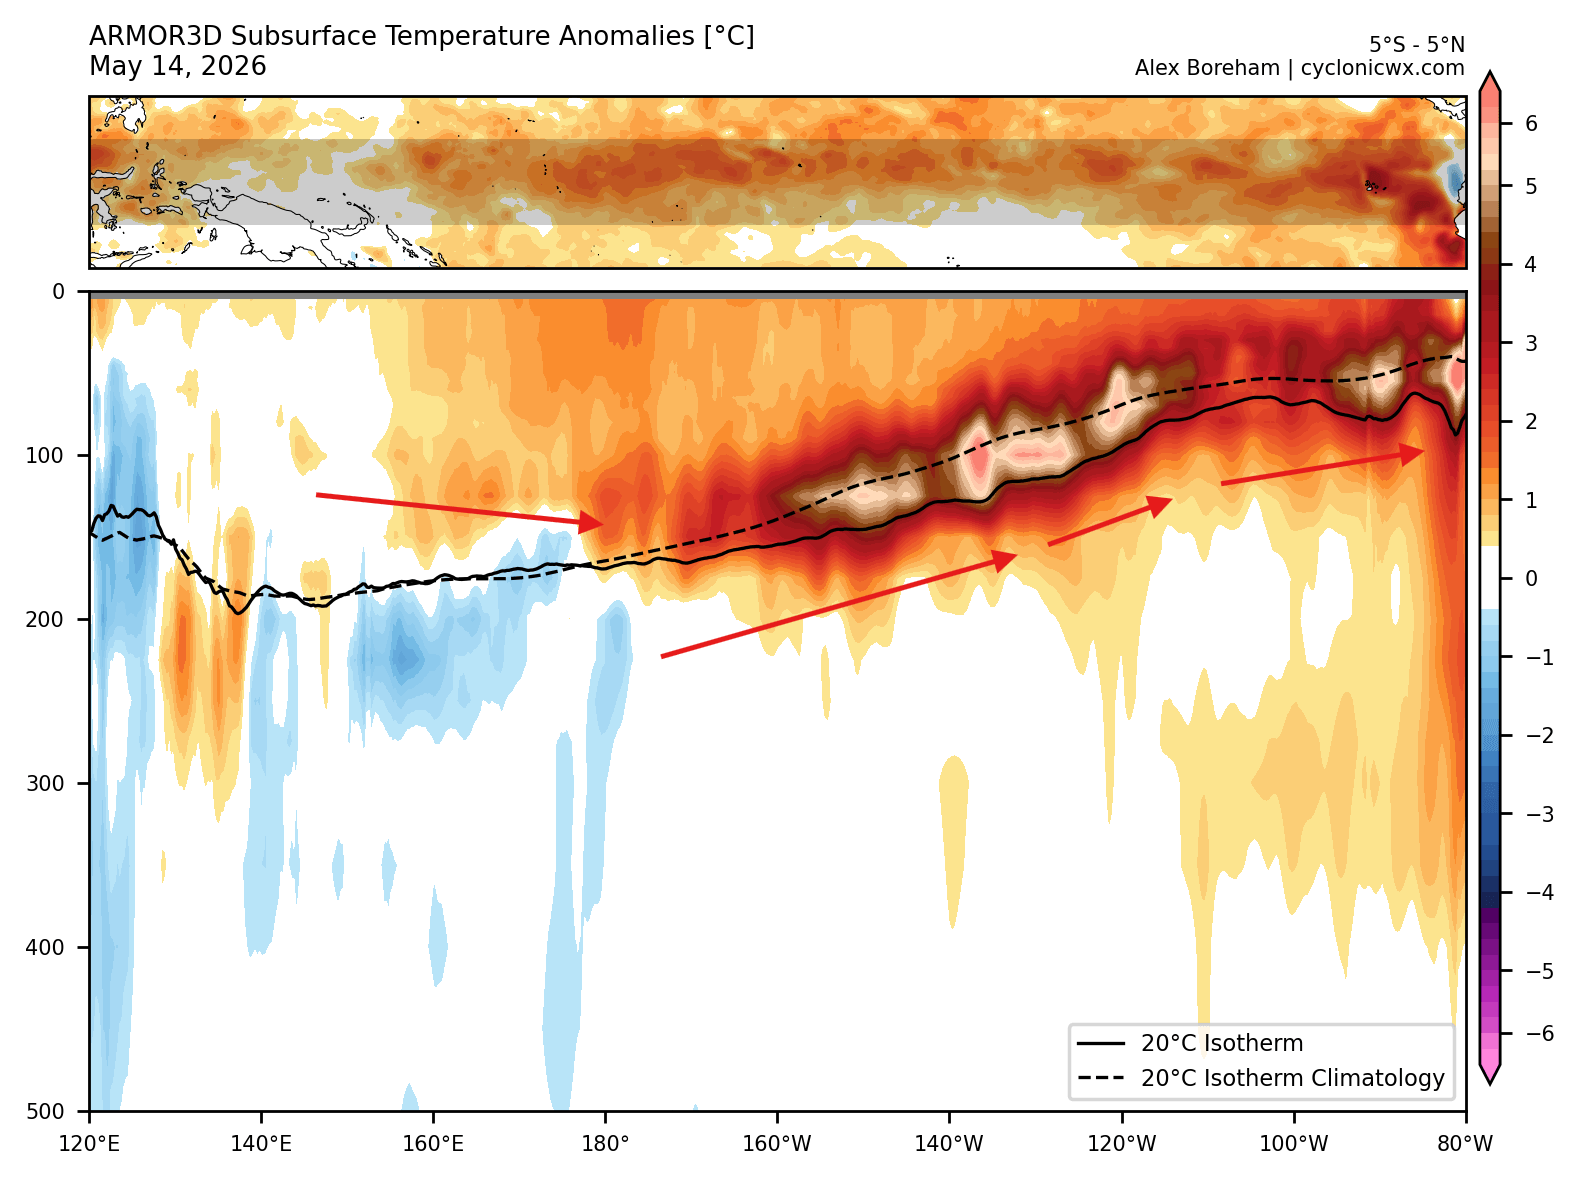
A Kelvin Wave is a massive area of warmer waters at depths of 50-250m (150-800ft). The image below shows the latest subsurface ocean temperature anomalies across the tropical Pacific. You can clearly see the oceanic Kelvin wave, which has grown stronger in recent weeks, and shows typical motion towards the east, where it rises to the surface.
The eastward movement is very clearly seen in the video below, which shows the past weeks of subsurface temperature anomalies in the tropical Pacific. This is the best way to track the Kelvin Wave development, showing clear movement and eventual rise to the surface.
This process is also seen by the seasonal models, which currently indicate we could be witnessing a potentially record-breaking El Niño event in 2026/2027.
The Super El Niño Forecast: A Record-Breaking Anomaly Incoming?
When looking at ENSO forecasts, we usually look for a warm phase or a cold phase development. But we also closely monitor the strength of the anomaly itself, for potential “super” events. A Super El Niño is scientifically recognized when sea surface temperature anomalies in the Niño3.4 region exceed a threshold of +2.0 or higher above the long-term average.
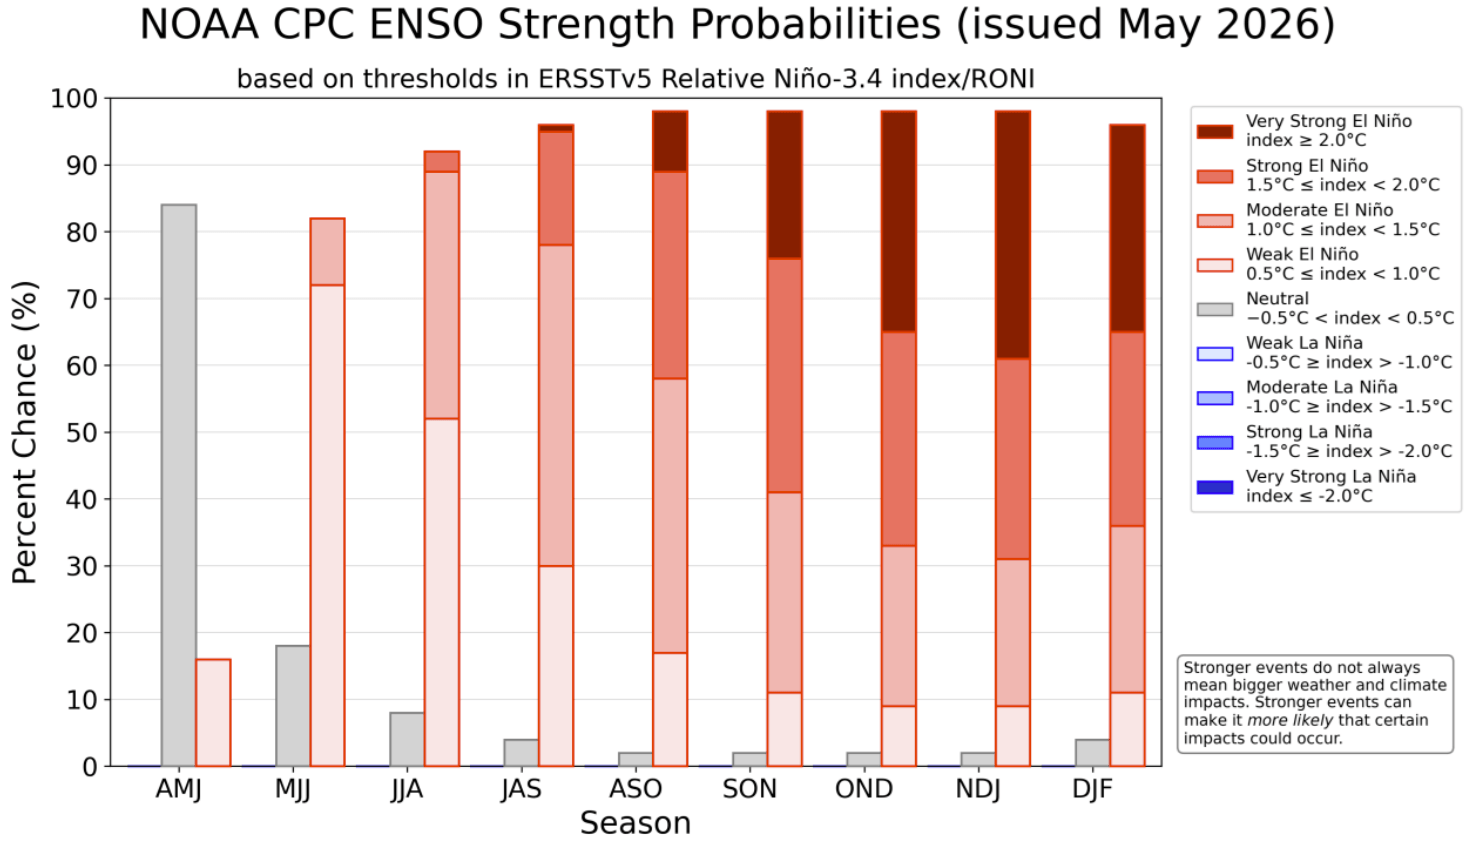
Below we have the latest NOAA strength category forecast for the ENSO regions. You can already see a very high El Niño change for late Spring and early Summer. But by the August-October period during the hurricane season, we can see a very high probability (80%+) of a moderate to strong El Niño event, with a later peak likely in the +2°C range.
A Super El Niño event would lead to more extreme weather shifts, amplifying normal seasonal changes into high-impact events like massive flooding, severe droughts, and significantly altered pressure system tracks that can affect the entire planet.
We produced a custom plot that compares the most recent forecasts with historical El Niño events. Some of the strongest events since 1870 are plotted in the image, gathered from NOAA/CPC data. The forecasts from 3 different forecast authorities show a record-strong El Niño event, not seen in modern history, peaking higher than any El Niño in the past 155 years.
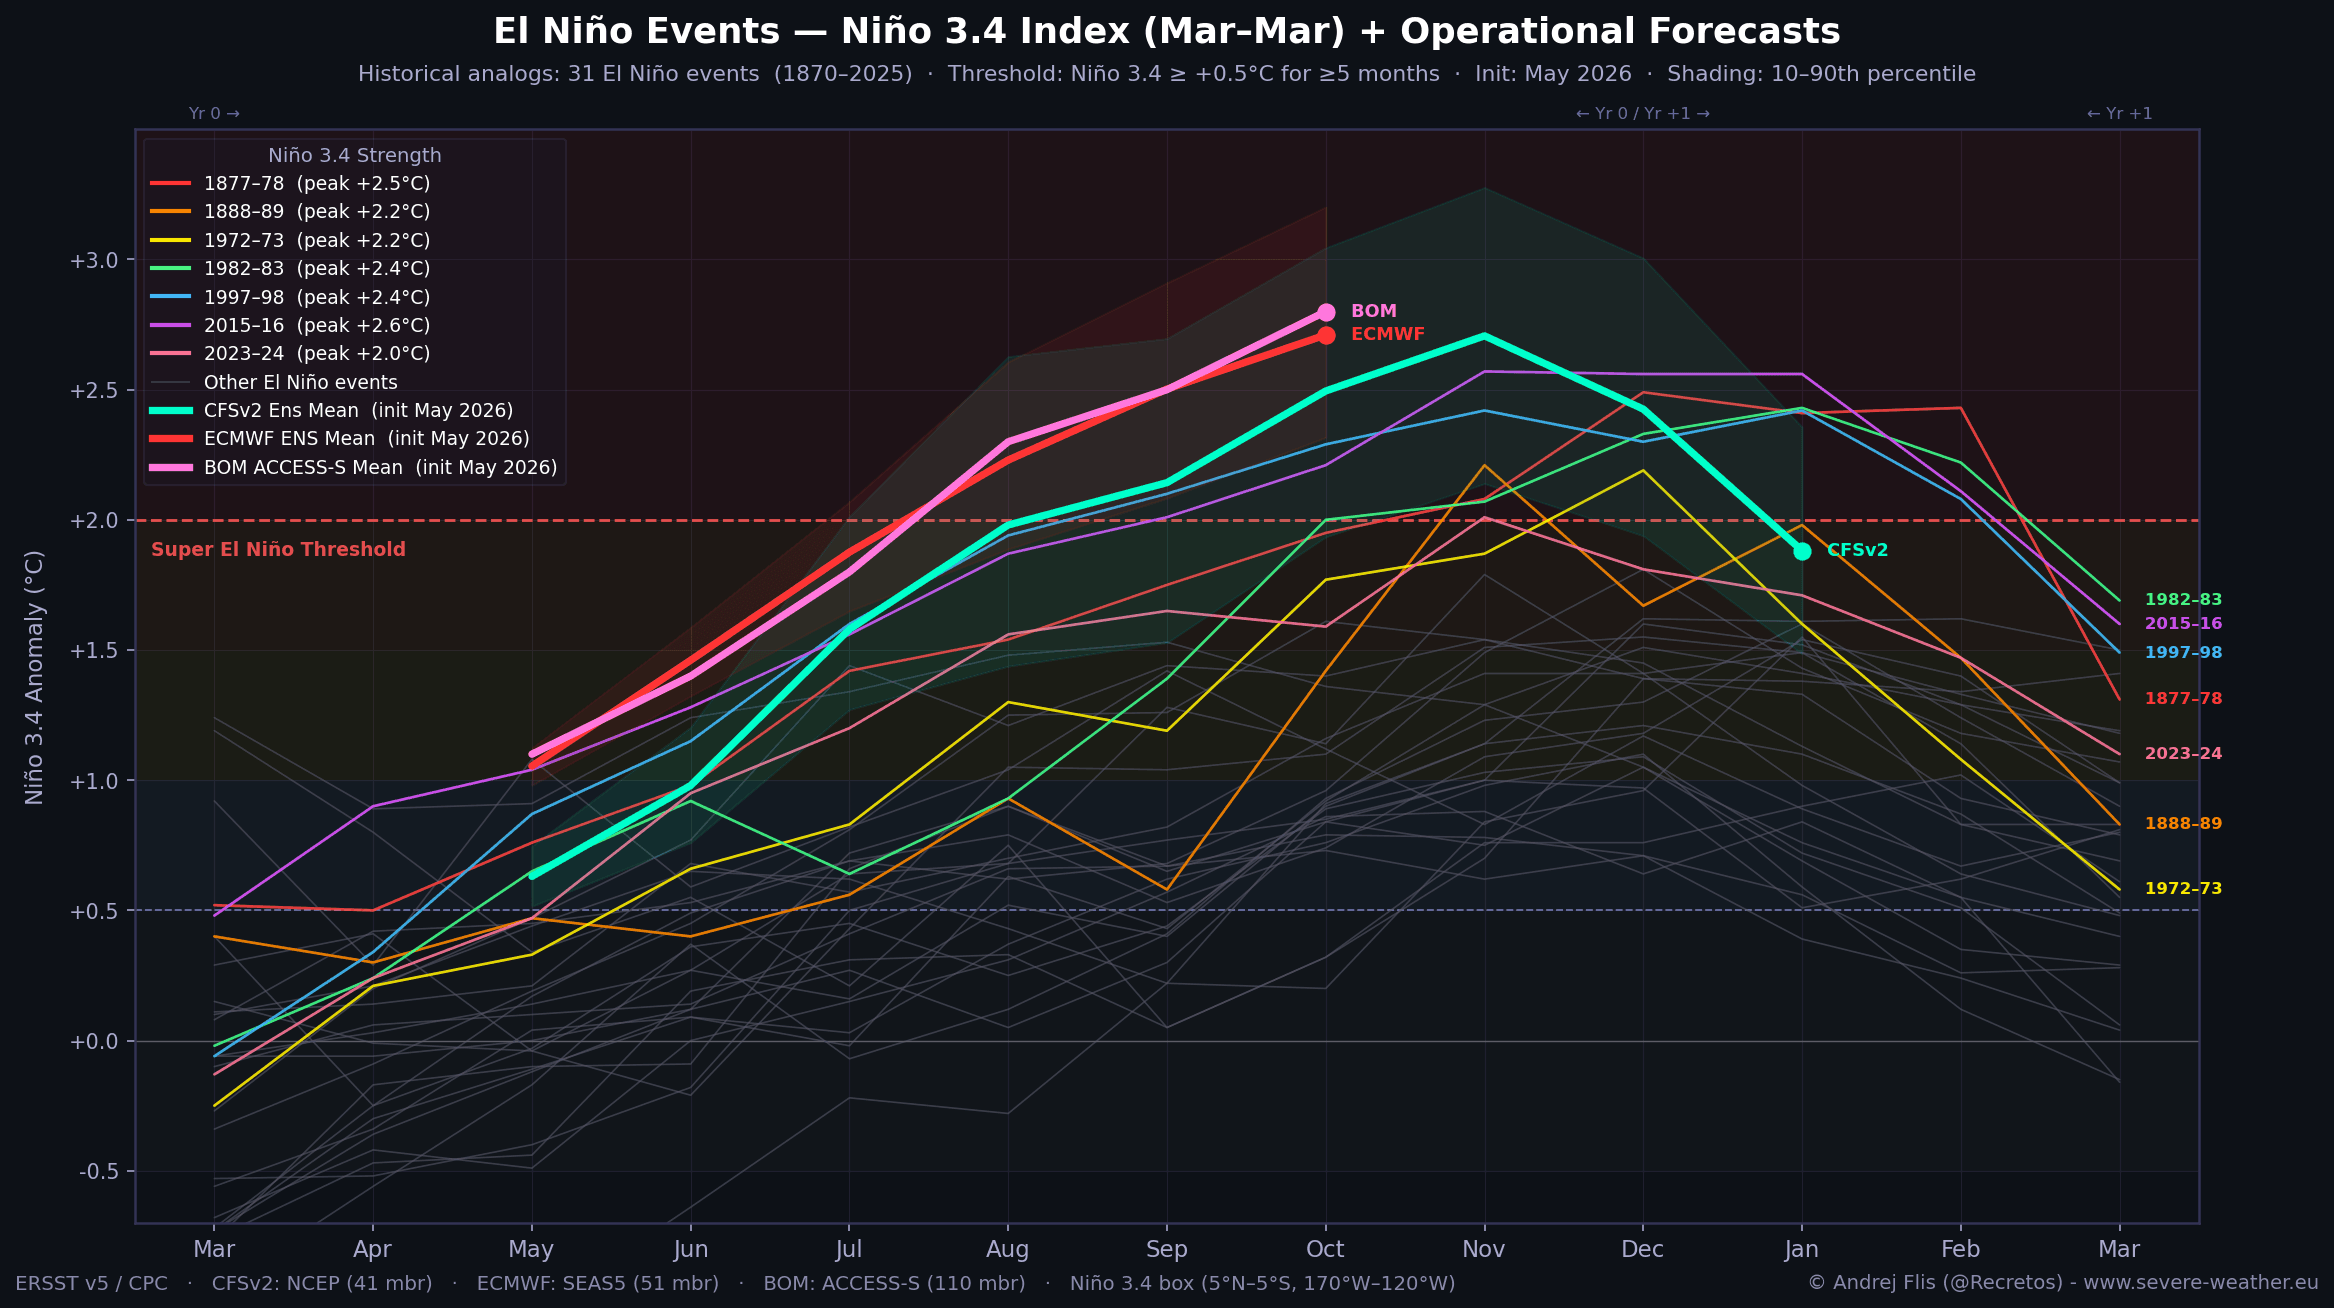
Forecasts are from the NOAA CFSv2 model in the United States (cyan line), the European ECMWF (red line), and the Australian BOM (pink line). These are still just long-range predictions, but they show that in all scenarios we can expect a strong El Niño event to unfold.
The latest ECMWF ocean forecast for the hurricane season shows a strong El Niño anomaly already present across the tropical Pacific. The peak values exceed +3 degrees across the ENSO region, with the whole region average close to a super El Niño threshold. This signals a potentially strong impact on the hurricane season development.
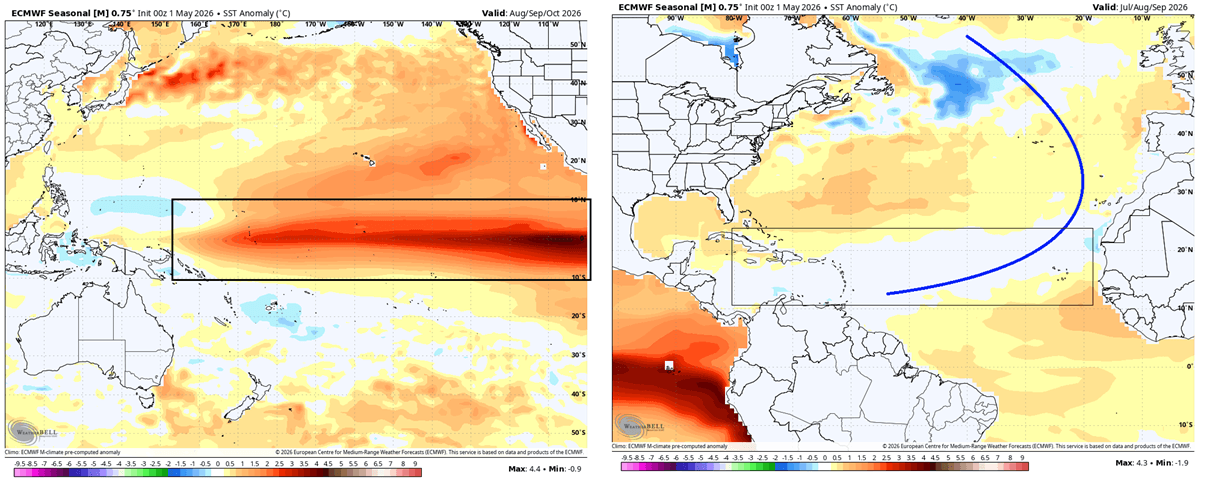
On the other side of North America, in the Atlantic, the ocean temperatures look much different. We can see a typical “horseshoe” pattern, exhibiting a somewhat neutral to cold pattern. This shows normal temperatures across the MDR area, meaning that no extra storm fuel is coming from the ocean, giving the first clue for the hurricane season.
As you will now see, past data indicates a very clear El Niño role and influence during the Atlantic Hurricane season, especially important for any United States impacts.
The Hurricane Shield: How El Niño Impacts Atlantic Storms and U.S. Landfalls
Scientific research and data reveal a significant impact of El Niño events on the number of tropical systems in the Atlantic and their intensity. Below is our simple schematic of the El Niño impact on the Atlantic hurricane season, producing an atmospheric flow that causes sinking air in the MDR and increases the vertical wind shear, protecting the U.S. from landfalls.
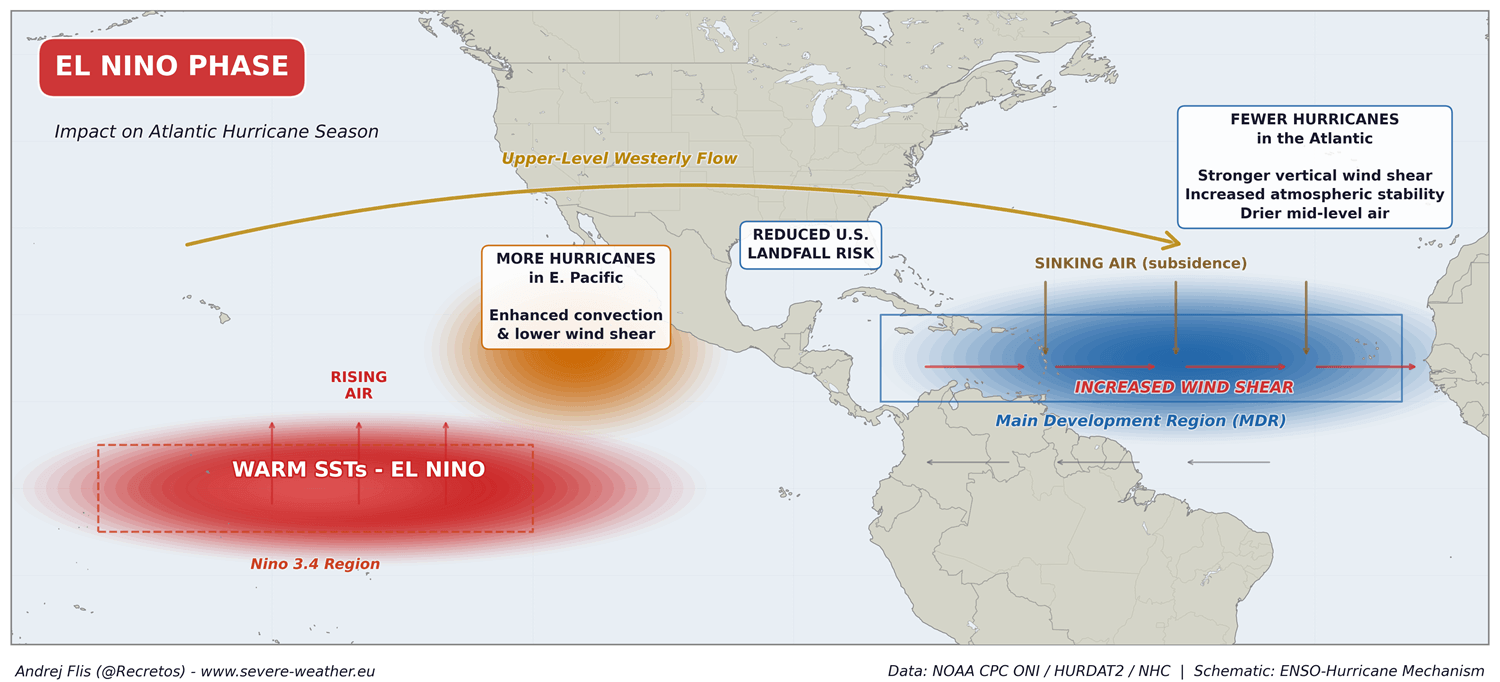
But how is this important for storm development? There are 3 main points of “impact” from an El Niño on the Atlantic Hurricane season:
Increased Wind Shear: Wind shear is the change in wind speed and direction with altitude. El Niño strengthens the upper-level westerlies across the Atlantic, leading to stronger wind shear. This tilts the vertical core/tower of developing storms, trying to rip it apart before they can organize.
Sinking Air: The intensified rising motion and low-pressure warm Pacific El Niño zone forces a strong atmospheric compensation on the other side of the globe. This causes large-scale sinking air over the Atlantic MDR region, stabilizing the atmosphere and suppressing tropical cloud development.
Drier Mid-Levels: Sinking air (driven by El Niño) forces dry air down into the mid-levels of the tropical atmosphere. Hurricanes need deep, tropical moisture to survive, so when this dry air enters a developing system, it triggers evaporative cooling, which can destroy the storm’s buoyancy (lift) and starve its engine of the energy needed to organize.
Such impacts should be clearly visible in the actual data from many past El Niño seasons. For this reason, we decided to check past hurricane season during different ENSO phases and produce images to show the data in a simple way.
First, you can see the total number of tropical systems for each ENSO phase (La Niña, Neutral, El Niño), from all named storms to hurricanes and major hurricanes (Category 3+). It is very obvious that an El Niño season produces the fewest overall named storms and hurricanes, and the fewest major hurricanes.
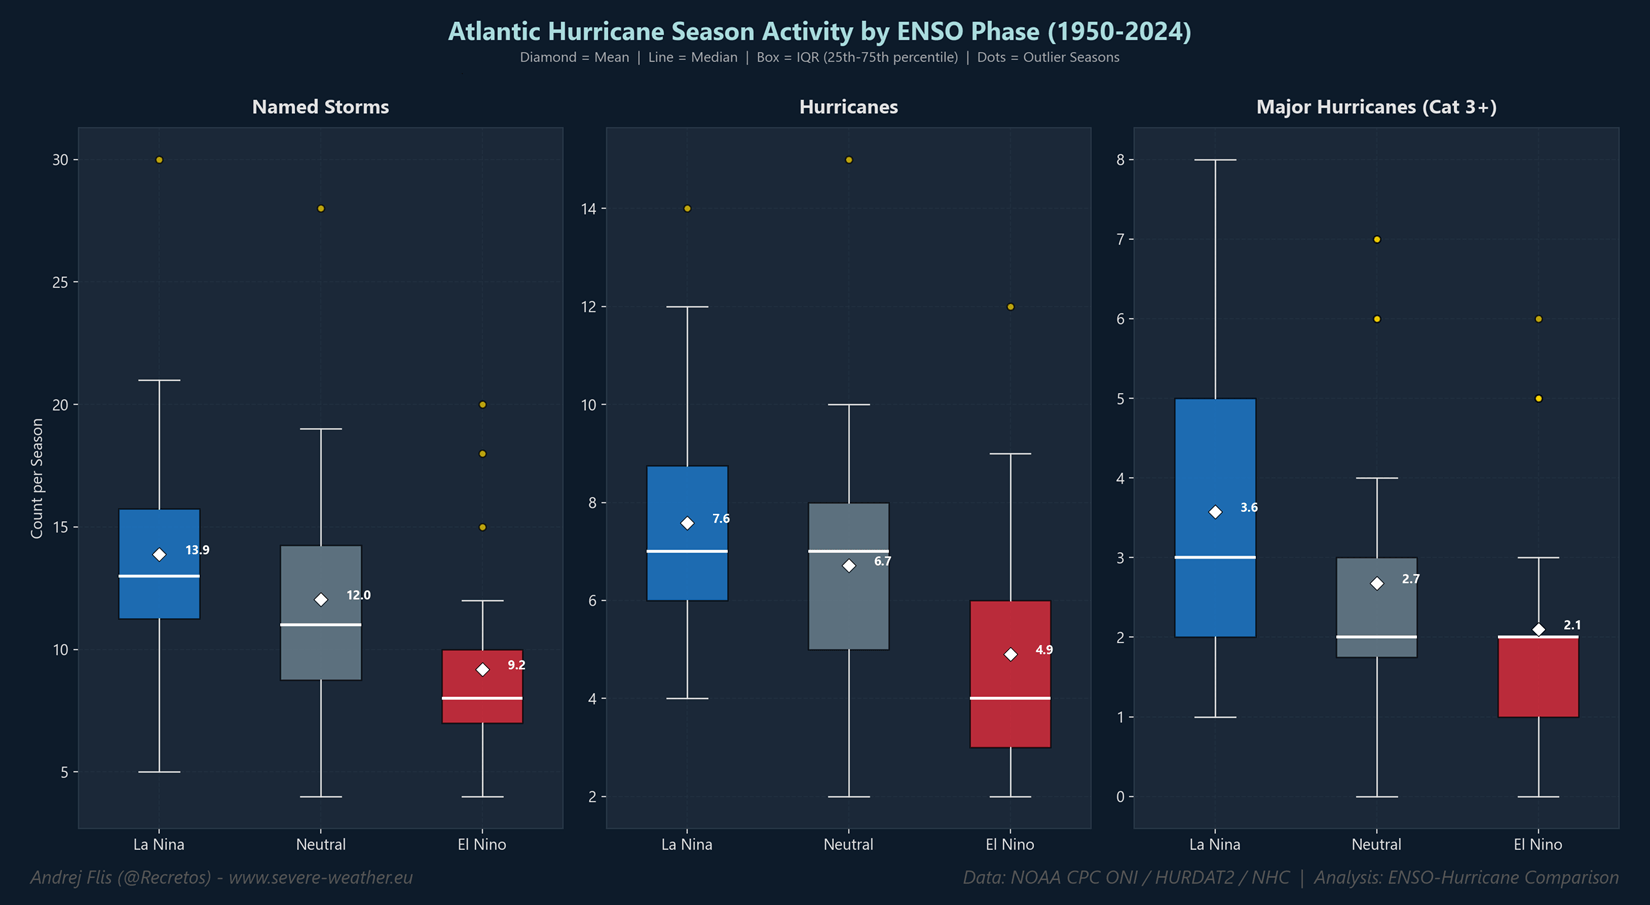
This is directly related to the very unfavorable conditions in the Atlantic we discussed above, created during an El Niño event. But note that despite the poor conditions, tropical systems still form during an El Niño, just in much lower numbers.
Next, we have the total Accumulated Cyclonic Energy (ACE) comparison. ACE is a metric used to measure the total wind energy a single hurricane releases over its lifetime, or the total wind energy all storms release in a season. This gives us a much more accurate way to measure and compare the true intensity of different hurricane seasons.
Below is a comparison of the total ACE per ENSO phase. It shows the average energy release during each phase. Here we can also see that in an El Niño hurricane season, the energy release is substantially lower. This is due to fewer storms overall, and also due to weaker tropical systems on average during an El Niño.
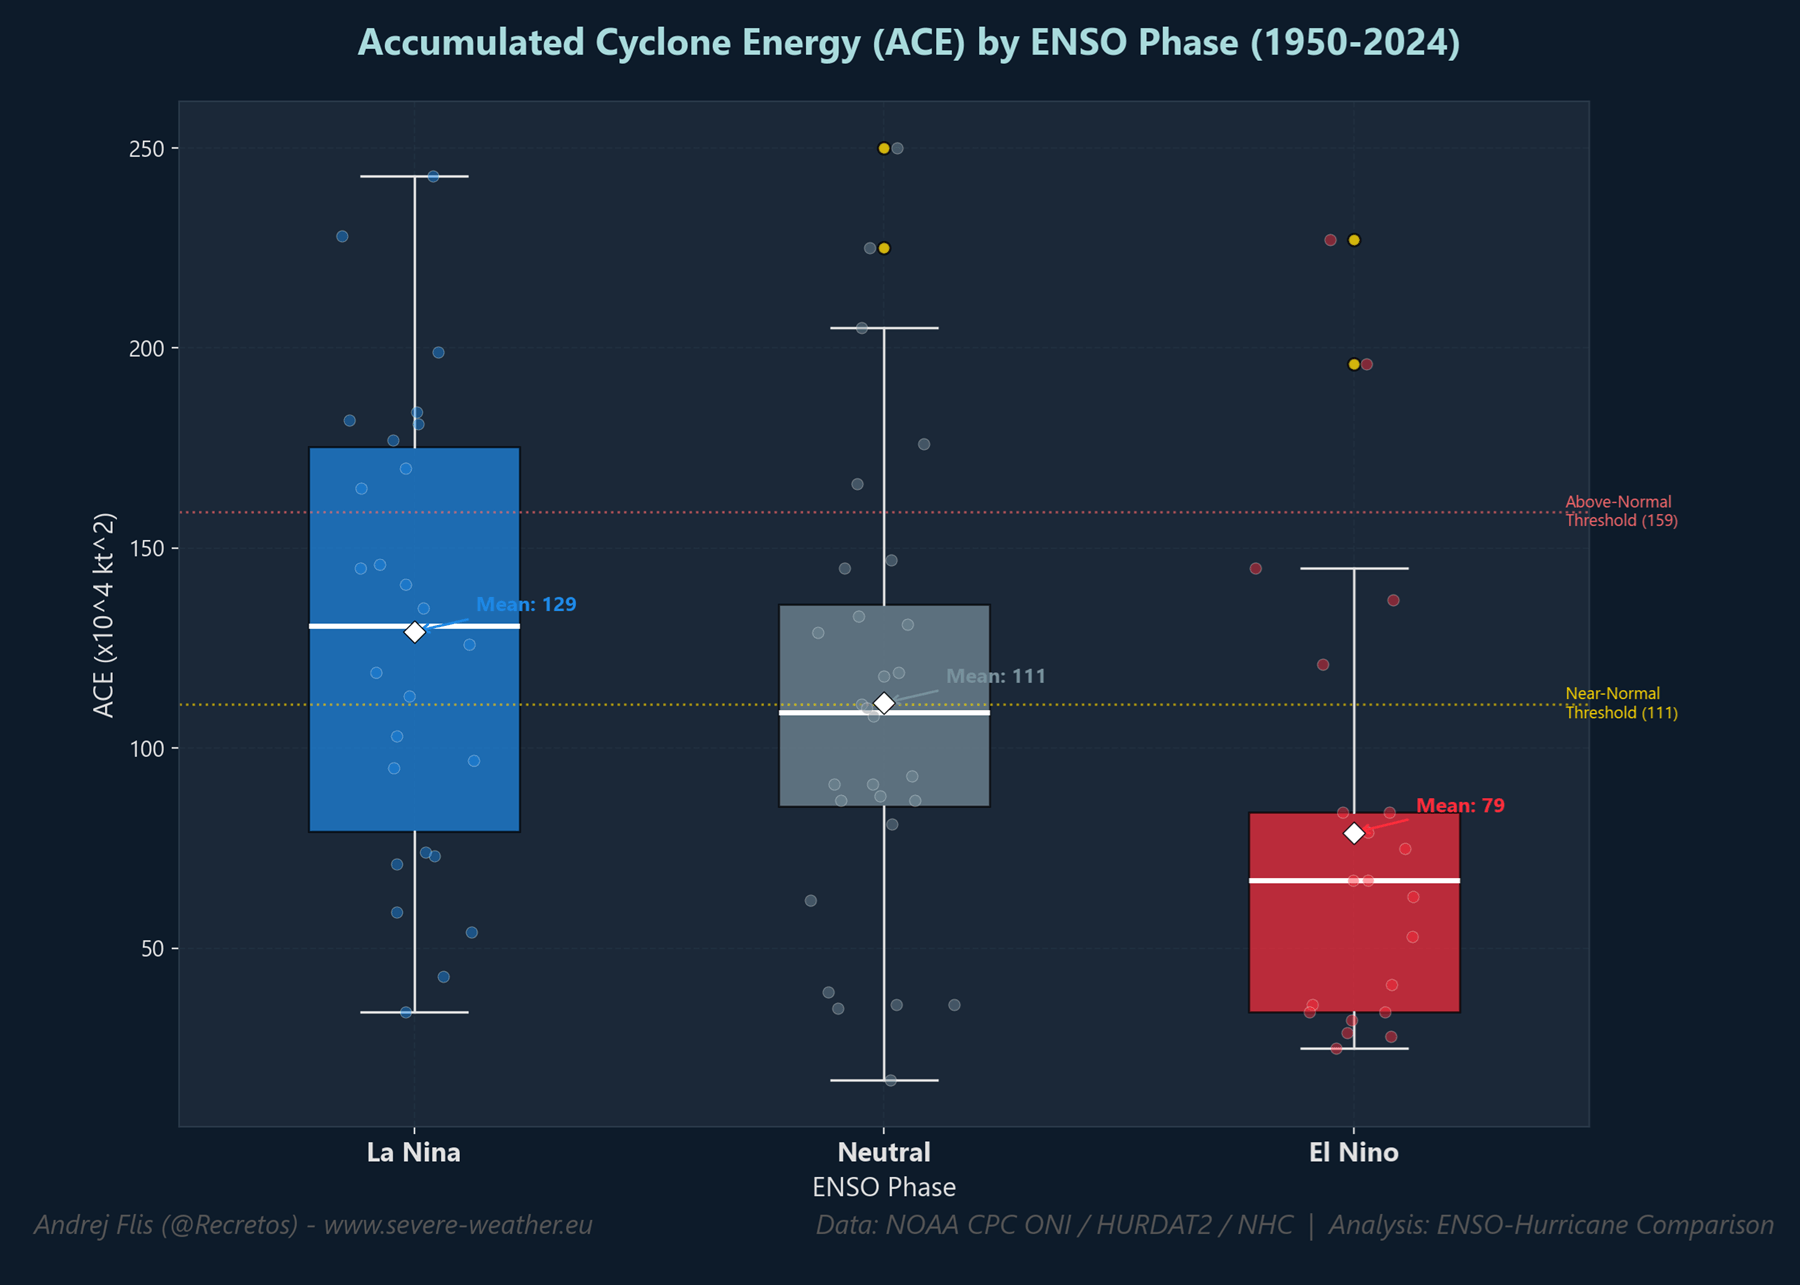
We can still see 4 outlier El Niño seasons that had normal to above-normal total ACE. But these were weaker to moderate El Niño events, which can generally show a lesser impact. The biggest outliers are seasons 2004 and 1969, but both were weaker El Niño events or just beginning to develop.
By reducing the number and intensity of tropical systems, El Niño directly affects hurricane landfalls in the United States. The data below shows the number of hurricane landfalls per ENSO phase, and it shows the lowest landfall numbers during an El Niño phase on average, effectively creating an atmospheric shield for the United States.
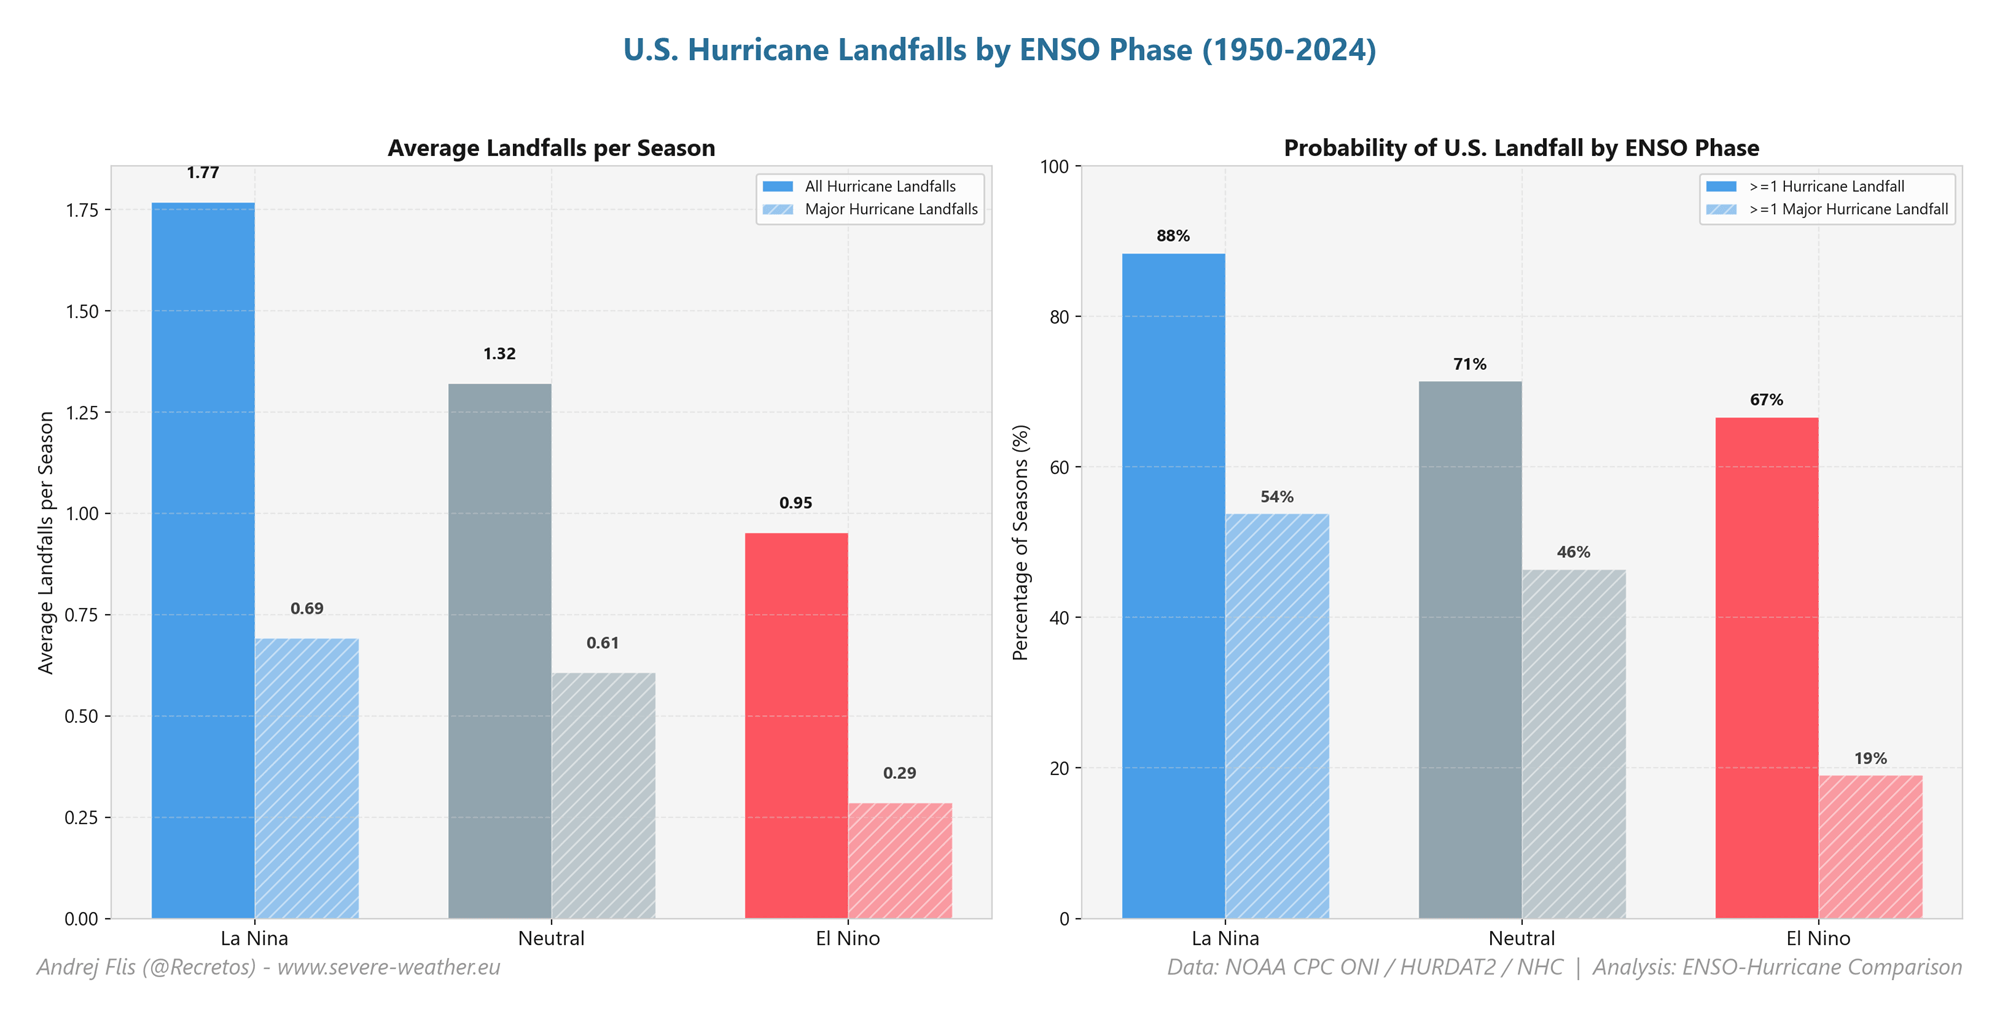
We can also see a substantially lower chance of a major hurricane (Cat 3+) landfall on the Continental United States. Though it can still happen, El Niño (especially a strong one) creates natural atmospheric conditions that help keep storms away from U.S. soil.
We can further confirm this by looking at data across different El Niño strengths. The image below shows this clearly: the stronger the El Niño is during the hurricane season, the more it can suppress hurricane development, reducing or limiting United States hurricane landfalls.
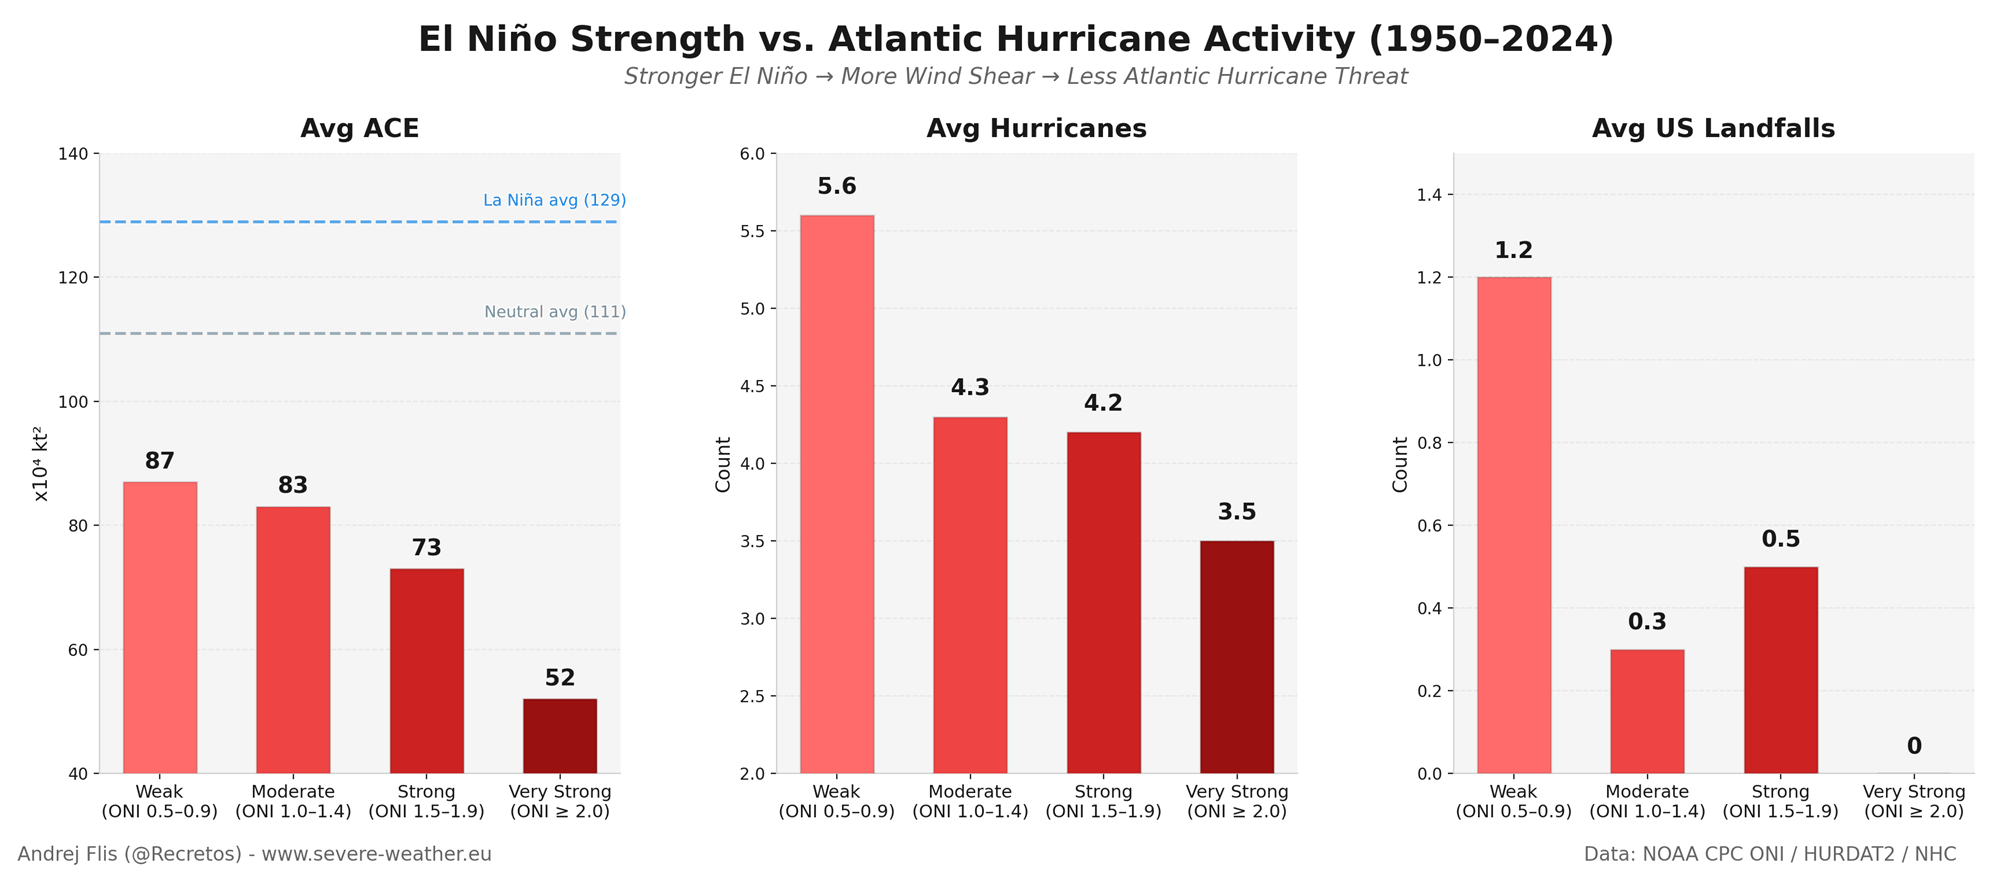
This is an expected result that confirms that a stronger El Niño is, on average, more effective at slowing the hurricane season and protecting the United States from impacts. It is safe to assume this is due to enhanced wind shear, which is extremely effective at suppressing tropical activity and organization.
We know that a strong to very strong El Niño is expected to develop in 2026/2027. Based on this data, we can assume a weaker hurricane season. Does the latest forecast data confirm this?
2026 Hurricane Forecast: Will El Niño Protect the U.S. from Landfalls?
First, we have to look at the Velocity Potential forecast, which shows the areas of rising and sinking air in the atmosphere. It effectively tells us what the atmospheric circulation looks like, and where the areas of more/less tropical activity are.
The latest August-October ECMWF forecast shows a substantial anomaly of rising air over the Pacific and sinking air over the Indian Ocean, revealing a strong El Niño atmospheric circulation. In the Atlantic, we can see a tendency for sinking air over the MDR, as expected for an El Niño of this magnitude.
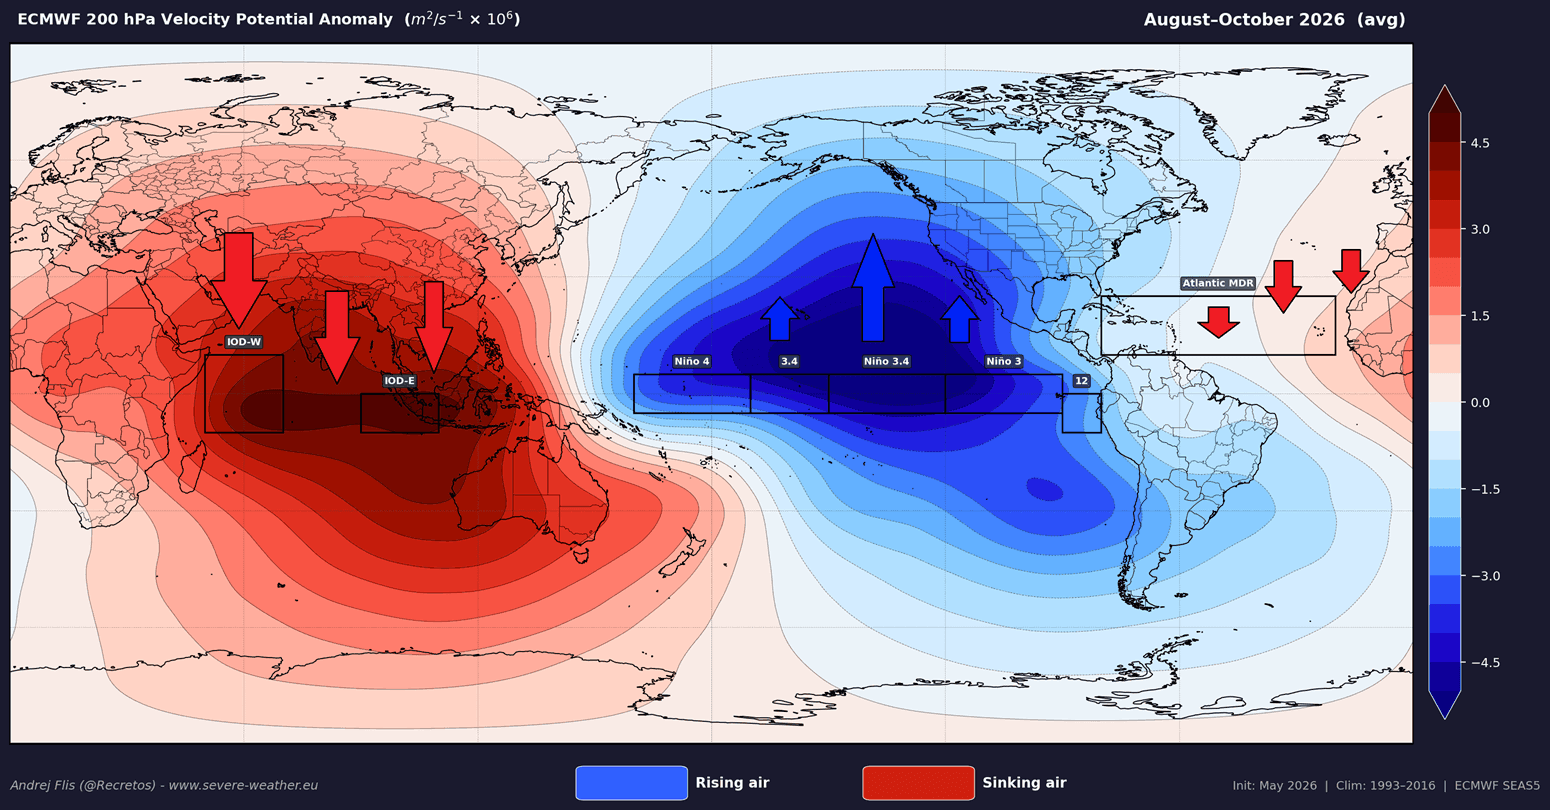
This is the exact same circulation pattern we showed in the first part of the article, with strong lifting in the central and eastern tropical Pacific and subsidence in the west and the Indian Ocean. Such a pattern corresponds to sinking motion in the Atlantic, which limits tropical formation.
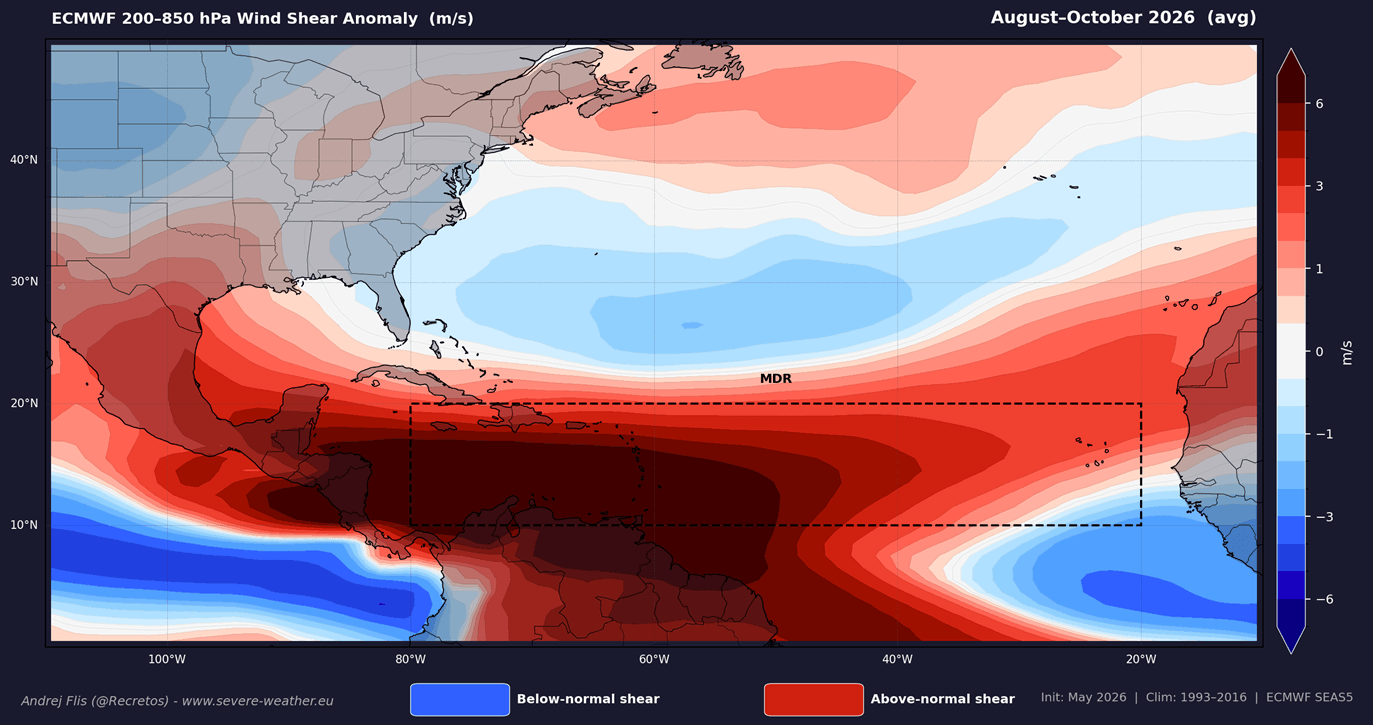
We mentioned wind shear as one of the main suppressing factors for hurricane activity during an El Niño. The latest wind shear forecast for the August-October period shows a strong wind shear increase over MDR and towards the United States. This shows us a very hostile environment for tropical system development in 2026, if verified.
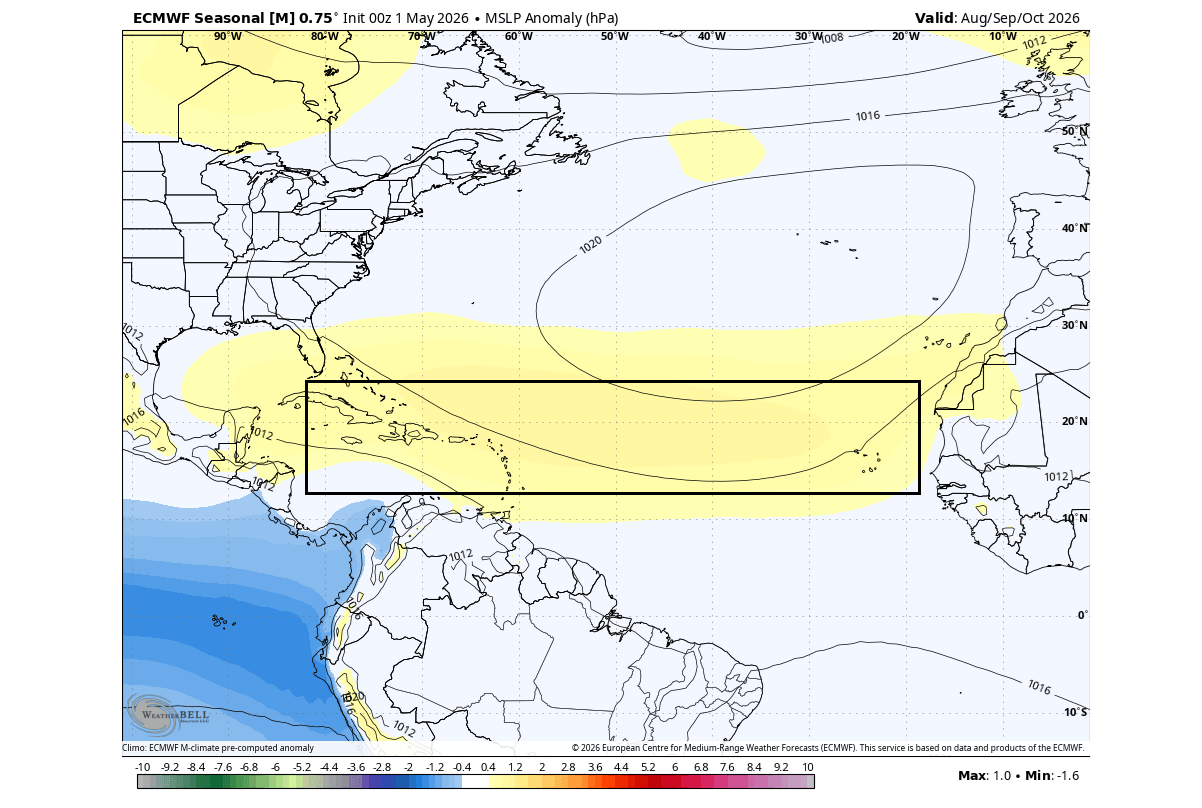
To get the full picture of atmospheric conditions, we can also look at the pressure anomaly forecast for the same period. It clearly shows a high-pressure anomaly across the MDR, reaching towards the southern coastal areas of the United States. This signals a lower overall number of low-pressure systems and the area of sinking/stable air.
Higher pressure also means less rainfall, and this is exactly reflected in the precipitation forecast below. You can see below-normal rainfall across the MDR area, but also expanding towards the west and into the Gulf area. This is a more direct sign of low tropical activity in the 2026 hurricane season.
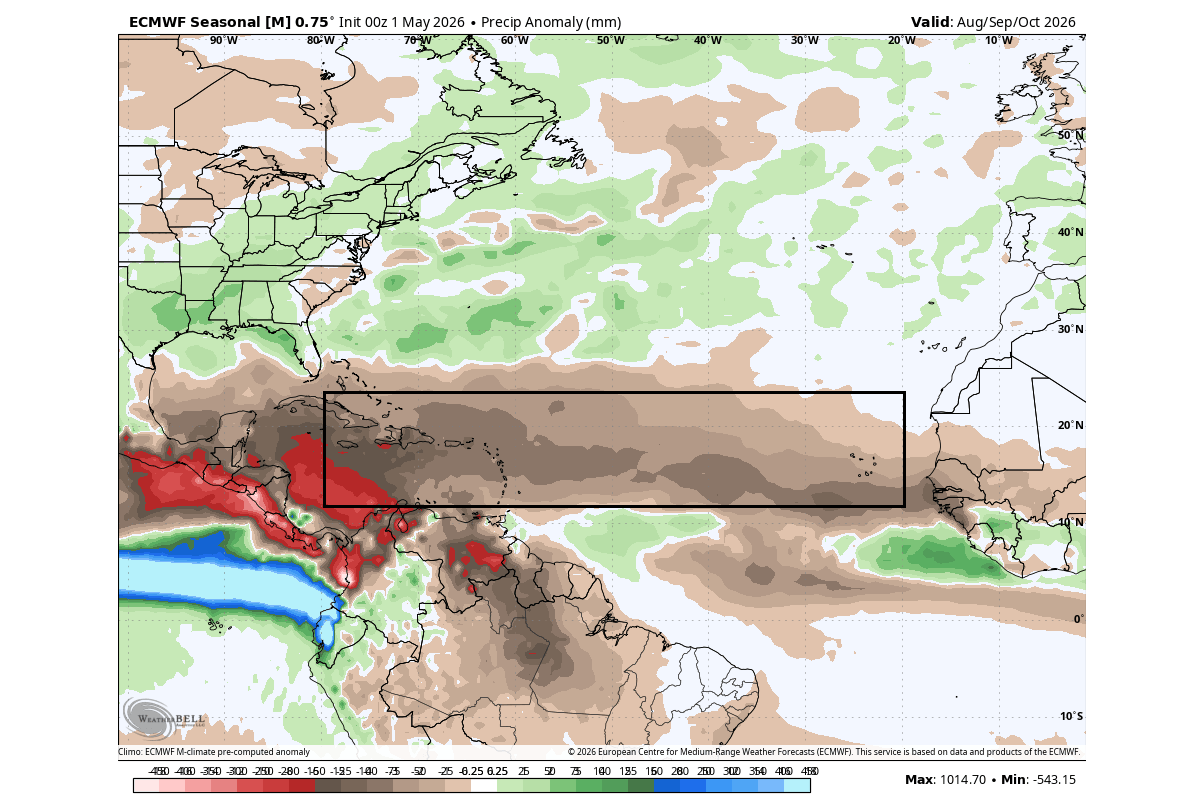
We can also see the increased precipitation across the southern and eastern United States, driven by the amplified Pacific Jet Stream during an El Niño event.
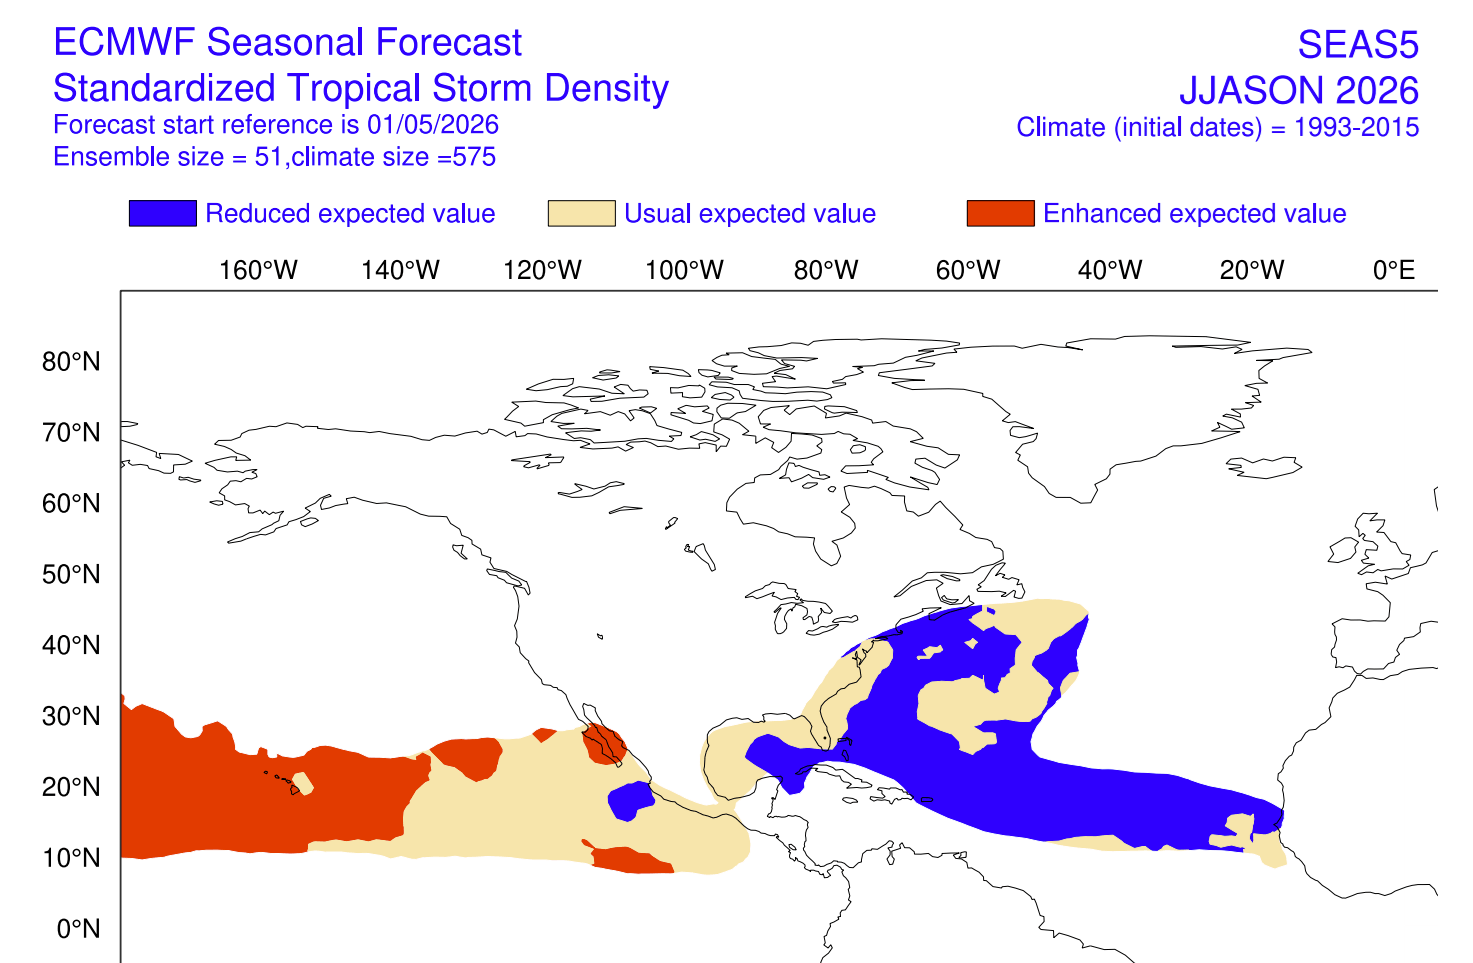
All this comes together in the overall tropical activity forecast, which shows areas of weaker and stronger tropical storm formation. You can clearly see the large area of below-normal tropical activity across the MDR and the Atlantic region. At the same time, we see enhanced activity in the Pacific, aided by the low pressure and rising air associated with El Niño.
You probably noticed that we have mainly used the ECMWF forecast data so far. This forecasting system is the best (or among the best) in its class of long-range predictions, and is thus also the most popular choice.
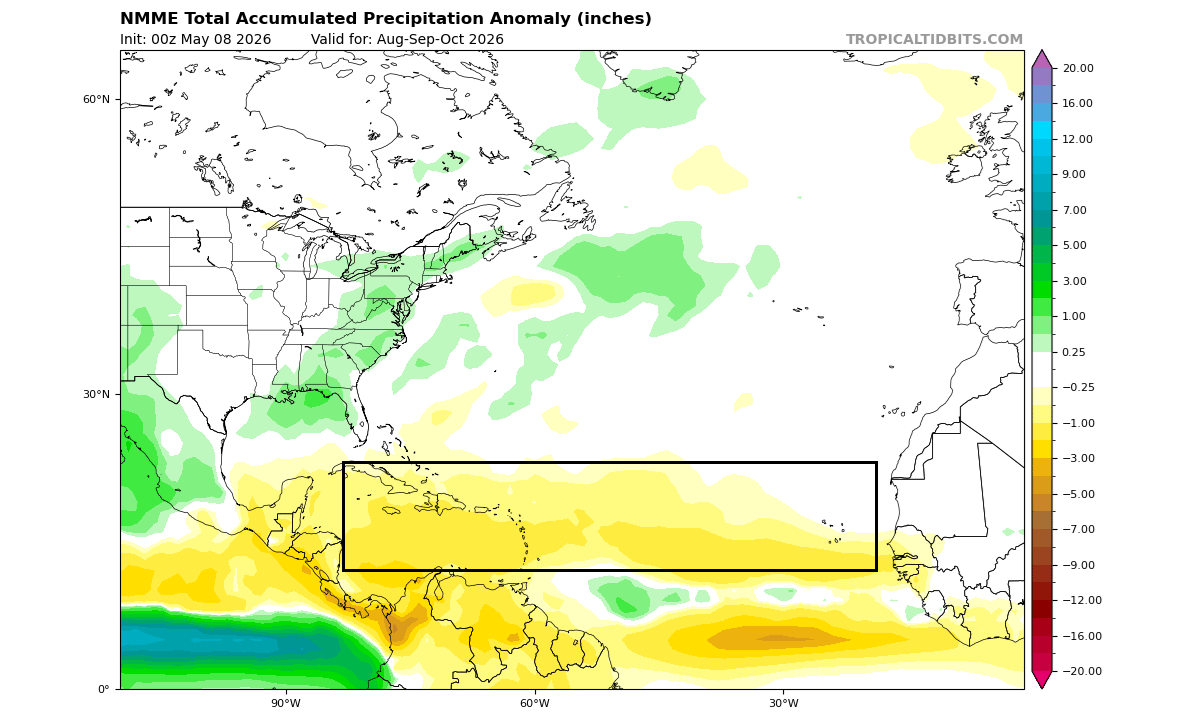
But even in the North American NMME multi-model forecast below, we can see an almost identical precipitation forecast for the peak of hurricane season, with drier MDR, indicating less activity and storms. This confirms that it sees a clear, strong (very strong) El Niño impact in the atmosphere during the peak of the season, mirroring the ECMWF idea above.
These are still just the latest trends, considering that we are still several months away from the peak of the hurricane season. But we can already see a very clear indication that a strong El Niño is expected to slow down and suppress the 2026 Atlantic hurricane season.
Some of the forecast and analysis images in this article are from cyclonicwx.com, TropicalTidbits, and WeatherBell, using a commercial license.
We will keep you updated on global weather development and the latest long-range outlooks, so bookmark our page. Also, if you have seen this article in the Google App (Discover) feed, click the like button to see more of our forecasts and our latest articles on weather and nature in general.
Don’t miss:
Europe Braces for Late-May Heatwave as a Record-Challenging Heat Dome Develops