UPDATE June 11th, 2026: NASA Detects a Major Pacific Sea Level Rise as Super El Niño Rapidly Strengthens, with Atmospheric Impacts Already Visible
The transition into the Summer 2026 season is being defined by a rapid warming acceleration in the tropical Pacific Ocean. Latest analysis reveals a significant subsurface Kelvin wave currently surfacing in the eastern Pacific, signaling the onset of a Super El Niño event.
This intensifying warm phase will now start triggering a reorganization of the global atmospheric circulation. New ensemble forecasts for summer confirm a shifting of the planetary jet stream, which has historically redefined summer weather patterns across North America and Europe. The speed of this transition suggests that the first major atmospheric impacts will be felt as early as the first half of the meteorological summer.
In this article, we will look at the fresh forecast data and, combined with past Super El Niño events, reveal specific shifts in hail and tornado frequency across the United States, storm potential over Europe, and how the latest long-range models are now showing a stronger El Niño signature in the atmospheric circulation pattern for Summer 2026.
ENSO Mechanics: The Atmospheric Bridge and the Global Circulation Reset
Based on all the data and analysis done so far, it is fully confirmed that ENSO will be a major global weather driver in 2026/2027. What is ENSO? It is short for “El Niño Southern Oscillation”, a region of the tropical Pacific Ocean that alternates between warm and cold phases every few years.
These ocean phases can cause a significant disturbance to the global weather system. But they also act as the “indicator light”, indicating major changes in the global weather system as this ocean area changes from a cold to a warm phase.
In this cycle, we are entering a strong El Niño, so we can look at the usual changes it makes to the atmospheric circulation. The upward and downward atmospheric motion in the tropical regions is called a Walker Cell, and is especially sensitive to strong ENSO events. The schematic below, by ESA, shows the changes in this atmospheric motion cell during a normal atmosphere versus an El Niño event, altering the global atmosphere, often called an atmospheric bridge.
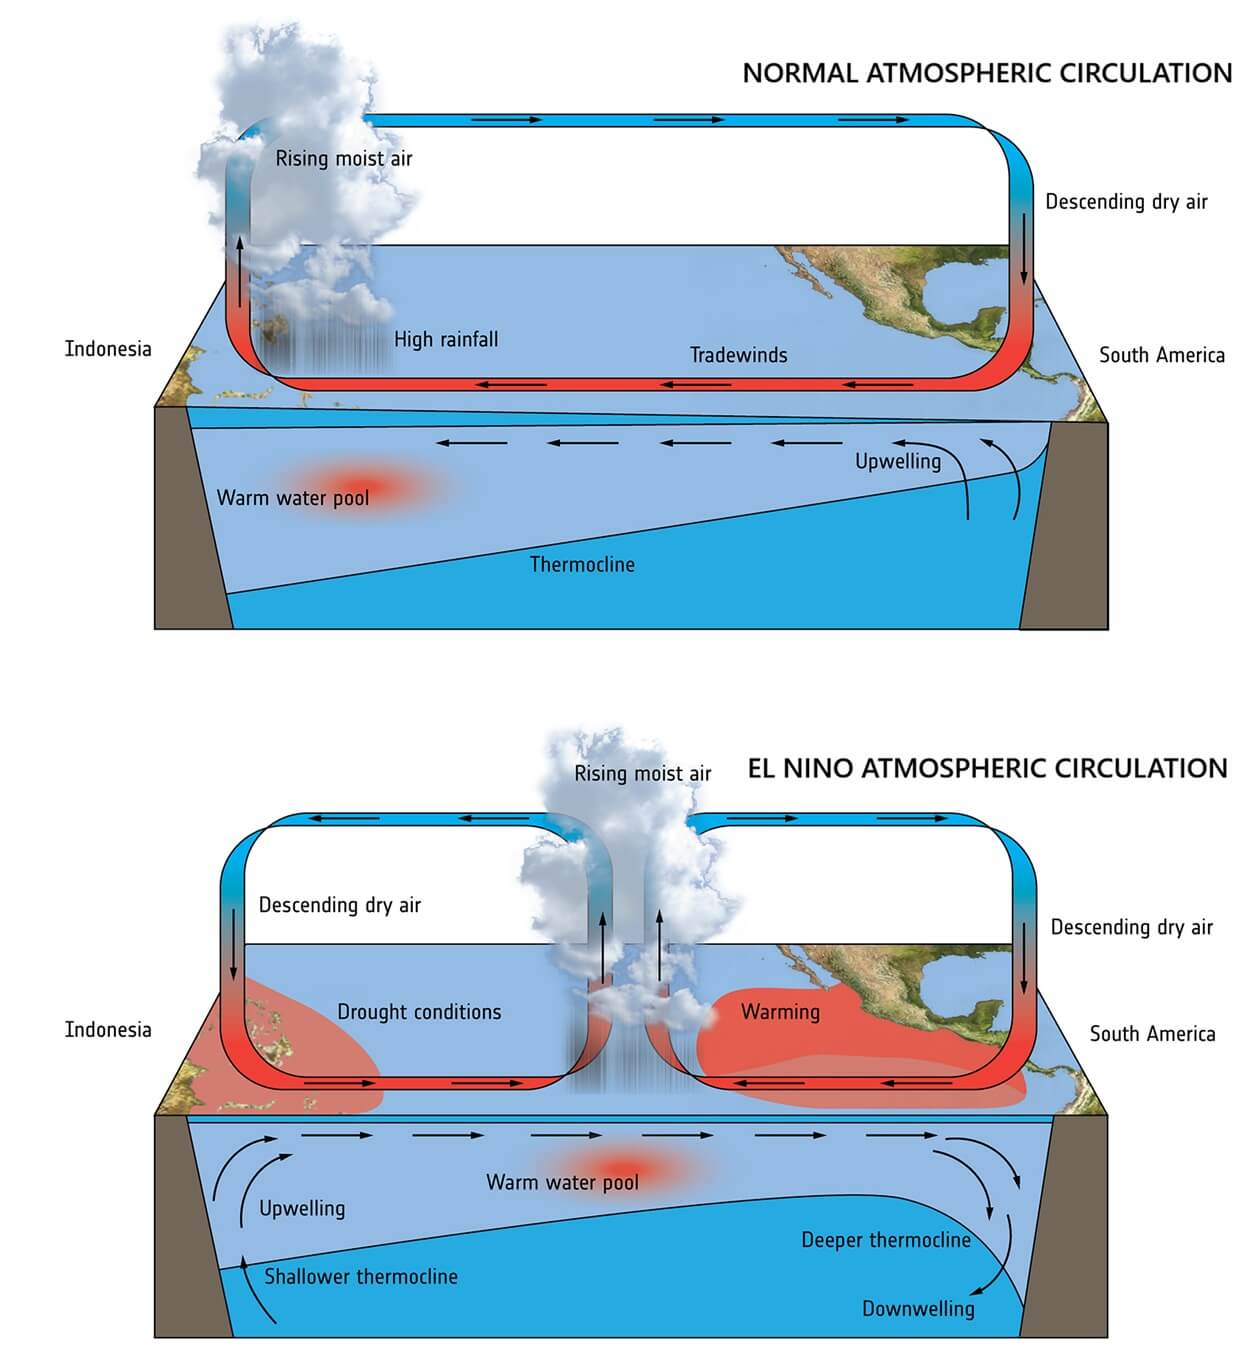
Generally, an El Niño causes a warm ocean anomaly in the eastern and central tropical Pacific, accompanied by a pressure drop and a high-pressure zone forming over the western Pacific. This has a major influence on the tropical rainfall and pressure patterns, like dropping a large rock into a pond, creating all sorts of waves and ripples.
As mentioned in the intro, we are heading into a new El Niño event that appears strong enough to reach “Super El Niño” levels. A Super El Niño acts as a massive “pressure release valve” for piled-up warm water and energy in the Pacific. It is a highly energetic event with truly planetary-scale impacts on weather.
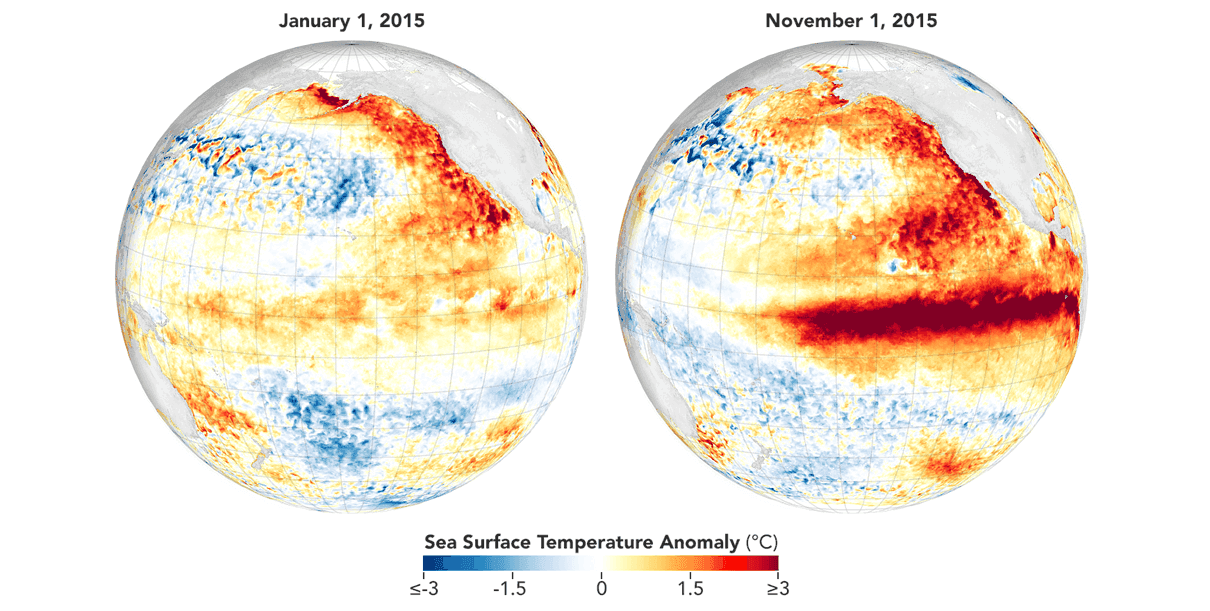
Below is an example analysis from NOAA that shows the evolution during the last Super El Niño event in 2015, and how wide and strong the ocean anomalies were. The ocean anomaly easily exceeded +3 degrees during the peak, creating a large oceanic “scar” on the ocean analysis maps.
You can see this full evolution in the video below, made from a NASA Earth visualization. It shows a full life cycle of the last Super El Niño in 2015/2016. Notice a massive subsurface warm anomaly making way towards the eastern Pacific and surfacing, releasing a large warm ocean anomaly on the surface.
The latest analysis and forecast data shows a stronger process with each update, suggesting a significant event is on the horizon for 2026/2027.
Oceanic Analysis: The Massive 2026 Kelvin Wave Starts Emerging
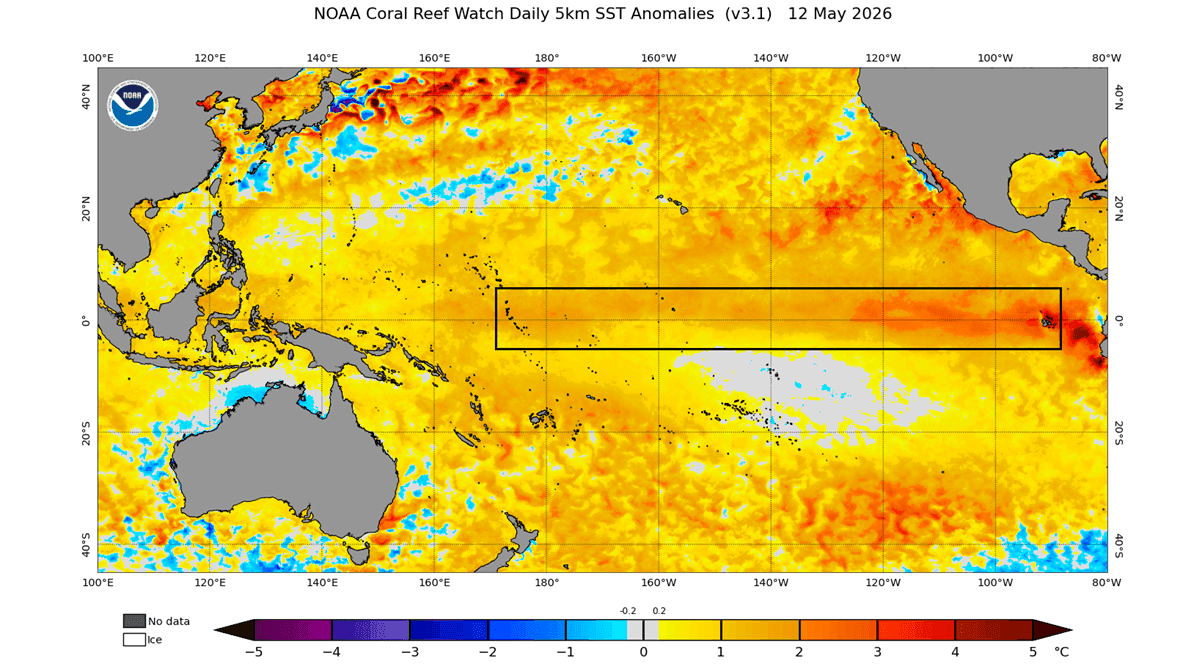
The first evidence of a rapid shift in the Pacific is seen in the analysis below, which shows the ocean surface anomaly data for the past 10 months in the main ENSO region. We can see the weak cold phase (La Nina) active over the Fall/Winter season. But recently, we can see a significant warm anomaly building across the tropical Pacific as El Niño rises to the surface.
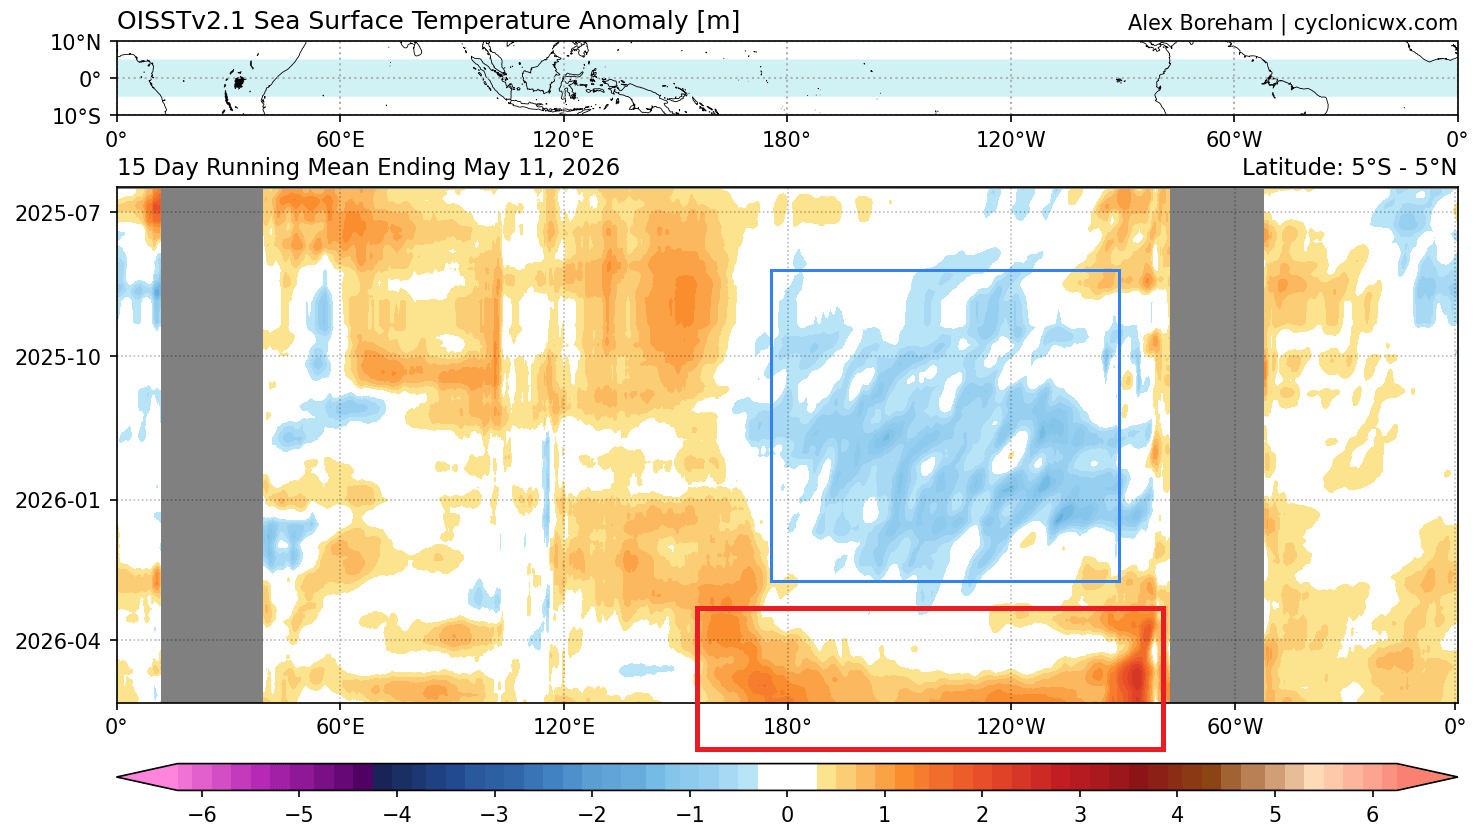
The latest ocean analysis below shows the main ENSO region with emerging warm anomalies. The strongest anomalies are usually found in the eastern parts, where the abnormally warm subsurface waters make their way to the surface, now already reaching +2 degrees in that region.
Speaking of the depths, below are subsurface temperature anomalies across the tropical Pacific in the top 300m (1000ft) of the ocean. The image shows a direct comparison of subsurface anomalies for mid-May, between this year and the last two Super El Niño events. The strong, warm anomaly core is called a Kelvin Wave and is pushed below the surface towards the central and eastern regions, where it begins to rise to the surface.
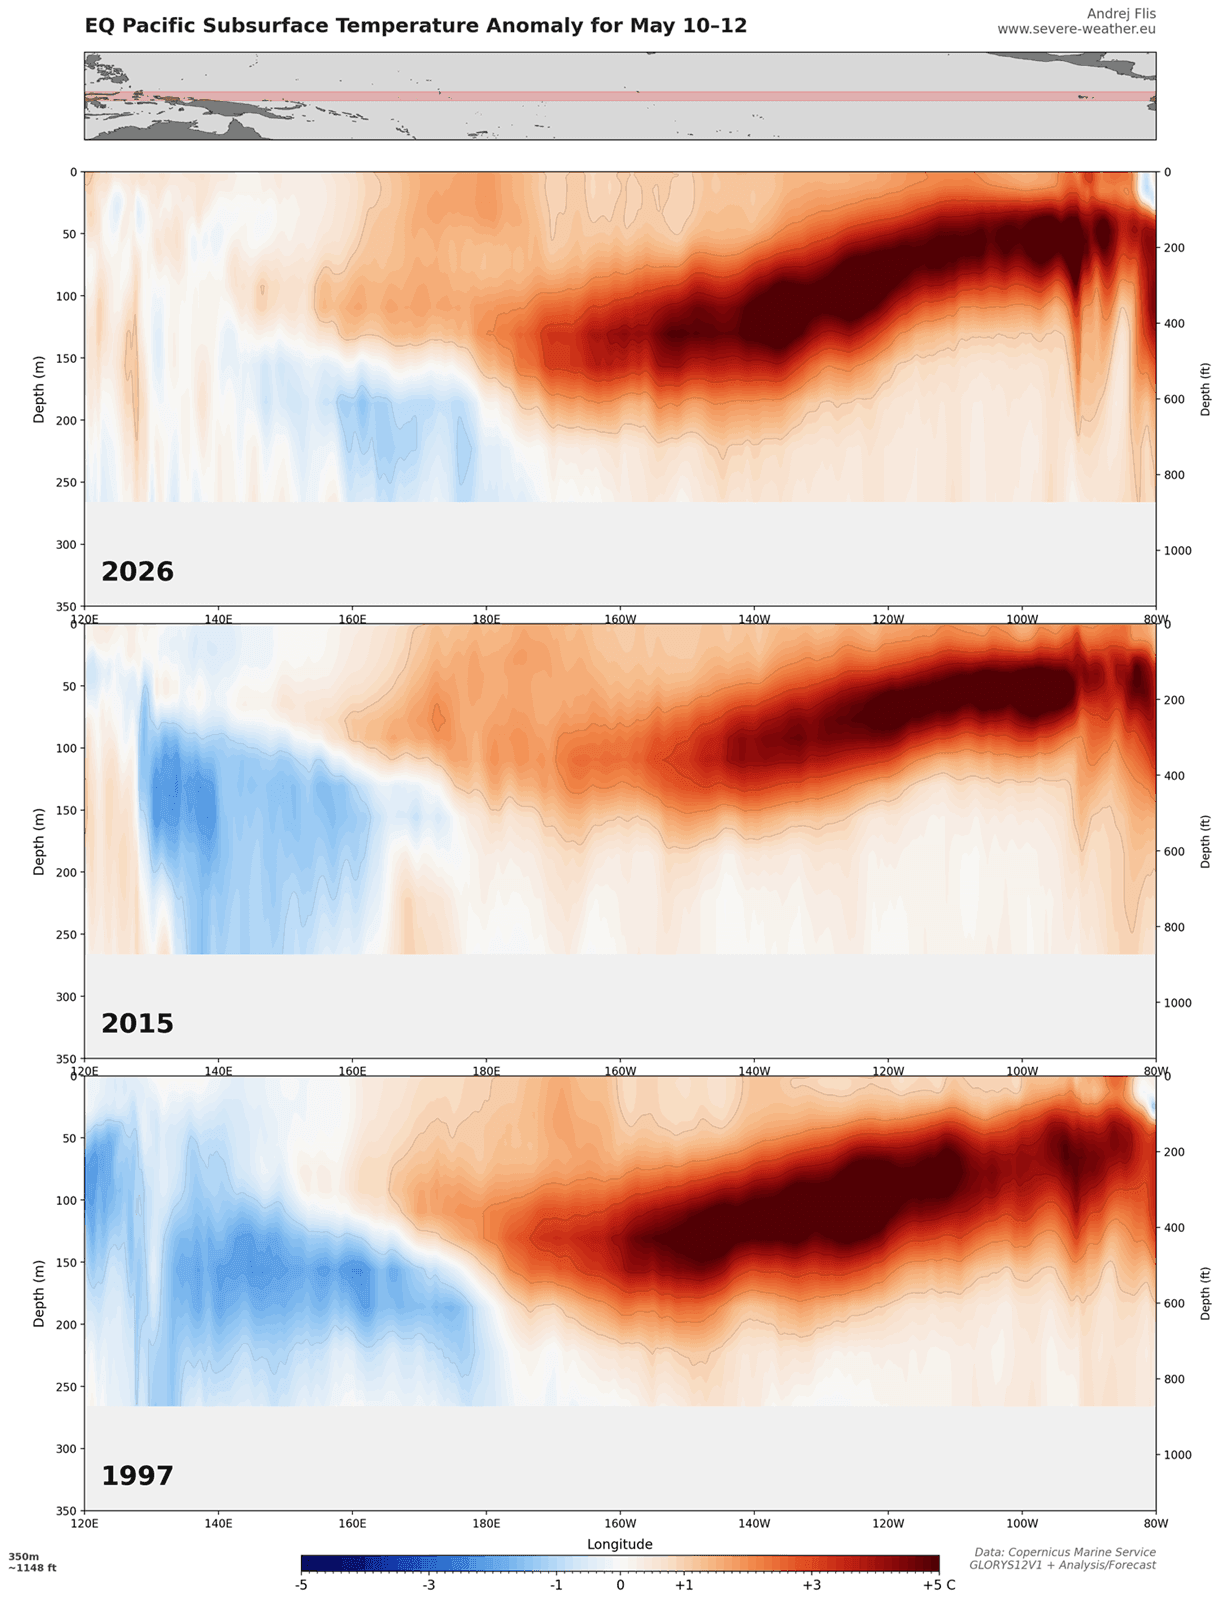
This year, we are well on par with the last two Super events at this stage of development. More so, we are currently warmer in the western tropical Pacific than during the last two super events at this time. This can indicate that the warm supply from the west is not yet fully released, so the Kelvin wave is likely not yet closed off from the source.
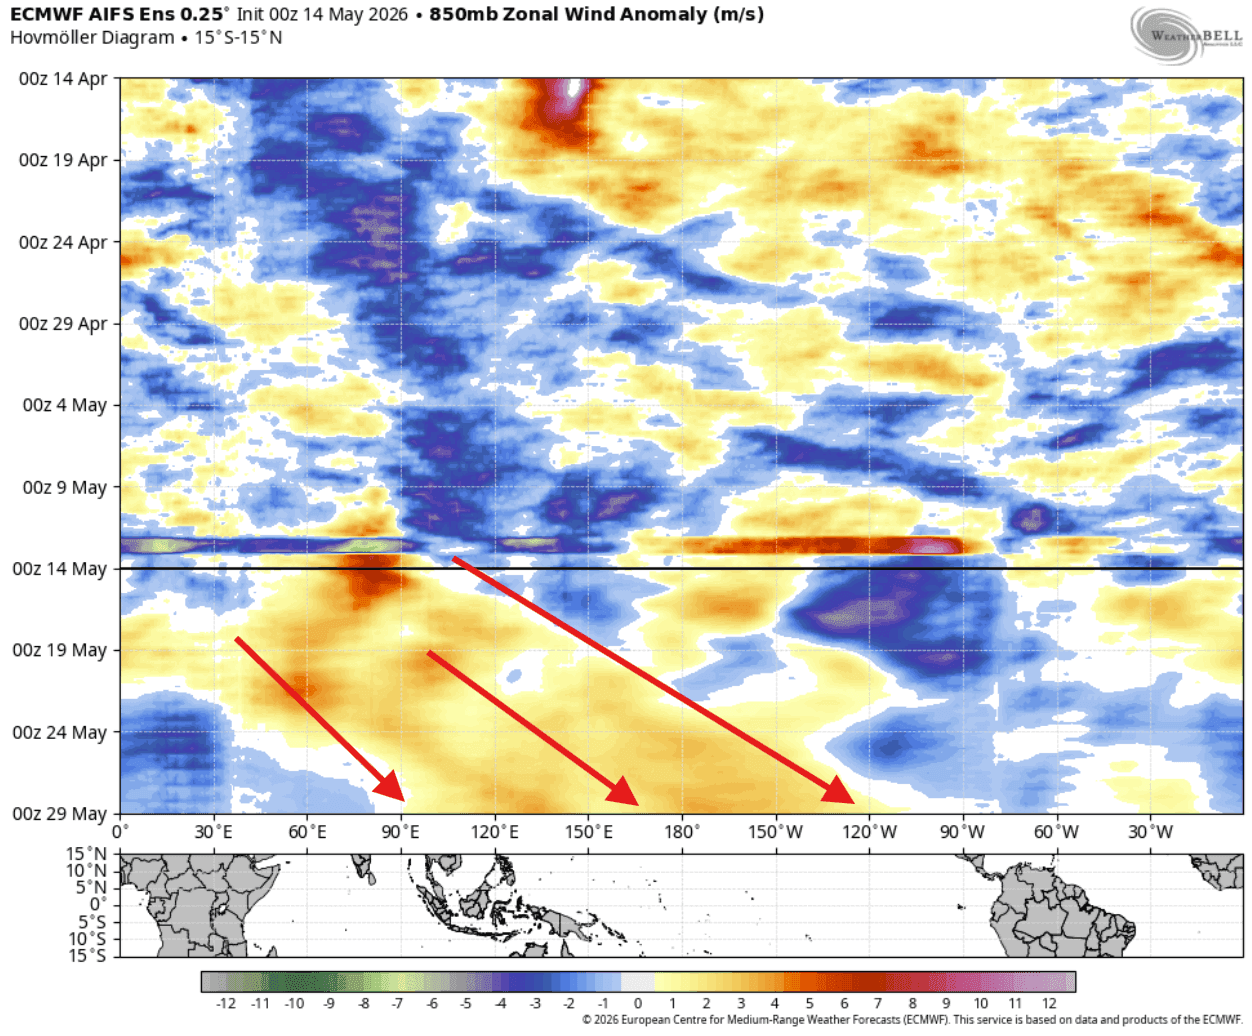
These subsurface Kelvin waves are driven by the westerly wind bursts or weaker trade winds, pushing the warmer subsurface ocean waters to the east, where they rise to the surface. This is a direct example of how the atmosphere can drive ocean changes, and the forecast below shows a new round of westerly wind anomaly forming across the tropical Pacific.
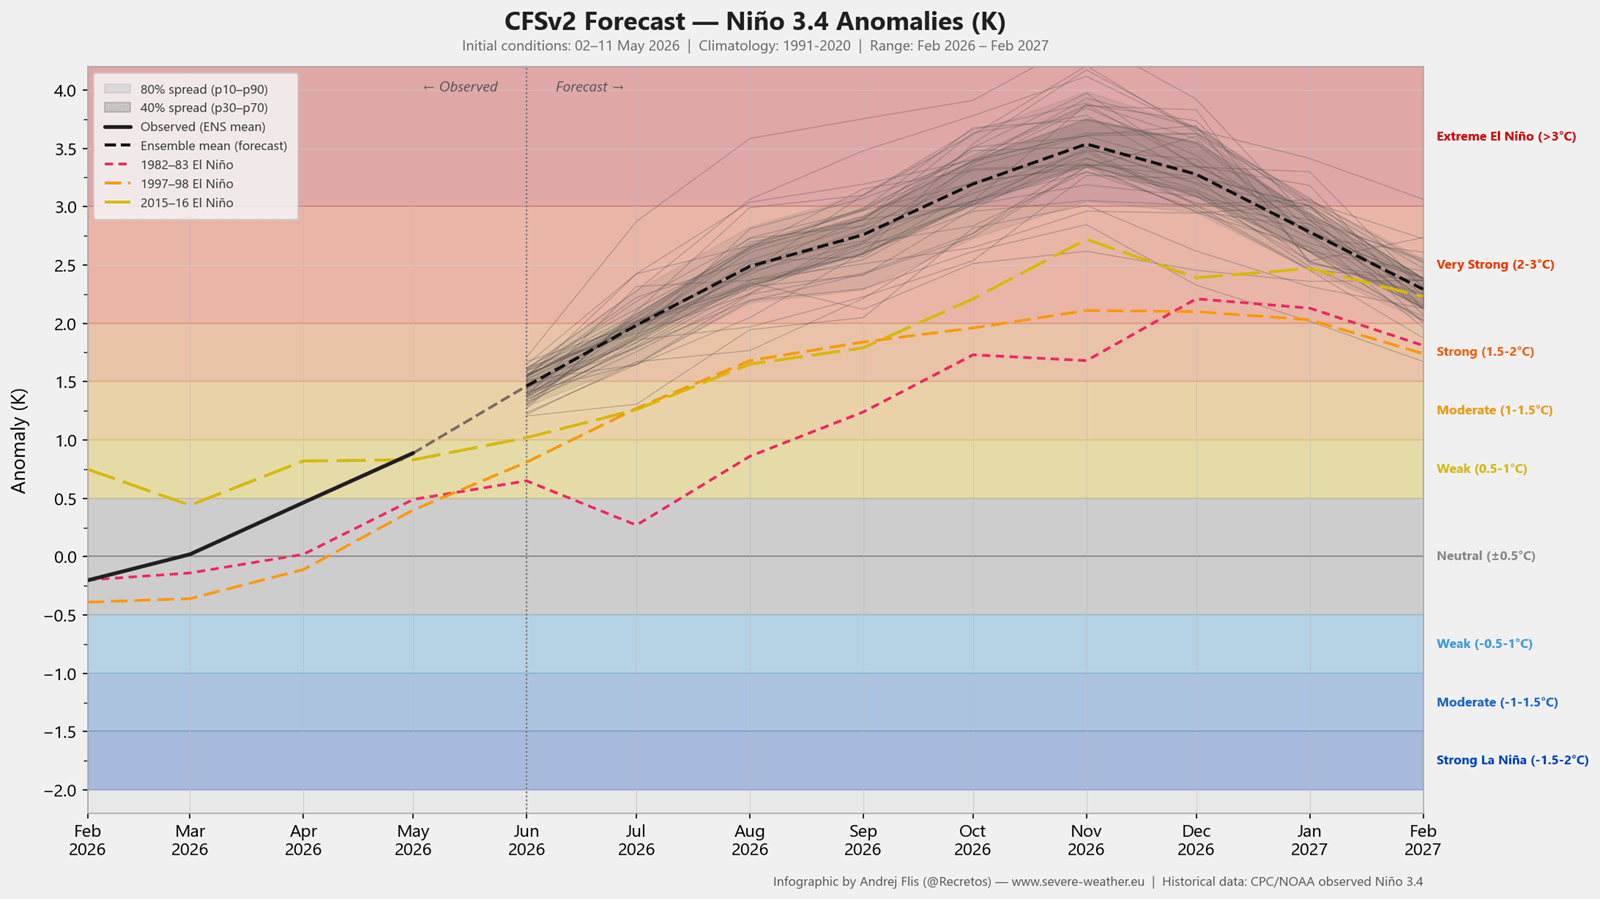
This is also reflected in the seasonal forecasts, which currently indicate we could be facing a record-breaking El Niño event this year and next.
Seasonal Evolution: Tracking the Rapid Transition Toward a Super El Niño
A Super El Niño is scientifically recognized when sea surface temperature anomalies in the Niño3.4 region exceed a threshold of +2.0 or higher above the average. This is used to identify the strongest events and potentially extreme events, which tend to have a higher impact on the global weather system.
Below is the latest ENSO forecast from NCEP CFSv2 model. It shows a very strong El Niño developing, rivaling and exceeding the strongest Super El Niño events of recent history. The development is also rapid enough to already have a direct impact on the summer weather patterns and the summer storm season across the United States, Canada, and Europe.
A Super El Niño event leads to more extreme weather shifts and can turn normal seasonal changes into high-impact events like massive flooding, severe droughts, severe storms, and significantly altered pressure system tracks that can affect the entire planet.
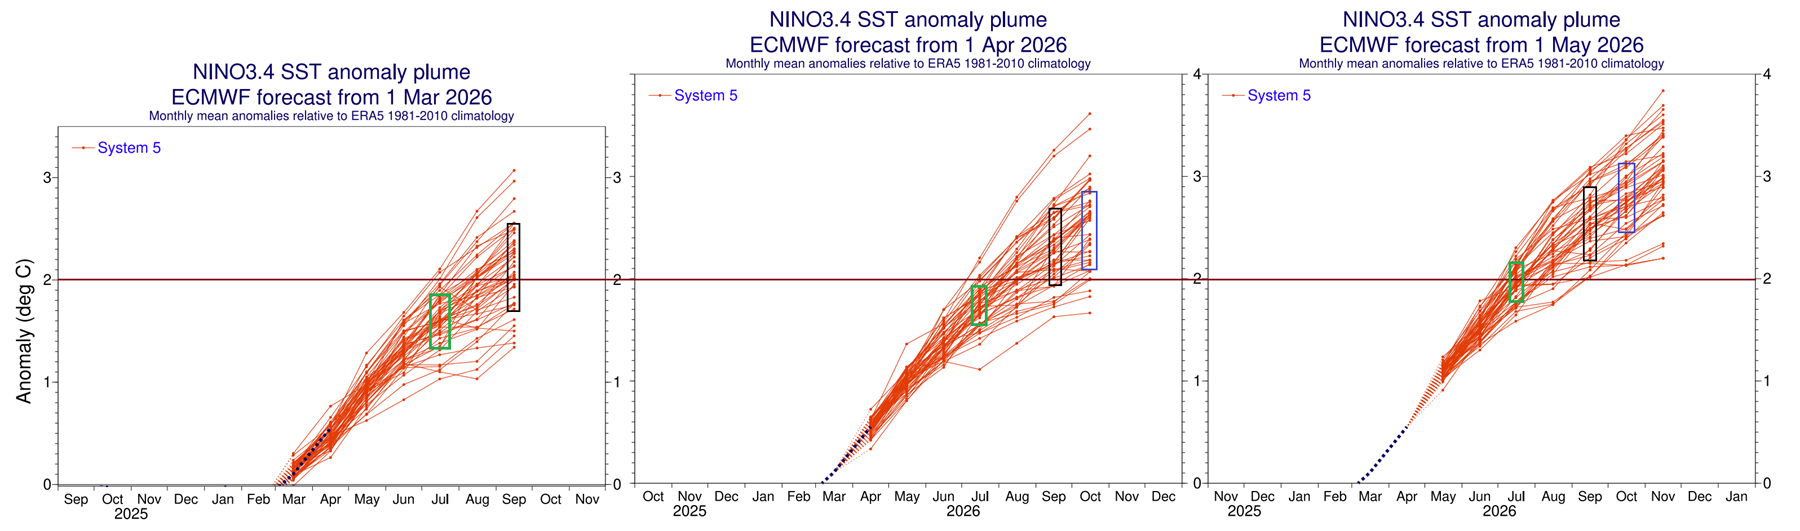
We are also observing a trend with new forecasts, where each new run shows a stronger event. You can see this below in the last three ECMWF forecasts for the main ENSO region, released in March, April, and May. You can clearly see that each new run shows a stronger event, with the marked months rising higher in each run.
This is usually because the latest analysis data is always used to produce a forecast. And the closer we are to the development of El Niño, the better the analysis is, and the model has a better understanding of the forecast’s starting point.
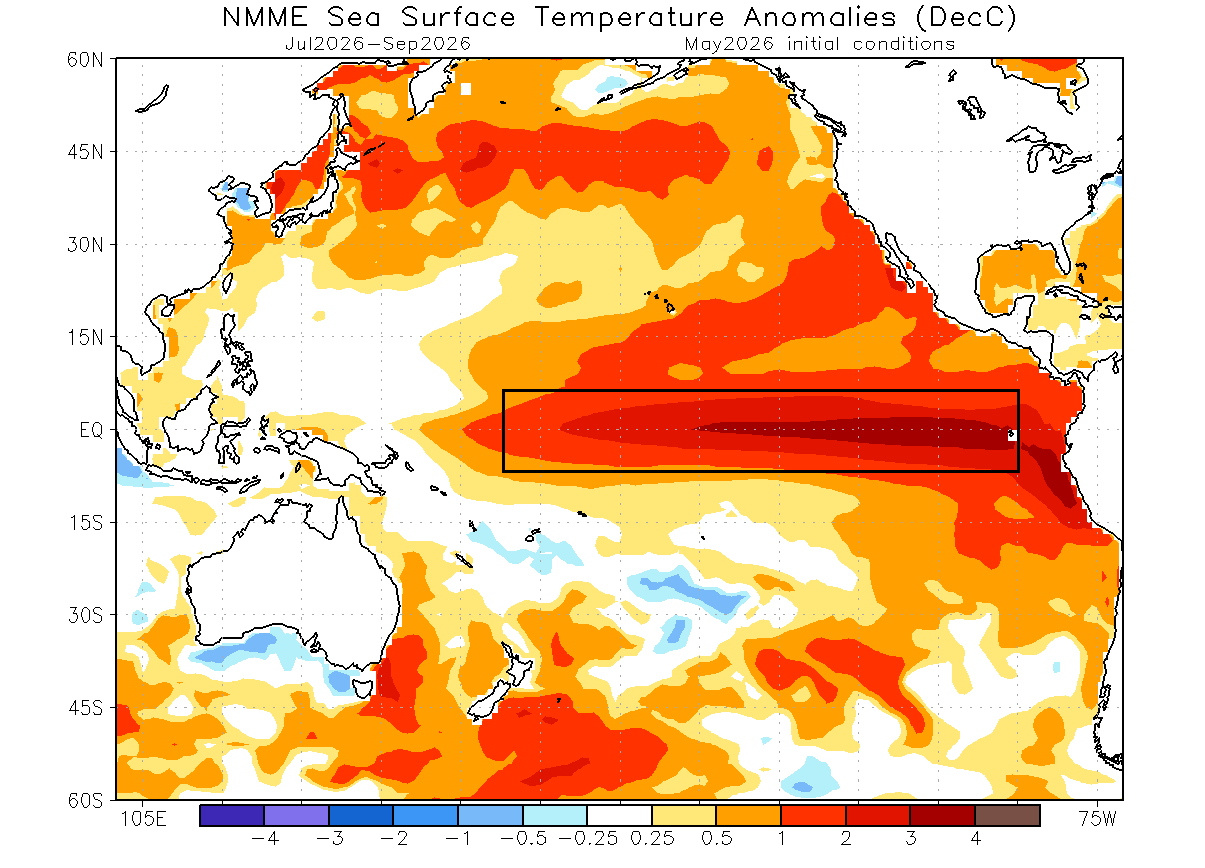
The stronger trend is also evident on the joint North American season model, NMME. The latest NMME forecast for the mid-late Summer period shows a strong El Niño anomaly already present across the tropical Pacific. The peak values already exceed +3 degrees across the ENSO region, marking a truly strong Super El Niño event, and the true peak is yet to come later, towards the cold weather season.
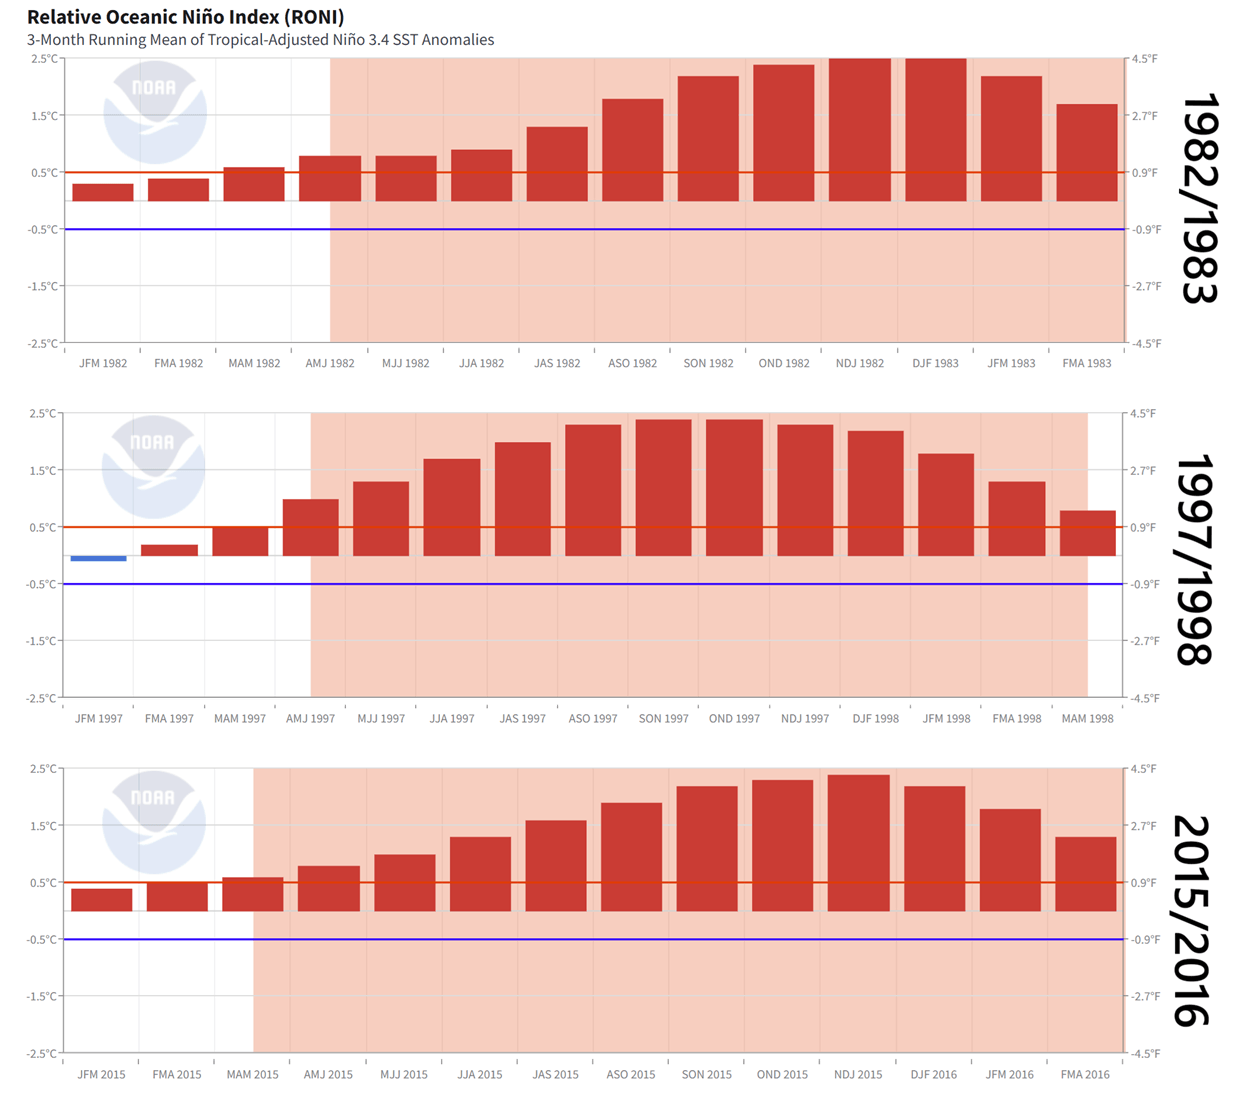
Below are graphs from NCEI, showing the monthly progression of the last 3 super El Niño events, starting in spring and peaking during the late Fall/early Winter season. With this progress in mind, the 2026/2027 event could reach near +3 degrees average, with local anomalies exceeding +4 degrees, making this potentially a historically strong event.
The latest forecasts are also continuing a trend of showing a stronger El Niño with each new forecast run, as they adjust to the latest atmospheric development, rivaling the strongest events of the past.
First Atmospheric Changes: Summer 2026 Weather Shift in the United States and Canada
The El Niño forecasts show rapid intensification, so we can assume clear atmospheric impacts already as meteorological Summer begins.
To search for potential El Niño influence in the atmosphere, we can look at the mid-summer Velocity Potential forecast (July 2026). These parameters indicate areas of rising and sinking air in the atmosphere. The latest forecast below shows a strong anomaly of rising air in the Pacific and sinking air in the Indian Ocean, displaying a strong Walker Cell circulation. This confirms a very clear El Niño configuration in the atmosphere this Summer.
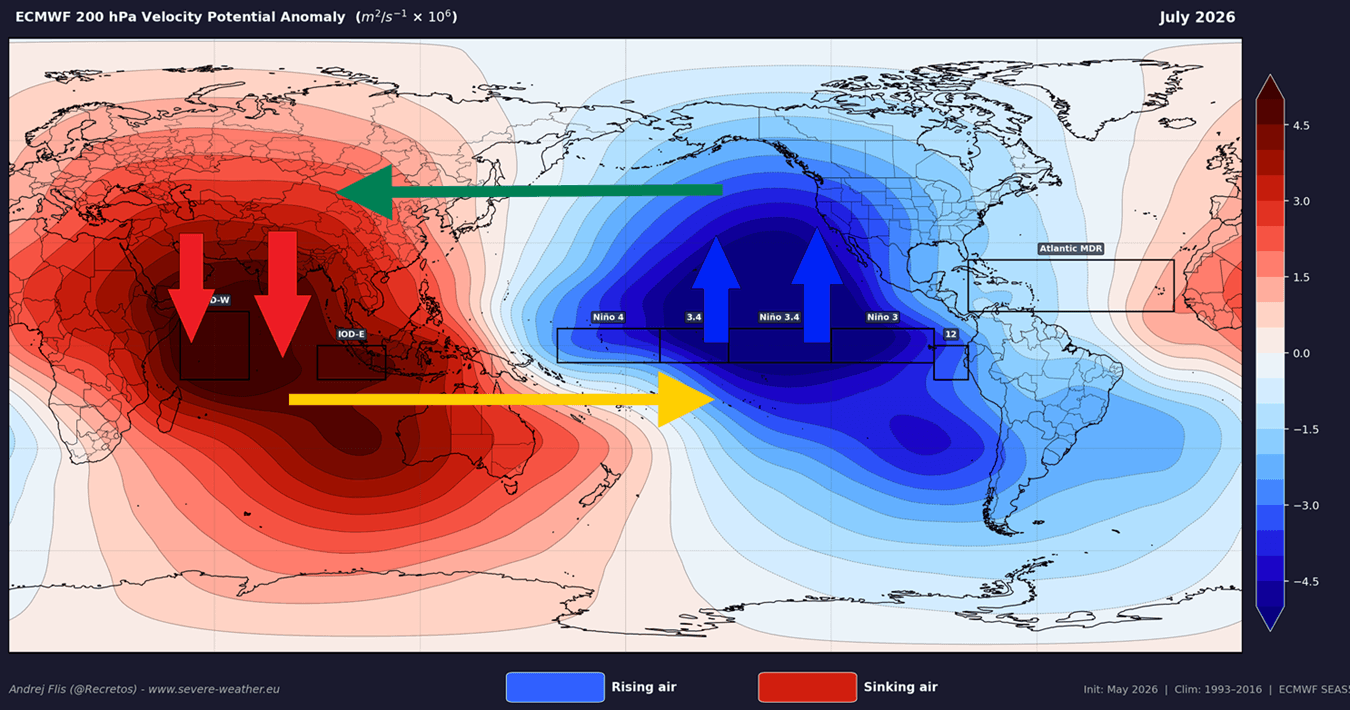
This is the same circulation pattern that we showed in the schematic at the start of the article, with heavy lifting in the central and eastern tropical Pacific and subsidence in the west and the Indian Ocean.
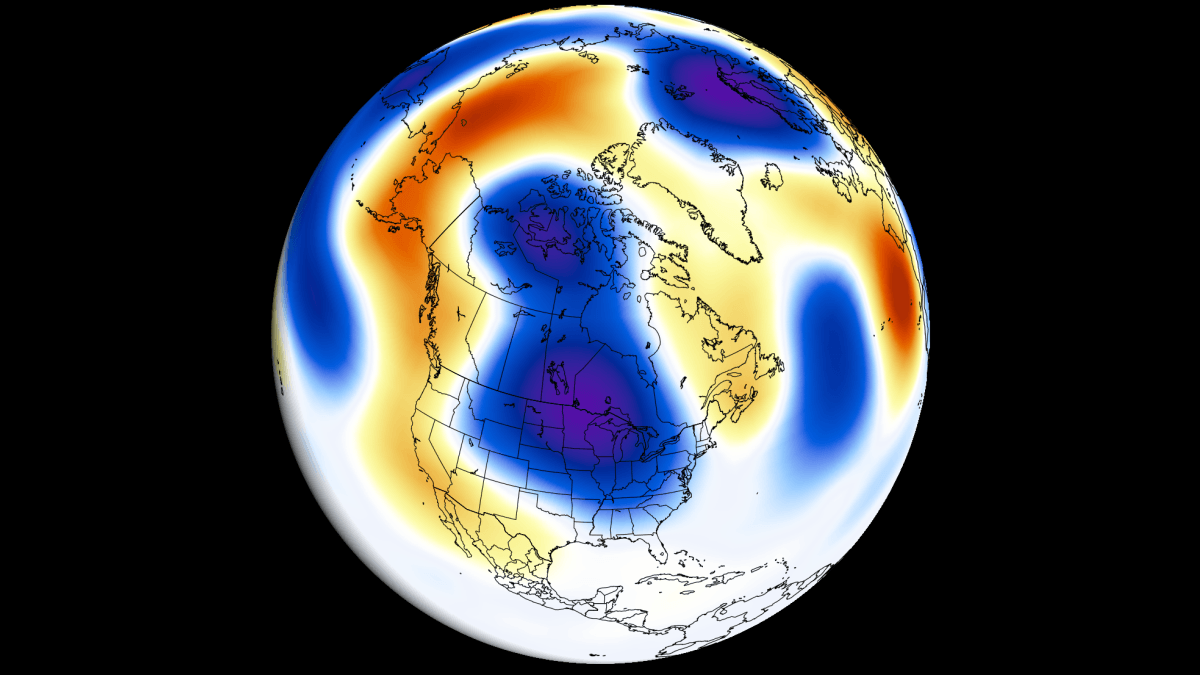
As for the actual El Niño influence, we can look at the jet stream schematic below by NASA Science. El Niño usually alters both the Polar and the Pacific jet stream. It has a clear impact on the Pacific jet stream, making it stronger and stretching it eastward, bringing wet conditions to the western and southern United States.
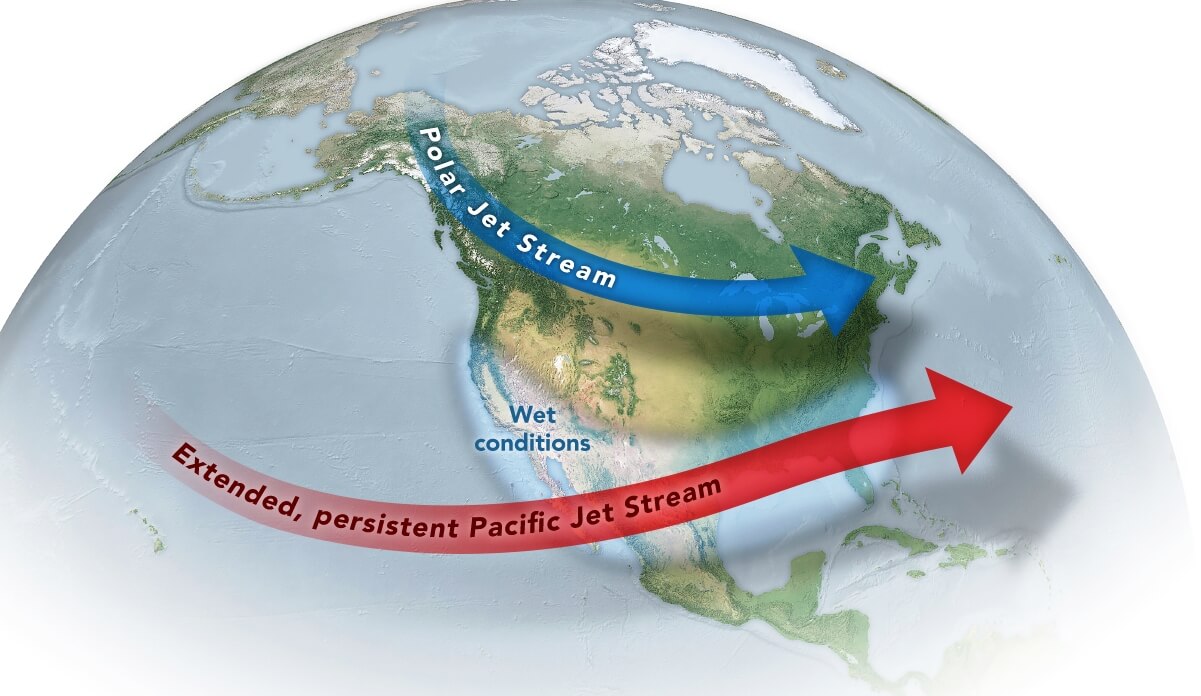
This shows the idea of a displaced Polar jet stream over eastern Canada and a strengthening Pacific jet stream over the southern United States.
Looking below over the United States and Canada, we can see the weather patterns during the Summer of the developing Super El Niño events during the past decades. The temperature patterns show a tendency for below-normal temperatures over the Midwest, the eastern and central United States, and eastern Canada. Warmer temperatures prevail in the west and south parts of the United States.
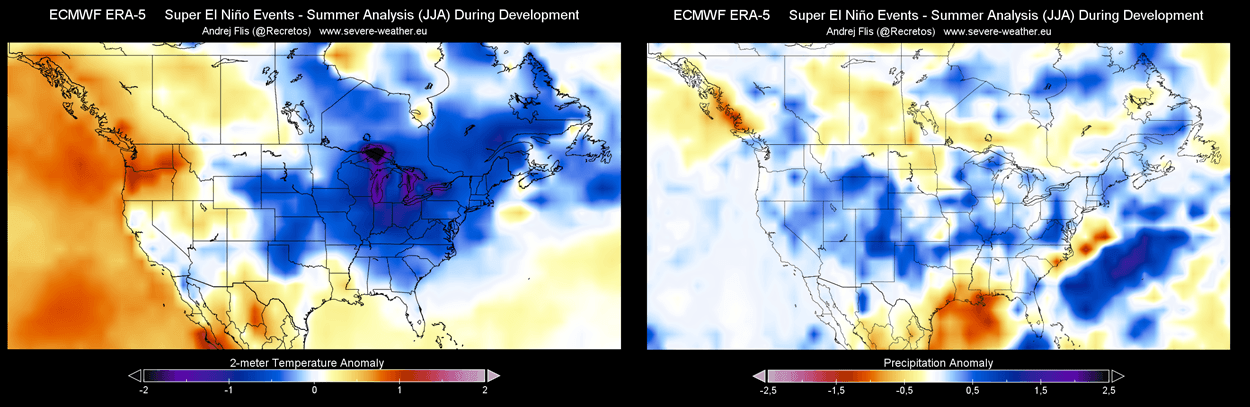
Here, we have to add that the lower temperatures are also due to the past decades being used, which exhibit lower mean temperatures.
The right panel above shows precipitation anomalies, with a corridor of increased rainfall over the western and southwestern U.S., extending eastward. Less rainfall in the Super El Niño Summer is indicated over the far southern U.S. and the Gulf area, and also over the Northern Plains and southern Canada.
If we stay at precipitation, we can compare it directly to the latest Summer 2026 multi-model forecast by Copernicus. It shows a very similar rainfall anomaly, with increased precipitation over the western United States, pushing the corridor east. Also, we can see less rainfall over the far south and the Gulf area and over the Northern Plains and southern Canada, mirroring the past event analysis above.
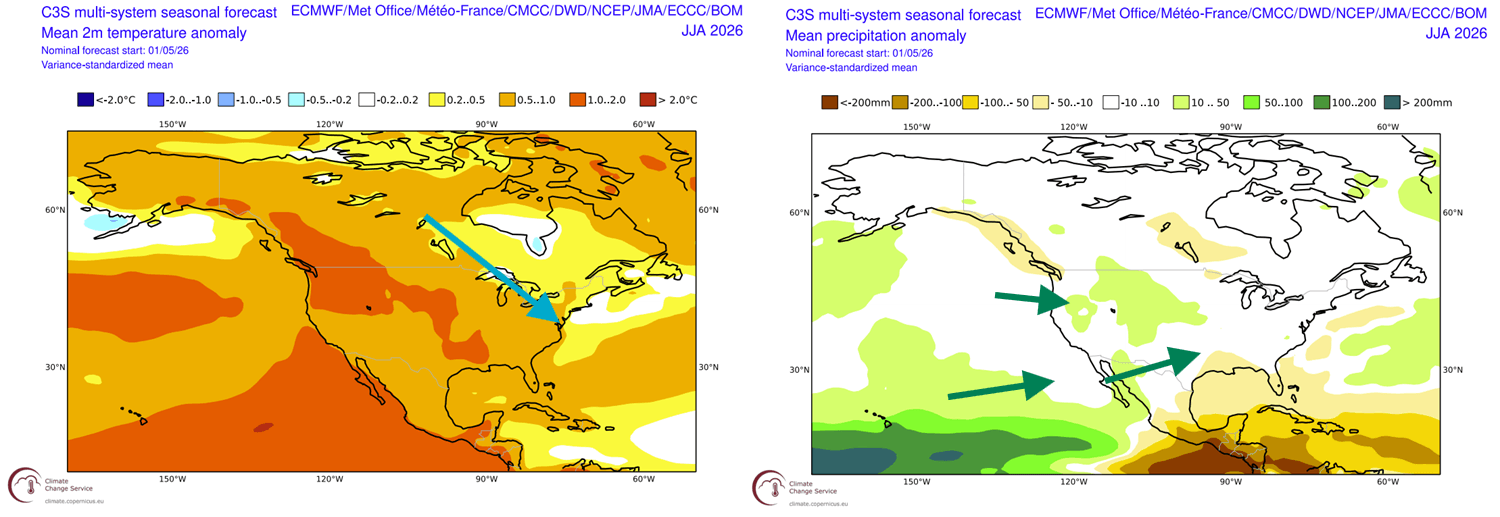
But looking at the temperature forecast, we see quite a difference at first glance. But looking closely, we can see the exact same tendency of a more northerly flow over eastern Canada and the eastern United States. The overall anomalies show above-normal summer temperatures, but with these long-range indicators, sometimes the patterns itself tells a bigger story.
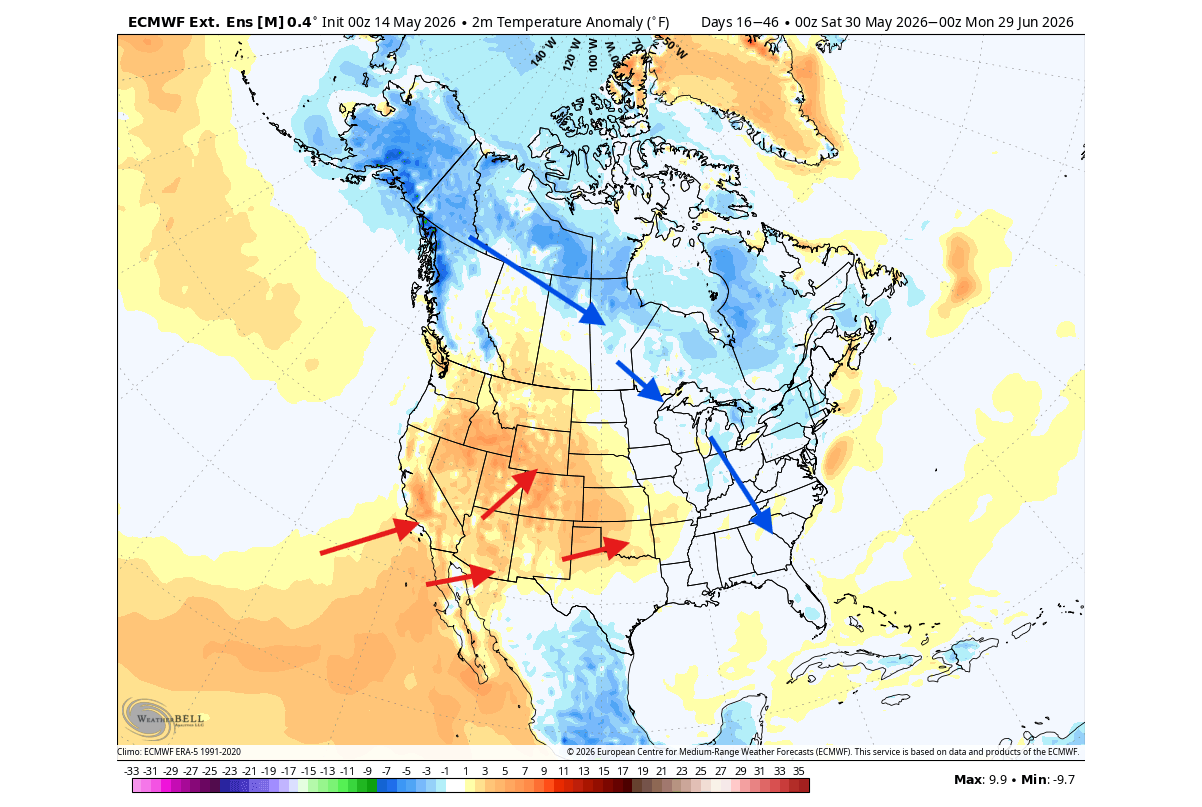
If we look at the latest extended range-range forecast, issued every day, we can observe a developing trend. The image below shows the June 2026 temperature forecast, and here we can see a much clearer pattern, closer to the past analysis. A colder than normal area expanding from the northwest into the northern and eastern U.S., and a strengthening Pacific jet stream pushing a warmer anomaly in the west and south.
When El Niño alters jet stream and pressure patterns, it also directly affects thunderstorm development during the summer. We decided to create some specialized graphics that will help us understand what happens with hail and tornado events in a Summer during a developing Super El Niño.
Storm Season Impacts: What Super El Niño Means for Hail and Tornado Frequency in the United States
The image below shows hail frequency anomaly, indicating a notable increase in reports across the west-central and Northern Plains, the Intermountain West, the Southwest, and Florida. At the same time, much of the Northeast and the Gulf Coast region experiences a decrease in hail activity compared to the long-term average.
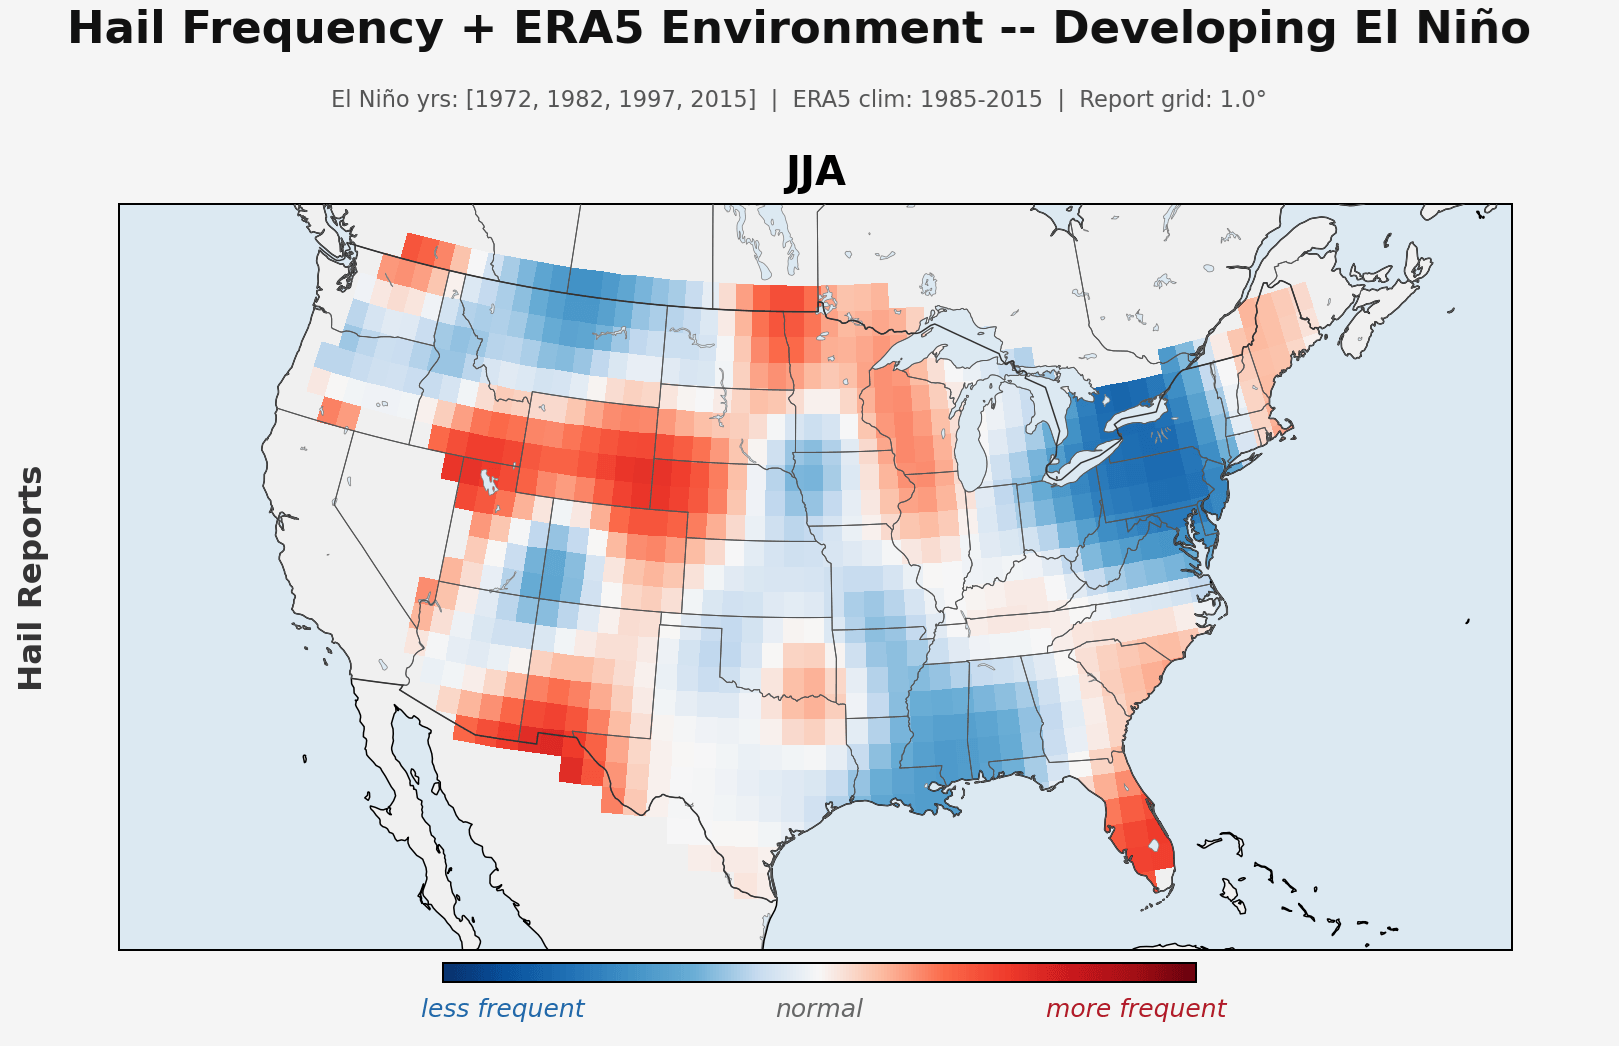
These patterns suggest that the atmospheric environment during a developing El Niño favors larger-scale hail events in the midsection of the U.S. and the far Southeast, associated with the shift in the Pacific jet stream.
In Summary:
- States with potential for increased hail events: Colorado, Wyoming, Nebraska, Kansas, Oklahoma, Northern Texas, Florida, Georgia, South Carolina, and North Carolina.
- States with potential for decreased hail events: Pennsylvania, New York, New Jersey, Maryland, Virginia, Louisiana, Mississippi, Alabama, and Arkansas.
The tornado event analysis for developing Super El Niño summers shows a shift in tornado activity, with a visible spike in frequency over Florida and parts of the west-central Plains. In contrast, a broad area of the Midwest, the Ohio Valley, and the Southern U.S. shows a suppression of tornadic reports, as indicated by the blue shading.
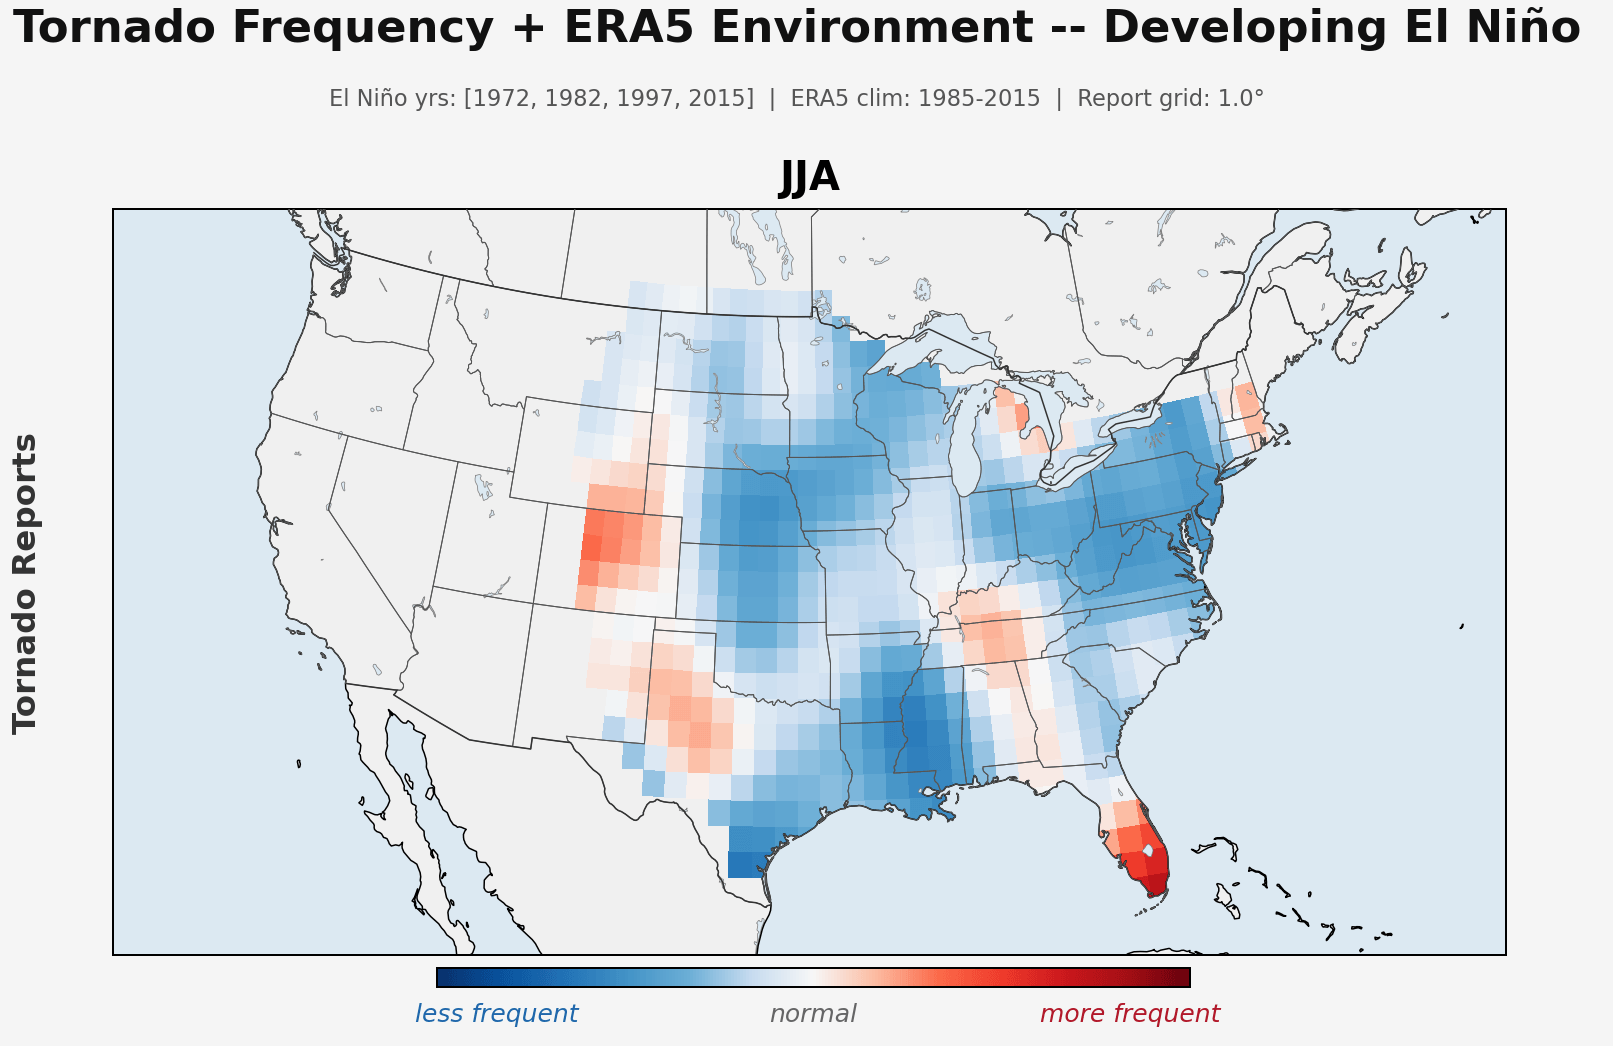
This reveals a tightening of the active storm corridors, with tornadic potential becoming more localized rather than widespread across the traditional “Tornado Alley” regions during these summer months. We can also see a potential suppression over the east and north, due to the more northerly flow, less favorable for significant tornadic development on the rear side of a low-pressure area.
In Summary:
- States with potential for increased tornado events: Florida (most significant anomaly), Colorado, Western Kansas, Western Nebraska, the Oklahoma/Texas Panhandles, and New Mexico.
- States with potential for decreased tornado events: Illinois, Indiana, Ohio, Kentucky, Missouri, Iowa, Southern Minnesota, Wisconsin, Louisiana, and Mississippi.
But while a Super El Niño has a much more direct impact on the United States and Canada, we can also find a signal for the summer and storms over Europe by analyzing the summers of past developing Super events.
Europe Summer Outlook: Weather Anomalies and Severe Storm Potential
Looking at the European Super El Niño summers, we first see a trend of above-normal temperatures over the central and northern parts of the continent. Below-normal temperatures were measured over the western and southeastern parts, with the UK also under a normal-to-below-normal tendency. Here, we also have to add that this is a mix of several event years, some of which are from past decades with lower mean temperatures.
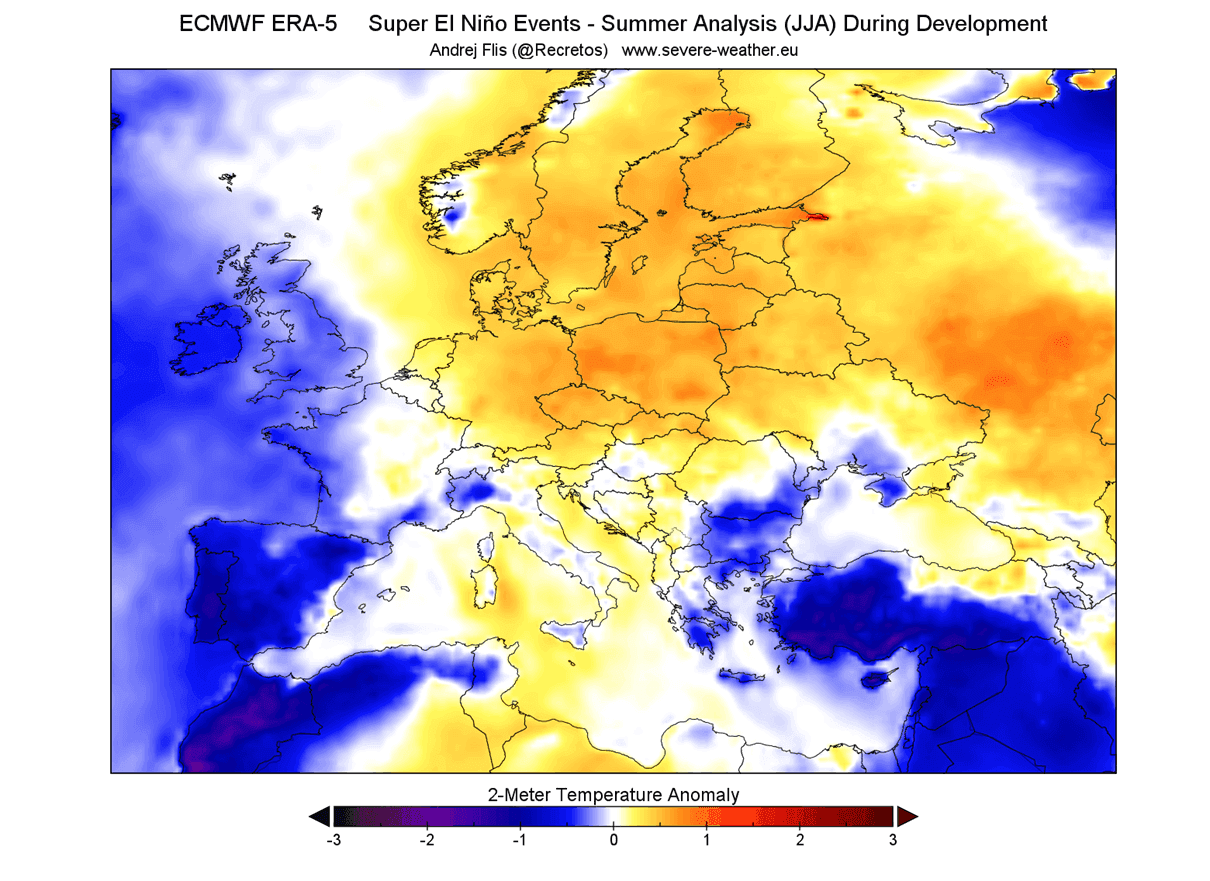
This pattern reflects a high-pressure anomaly over the northern parts of Europe, with a low-pressure anomaly over the southwestern and southeastern parts, almost like an Omega blocking pattern.
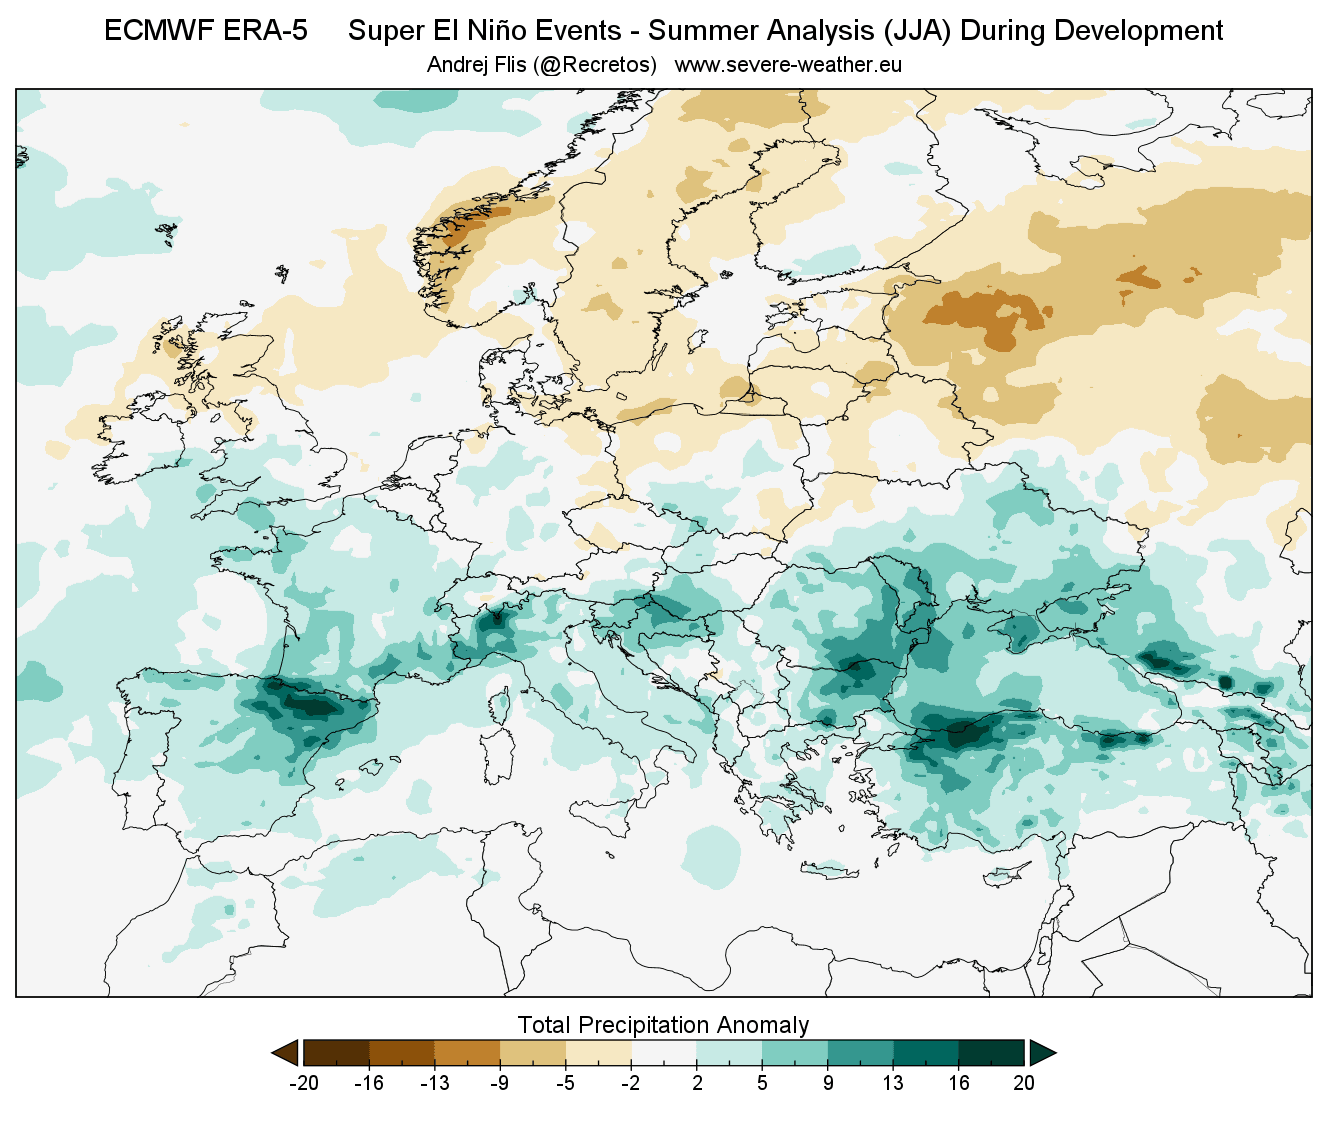
The precipitation analysis shows a very interesting pattern, with the southern half of the continent experiencing increased rainfall. The southern UK also shows more rainfall, likely due to the impact of the low-pressure area over the western parts. The northern half of Europe shows less rainfall due to the high-pressure system over the area.
Now, comparing this to the actual latest forecast, we can see a similar core of warmer anomalies over the central area, decreasing towards the west. We do not see the below-normal anomalies, as this is a multi-model mix, and the forecasts generally poorly show regions with proper below-normal summer temperatures. It is also due to a lack of a stronger low-pressure area in the western parts.
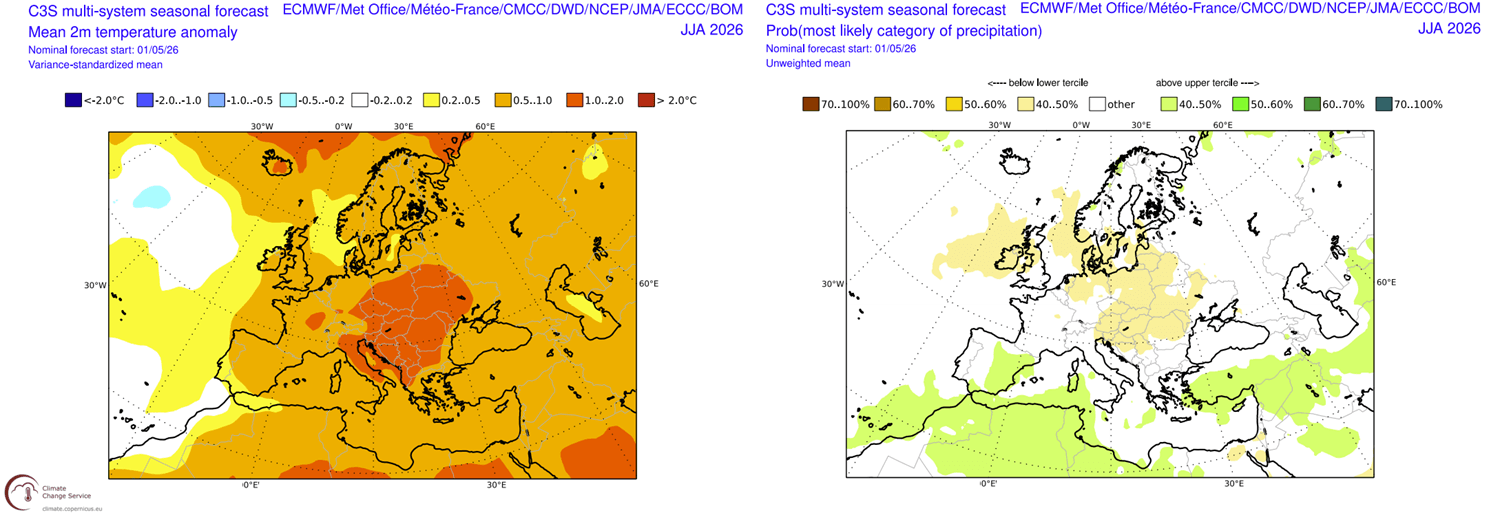
The rainfall anomaly forecast shows more rain over the southern parts, which is consistent with the past analysis. But the drier area is also placed more to the south than the analysis, putting the drier part into Central Europe. Both these forecasts indicate drought risk in the central, north-central, and east-central parts.
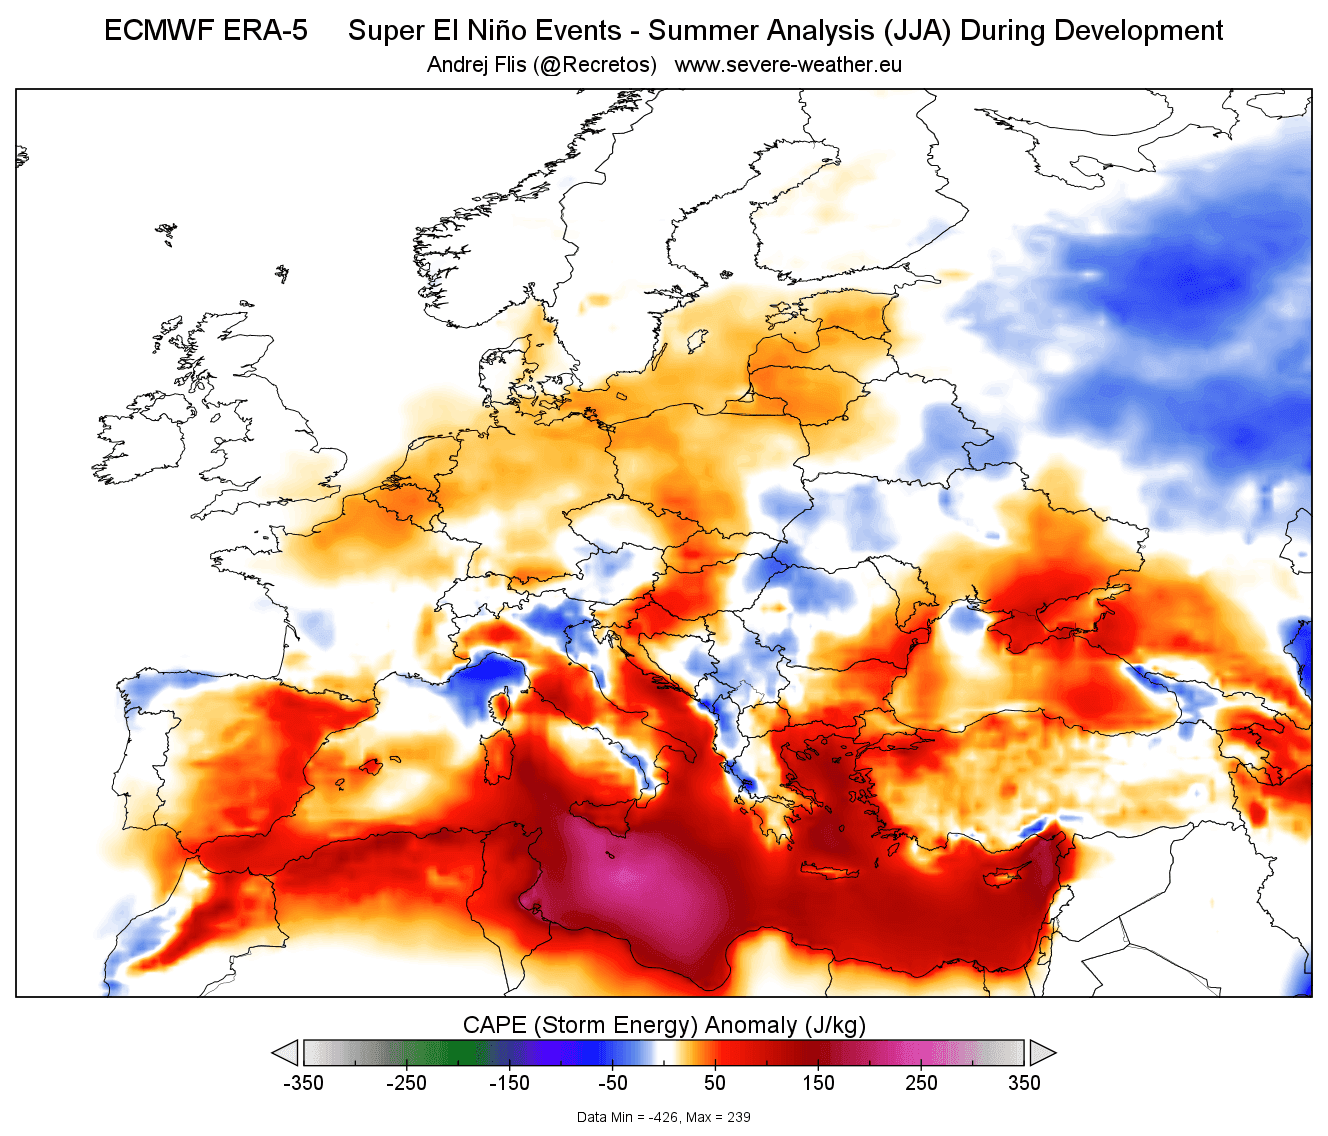
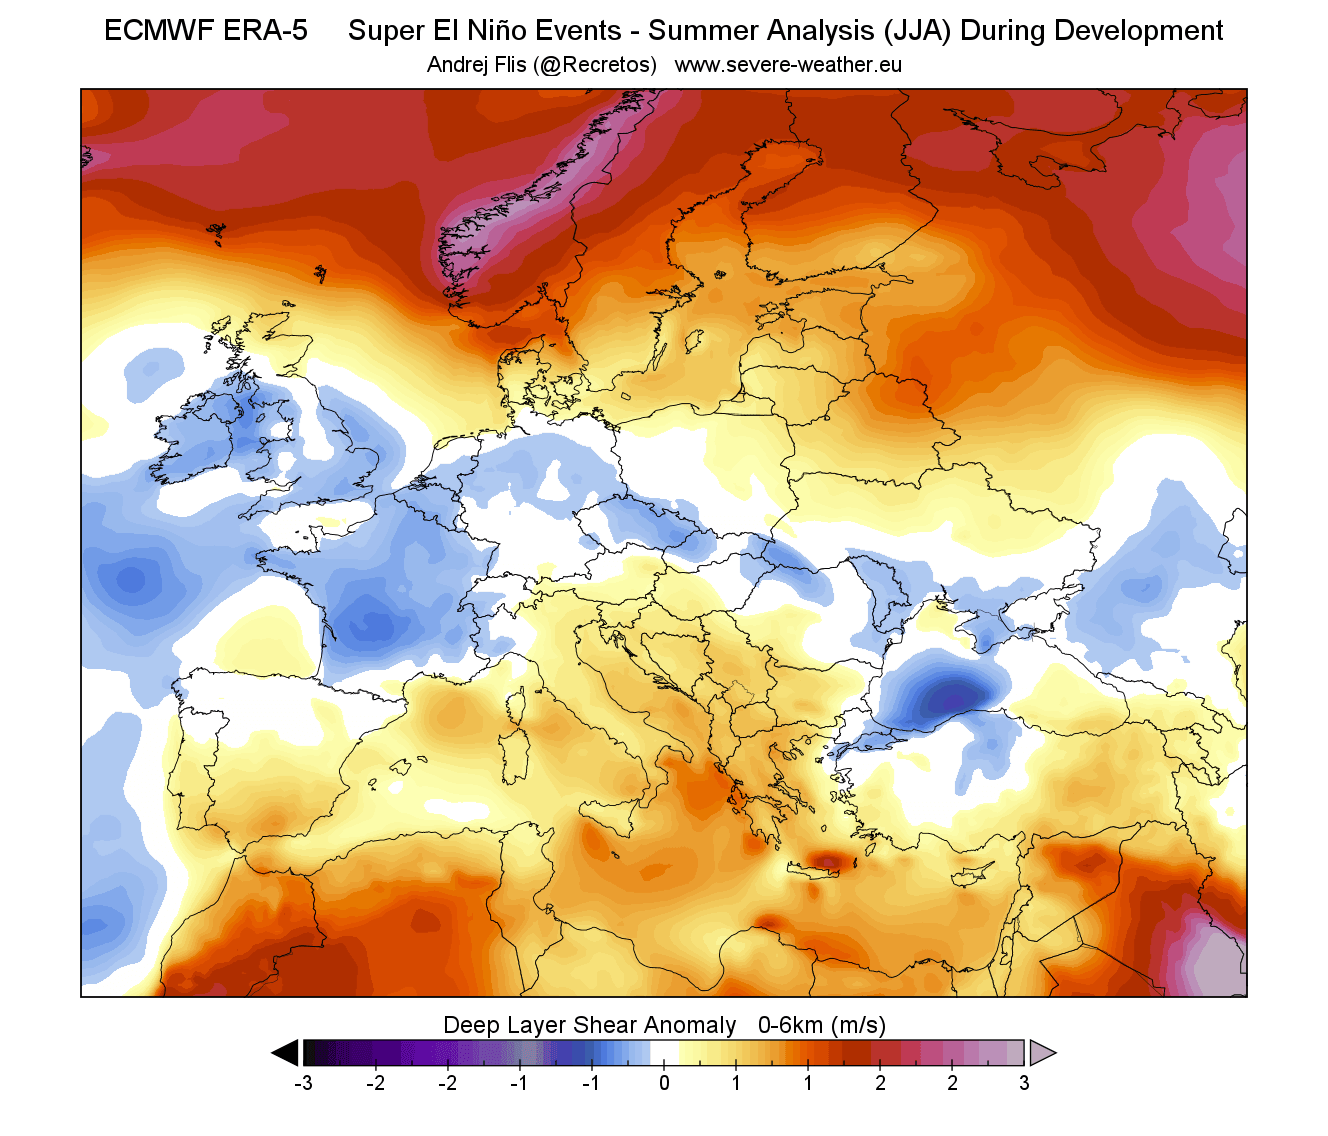
We do not have a proper history of storm event reports over Europe to cover several Super El Niño events. But we can look at two severe storm parameters: CAPE, which is essentially the potential energy that can be released in a storm (more = stronger storm), and atmospheric wind shear, which is basically the change of wind speed and direction with altitude, and allows a more organized thunderstorm if present.
First, if we look at CAPE for the Super El Niño summers, we can see an obvious increase acorss the southern half. This indicates that a more volatile environment develops across the entire southern half during a Super El Niño. But we can also see more available energy over the central and north-central parts.
In the wind shear analysis, we can see that wind shear is below normal over the western and north-central parts. Despite more energy, this limits the potential for severe storms. But we can see increased wind shear over the southern parts, which, together with more energy, creates a very supportive environment over the southern half of the continent and also over the south-central parts.
Overall, we are starting to see a very clear global signal that is detected (and expected) during a developing Super El Niño event. And with a potentially record-strong event developing for 2026, this gives us a very clear idea of what to expect from seasonal weather development. Of course, each Super El Niño year can have its own variations.
Forecast and analysis images in this article (if not specified otherwise) are from the Copernicus project and WeatherBell, using a commercial license.
We will keep you updated on global weather development and long-range outlooks, so bookmark our page. Also, if you have seen this article in the Google App (Discover) feed, click the like button to see more of our forecasts and our latest articles on weather and nature in general.
Don’t miss:
The Pattern Change: Europe’s Cold Trough Slams South, Severe Weather Follows