February 2025 is about to start, with the latest weather forecasts indicating a very dynamic month over the United States and Canada. After the power struggle between the cold and warmth at the start of the month, another Polar Vortex lobe looms for the United States around mid-month.
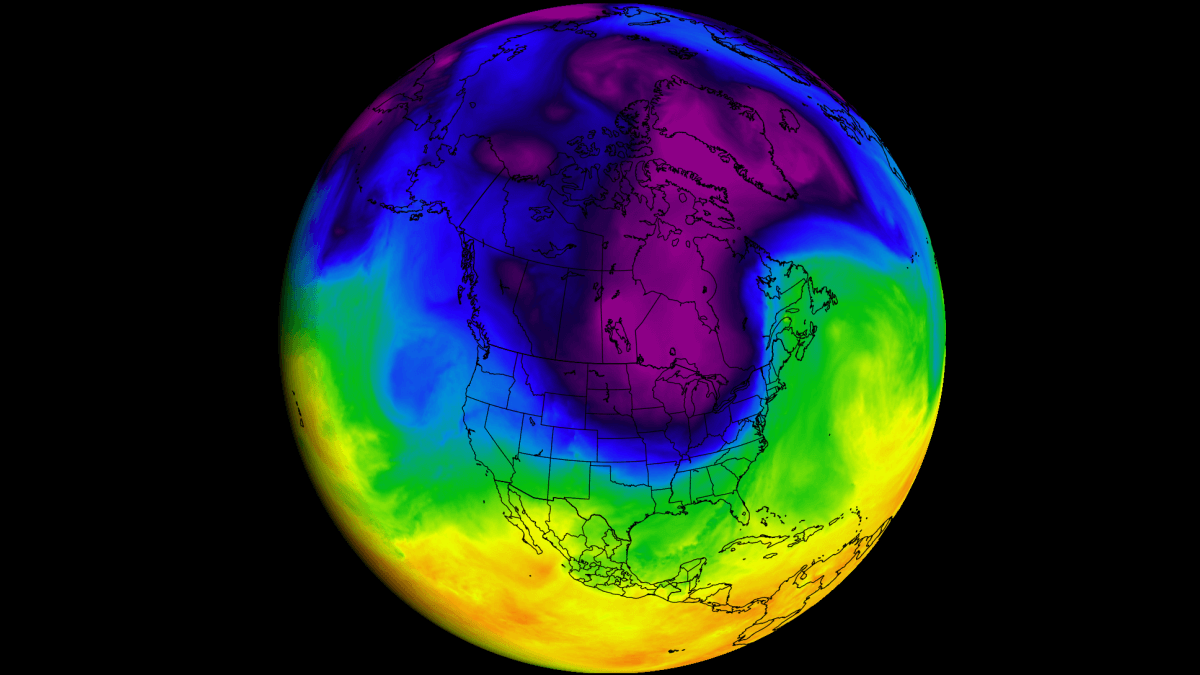
The continuous low-pressure systems over Canada helped to initiate large-scale cold air transport from the Arctic into the United States and Canada, also powered by the Polar Vortex in the stratosphere.
We continue to see the presence of the low-pressure area over Canada in the forecast for February. But the forecast now indicates an interesting core movement of the Polar Vortex in the stratosphere, likely to initiate another deep cold event around mid-month over the United States and Canada.
THE END OF A RECORD MONTH
As January is slowly ending, we can look at preliminary surface temperature data for the month so far. Below is the CDAS analysis, and you can see that January was colder than normal across the entire United States, apart from California and parts of Nevada. But these anomalies do not show the full picture of just how cold some days in the month were, breaking records for several years and even decades in the past.
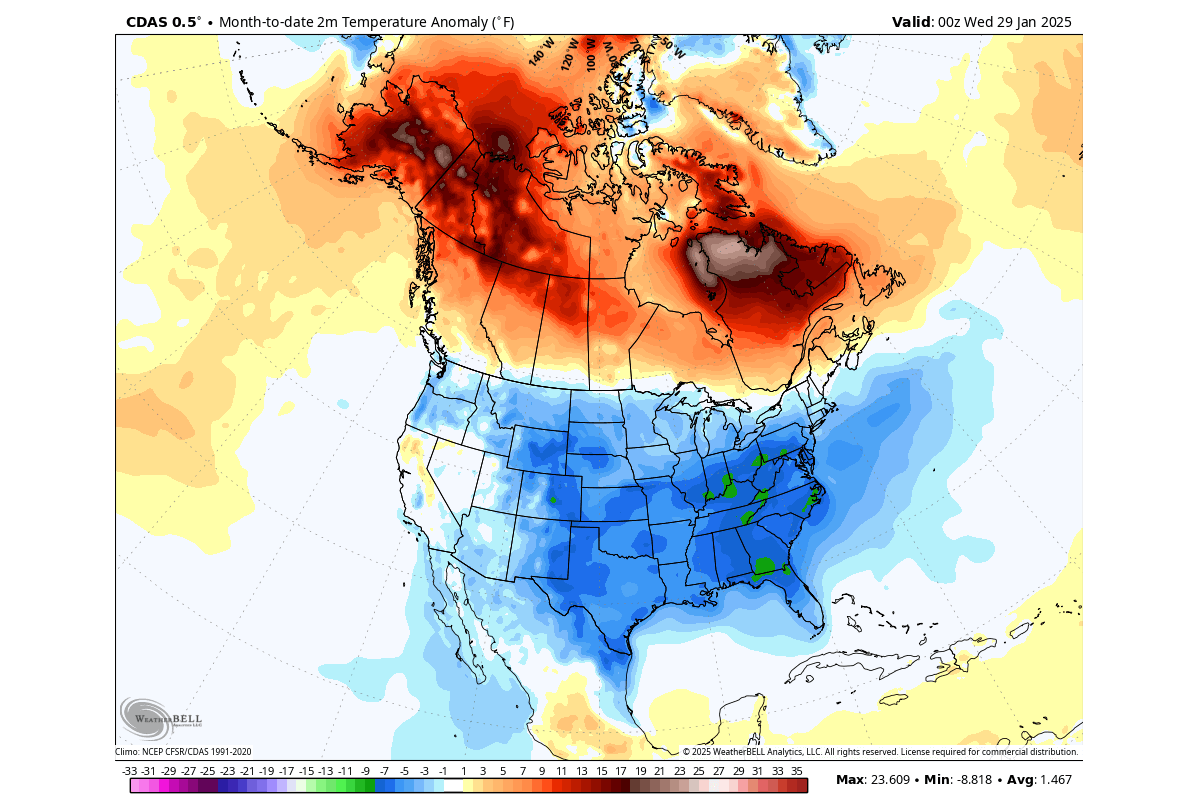
On the other hand, we can see that Canada had warmer than normal temperatures. This is an expected pattern, as while the colder air was transported further south into the United States, it was replaced by high-pressure and a warmer-than-normal airmass.
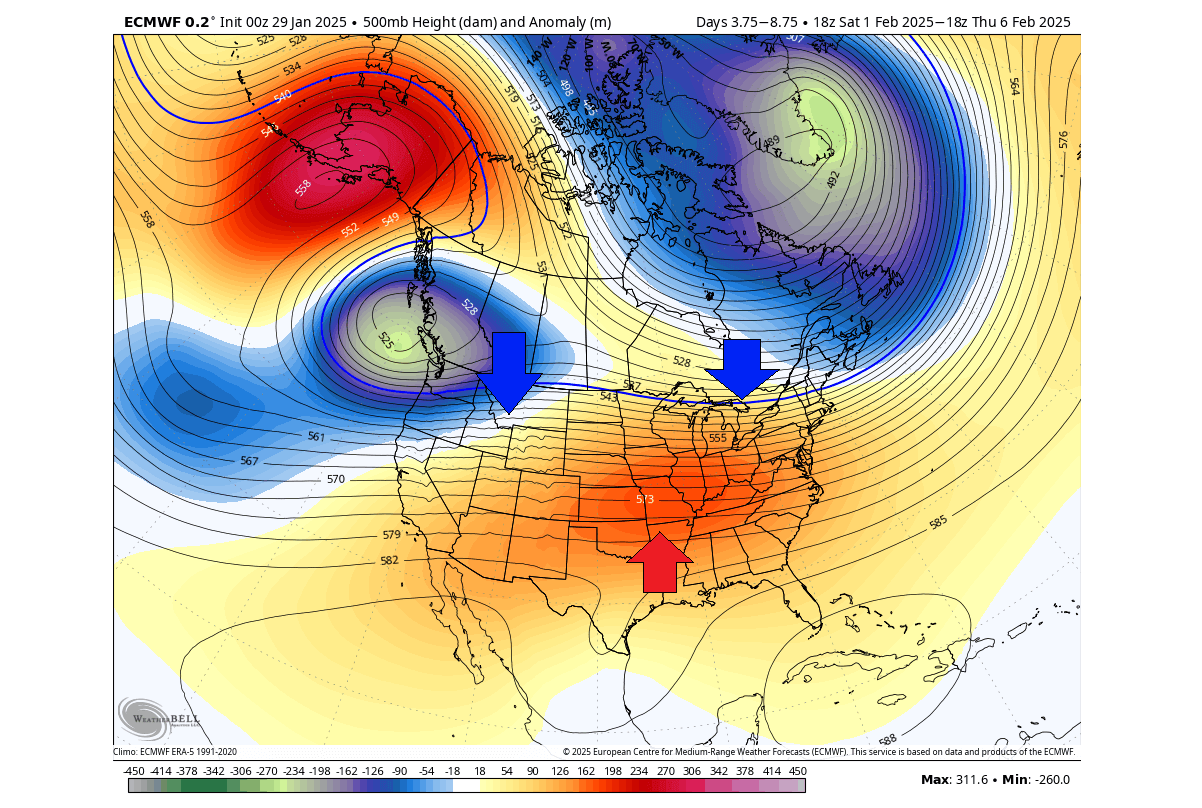
Looking at the last days of January, you see the pressure pattern forecast below. You can see a broad low-pressure area over Canada and a small low-pressure anomaly over the southern United States. A ridge rising over the eastern United States indicates the presence of a warmer airmass.
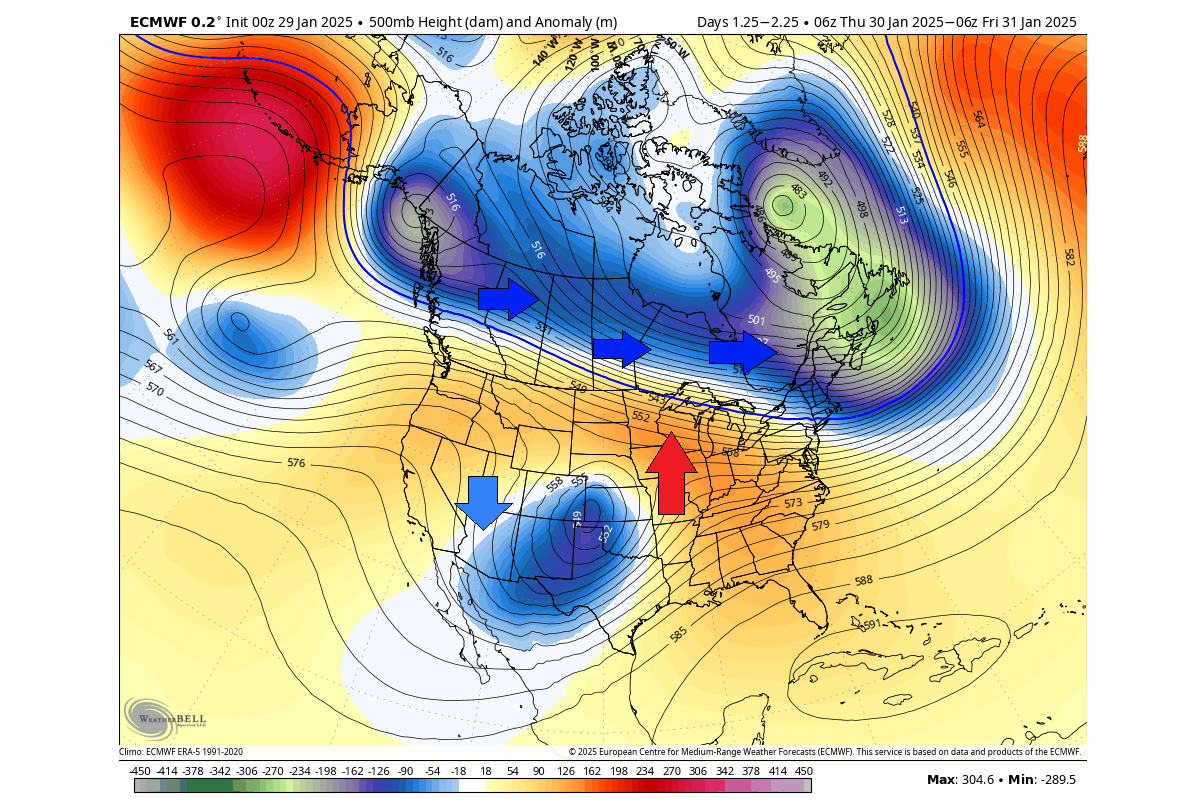
This setup creates a very specific airflow over North America: a southerly wind over the eastern and central United States, a northerly flow in the southwestern U.S., and a cold air corridor from western into southeastern Canada and the northeastern U.S.
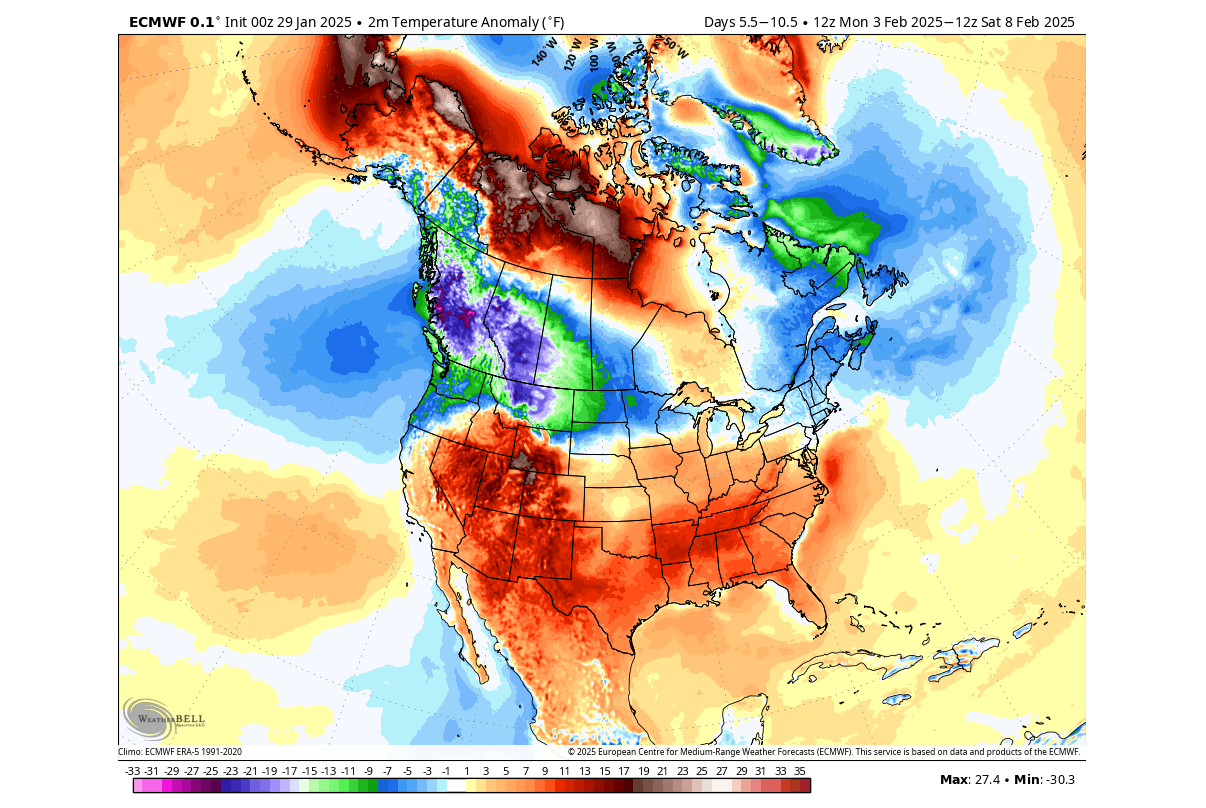
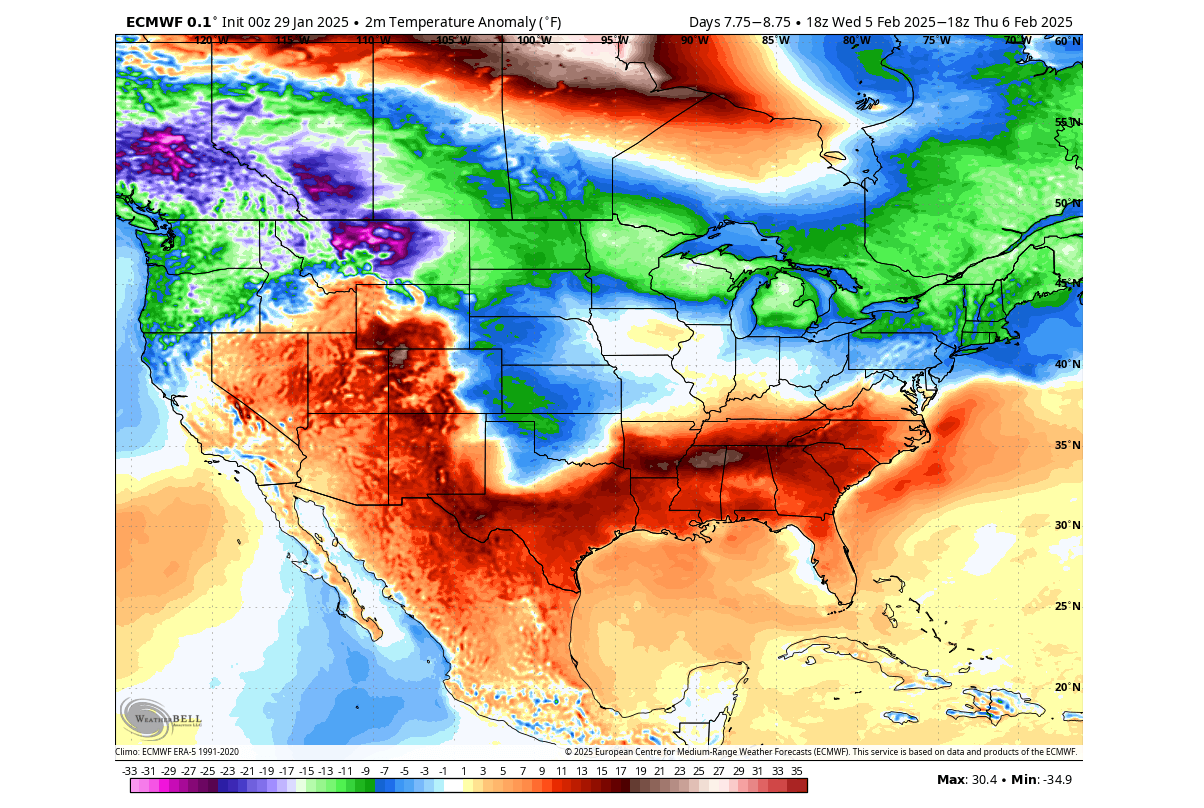
You can also see this nicely in the temperature forecast below. A warmer-than-usual airmass is being transported across the eastern half of the United States into southern Canada. There is a cool anomaly over the southwestern U.S., with a stronger cold air belt spanning from Alaska to the northeastern United States.

In late January, the average temperatures in the northern United States and southern Canada are still around or below freezing, so even a strong positive anomaly does not actually mean warm temperatures in that region. But, it is interesting to see the rapid shift in temperature anomalies as the pressure systems reposition.
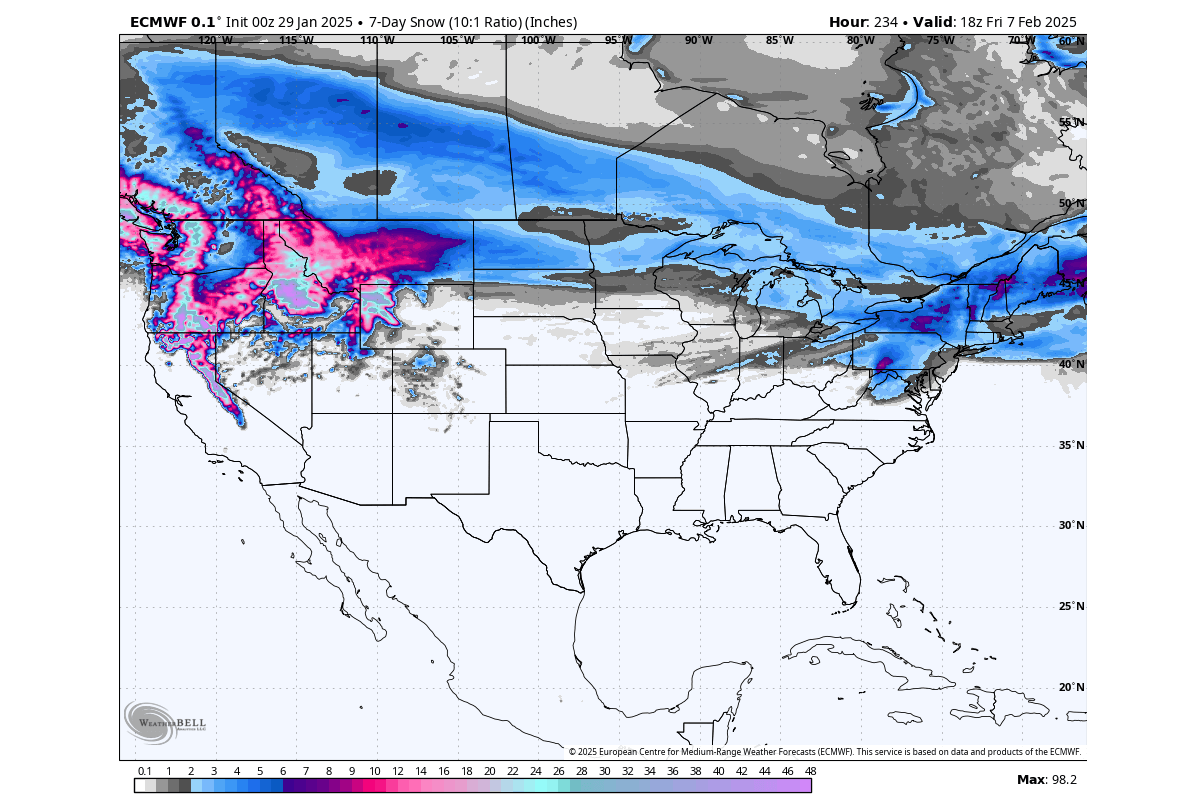
We can also take a look at the snowfall forecast. You can see that snowfall will be limited in the final days of January. It will mostly be tied to higher elevations of the Pacific Northwest and the southern Rockies. But we can also see a belt of snowfall across southern Canada, with lake-effect snow around the Great Lakes and some snowfall over the Northeastern United States.
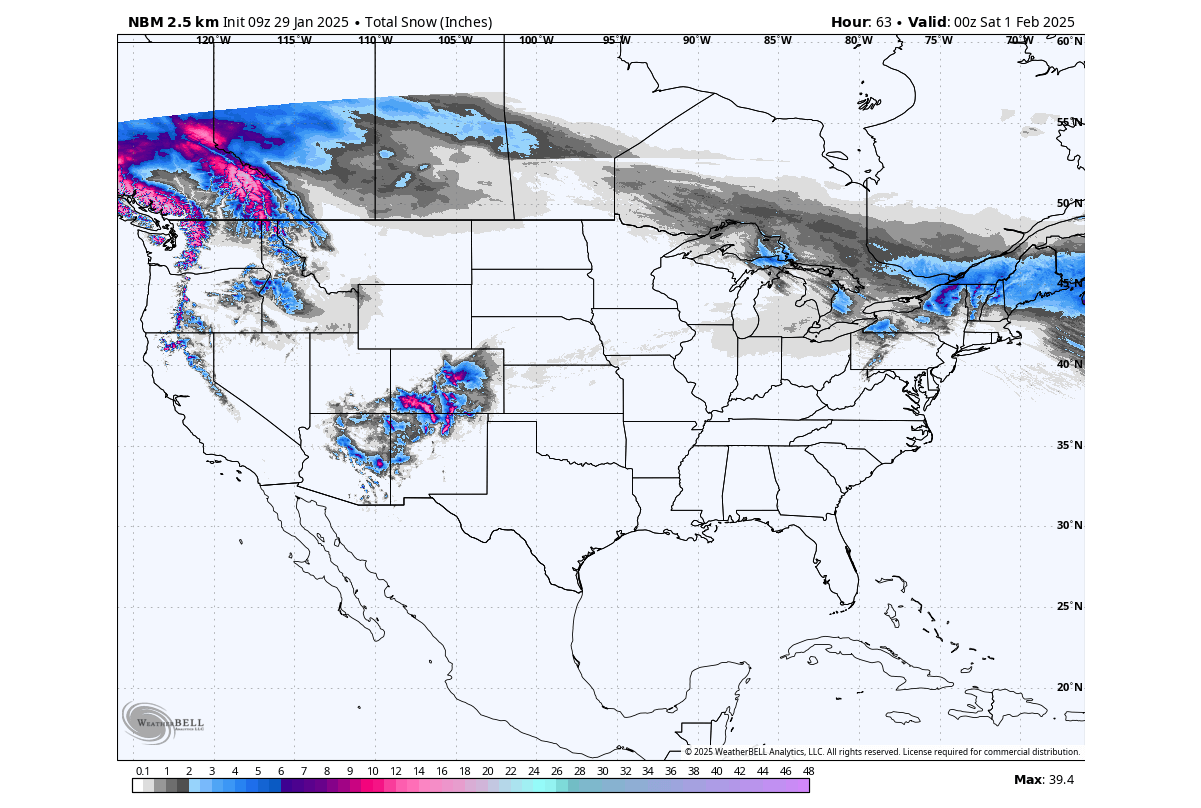
While not visible here, the warmer airmass and the increased wind shear over the southern United States will bring some severe weather to the region. That is due to the low-pressure area moving across the southern United States.
The movement of the pressure systems drives these temperature patterns and weather changes. Pairs of pressure systems are also known as Rossby Waves. You can see an example of Rossby waves in the image below by NOAA and how they are all connected and function with the jet stream.

The purple line connecting these pressure systems is called the jet stream. This rapid stream of air is found around 9 to 14 kilometers (6 to 9 miles) above sea level.
We produced a high-resolution video that shows the polar airmass movement over North America this month. This way, you can see how the cold air was transported down from the north like it has its own “cold highway”, driven by the Rossby waves of highs and lows and the jet stream in between.
But while January ends with a milder note over the east and severe weather over the south, we can already see the new round of cold weather setting up for February.
THE FINAL WINTER MONTH
Looking at the first week of February, the pressure anomalies might look similar to the week before. The 5-day average forecast shows two low-pressure areas, one over eastern Canada and one over the Pacific Northwest. The weekly average shows a ridge building over the southern and eastern United States.
But this image is just a 5-day average and can thus hide some important daily changes. The main feature is the double northerly flow. One is over the Pacific Northwest, and the second is over southeastern Canada, extending into the northeastern United States.
Below is the surface temperature anomaly, averaged for next week. You can see the large supply of colder air over the northern United States and western Canada. Another cooler area is forecast for eastern Canada and the northeastern United States.
But most of the central and southern half of the United States is forecast to have above-normal temperatures. We often see such a division in the weather patterns, where the colder and warmer air separate along the jet stream.
We can see that if we look at the temperature at the 850mb level (1500m/5000ft). This way, we can understand the overall airmass movement. The image below is for next Tuesday and nicely shows how the actual separation of the airmass looks like. You can see the cold airmass over Canada, reaching into the northern and northeastern United States.
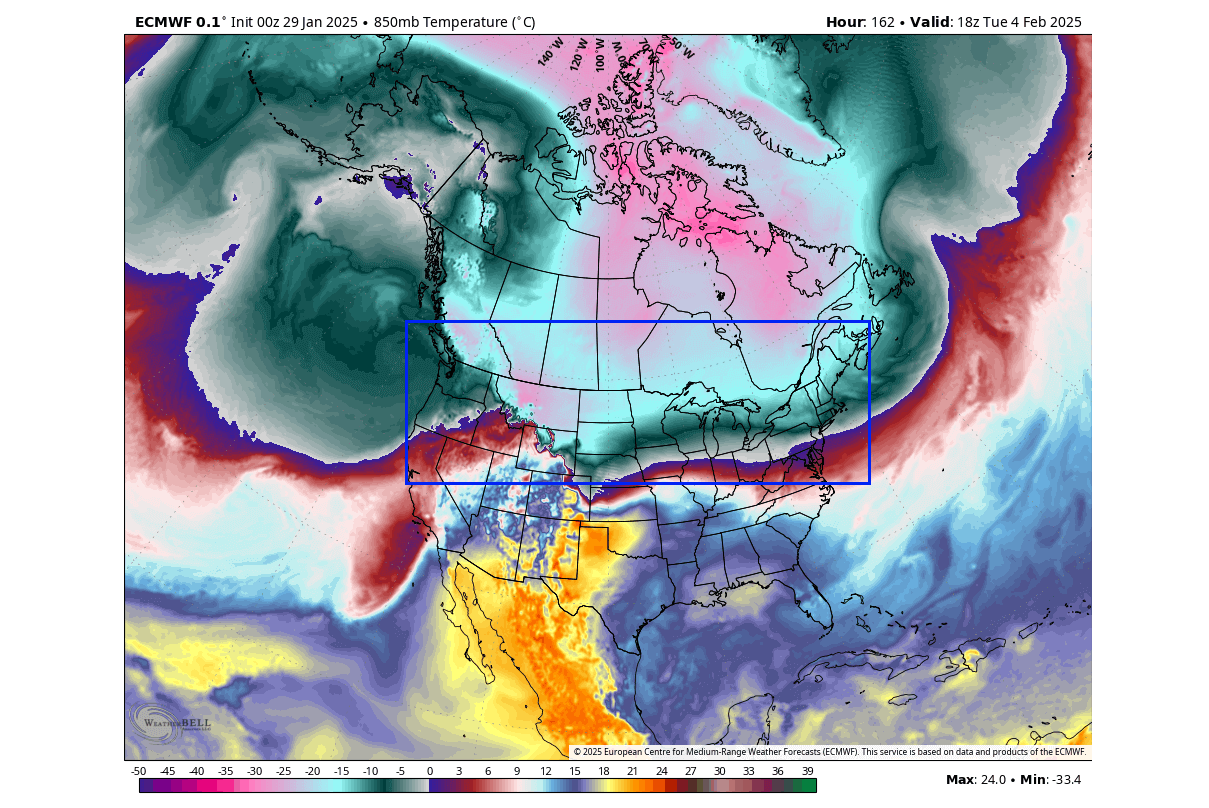
You can also see the connection of the cold airmass far back to the north into the polar circle. This northern flow from the Arctic is sometimes known as the “Polar Express”, and was much stronger in mid-January, bringing down record cold temperatures.
The official 6-10 day temperature outlook also shows this airmass separation, keeping the colder air over the northern half of the United States. At the same time, a ridge will bring a mild airmass into the southern and southwestern United States.
As mentioned above, the multi-day average does not show the full picture. So below is a single-day forecast that shows the temperature anomalies for mid-next week. You can see a cold air anomaly spanning from the Pacific Northwest and into the northern United States and southern Canada.
The cold air anomaly continues towards eastern Canada, also engulfing the Midwest and the northeastern and central United States. Warmer air will remain over the southern and southwestern United States.
We can also look at the current snowfall prediction below. You can see the snowfall spreading in the same pattern as the cold air, with strong snowfall over the northwestern United States. Another snowfall area is over the northeastern United States, with a belt of snowfall connecting both areas across the northern U.S. and southern Canada.
Of course, this is just a current model scenario, but we can look at these forecasts to evaluate the potential for cold and snow. And since this period is not that far away, most forecasts agree with the idea of the cold air spreading over the northern and parts of the central and eastern United States in the first week of February.
ANOTHER ROUND OF “POLAR EXPRESS”
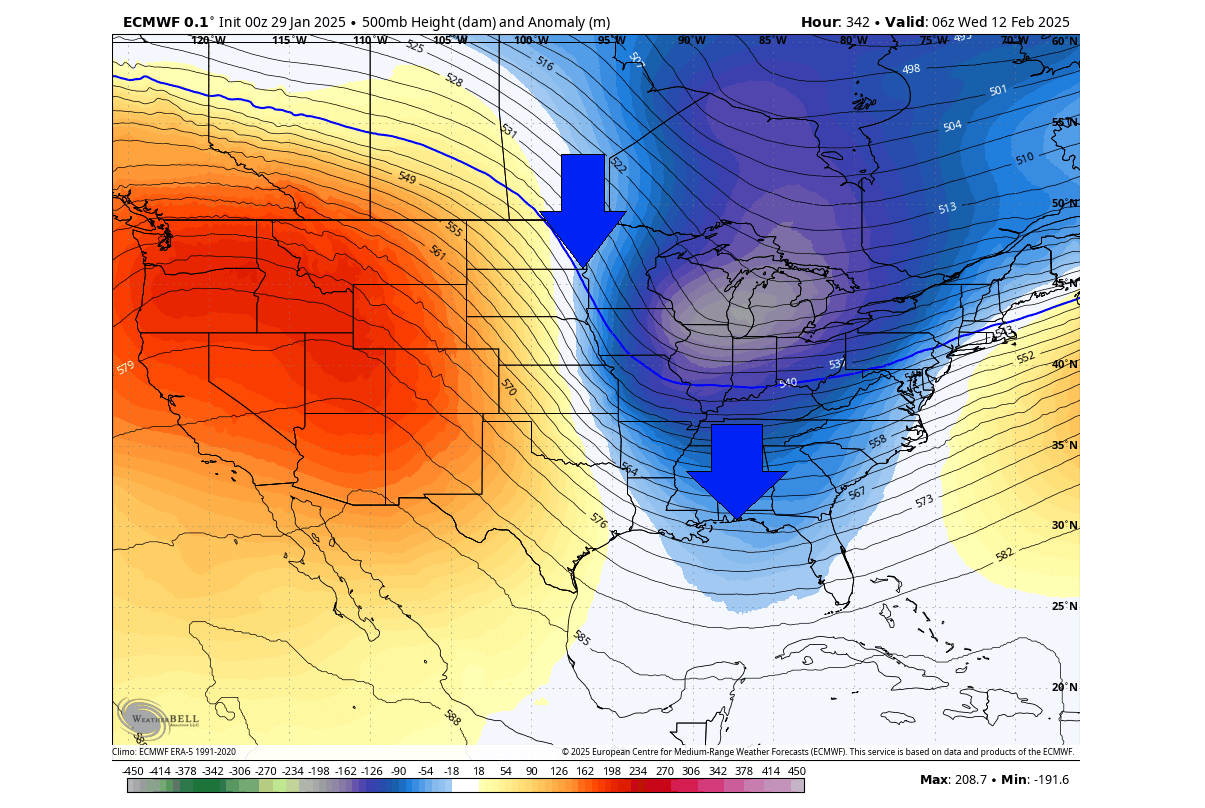
Looking at the second week of February, you can see the main low-pressure area is forecast over the upper Midwest and south-central Canada. This is a different pattern, where we see one main low-pressure area instead of two distinct ones. But note that this is again a 5-day average.

This currently looks like a pattern that will again enable a deeper, northerly flow, bringing the colder air into the northern and eastern United States.
The temperature forecast trend below shows a negative anomaly over the northern, central, and eastern United States, also covering southwestern Canada. This is a strong sign of another cross-country cold event. A warmer-than-normal airmass remains over the southeastern U.S., powered by the high-pressure ridge.
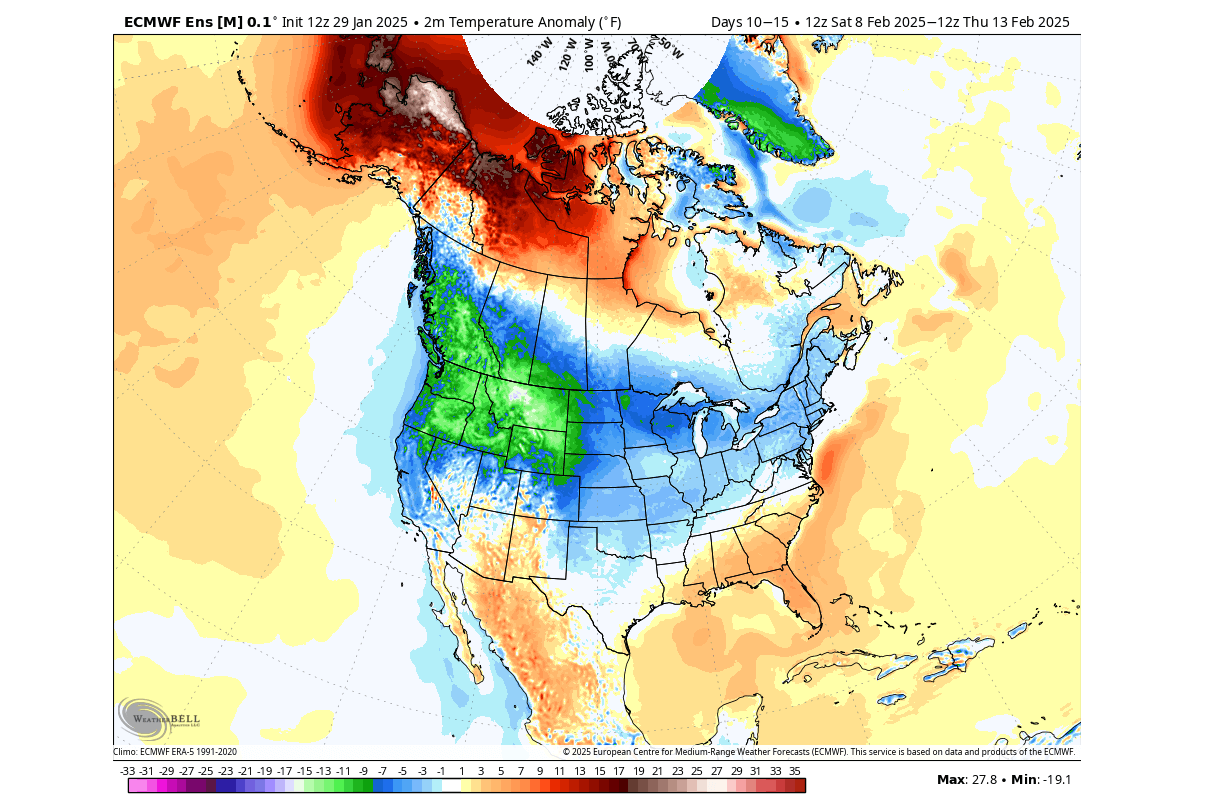
We can also look at a single-run forecast to understand the potential scenarios within the weekly average. The ECMWF operational forecast below indicates a very cold airmass to spread into the entire northern, central and eastern parts of the United States and Canada around Valentine’s Day. A warmer air mass is forecast to remain over the southeast.

In this model, the cold air is brought down into eastern Canada and the United States by another Polar Vortex lobe. As we mentioned earlier above, such a pattern usually brings down very cold air, also sometimes called the “polar express”-
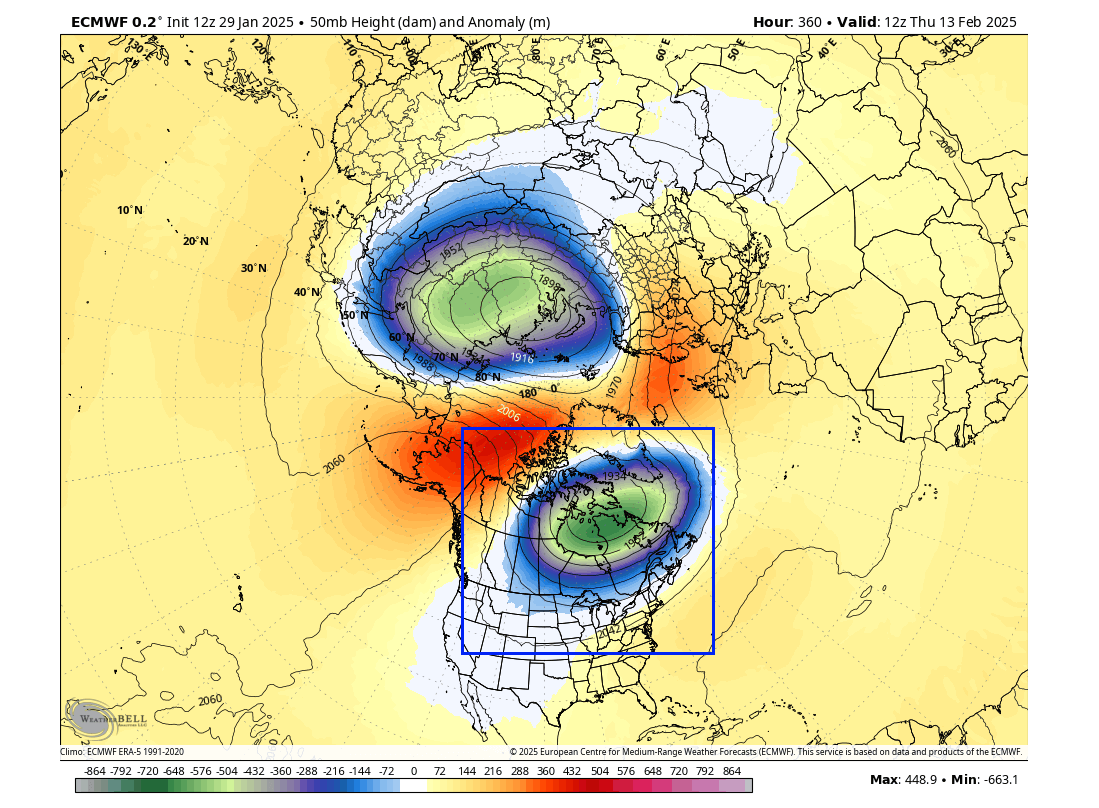
If we look at the forecast for the Polar Vortex in the Stratosphere, we can nicely see how one core of the Polar Vortex is separated and forecast to move into North America. This would be significant enough to initiate another cold air wave across the United States.
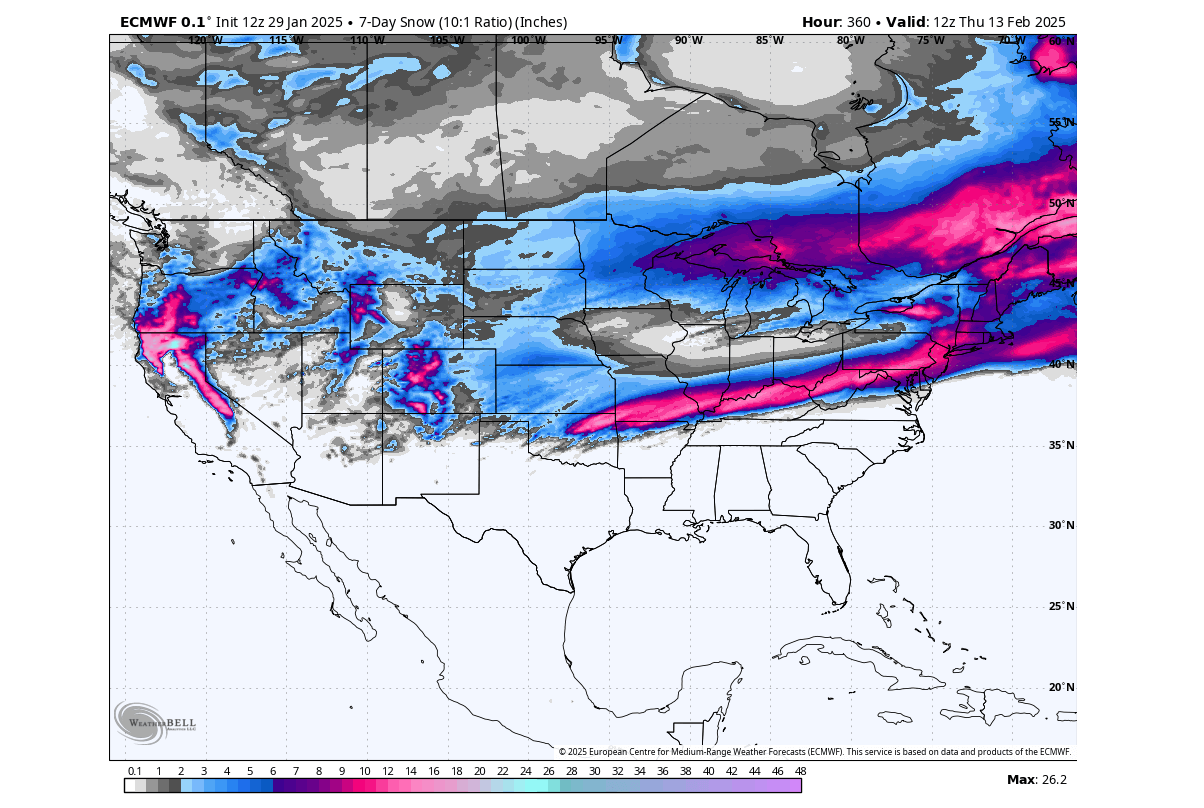
The single-run model forecast for this period shows the snowfall potential is largest over the eastern and northeastern United States, southeastern Canada, and the elevations over the western United States. A snowfall area also covers the central and northern Plains. But this is just a single-run scenario, and while it has a better resolution in every regard, it can have a bit lesser accuracy beyond the day-10 range.
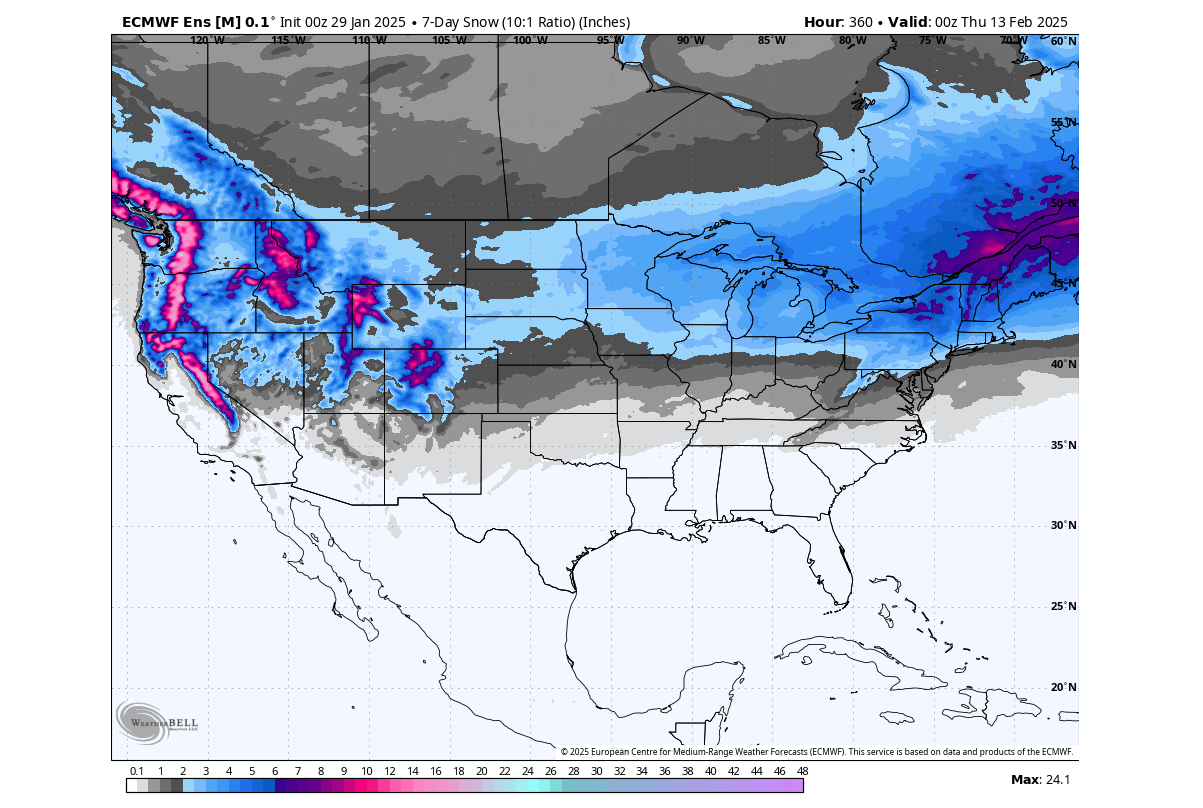
The more robust ensemble snow forecast for the second week of February shows snowfall over the western elevations of the United States. You can also see snowfall potential increasing over the northeastern United States and southeastern Canada, just as the previous single model also indicated.
Overall, the current forecast trend shows that the first half of February will be colder than normal over the northern half of the United States and southern Canada. The snowfall potential is also good in this area, particularly over the Pacific Northwest and the eastern/northeastern United States.
At the same time, the southern and southwestern United States look to be under the influence of high-pressure ridging, thus experiencing above-normal temperatures, with mostly less precipitation than normal.
WEATHER IN THE SECOND HALF OF FEBRUARY
Going into the weather trend for the second half of February, we will use the extended-range ensemble forecasts. These forecasts serve as trends that show the prevailing idea of where the pressure systems are positioned and how the airmass is expected to move.
In week 3, the low-pressure area pulls further back to the north and northwest. This keeps a northerly flow over the northwestern and northern United States. But depending on the strength of the ridge over the southeastern United States, we usually still see cold air spreading over the northern and east-central parts of the United States, thanks to the northerly flow.
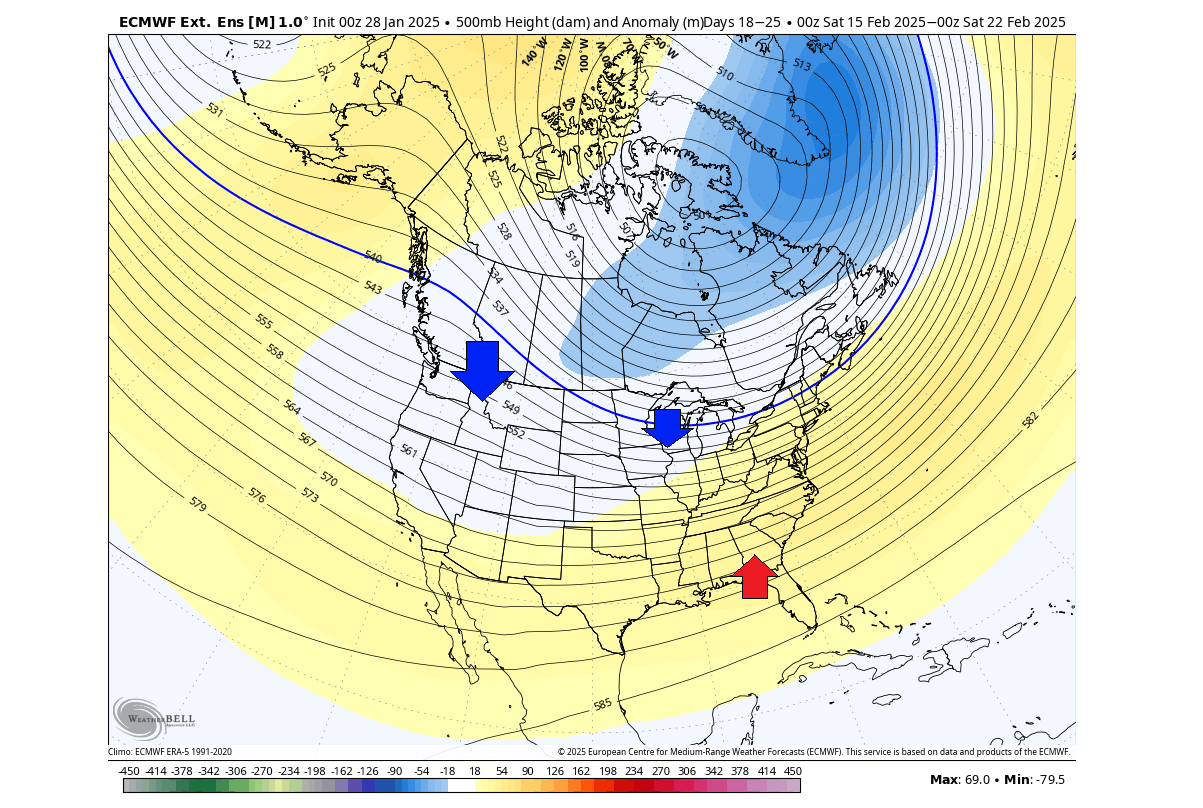
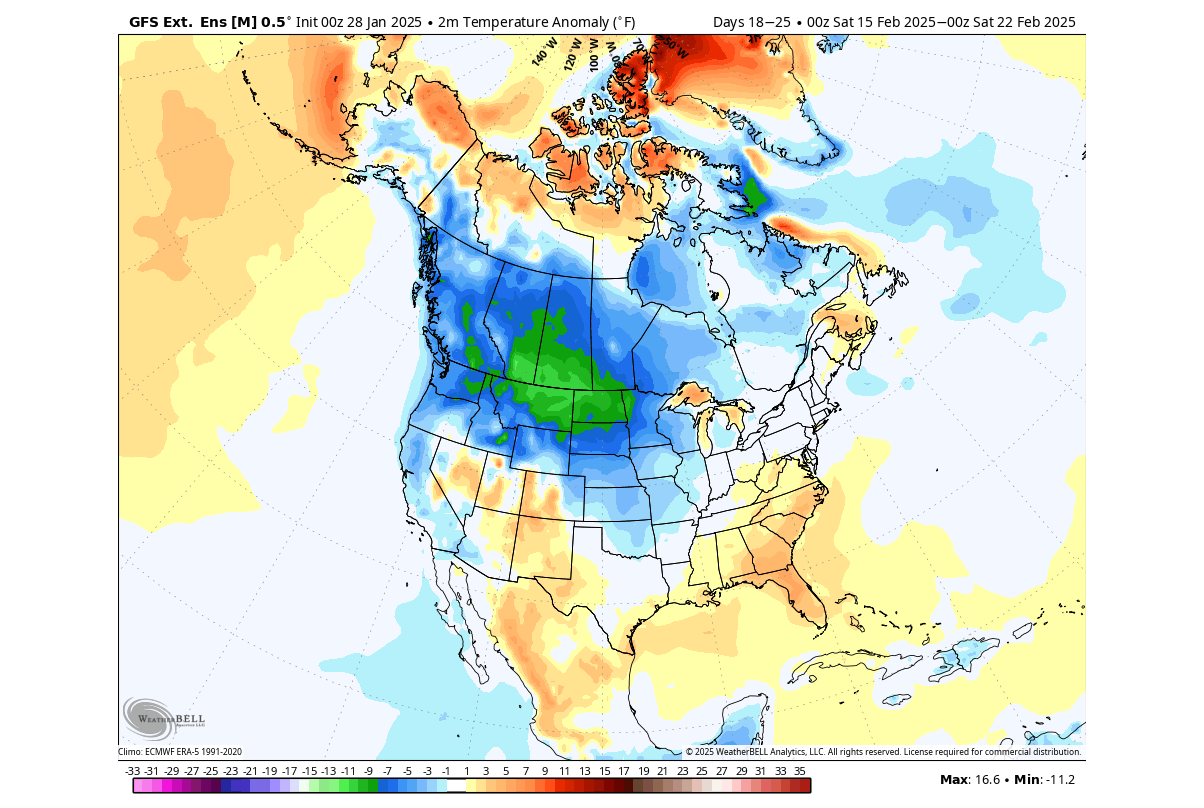
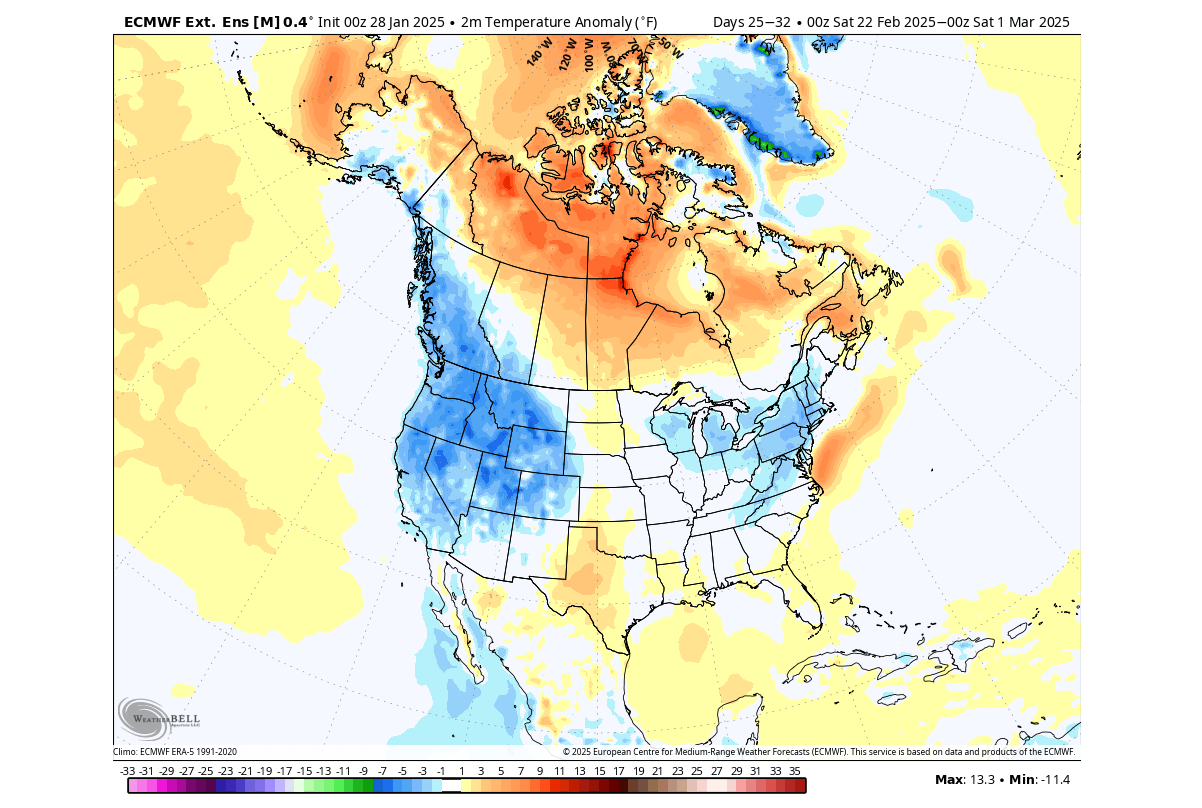
This can be seen in the surface temperature forecast below. You can see the cold airmass covering the entire northern and central parts of the United States, except the far south. Cold air will also remain over the southwestern Canada.

We can also look at another extended-range model, the GEFS from the United States NCEP Center for Environmental Prediction. This model also trends with a cold air anomaly over the northern United States and western Canada. But it shows the cold air seeping deeper into the central and southern plains and has less cold air in the far eastern United States.
Both models trend towards a cold airmass lingering over the northern United States and western Canada, with good chances that the cold air will spill into the central and eastern United States and the northeast.
FINAL WINTER WEEK
February is the last month of the meteorological Winter season, so the last week of February is also the last week of the statistical winter period. That is because, in meteorology, the winter season is marked by the coldest 3 months: December, January, and February.
In week 4 of February, we don’t see a clear low-pressure area trend in the forecast. This is mainly because the range of the forecast is quite long, and the signal is weaker. We can still see a hint of where the low-pressure area is trending, mainly over southern Canada and the northwestern United States.

You can actually see that pattern better in the temperature trends. We see continued cold air presence over the western United States, around the Great Lakes, and the northeastern United States. A warmer air anomaly is pushing up over the southern and the southeastern United States.
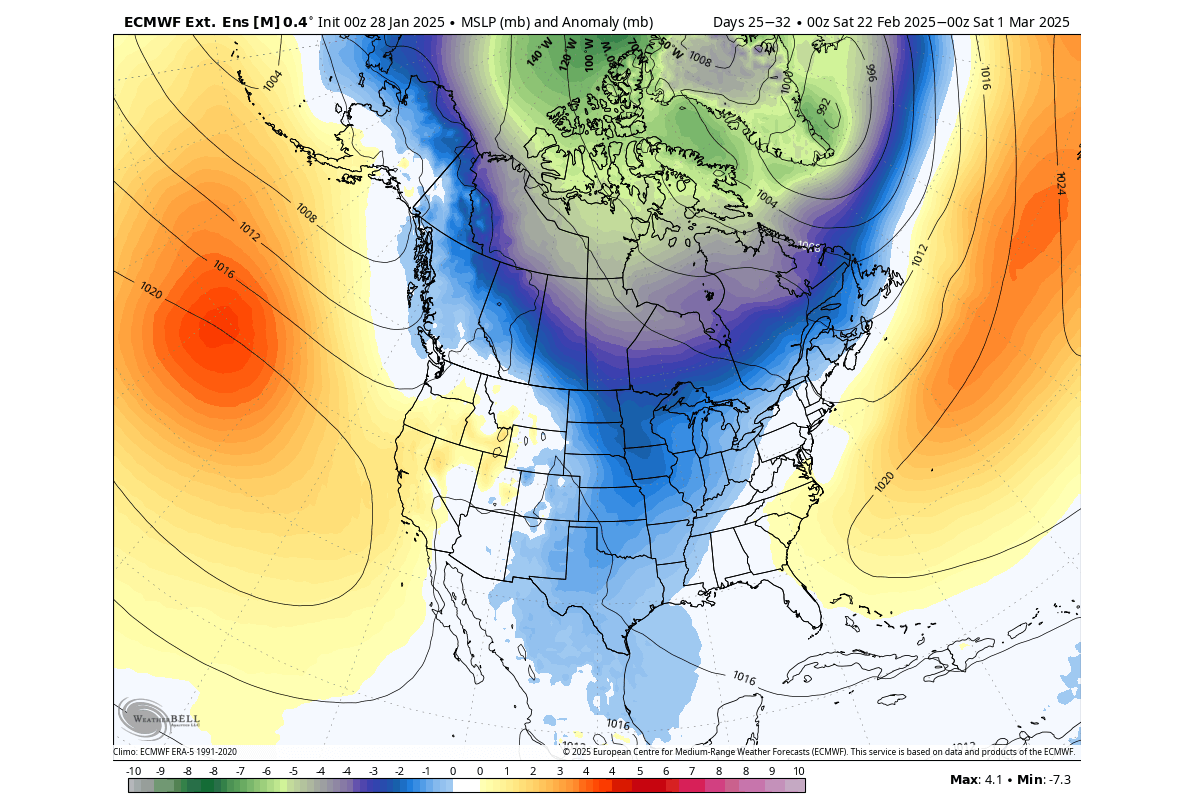
We can also look at the surface pressure anomaly, which shows a broad surface low-pressure area from Canada down into the Midwest and central United States. This confirms the northerly flow over the western United States and a likely northerly airmass over the upper Midwest and the northeastern United States.
Forecast images in this article were provided by WeatherBell, using a professional/commercial user license.
We will keep you updated on the developing weather trends in the coming weeks, so make sure to bookmark our page. Also, if you have seen this article in the Google App (Discover) feed, click the like and follow button there to see more of our forecasts and our latest articles on weather and nature in general.
Don’t miss: Spring 2025 early Forecast: The United States and Canada under the seasonal impact of the La Niña