Spring season 2025 is slowly getting closer, with early forecasts revealing that the recent burst of the La Niña will influence the jet stream pattern over the North Pacific. A high-pressure system in the Pacific will define the weather patterns over the United States, along with a low-pressure zone over Canada.
The meteorological Spring season lasts 3 months and covers the March-April-May period. As this is the transition period from Winter to Summer, you can expect a wide range of weather dynamics during this time.
One of the factors this Spring will be the influence of the oceanic La Niña event, which had a burst of life just recently. In this article we will look at the winter so far, the weather pattern for February and the first long-range forecasts for Spring 2025, shaped by the La Niña.
WINTER SEASON SO FAR
The meteorological Winter season covers the December-January-February period. We are already nearing the end of the second month, so we can look at the analysis for the first half of the Winter season.
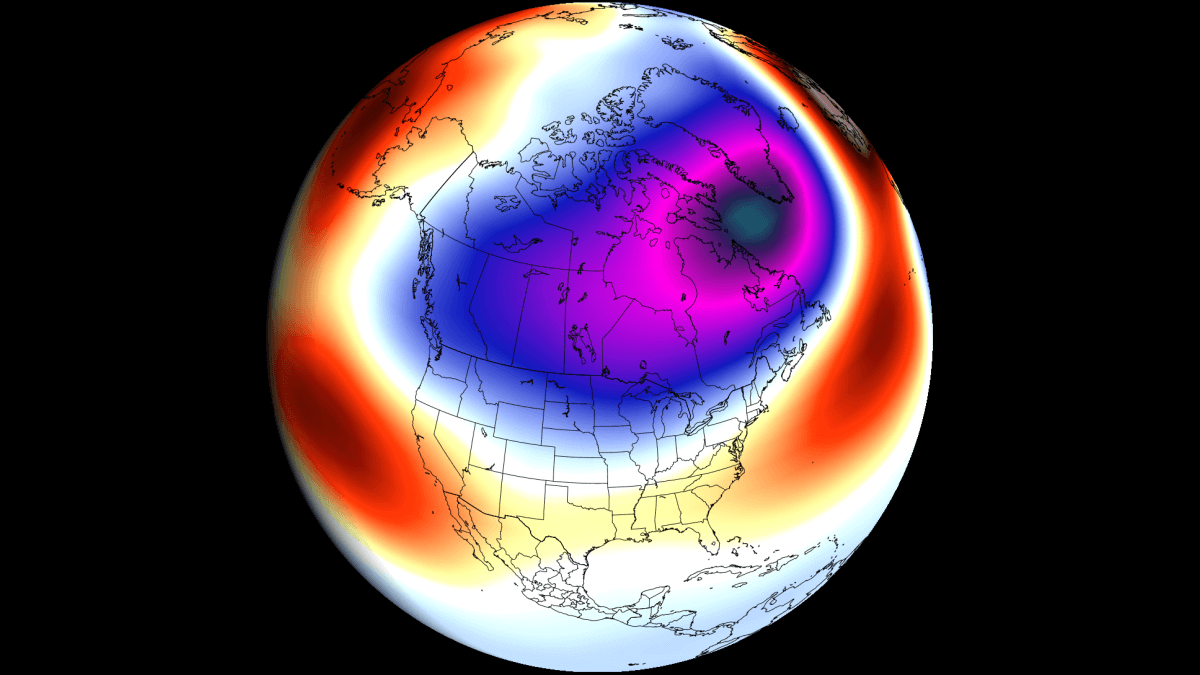
Below is the pressure anomaly analysis for December and just over half of January. You can see the dominant low-pressure area over the eastern United States and southeastern Canada. Paired with a high-pressure zone over the West Coast, it creates a persistent northerly flow that brings colder air into the United States.
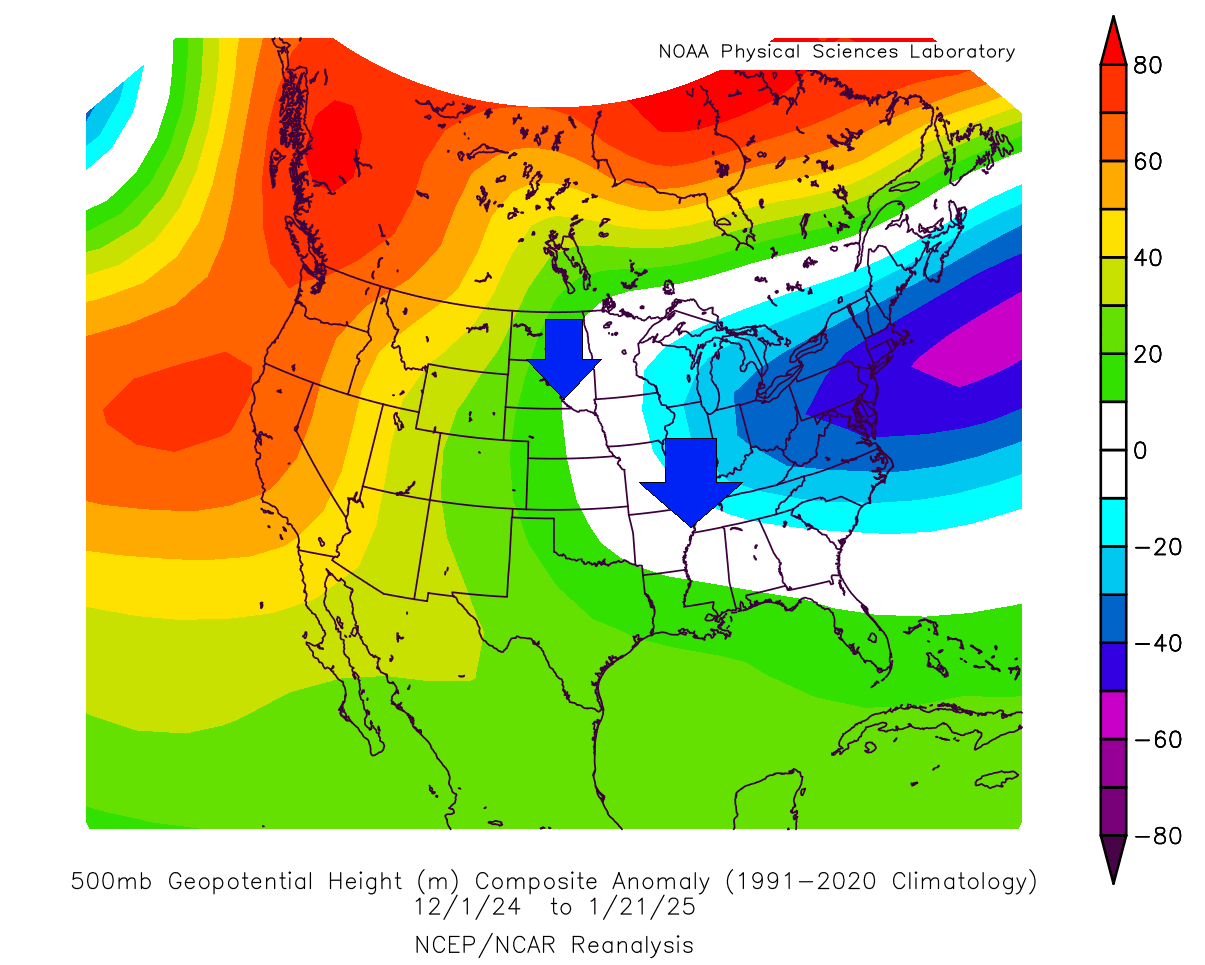
The stronger the pressure difference is between the high and low-pressure systems, the stronger the northerly flow is, and the colder the airmass, originating deep in the polar region.
You can see the result of this pattern on the temperature analysis below for the same period. Lower than normal temperatures are seen in this long-term average over the northern, north-central, and eastern United States.
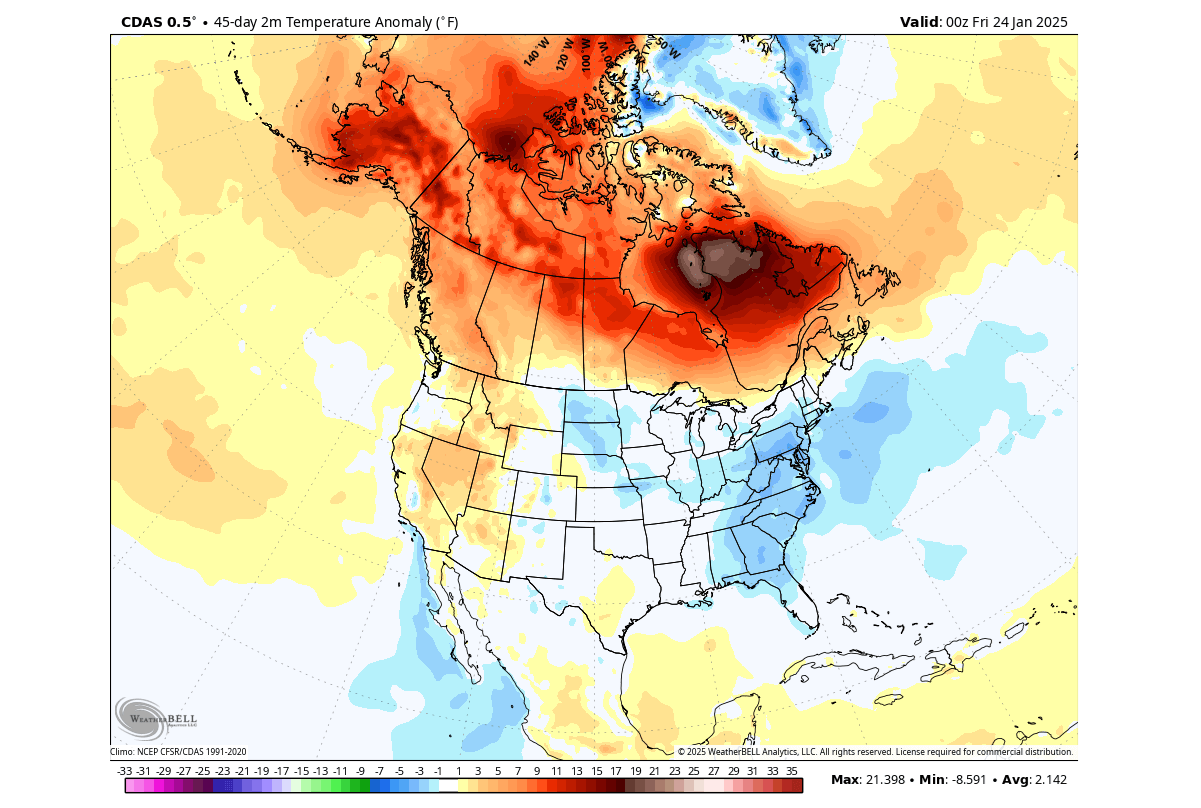
Most of northern and eastern Canada and the western United States have been warmer than normal so far this winter season.
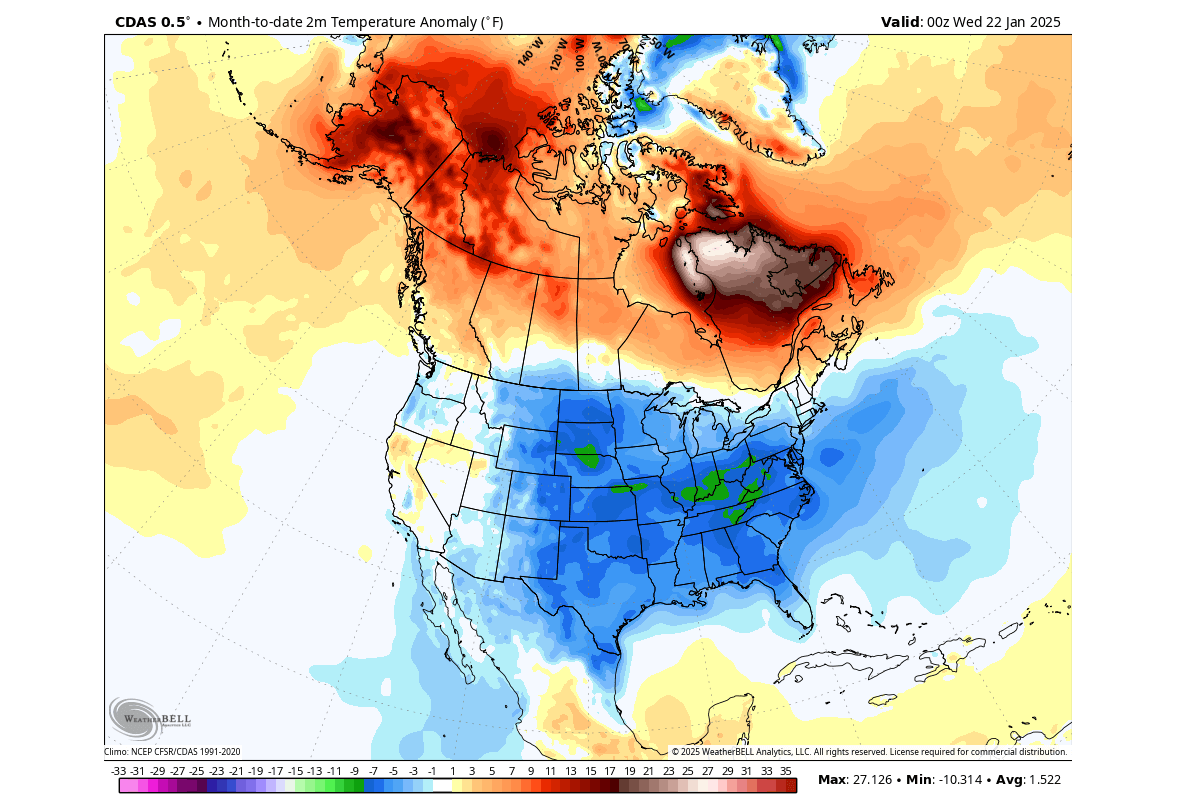
But if we look at just the January data so far, you can see a pretty different picture. The northerly flow was stronger this month, bringing down some of the coldest air in years, if not decades. That has left a significant part of the United States colder than normal, while the above-average temperatures remained over most of Canada.
Looking at precipitation for the Winter so far, we only have high-resolution data for the Untied States. You can see more precipitation over the northwest and north, and over parts of the eastern and southern United States. The southwestern U.S., the central plains, and the east coast had less precipitation so far this winter.

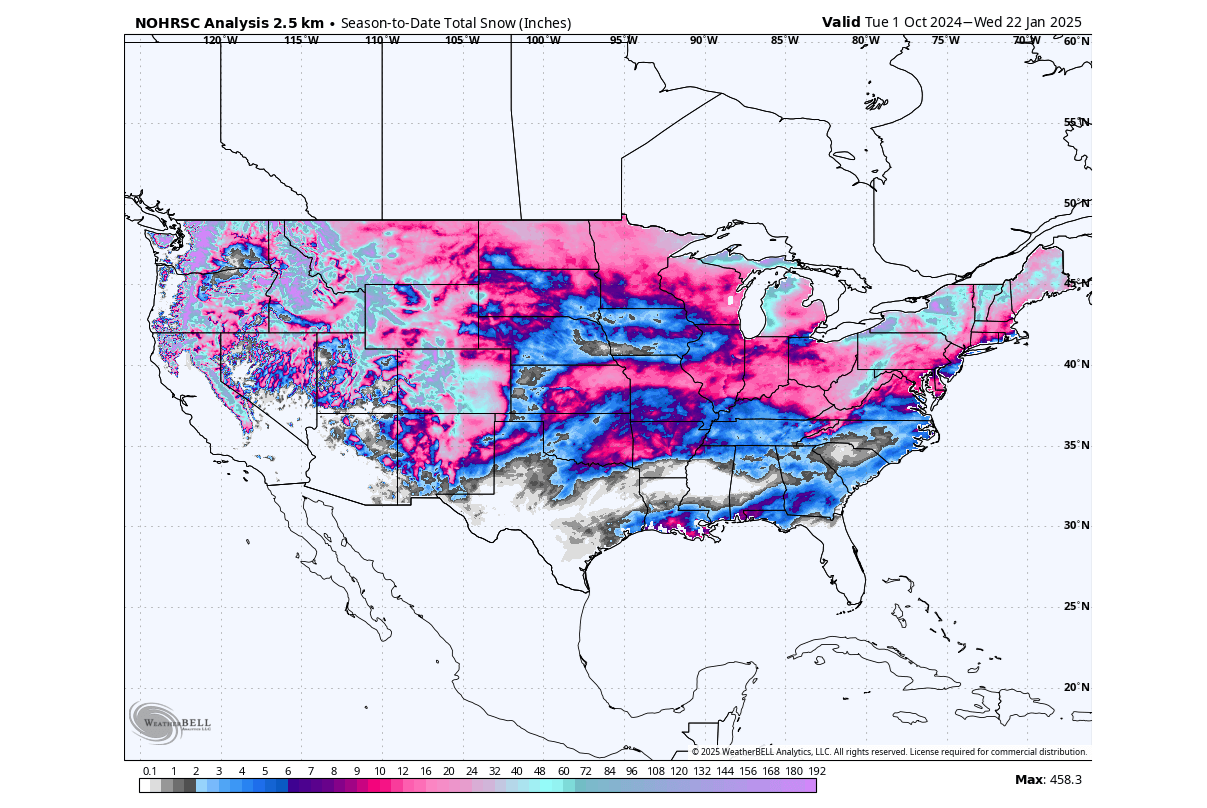
We can also look at total snowfall, but the data period starts on October 1st. That is because this period is considered the snowfall season or sometimes also the cold weather season. As you can see, this winter so far, a large part of the United States has seen snowfall, including the deep south coast.
Before going into the Spring forecast, we will also take a quick look at the final winter month of February and what the latest forecast shows for the United States and Canada.
THE WINTER FINALE
For February, the extended-range ensembles show the continued high-pressure zone in the North Pacific, with the main low-pressure area over Canada and the northwestern United States. Such a pattern means cold air pooling over the Pacific Northwest, with warmer air returning to the southern and southeastern U.S.

Looking at the surface temperature forecast, you can see the cold air pooling over the northwestern United States and western Canada. Another area with normal to colder temperatures is over the upper Midwest and the northeastern United States. This indicates that several events in the forecast bring the cold air from the northwestern U.S. into the northeast.
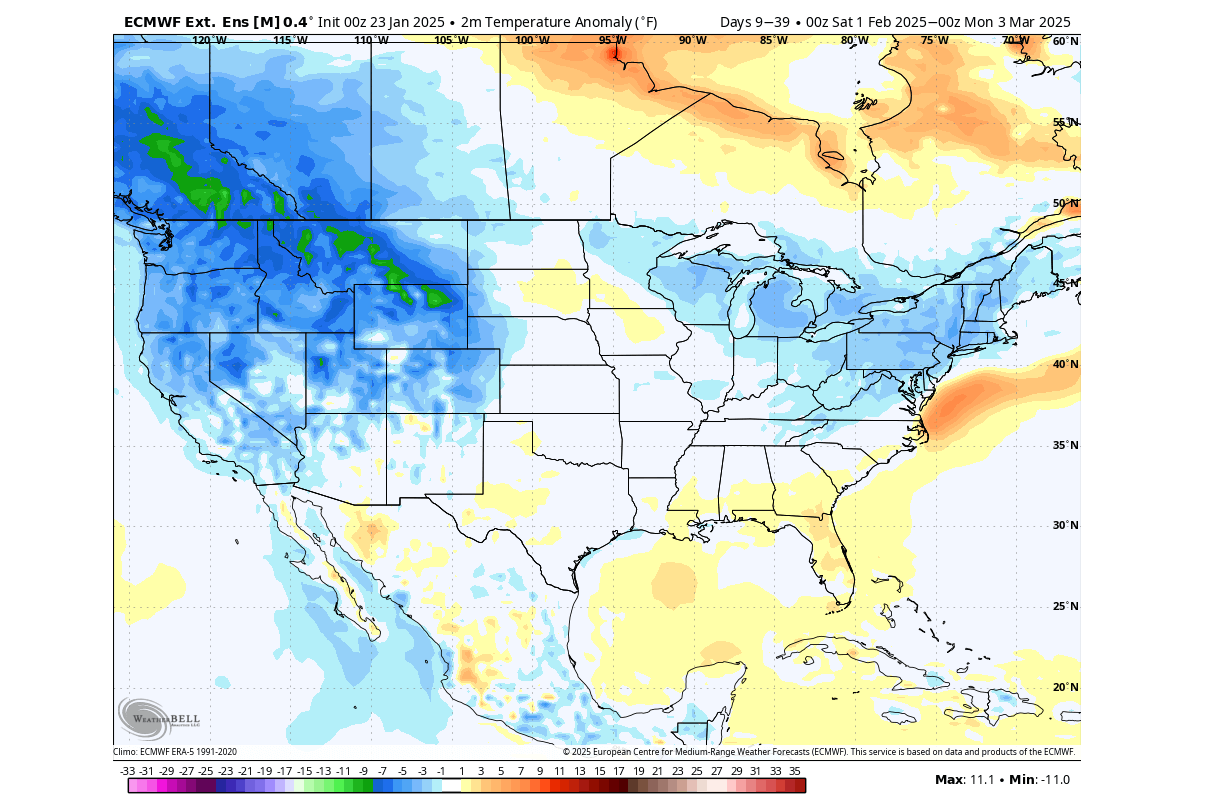
Normal to above normal temperatures are currently forecasted for February over eastern Canada and the southern parts of the United States.
In the next image below, you can see less precipitation is forecast over much of the southwestern United States and the central Plains. More precipitation and also snowfall is forecast over the Pacific Northwest.

But with cooler temperatures and more precipitation indicated, the upper Midwest and the eastern United States also have an elevated snowfall potential in February.
The February weather patterns are very similar to what we usually see from a large-scale ocean anomaly in the Pacific Ocean. It has a known impact on the Spring weather patterns over the United States and Canada.
LA NINA SPRING INFLUENCE FOR NORTH AMERICA
One of the important large-scale drivers of this winter season is the La Niña event in the tropical Pacific Ocean. It was getting stronger in the past two months, and is expected to affect the weather patterns over the United States and Canada.
In the image below, you can see the latest ocean temperature anomaly across the Pacific. Notice the colder than normal surface waters in the tropical Pacific regions. That is a La Niña event, spanning far across the central and western equatorial Pacific Ocean, powered by the trade winds.

La Niña is just a different name for cold ocean temperatures in the tropical Pacific Ocean. The actual ocean-atmosphere system is called ENSO (El Niño Southern Oscillation). This region in the tropical Pacific Ocean alternates between cold and warm phases.
Below is a video of the official weekly ocean analysis. As you can see, the negative anomalies have strengthened across the tropical Pacific in the past month, right across the main ENSO region.
In the image below, you can see the average position of the jet stream during La Niña seasons. Also, you can see the resulting weather patterns over the United States and Canada as the polar jet stream takes a different path.
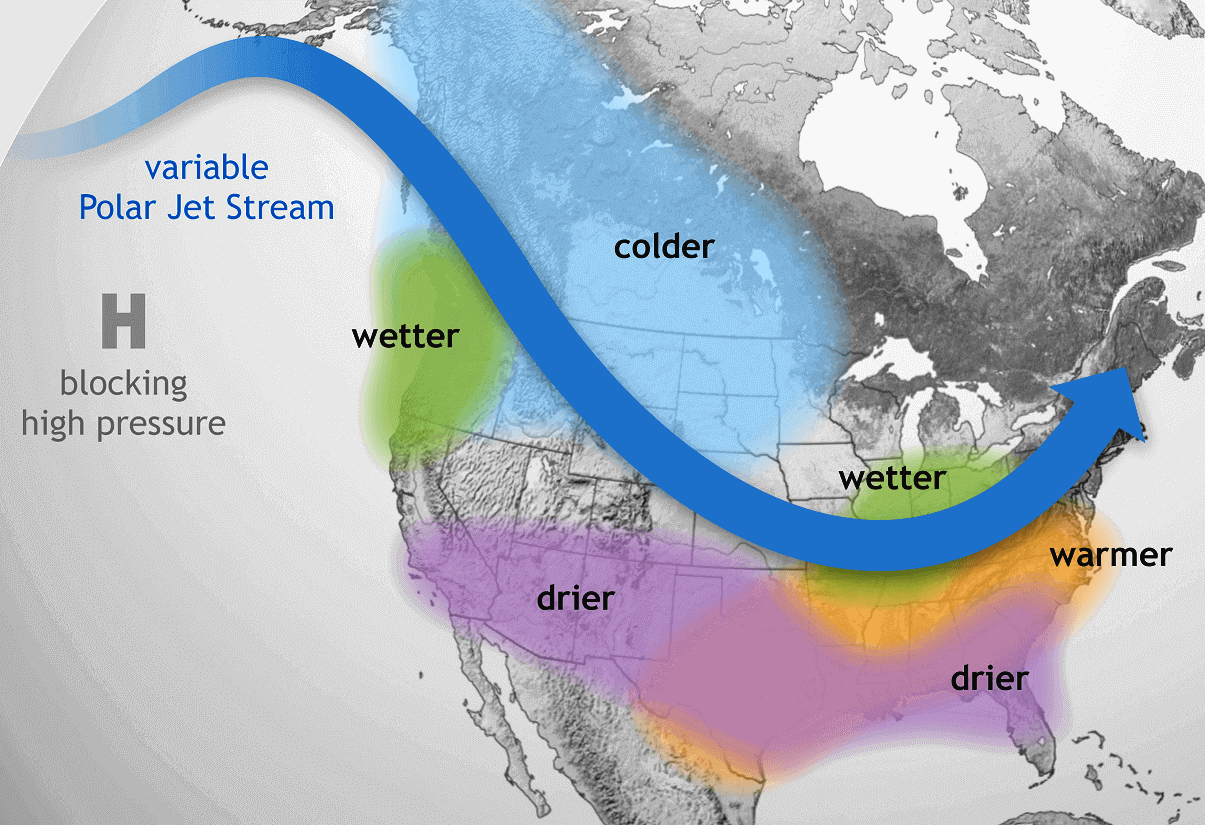
The shifted La Niña jet stream brings colder temperatures and storms into the northern and northwestern United States. But it generally creates warmer and drier weather in the southern and eastern states.
This way, the jet stream can divide the United States into two weather poles. In the northern part of the country, colder and wetter events are more frequent, as the jet stream directions the storm systems and cold weather there.
Because we have a weak La Niña this season, we will look at the snowfall patterns during a weak La Niña event for January-March. You can see above-average snowfall across much of the northern United States and southern Canada. Peak snowfall is usually across the higher elevations of the Pacific Northwest.

You can see that the north-central U.S., including the Dakotas, Nebraska, and Minnesota, had a snowier winter during weak La Niña years. There is also more snowfall across the northeastern United States but less over the southeastern U.S..
With this in mind, we can look at the first long-range predictions for Spring 2025 over the United States and Canada.
NORTH AMERICA SPRING 2025 – FIRST FORECAST
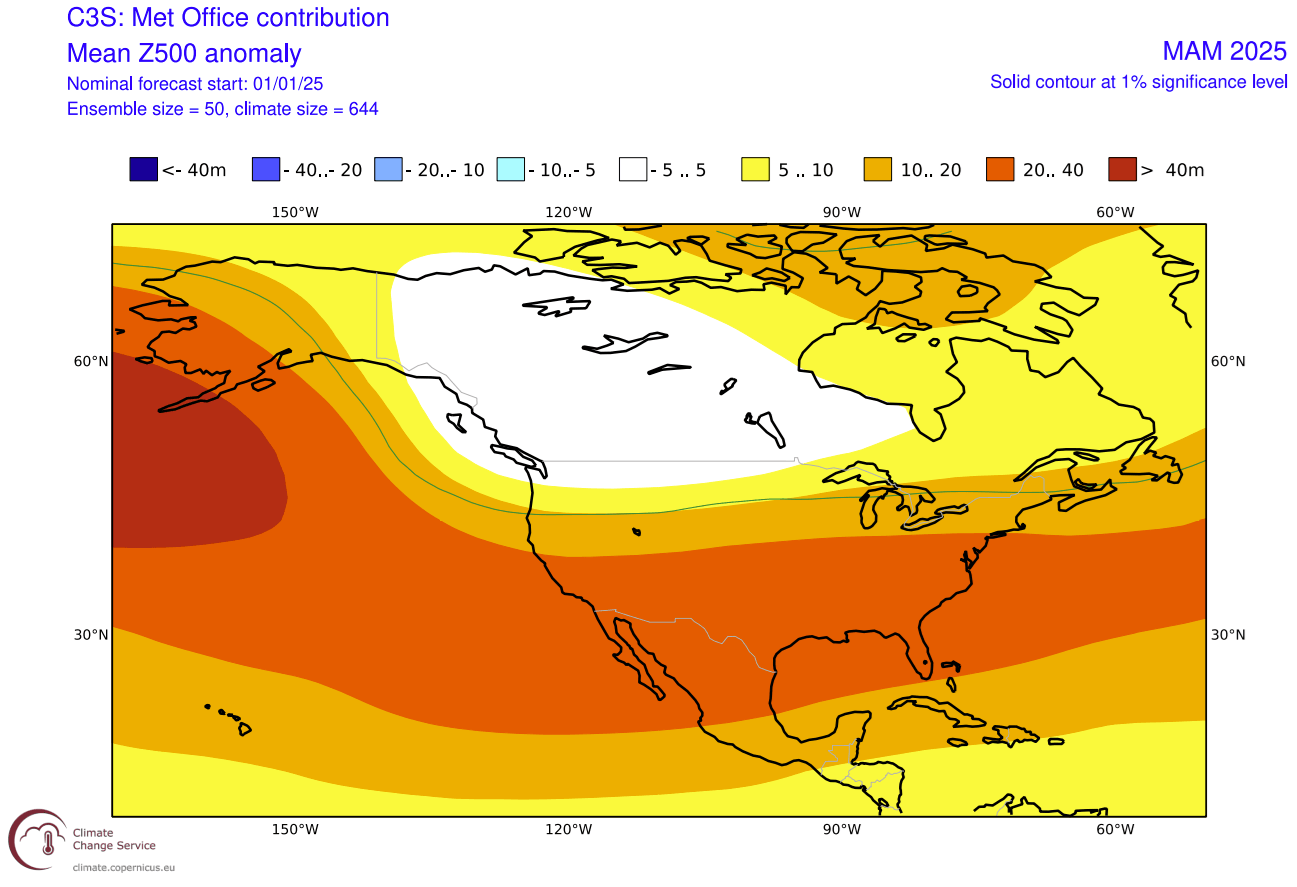
The pressure pattern forecast from ECMWF below indicates a typical La Niña high-pressure system in the North Pacific. The low-pressure system is indicated over Canada. As a low-pressure system sits over Canada, that enables the presence of colder air over western Canada, with a northerly flow ready to push the colder air into the United States.

In Spring, the southern ridge starts to get stronger, so together with La Niña, we usually see an early onset of warmer temperatures over the southern United States.
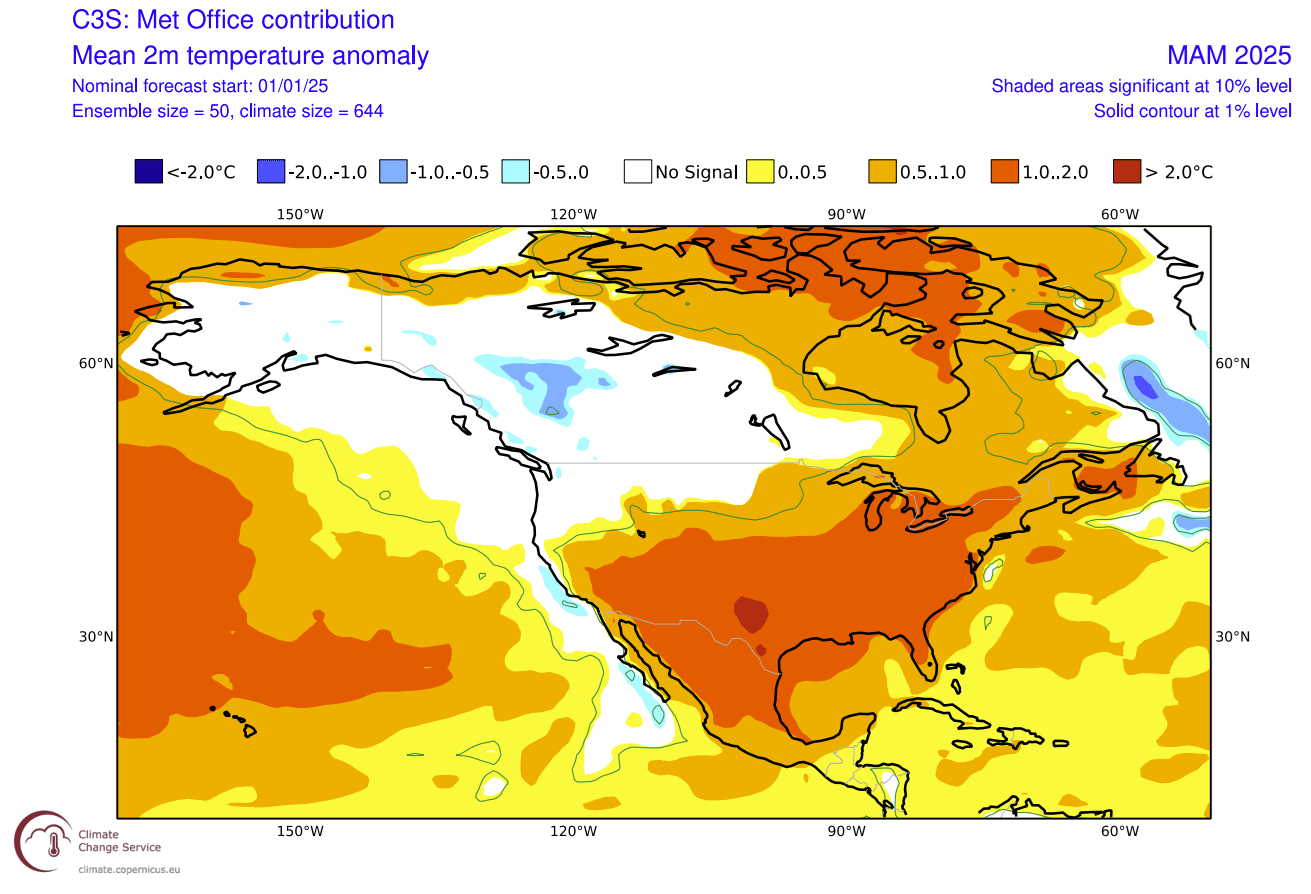
We can see this in the temperature forecast for Spring, where the forecast hints at normal to colder-than-normal surface temperatures over the northwestern United States and upper Midwest. In addition, we see an indication of normal temperatures over the northeast.
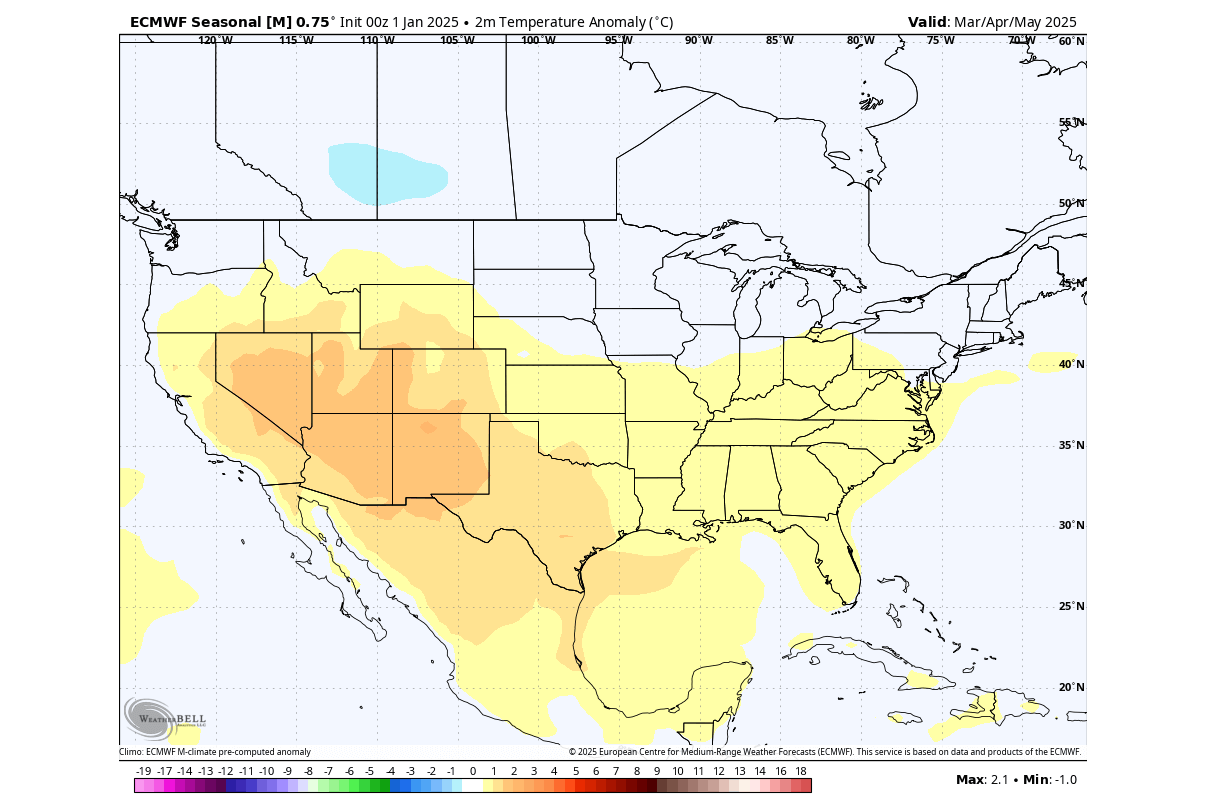
Despite being shown warmer than normal, the central parts of the United States tend to get occasional colder weather and snow in early Spring during these jet stream patterns. But mostly warmer than normal temperatures are forecast over the far south and the southwestern United States.
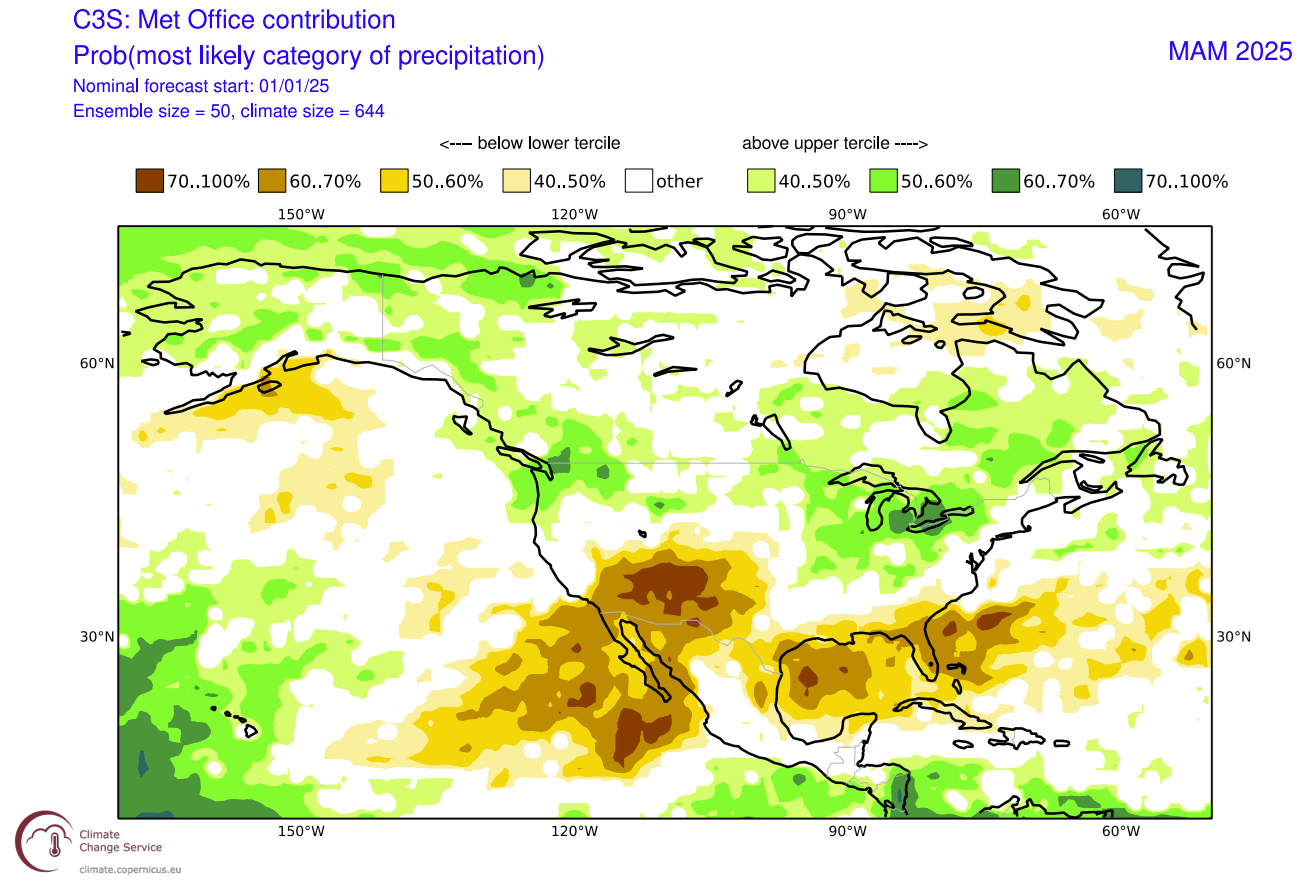
The North American precipitation anomaly forecast below shows a normal La Niña-type pattern over Canada and the United States. As a result, the United States has wetter conditions in the northwest and the east, and less precipitation is forecast for the southwestern and southeastern United States.

In combination with colder temperatures, that also affects the snowfall potential in early Spring. Overall, the Spring seasonal patterns look very similar to a typical La Niña effect.
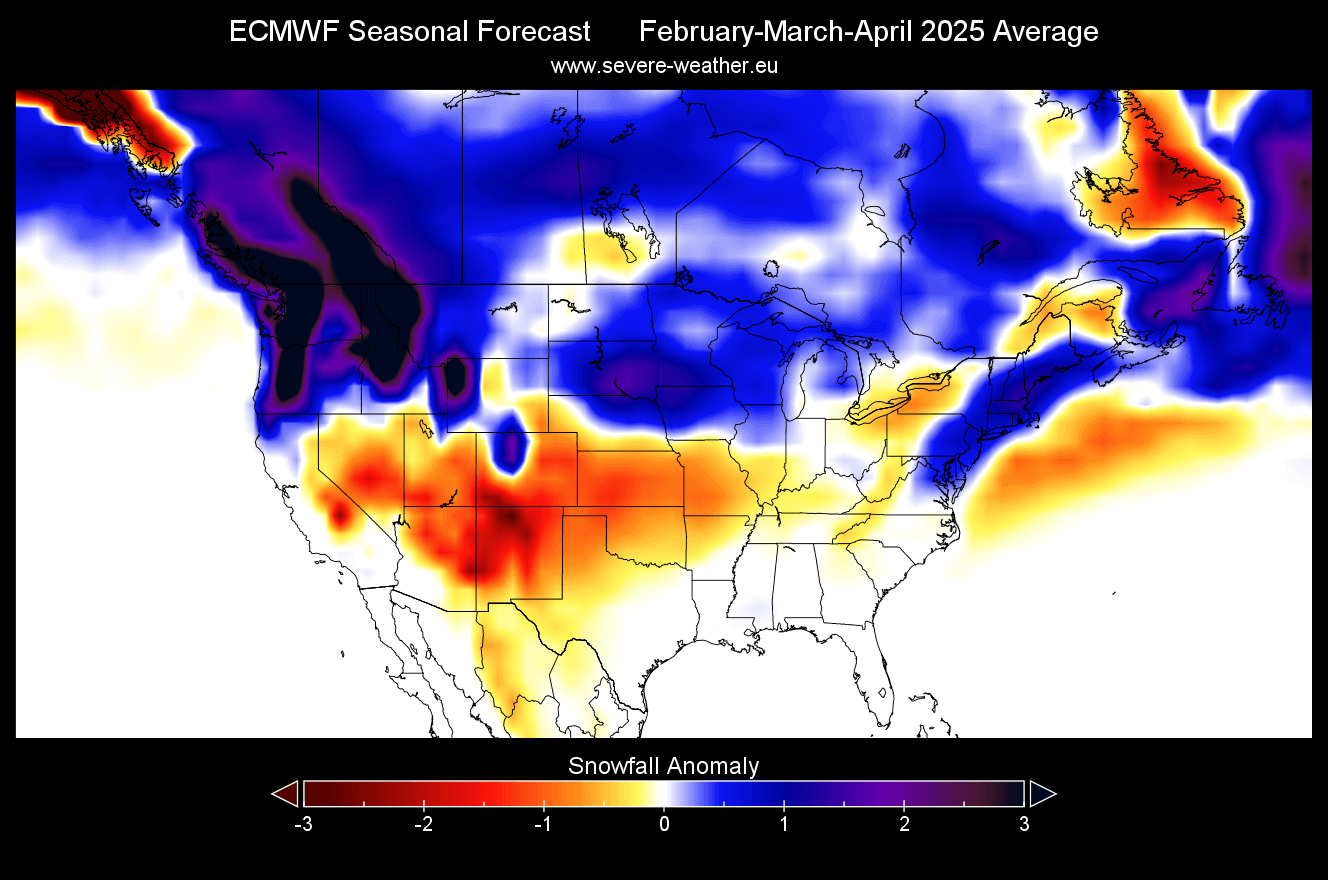
For the February-April period, you can see more snowfall than normal, covering a large area from western Canada down into the northwestern United States, the Northern Plains, the upper Midwest, and the Northeast. A lot of this snowfall likely comes from the February and early March data.
We will produce an article with a more detailed breakdown of the snowfall potential in the Spring Season month by month.
UKMO FIRST SPRING SEASON FORECAST
In contrast to the ECMWF, we often use the UKMO model from the United Kingdom Met Office. This way, we can compare results, and if both models show a similar forecast, that raises confidence in the accuracy of the forecast.
The UKMO model agrees with the ECMWF Over the North Pacific, forecasting a high-pressure system. No clear low-pressure anomalies are shown, but the pattern indicates a low-pressure zone over Canada, similar to the ECMWF, but a bit more to the west.
This model also shows the strengthening southern ridge, returning each spring over the southern United States.
The temperature forecast below shows a La Niña-like temperature pattern. Colder temperatures remain over western Canada and extend into the northwestern United States. No cold anomaly indications exist over the rest of the United States. But this is likely because the main low-pressure zone in this model is forecast further west over Canada.
Warmer than normal weather prevails over the southern parts of the United States. A potential gap in the warm anomaly is likely over the central parts of the United States, with occasional cold fronts from the northwest that move across the country.
The precipitation forecast shows drier-than-normal conditions over the southwestern United States and the south coast. Over the northern and eastern United States, we can see more precipitation than normal due to the La Niña influence.
We also have the UKMO snowfall data for the February-April period, and it shows a large area of above-normal snowfall. The area covers much of western and southern Canada and also extends over the northern United States.

Less snowfall than normal is forecast for the southern half of the United States, including the northeastern U.S., but this may be due to less snowfall in February data. This will be revealed when we do a month-by-month snowfall breakdown in our next long-range article.
OFFICIAL SPRING OUTLOOK
Below is the official Spring temperature outlook for the United States from CPC. It shows the temperature probability, with colder to equal chances in the northern United States. The southern half of the country and the northeast have a higher probability of warmer than normal weather, similar to the models above, apart from the northeastern U.S..

You can also see an area of equal probability over the central United States. That indicates the likely path of cold air during cold fronts originating from the northwestern United States and western Canada.
The official precipitation forecast is also quite similar to the model forecast. We see an equal-to-higher probability for more precipitation in the eastern United States across the Ohio Valley and the Pacific Northwest. On the other hand, the southwestern United States is forecast to have a drier-than-normal spring season.
We will keep you updated on the developing weather trends in the coming seasons, so bookmark our page. Also, if you have seen this article in the Google App (Discover) feed, click the like button (♥) there to see more of our forecasts and our latest articles on weather and nature in general.
The main forecast images in this article are from weatherbell maps using a commercial license.
Don’t miss:
An Unstoppable 2025 Polar Vortex: The United States cold from the Stratosphere