UPDATE June 11th, 2026: NASA Detects a Major Pacific Sea Level Rise as Super El Niño Rapidly Strengthens, with Atmospheric Impacts Already Visible
A major atmospheric change is about to start, as the latest oceanic data confirms the 2026 El Niño is intensifying below the ocean surface. New ensemble model runs from the ECMWF, NOAA, and BOM now align on a high-impact trajectory, with several forecasts suggesting this event could become the strongest El Niño in modern history, potentially surpassing the record-breaking event of 1877-1878.
This “Code Red” scenario for the global atmosphere is being driven by a massive oceanic Kelvin wave that has grown more energetic in recent weeks. This subsurface heat pulse is expected to rise to the surface levels, acting as a “release valve”, that will kickstart the reorganization of global weather patterns, starting in the tropics.
In this specialized long-range analysis, we examine the subsurface engine, driving this event, and the record-breaking anomalies projected for the second half of 2026. We will also look at the first atmospheric impacts expected by summer, the shifting jet stream over North America and Europe, and why the current trends signal a peak event that will redefine the seasonal weather into 2027.
Planetary Dynamics: The Oceanic Impact on the Atmosphere
All data indicate that ENSO will be a major global weather driver in 2026/2027. This is short for “El Niño Southern Oscillation” and refers to a region of the equatorial Pacific Ocean that alternates between warm and cold phases every few years.
These ocean phases can cause a significant disturbance to the global weather system. But they also act as the “indicator light”, indicating major changes in the global weather system as this ocean area changes from a cold to a warm phase.
In the image below, you can see a direct comparison between ocean temperature anomalies for each of the two ENSO phases, the warm El Niño and the cold La Niña. Both phases show real data from their 10 strongest events, revealing a clear ocean signature for each phase and the true planetary scale of these anomalies.
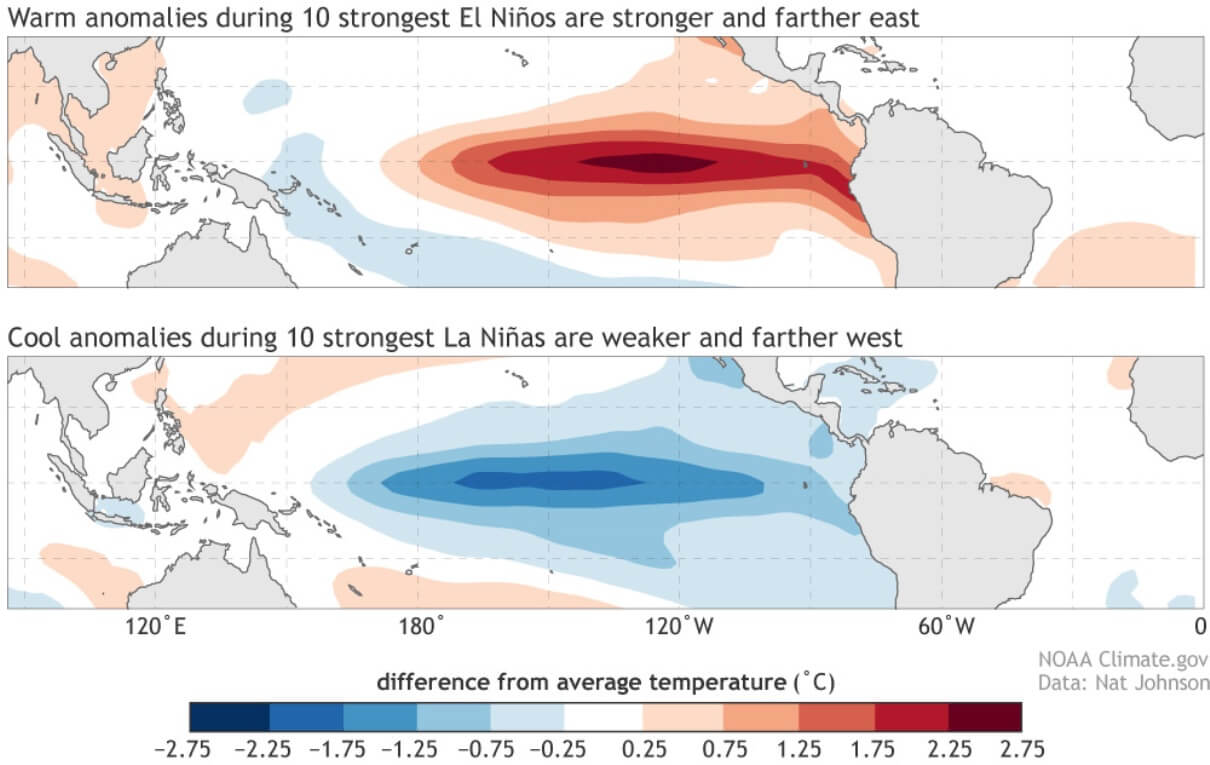
Besides ocean temperature, each phase also brings different pressure and rainfall impacts on the tropics, which, down the line, result in a very different impact on the global weather circulation.
In this cycle, we are entering a strong El Niño, so we can look at the usual changes it makes to the atmospheric circulation. The upward and downward atmospheric motion in the tropical regions is called a Walker Cell, and is especially sensitive to strong ENSO events. The schematic below shows the change in atmospheric motion during a moderate and strong El Niño event, impacting the global weather system.
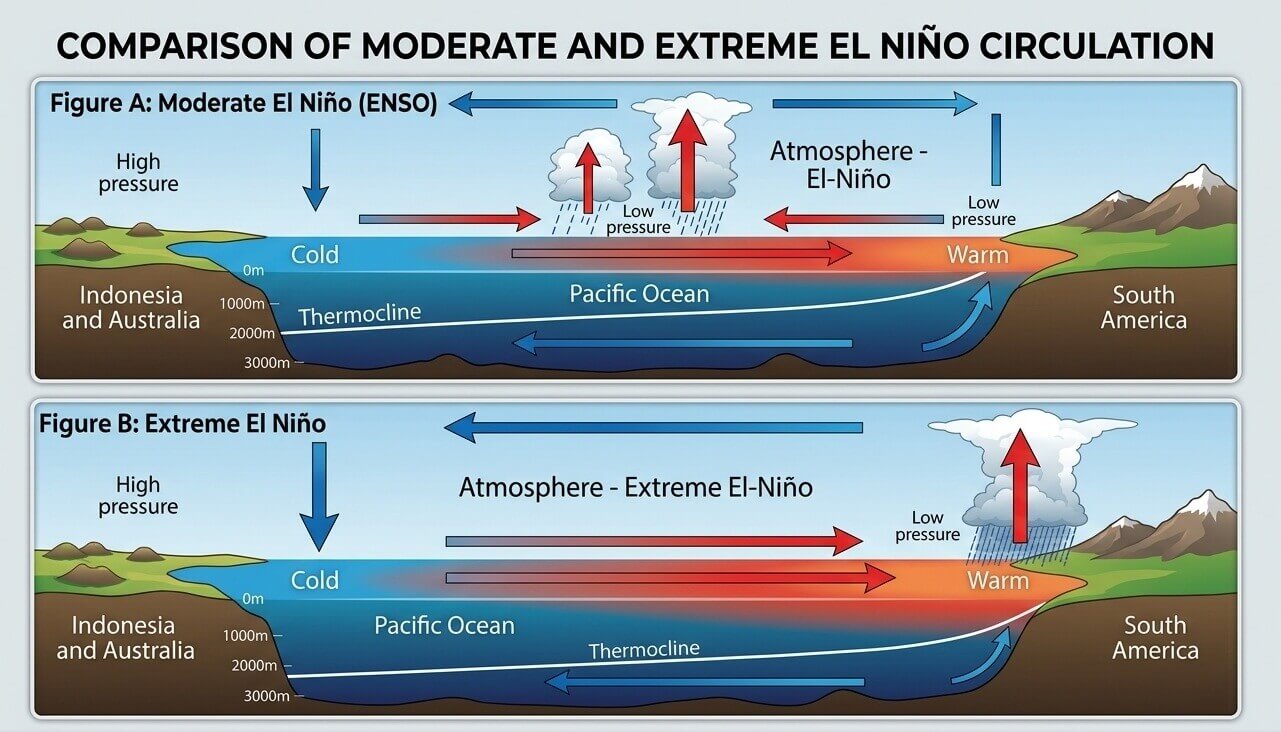
Generally, an El Niño causes a pressure drop in the central and eastern tropical Pacific and a high-pressure zone over the western Pacific. This has a major influence on the tropical rainfall and pressure patterns, filtering into the mid latitudes and the global weather system.
As mentioned in the intro, the latest data shows a Super El Niño event is forecast for the 2026/2027 period. Super events tend to occur once per decade or less. The last three such events were in 2015/16, 1997/98, and 1982/83. Below are graphs from NCEI, showing the monthly progression of each event, starting in spring and peaking during the Winter season, breaking the Super event threshold, which is +2 degrees.
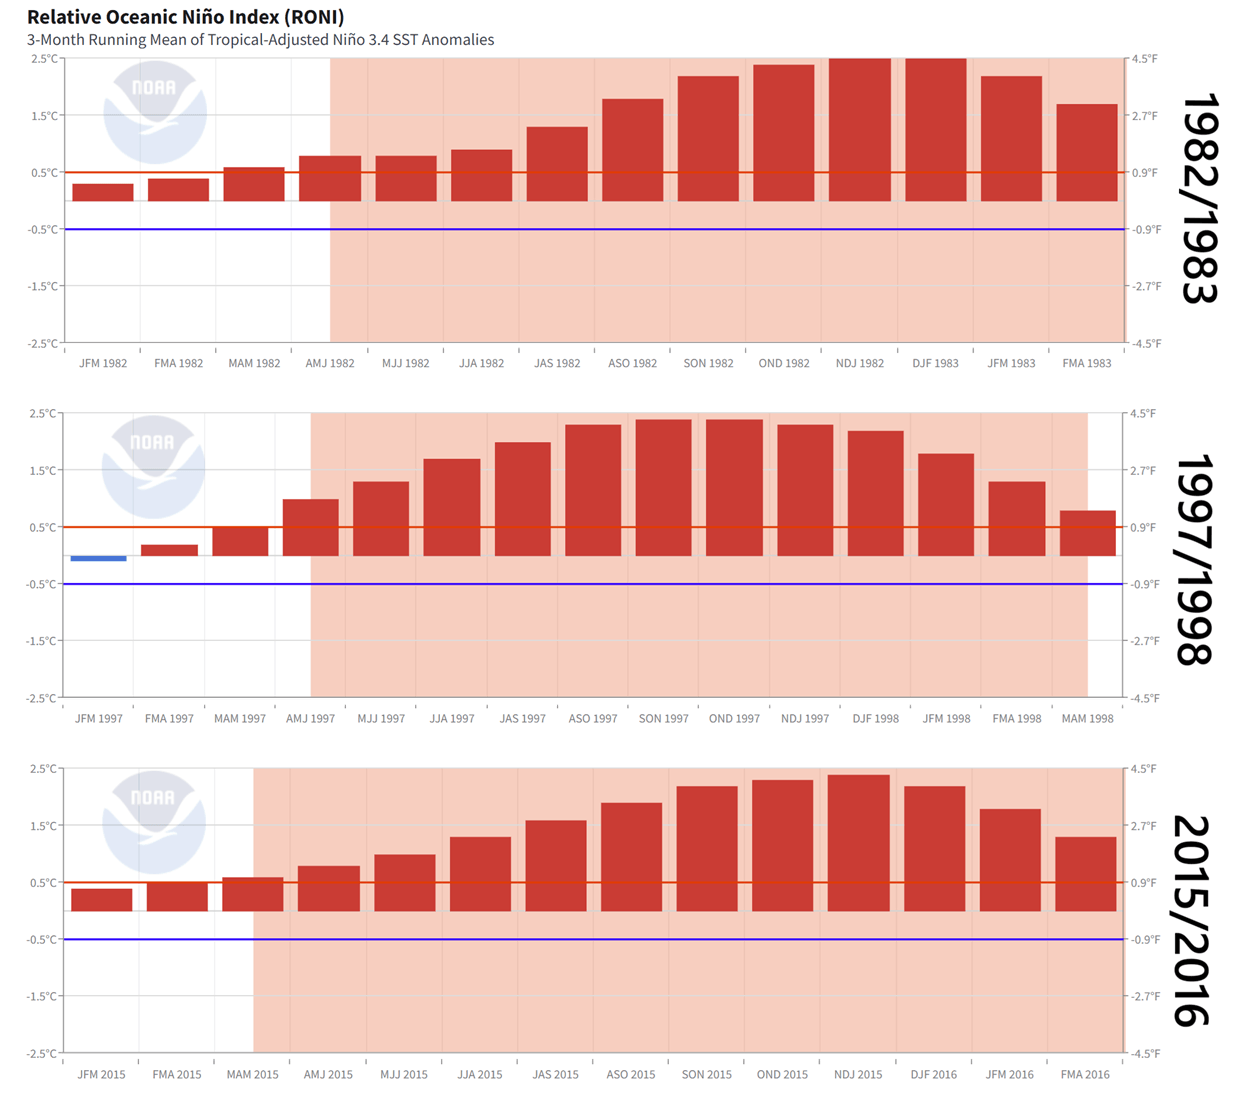
A Super El Niño acts as a massive “pressure release valve” for piled-up warm water and energy in the Pacific. It is a highly energetic event with truly planetary-scale impacts on weather.
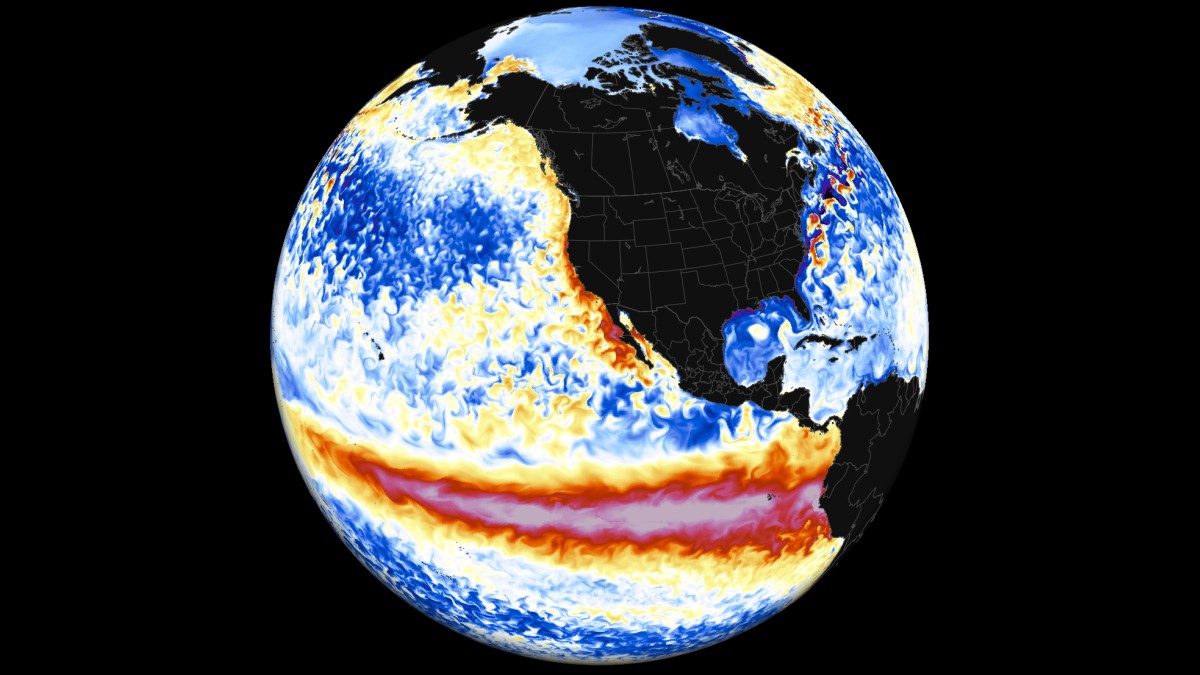
This whole process is nicely visible in the video below, showing a great visualization by NASA Earth. It shows a full life cycle of a Super El Niño, with an example of the latest such event in 2015. You can see a massive subsurface warm anomaly making way towards the eastern Pacific and surfacing, releasing a large warm ocean surface anomaly.
The latest analysis data also shows a rapidly developing warm anomaly both above and below the ocean surface, a clear sign of a strong event starting to unfold.
Subsurface Monitoring: Tracking the Historic Rise of the 2026 El Niño
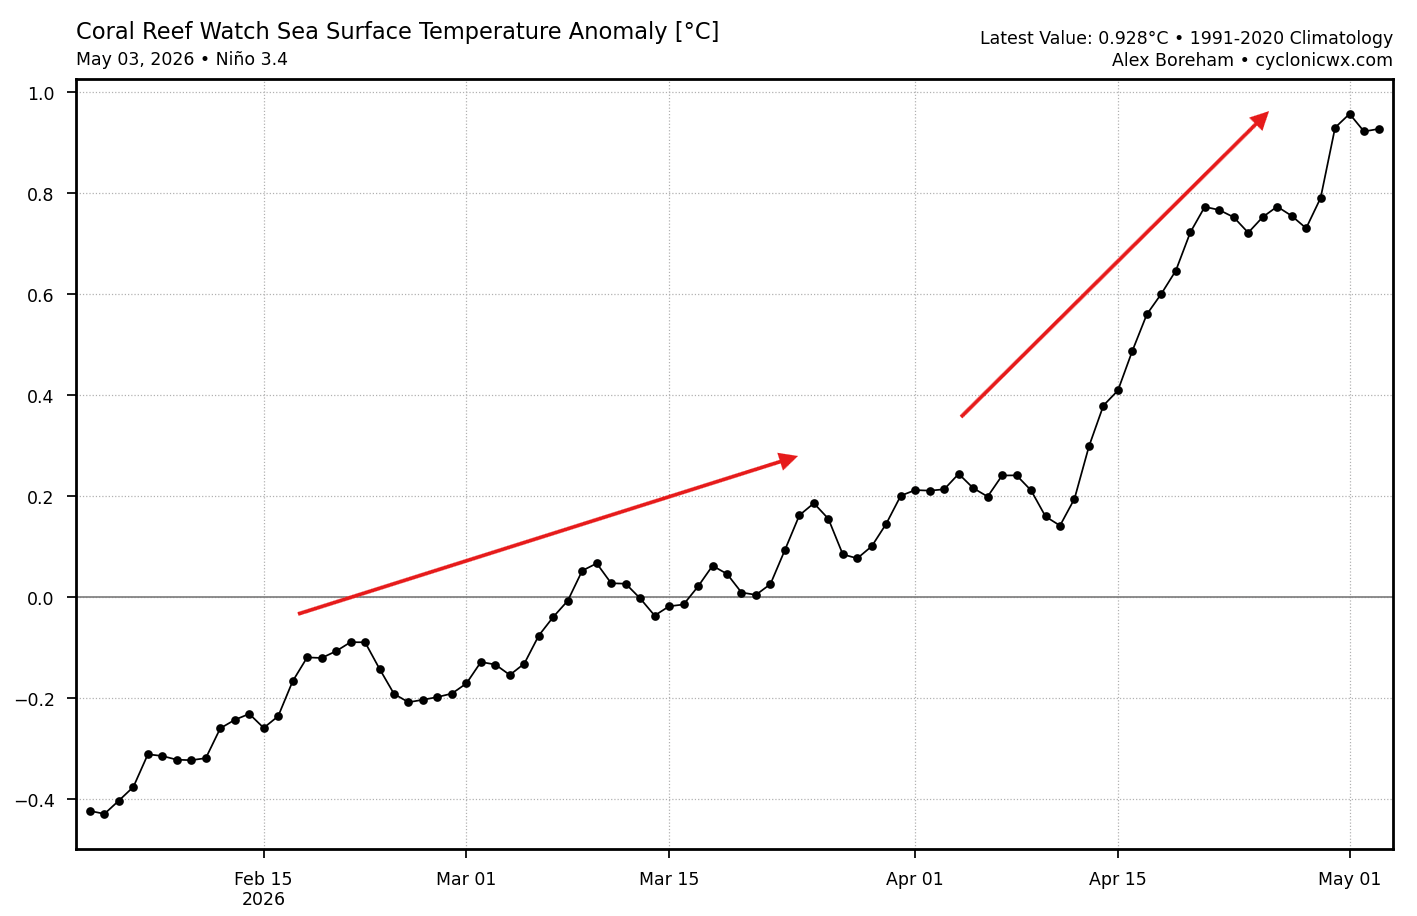
The first evidence of a rapid shift in the Pacific is seen in the analysis graphs below, which show the anomaly data for the past 3 months in the main ENSO region. We can see a rapid rise in the temperature anomaly since January, but it really shifted into second gear in recent weeks. The official threshold for an El Niño event is +0.5, sustained over a seasonal period.
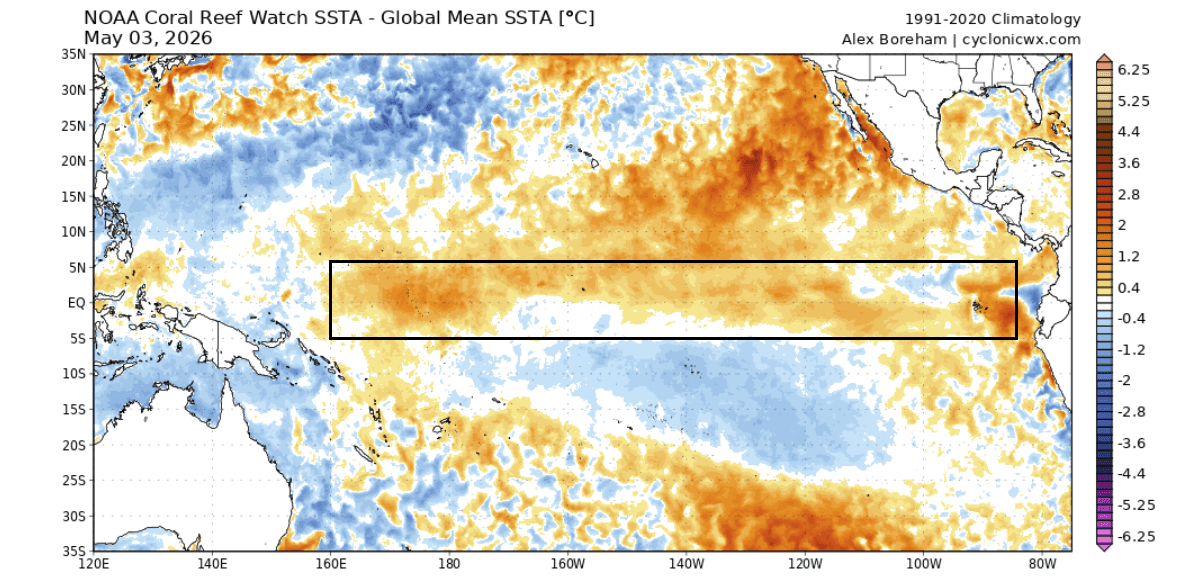
The latest ocean analysis below shows the main ENSO region being covered in emerging warm anomalies. This is actually an analysis with the global average removed, so it shows the pure warm signal of the emerging El Niño, expected to rise much higher in the next few weeks.
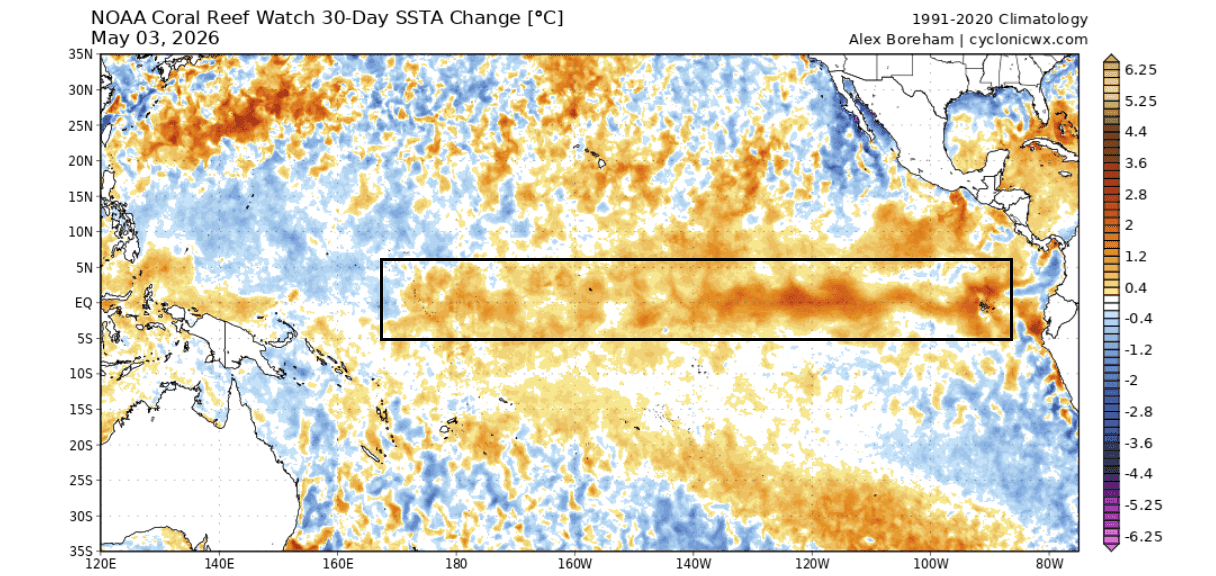
We can also see the rapid change if we look at the latest 30-day ocean temperature anomaly change. You can see a significant ocean anomaly rise exactly across the ENSO regions in recent weeks. As expected, the peak warming was in the eastern parts, where a Kelvin Wave is starting to rise from below the ocean surface.
Speaking of the depths, below are subsurface temperature anomalies across the tropical Pacific in the top 300m (1000ft) of the ocean. The image shows a direct comparison of subsurface anomalies for the first week of May, between this year and the last two Super El Niño events. The strong, warm anomaly is called a Kelvin Wave and is pushed below the surface towards the central and eastern regions, where it begins to rise to the surface.
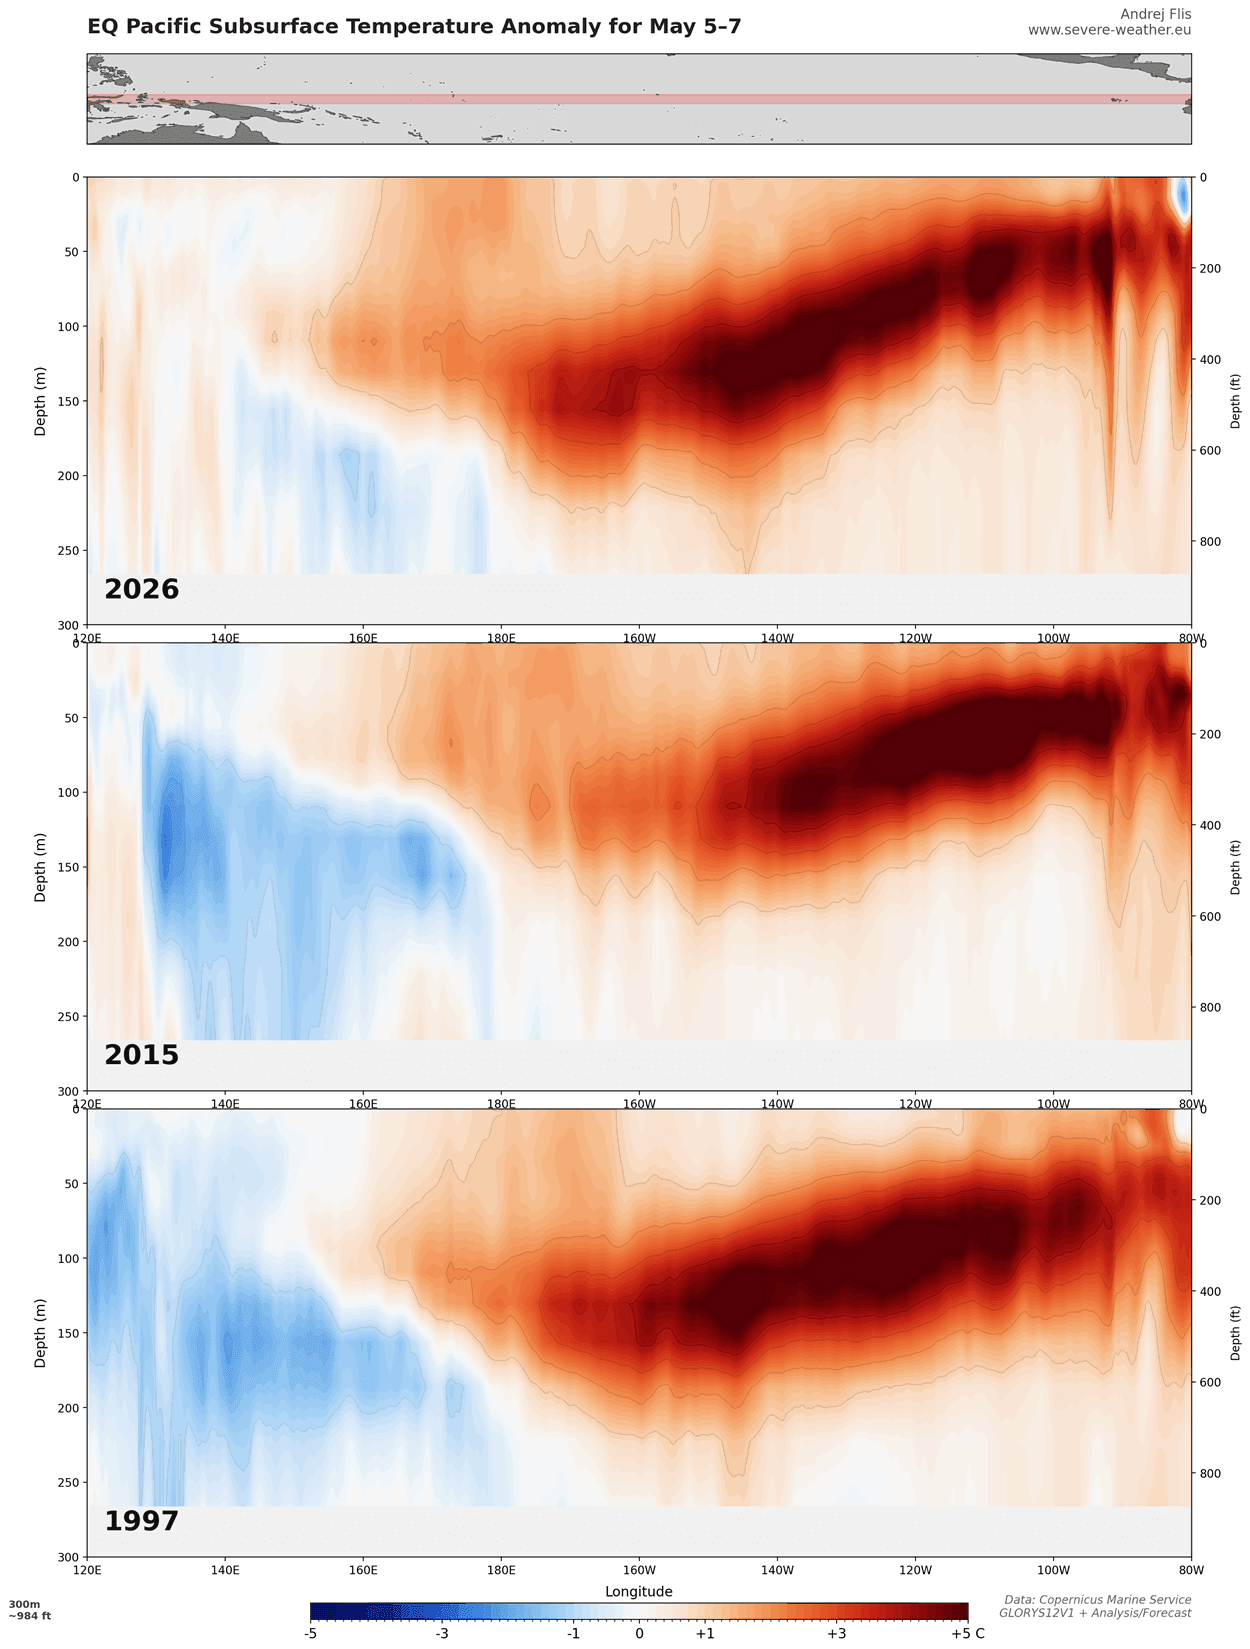
We can see that this year we are well on par with the last two Super events at this stage of development. In fact, it is evident that the western tropical Pacific is currently still warmer than during the last two super events at this time. This shows that the warm supply from the west is not yet fully utilized, so the Kelvin wave is likely not yet at max power.
These subsurface Kelvin waves are driven by the westerly wind bursts or weaker trade winds, pushing the warmer subsurface ocean waters to the east, where they rise to the surface. This is a great example of how the atmosphere can drive the ocean changes.
This is also reflected in the seasonal forecasts, which currently indicate we could be facing a record-breaking El Niño event this year and next.
New Long-Range Forecast: The Super El Niño 2026 Confirmed
A Super El Niño is scientifically recognized when sea surface temperature anomalies in the Niño3.4 region exceed a threshold of +2.0 or higher above the long-term average. This is to identify the strongest events, which usually have a high impact on the atmosphere.
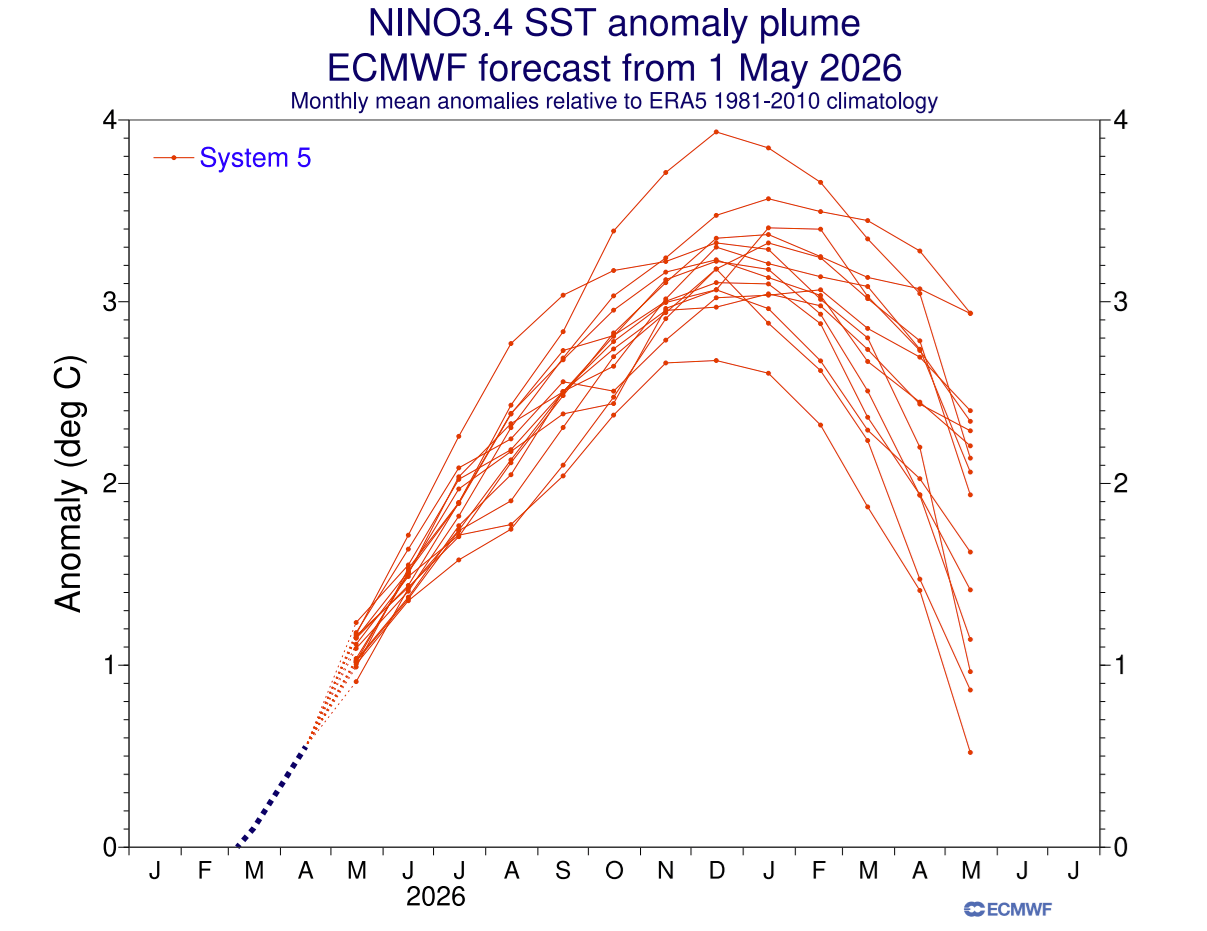
Below is also the latest extended ECMWF long-range forecast for the next few months. This shows a strong El Niño developing into 2026, easily exceeding the +2 degrees super event threshold and pushing it into the extreme event in the +3 values. Most ensemble members exceed this boundary, aiming for a historical event, if verified.
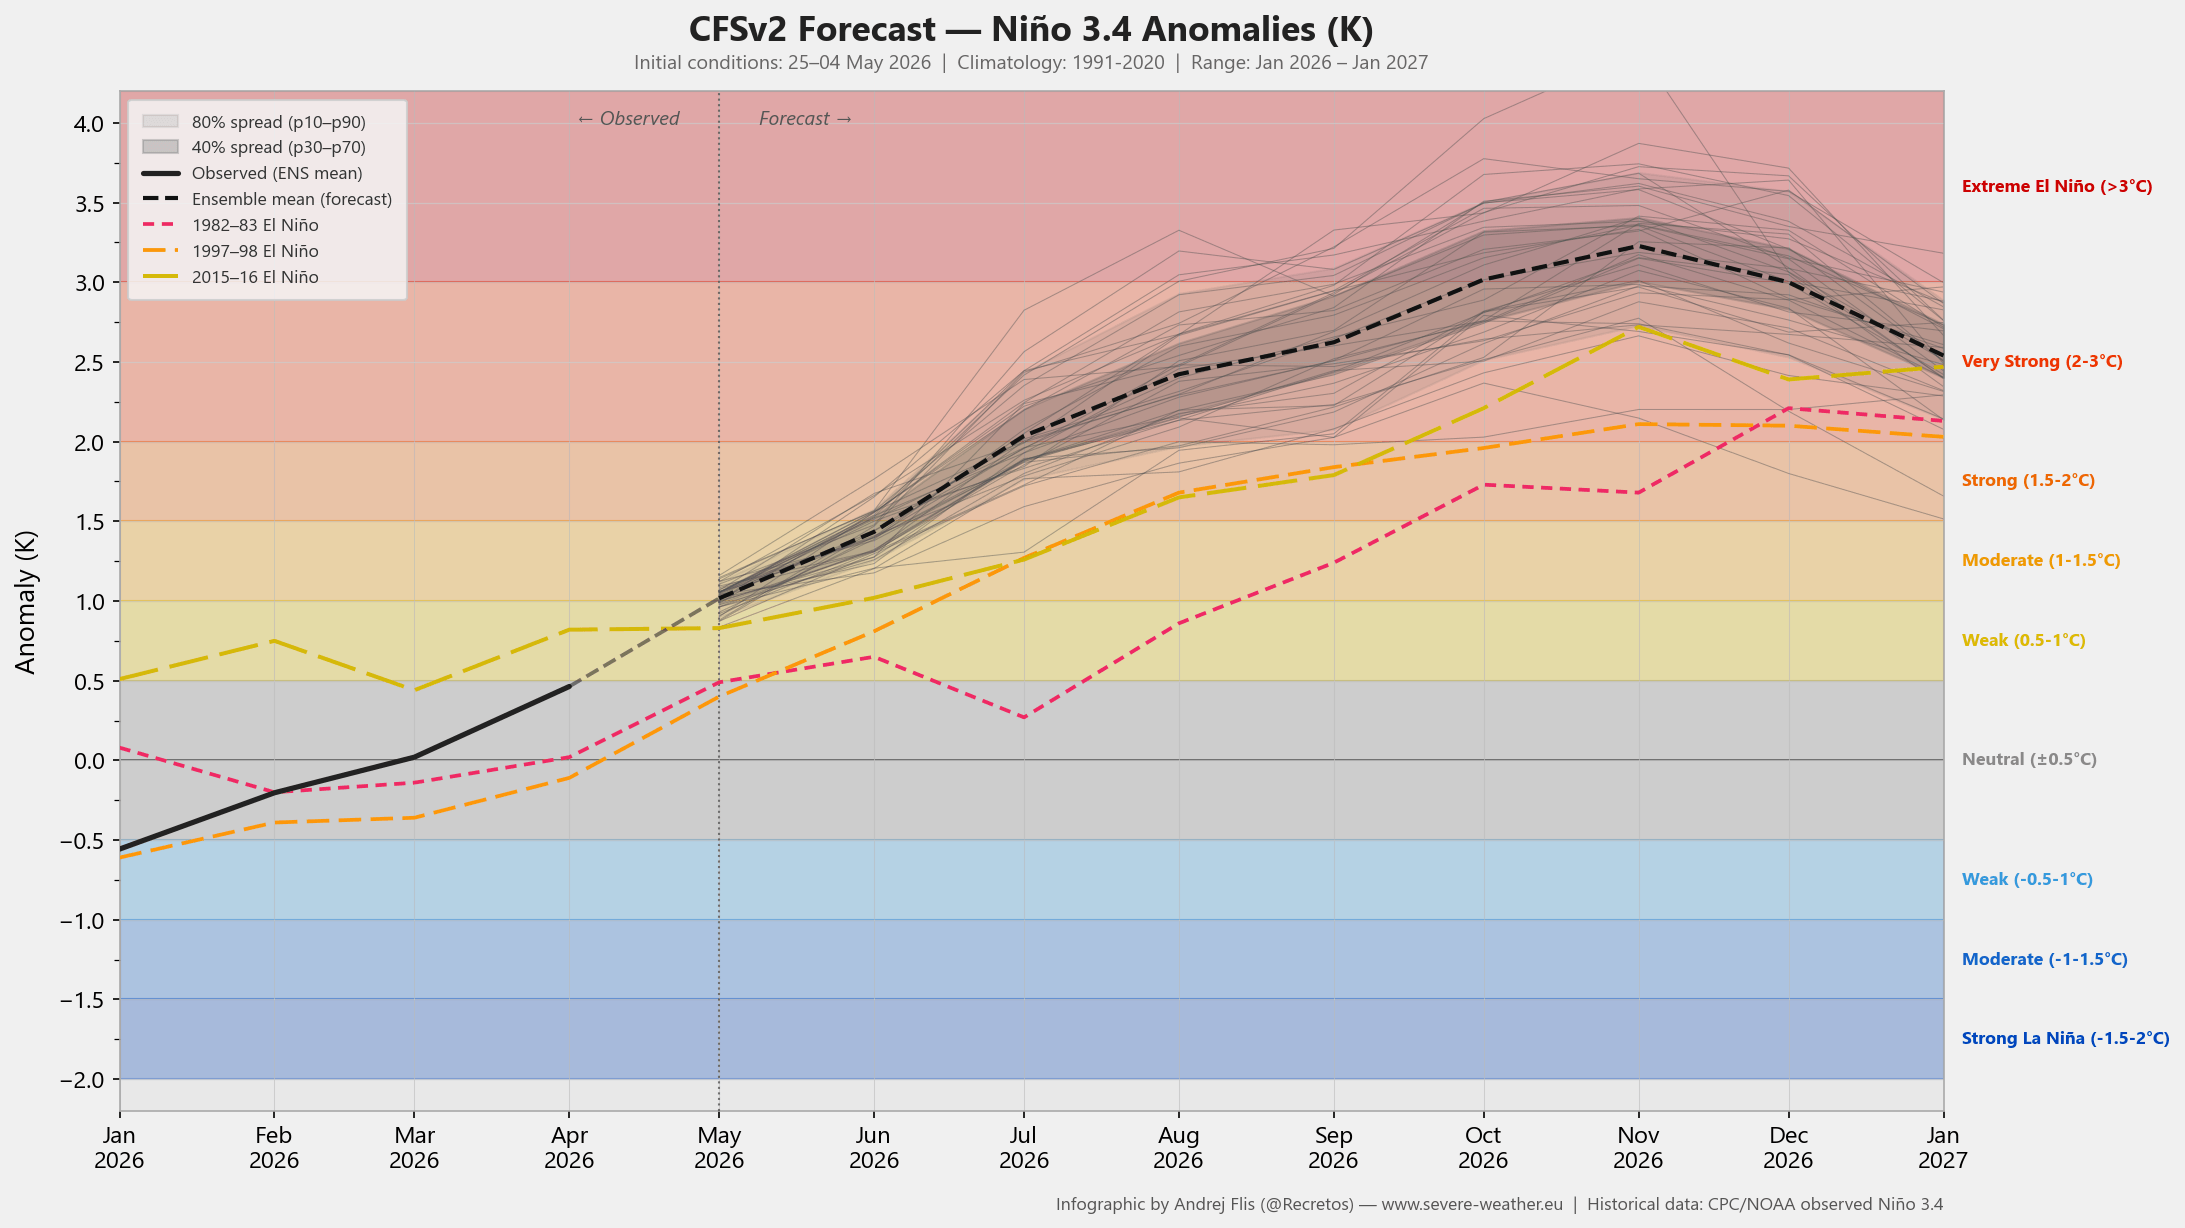
Below is also the latest ENSO forecast from NOAA’s CFSv2 model. It shows a very similar story to the ECMWF, with a very strong El Niño developing, rivaling the strongest Super El Niño events of recent history. The development is also rapid enough to directly impact the summer weather patterns and the summer storm season across the United States, Canada, and Europe.
A Super El Niño event would lead to more extreme weather shifts, turning typical seasonal changes into high-impact events like massive flooding, severe droughts, and significantly altered storm tracks that can affect the entire planet.
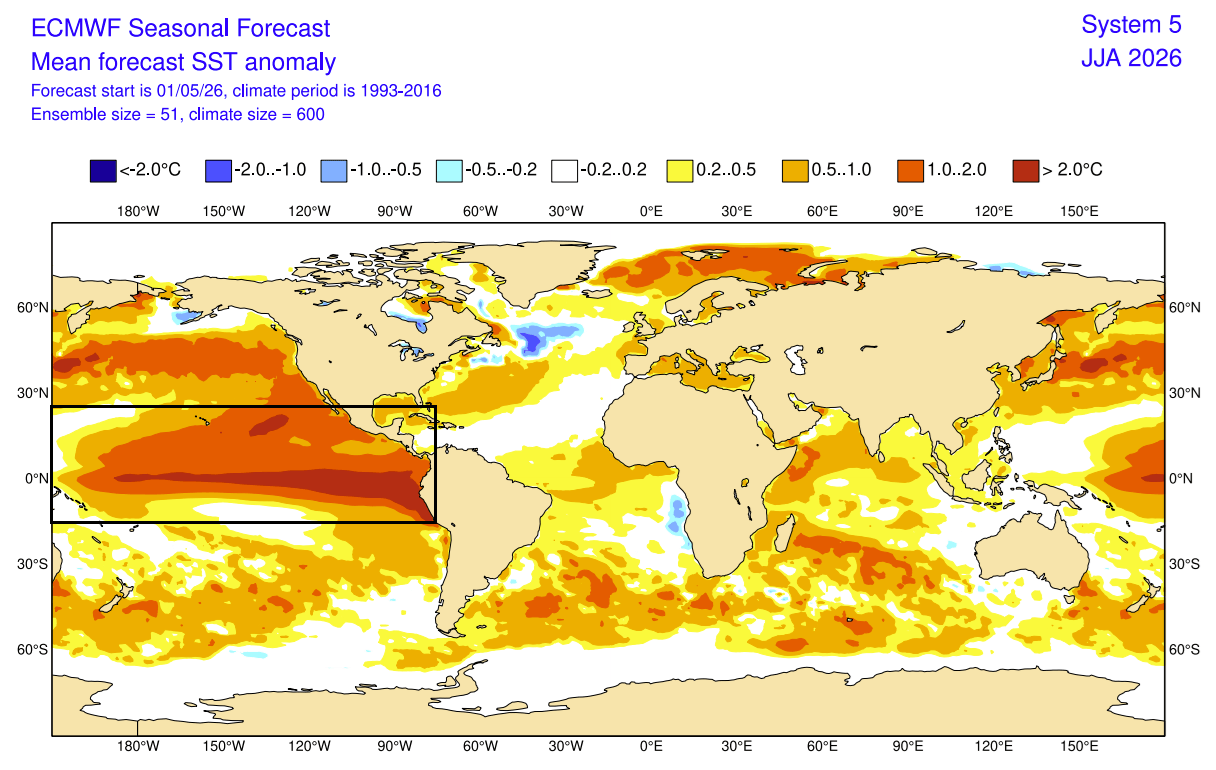
The latest ECMWF forecast for the meteorological period shows a strong El Niño anomaly already present across the tropical Pacific. The values exceed +2 degrees across the whole ENSO region, a remarkable anomaly already during the summer season.
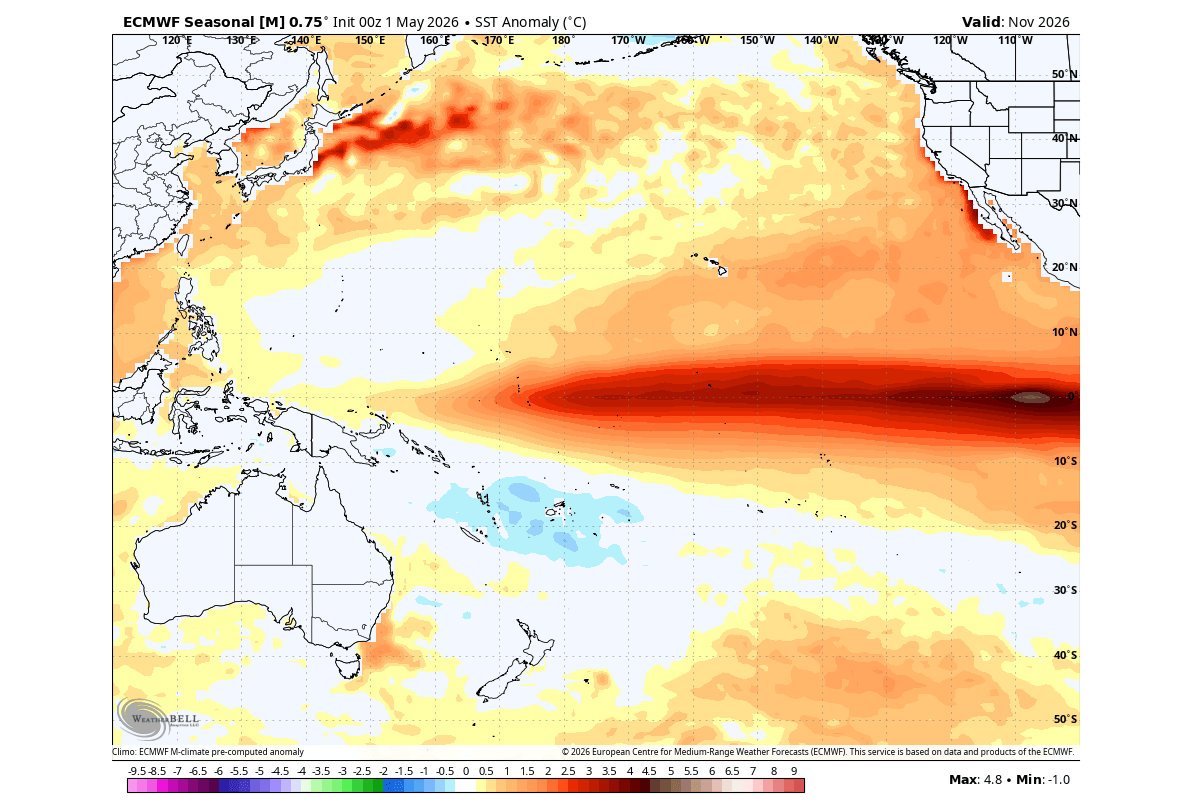
El Niño events usually peak later than summer. The latest forecast now reaches into Fall, revealing the ocean temperature anomalies as far as November 2026. We can see a really strong event, with anomalies peaking over +4.5 in the eastern regions. This is only a forecast, but if it were to verify to this extent, it would merit a historically record-strong El Niño event.
The latest forecasts are also continuing a trend of showing a stronger El Niño with each new forecast run, as they adjust to the latest atmospheric development, rivaling the strongest events of the past.
Historical Perspective: Comparing 2026 to the Record-Breaking Super Events of the Past
We produced a special custom plot, which compares the most recent forecasts with the historical El Niño events. Some of the strongest events since 1870 are plotted in the image. The forecasts from 3 different authorities all show a record-strong El Niño event, not seen in modern history, and likely to peak higher than any El Niño in the past 155 years.
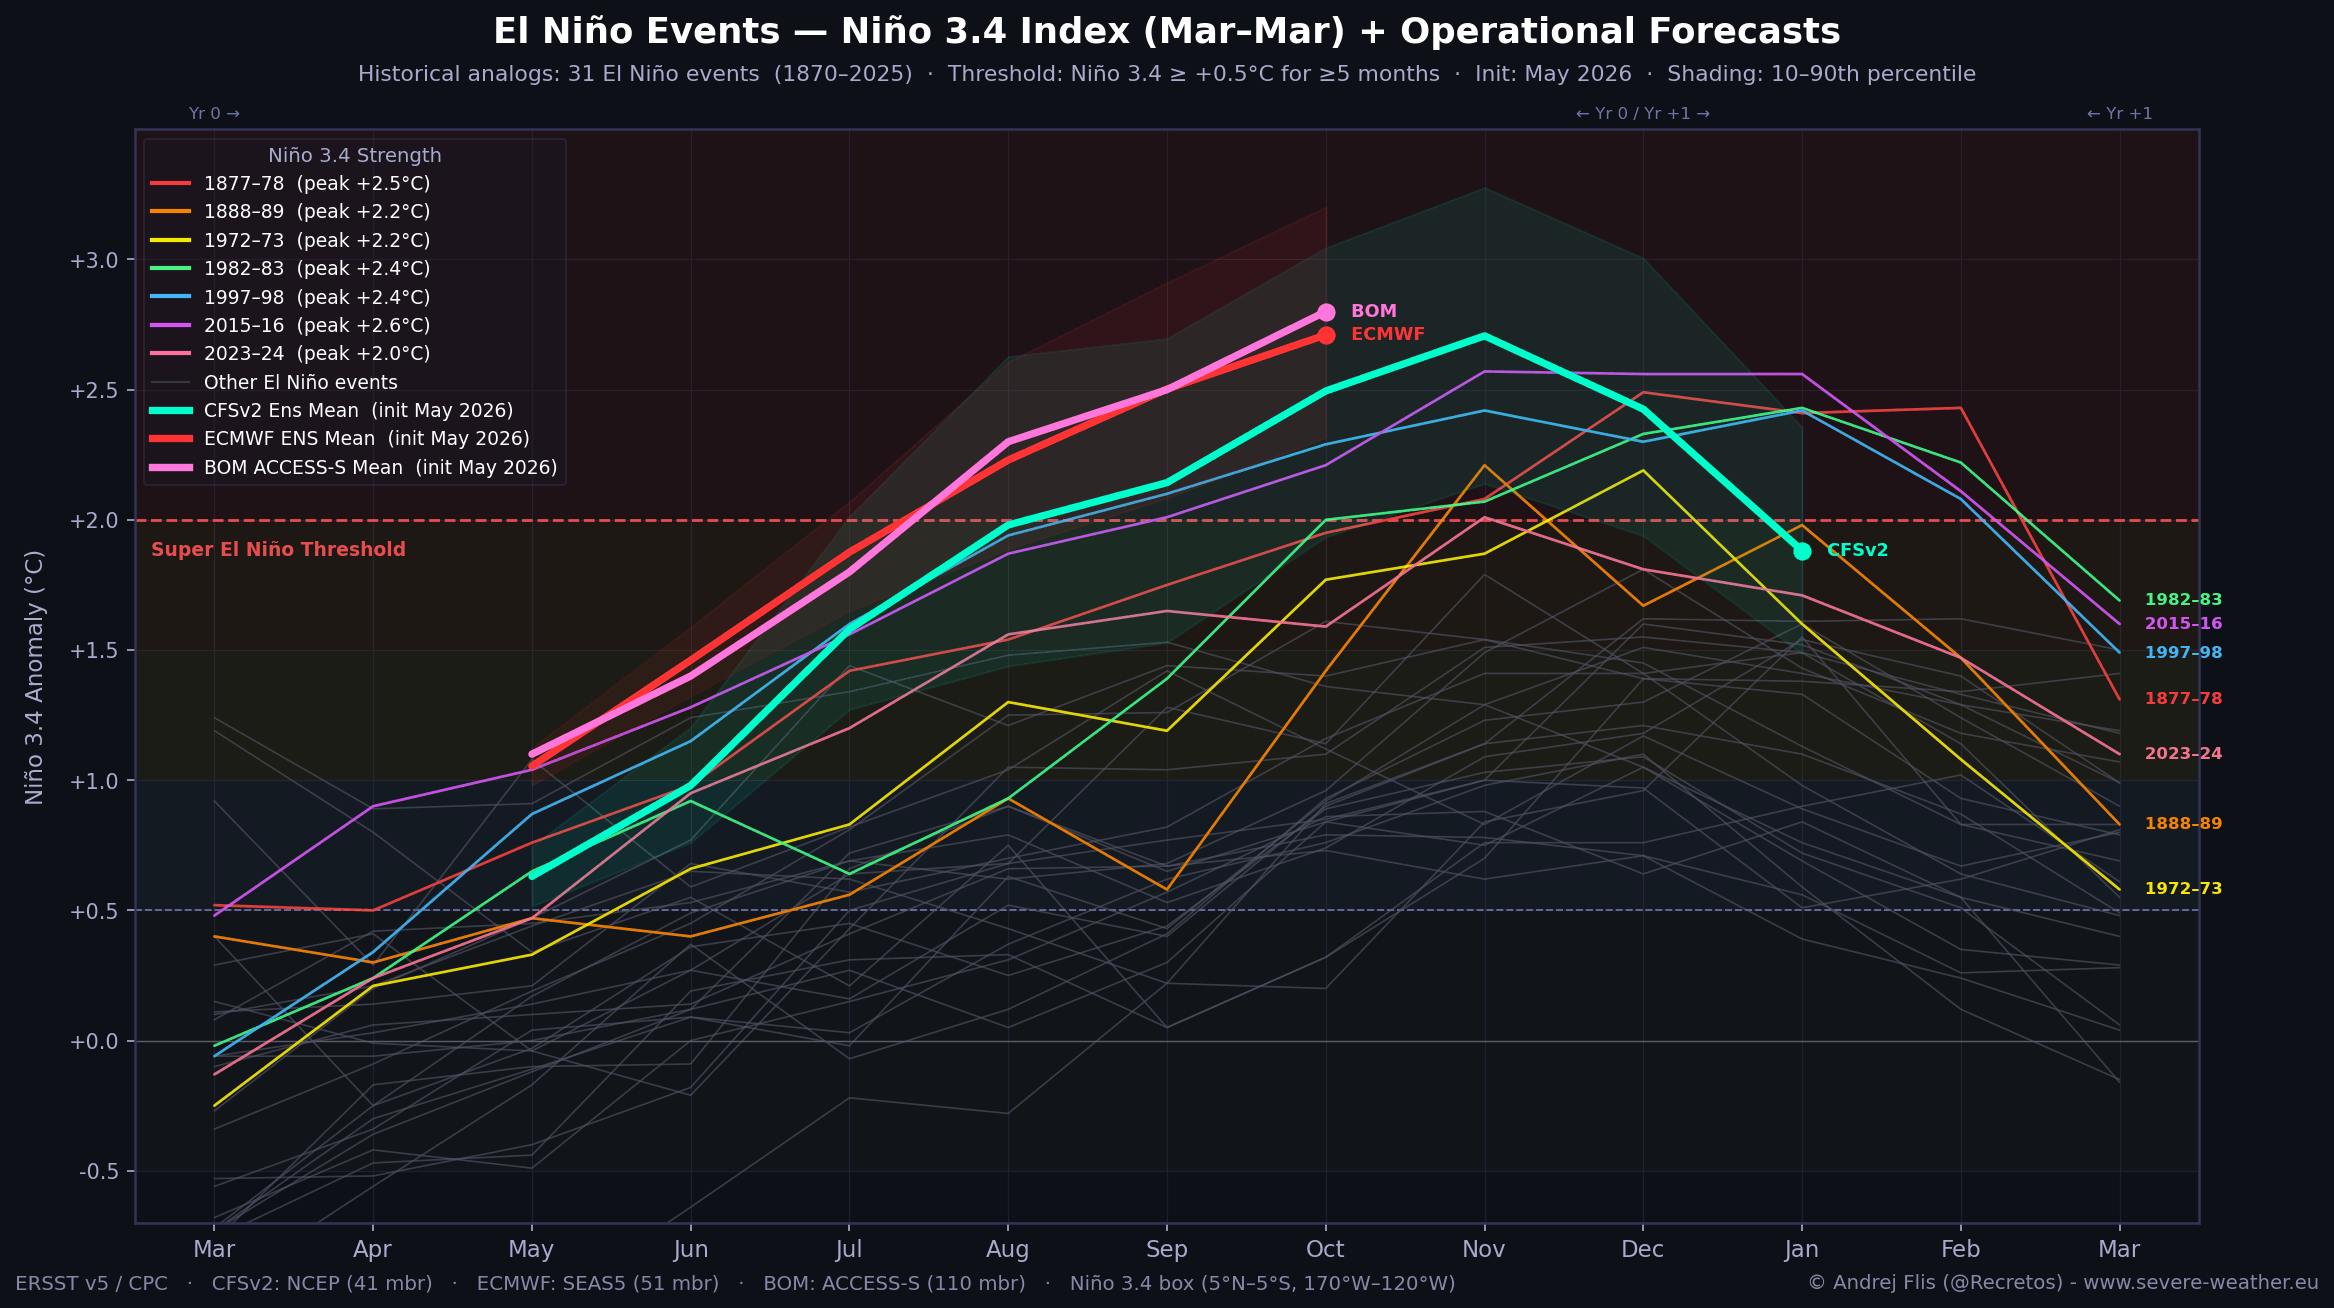
Forecasts are from the NOAA CFSv2 model in the United States (cyan line), the European ECMWF (red line), and the Australian BOM (pink line). Three different forecasts from different continents and from different modeling authorities, yet all agree that we are heading for a strong event in 2026/2027.
The projected 2026 intensification (ECM+BOM) is currently outpacing the evolution of the 1997 and 2015 Super El Niño events. This signals a high-impact transition for the global atmosphere, also known as a “code red” atmospheric scenario.
But it’s not just the strength of the forecast that matters. We are also observing a trend in which each new forecast shows a stronger event. Below is an example from the last three ECMWF forecasts for the main ENSO region, released in March, April, and May. You can clearly see that each new run shows a stronger event.
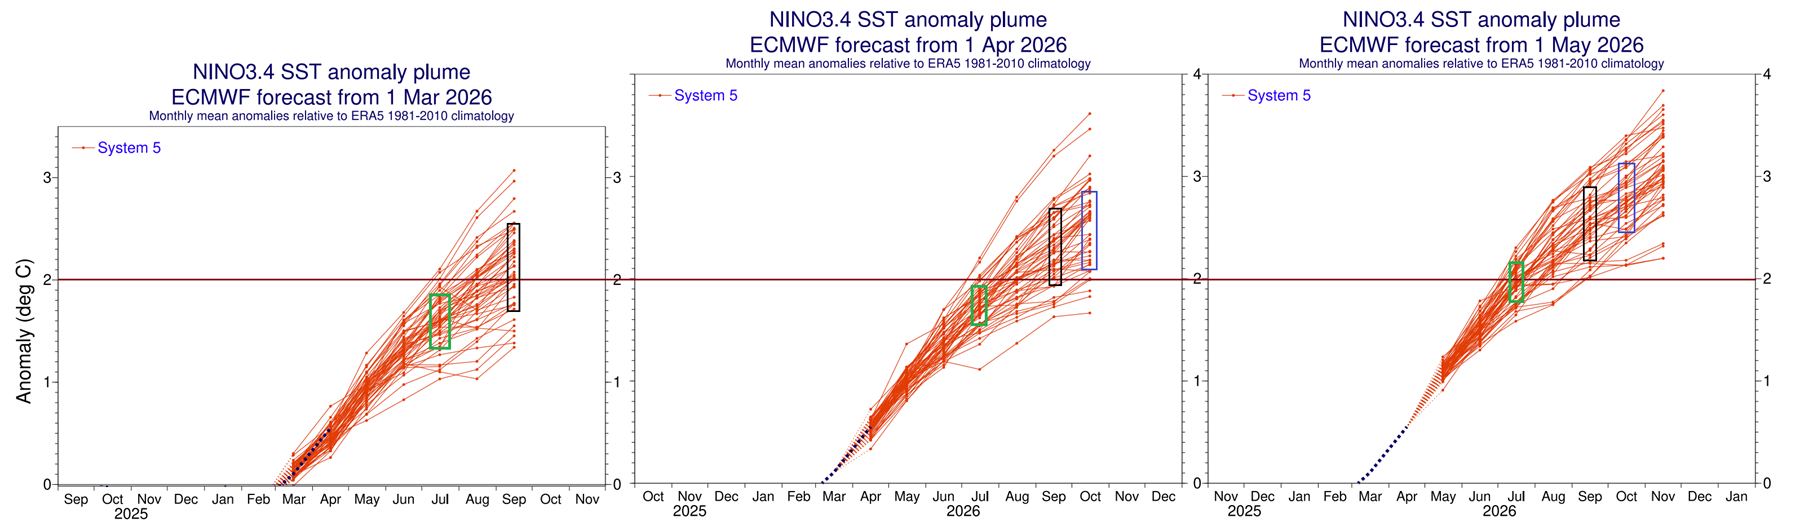
This is because the latest data is always used to produce a forecast. And the closer we are to the development of the El Niño, the clearer the initial analysis is, from which the forecast is produced. We can clearly see forecast points for individual months rise higher in each new forecast.
If we compare the ocean temperature anomalies between the latest and previous forecast, we can first look at the July forecast. The image below shows how the latest forecast differs from the previous one. And we can see just how much warmer the new forecast is across the equator (0N line), with up to a whole degree warmer than the previous forecast.
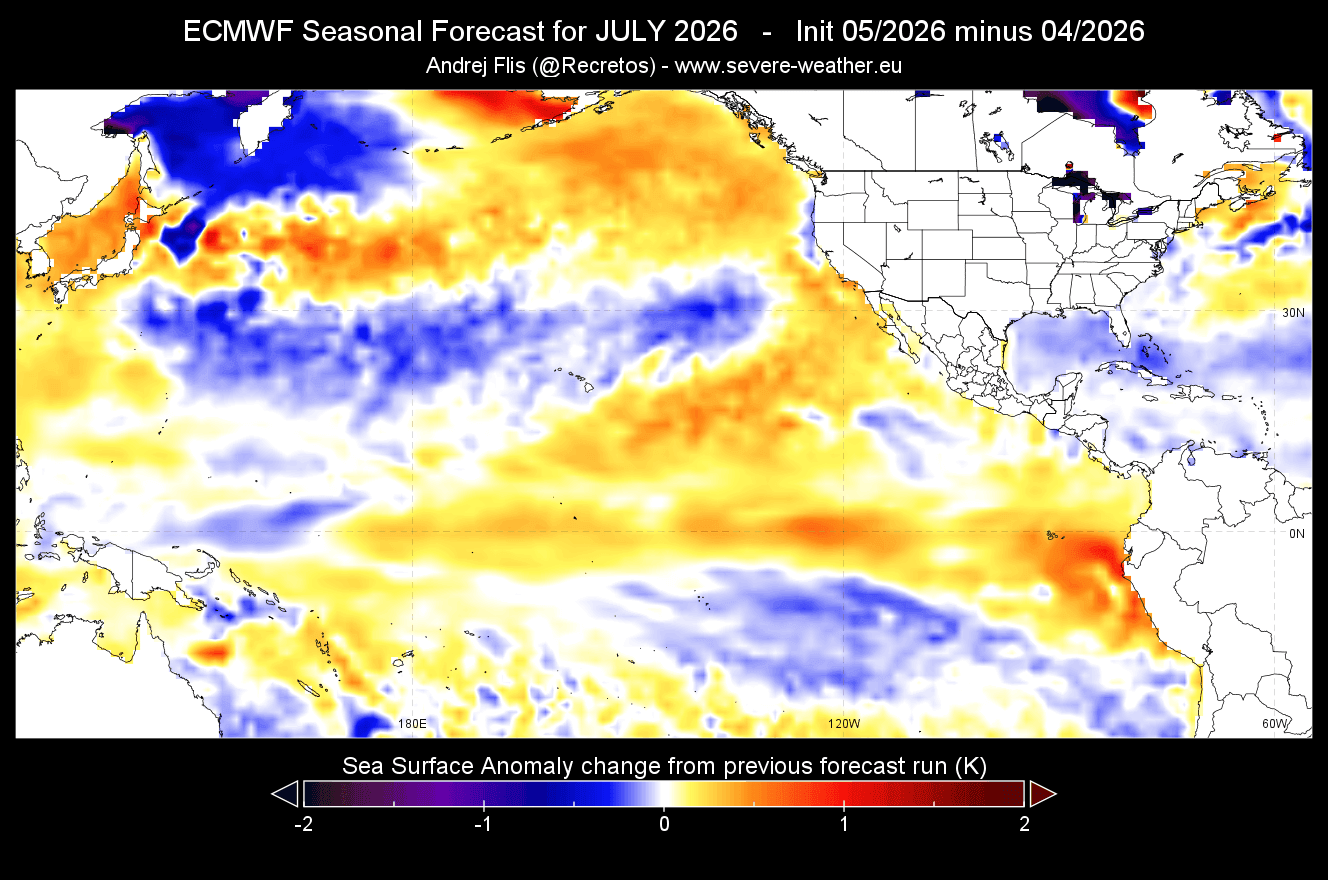
We also see the tropical Atlantic trending colder, while the northeastern Pacific is trending warmer.
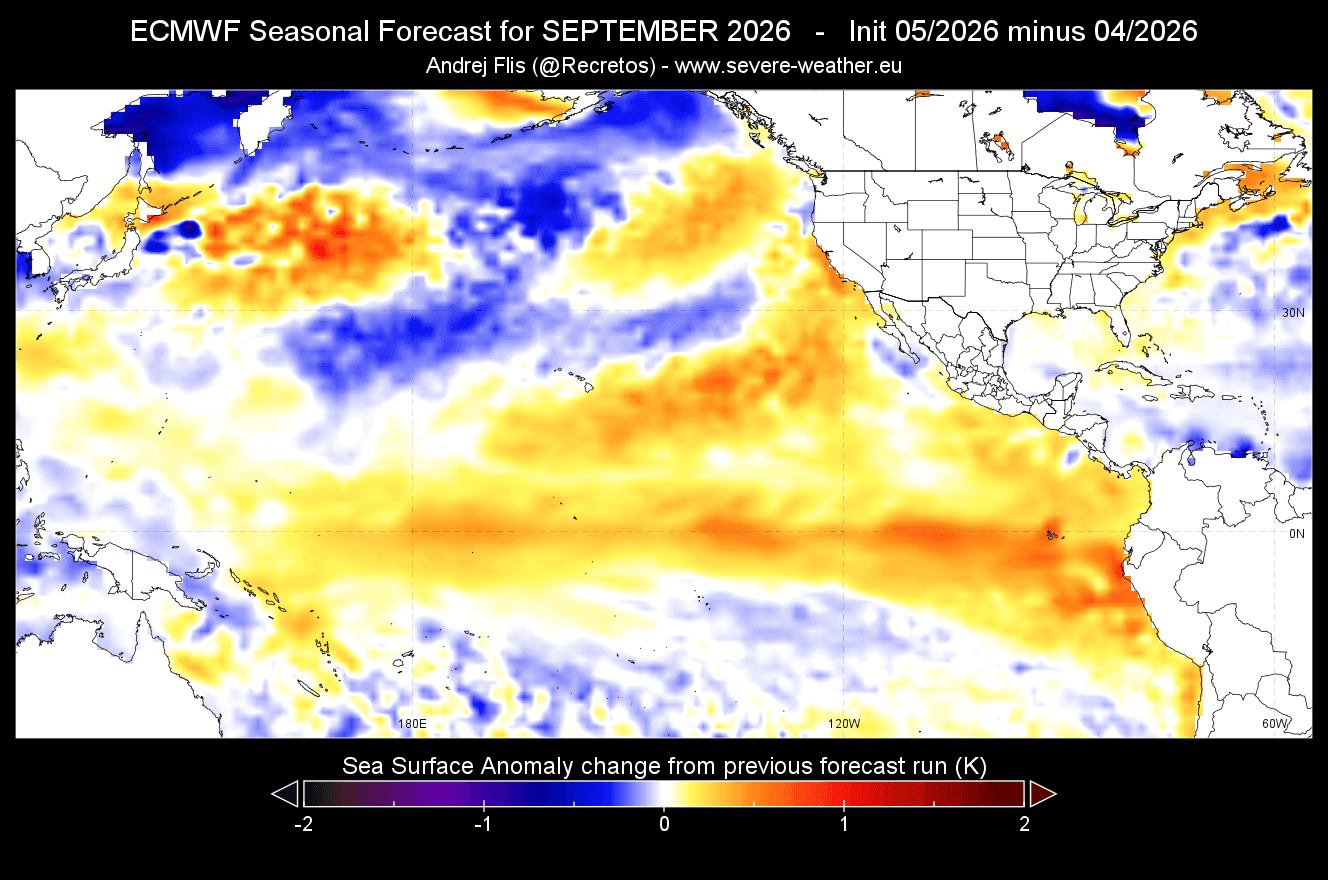
The forecast difference for September 2026 is even clearer, with the latest forecast showing warmer conditions across the whole equatorial Pacific, indicating a stronger El Niño than previously expected. Here, we can also note the colder-trending tropical Atlantic, which will have implications for the Hurricane season.
This, combined with similar strength forecasts from other global weather centers, gives strong confidence that we are about to experience one of the strongest El Niño events in modern history.
Atmospheric Response: Walker Cell Intensifies and Shifting Summer Patterns
As seen above, the El Niño forecast shows rapid intensification, which means we can expect atmospheric impacts as meteorological Summer begins.
We can already see this impact clearly in the latest July 2026 forecast for Velocity Potential. This shows a strong anomaly of rising air in the Pacific and sinking air in the Indian Ocean, revealing the atmospheric circulation and the state of the Walker Cell. This confirms an El Niño configuration in the atmosphere in early Summer. Image by meteorologist Ben Noll.
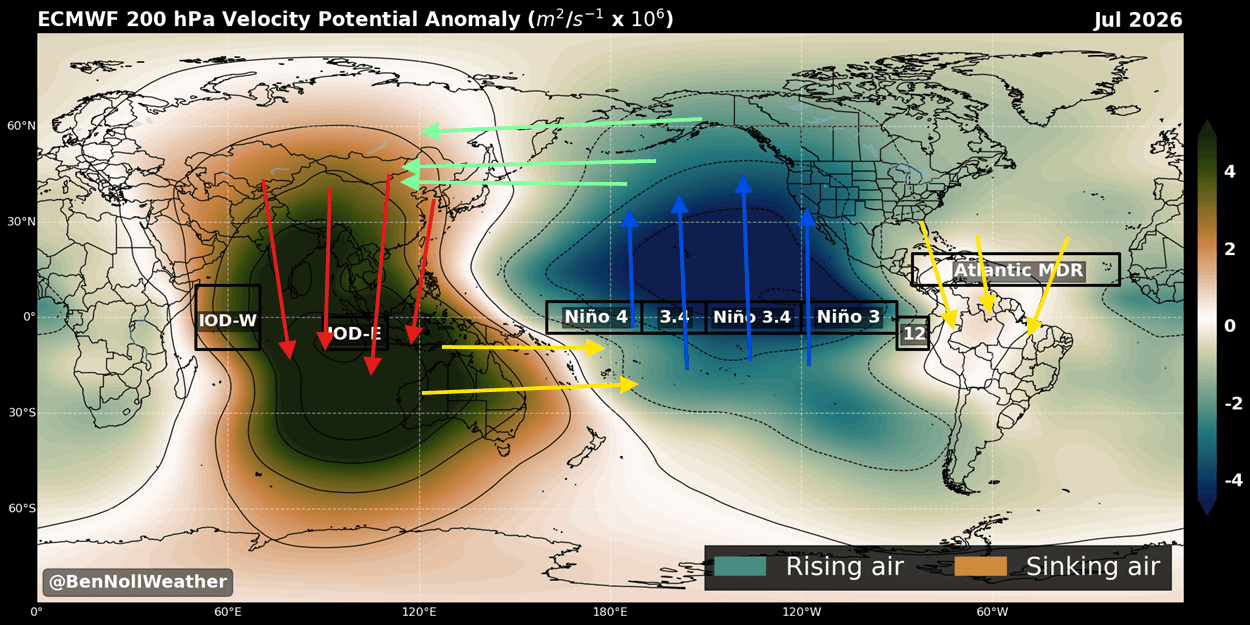
This is the exact same circulation pattern we showed in the first part of the article, with heavy lifting in the central and eastern tropical Pacific and subsidence in the west and the Indian Ocean.
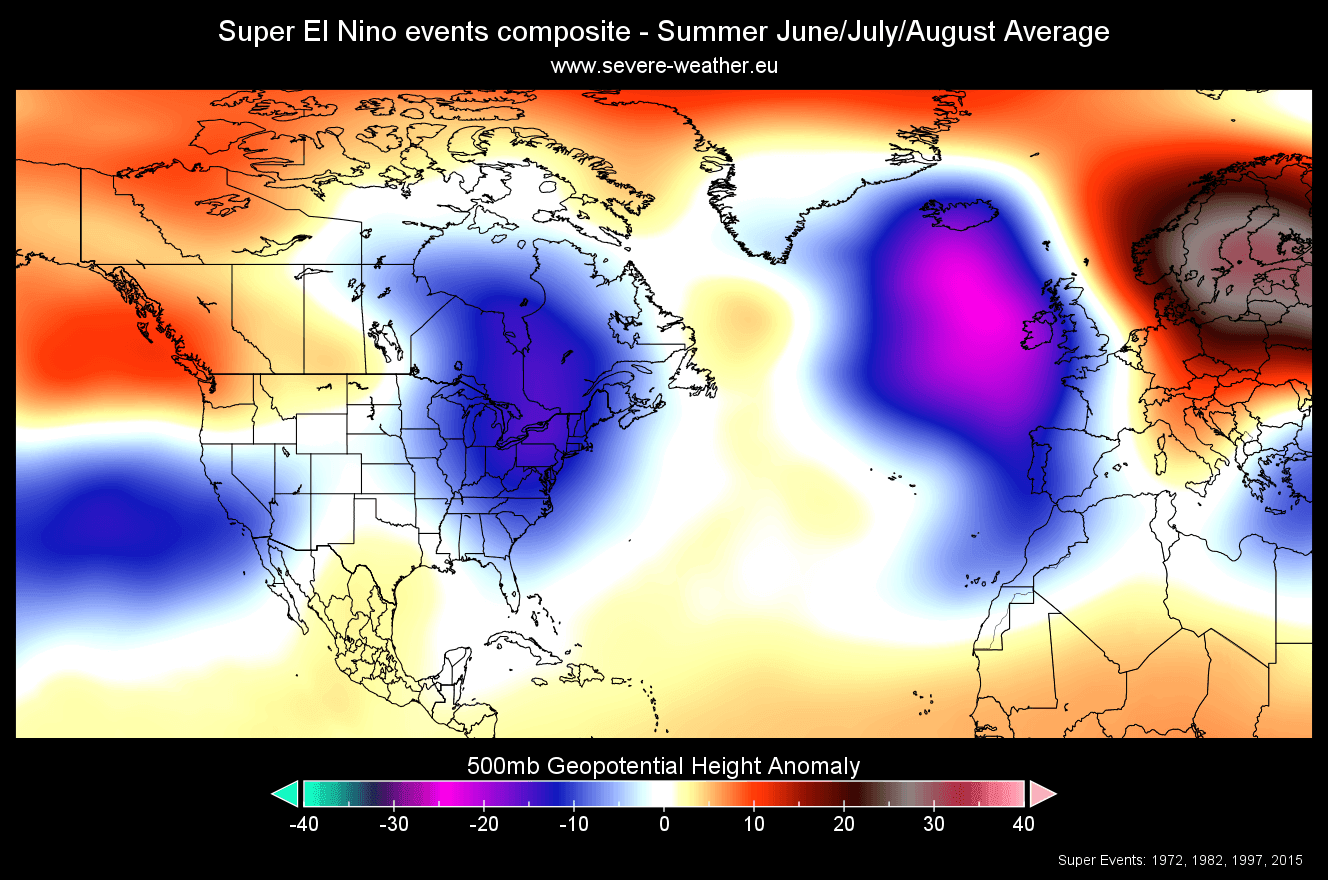
Below is the meteorological Summer reanalysis for the pressure anomaly pattern during the start of the Super El Niño years. The reanalysis shows a low-pressure area signal around the eastern United States or eastern Canada, along the west coast of Europe, and in the North Atlantic. A dominant high-pressure area is indicated over Europe.
We can see this pattern reflected in the latest June-August forecast: a low-pressure area over the eastern U.S. or eastern Canada supports a more northerly flow, bringing normal summer temperatures across eastern Canada, the Midwest, the northeastern United States, and the East Coast. Above-normal temperatures are forecast for the central and western U.S. and western Canada.
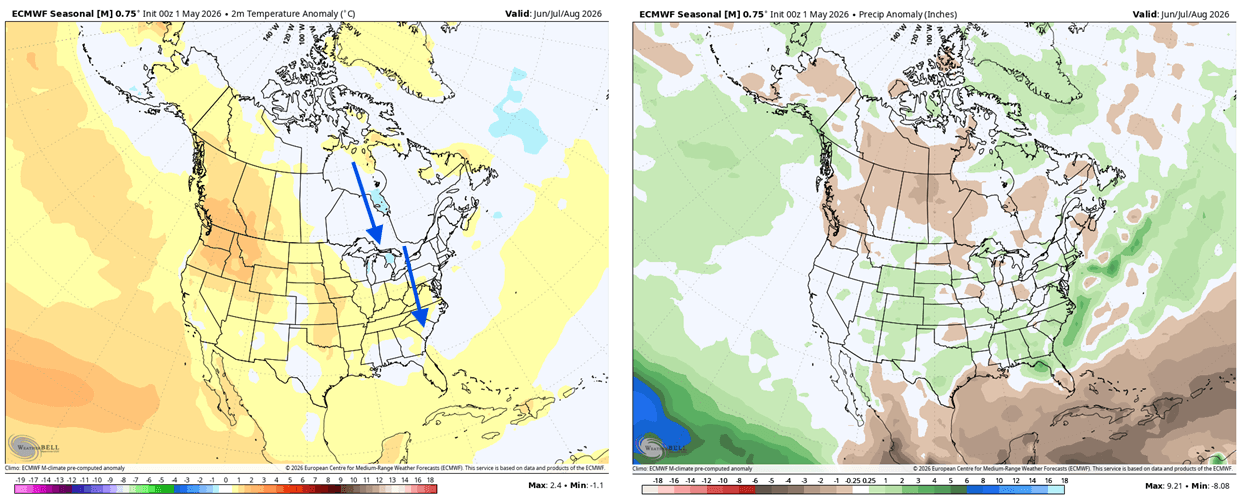
The rainfall pattern also reflects a developing El Niño influence, as that usually brings a stronger subtropical jet stream across. This creates more rainfall over the southern half of the United States, but the forecast also shows more rain over the northern Plains and in the upper Midwest.
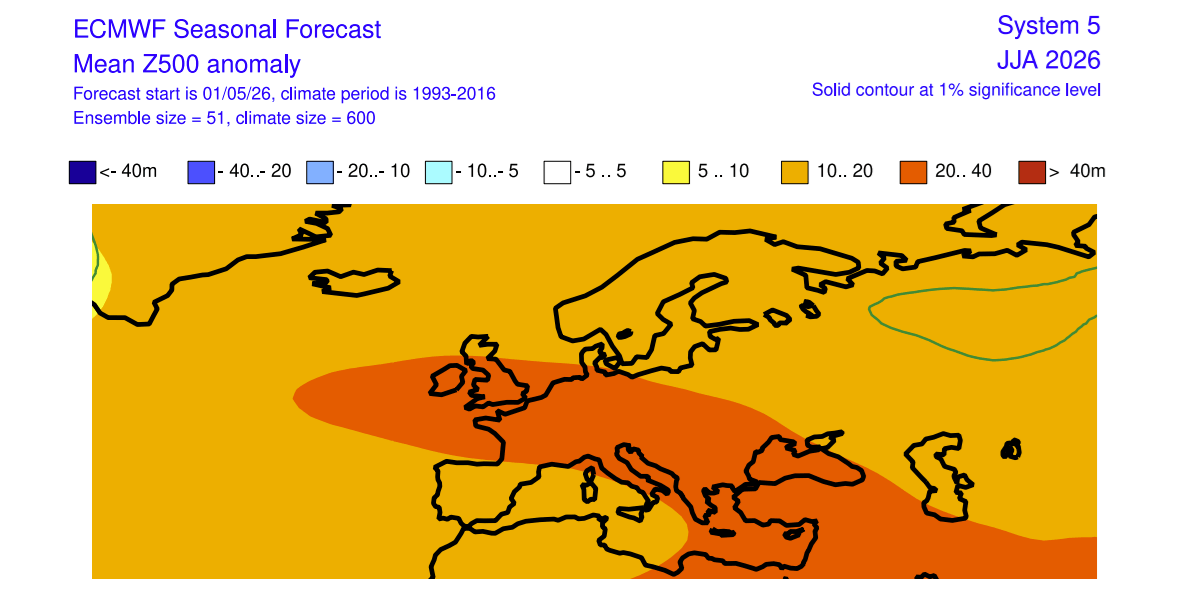
Over Europe, we can also see the exact weather pattern with a high-pressure zone, as indicated by the analysis above. In this case, we see a heat dome over the central and western parts. That also corresponds with the forecast for below-normal rainfall over the central, western, and northwestern parts.
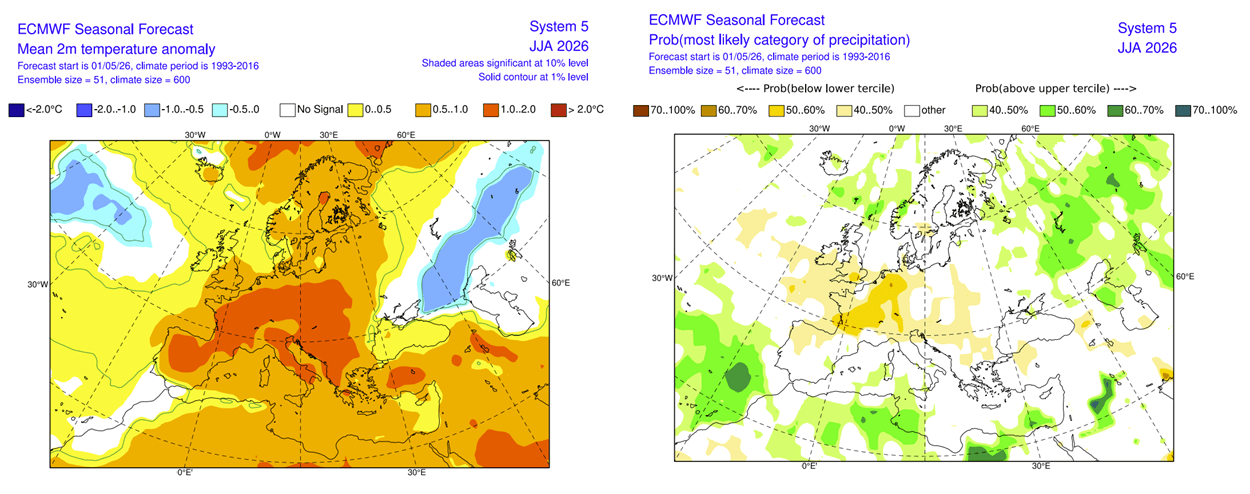
This indicates a clear presence of a high-pressure system over the continent, but instead of over the north, it seems to be positioned a bit to the south, over the central parts and over the UK. This is directly confirmed by the ECMWF pressure forecast.
But as mentioned above, the real peak of El Niño comes later, during Fall and Winter. And the latest round of long-range forecasts now also reaches into Fall 2026, and we can look at some early trends to spot a potential El Niño influence.
The 2026/2027 Pattern: Early Signals for a Significant Jet Stream Shift
During an El Niño cold weather season, there is typically a strong and persistent low-pressure area in the North Pacific. That pushes the polar jet stream further north, bringing warmer-than-normal temperatures to the northern United States and western Canada. Below is an El Niño weather pattern schematic, but it more reflects the usual winter pattern. However, the base pattern is also similar in El Niño Falls, especially in strong events.
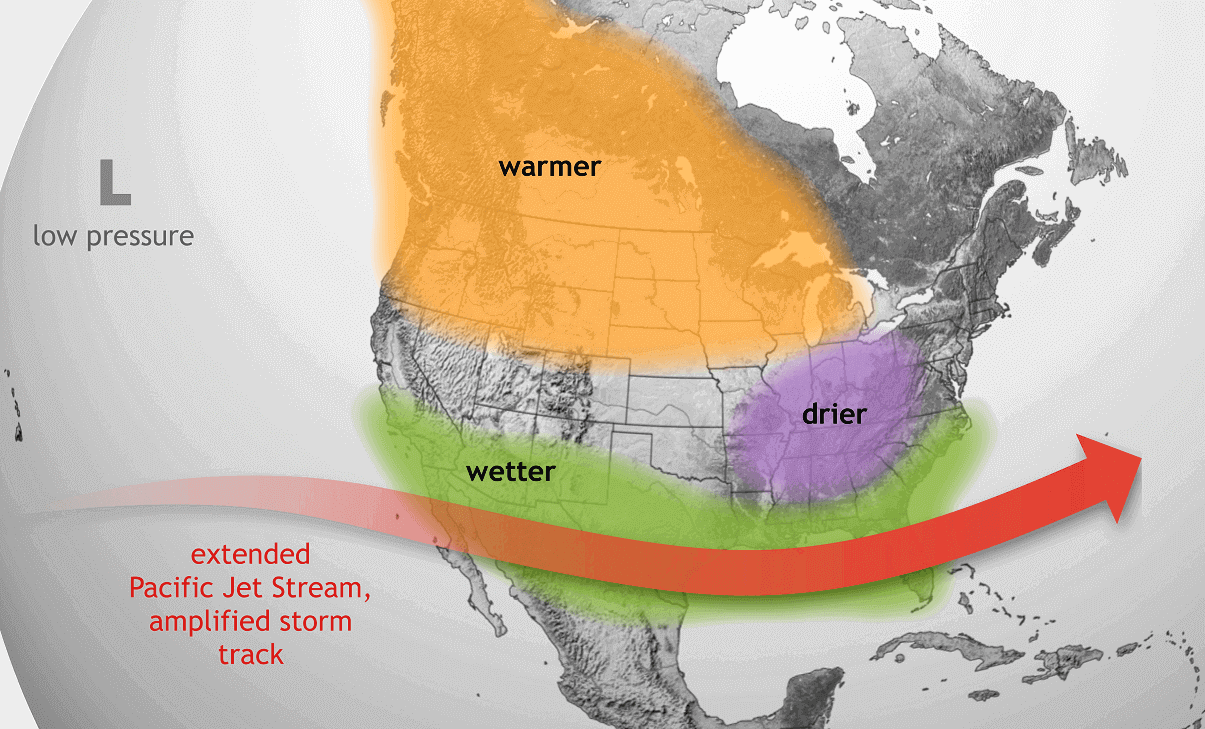
Also very important is that the southerly Pacific jet stream gets amplified during an El Niño. That means more low-pressure systems and storms over the southern half of the United States, with lots of precipitation and cooler weather.
If we look at the latest 500mb pressure anomaly pattern for Fall 2026, we can see a strikingly clear El Niño pattern over the Northern Hemisphere. The main low-pressure area in the North Pacific, a high-pressure zone over western Canada, a low-pressure area with the subtropical jet over the United States, and a low-pressure pairing in the Atlantic and Europe. This is likely to persist into the early 2027 over the winter season.
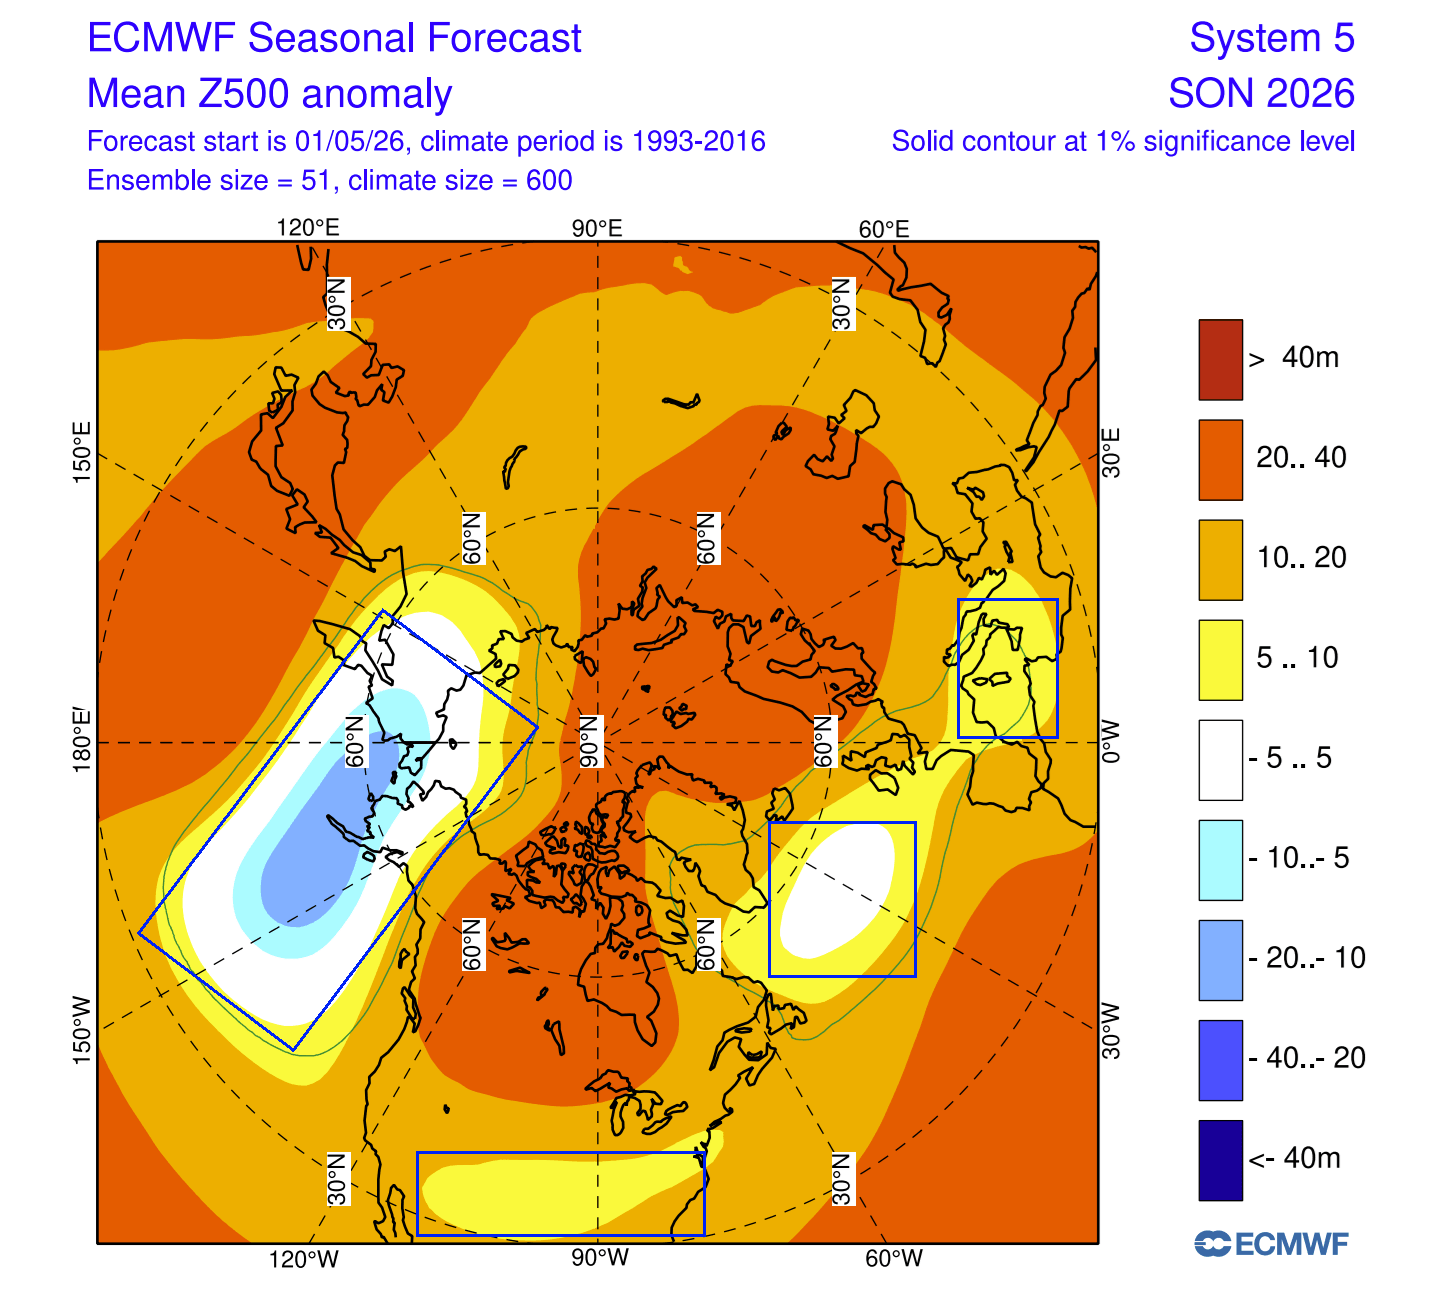
This is very close to a textbook El Niño signature, but would be more expected to see in the winter season. But since we are expecting a strong/super event, we can already see a very clear signal by Fall, several months ahead in the forecast.
Looking at the North American weather pattern forecast for Fall, this exactly corresponds to the schematic pattern above. An area of above normal temperatures over western Canada and northern United States, with normal to even below-normal temperatures expected over the southern and eastern United States.
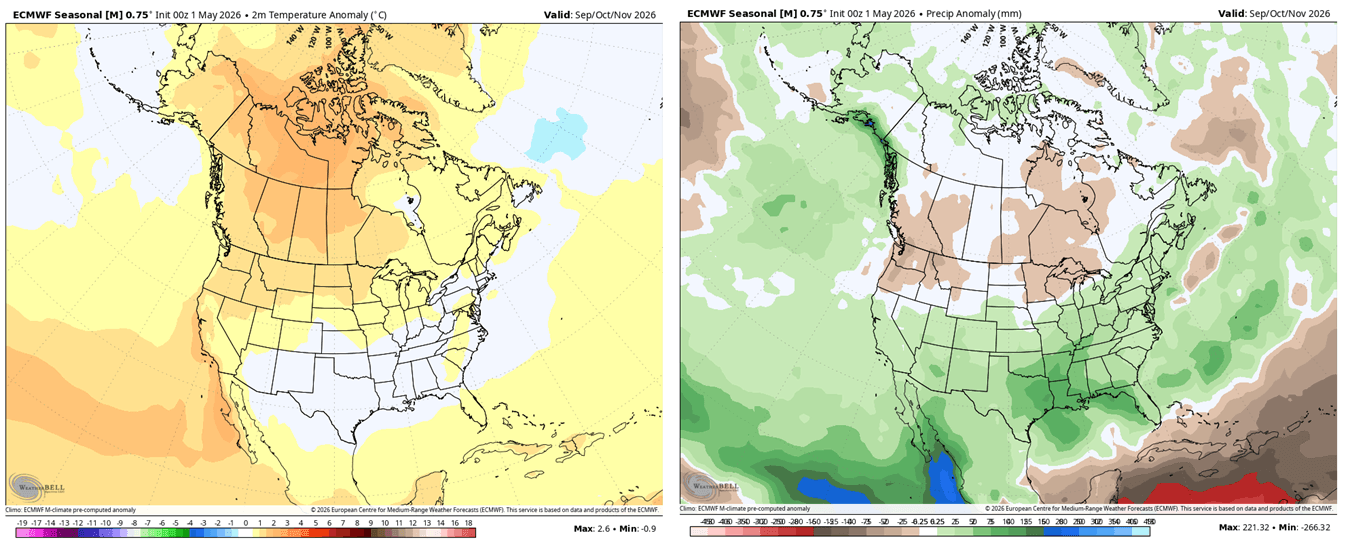
The precipitation forecast also reveals the impact of the amplified Pacific jet stream, bringing moisture, rain, and unsettled weather to the southern half of the United States, and extending up into the northeastern U.S., the Midwest, and southeastern Canada. But this also brings a drier fall to the rest of Canada and the northern U.S., under the high-pressure area.
Over Europe, there is usually much less of a direct El Niño influence. We see above normal temperatures over much of the continent, but positioned more in the central and northern parts. This is due to the low-pressure areas being in the North Atlantic and in the western Mediterranean.
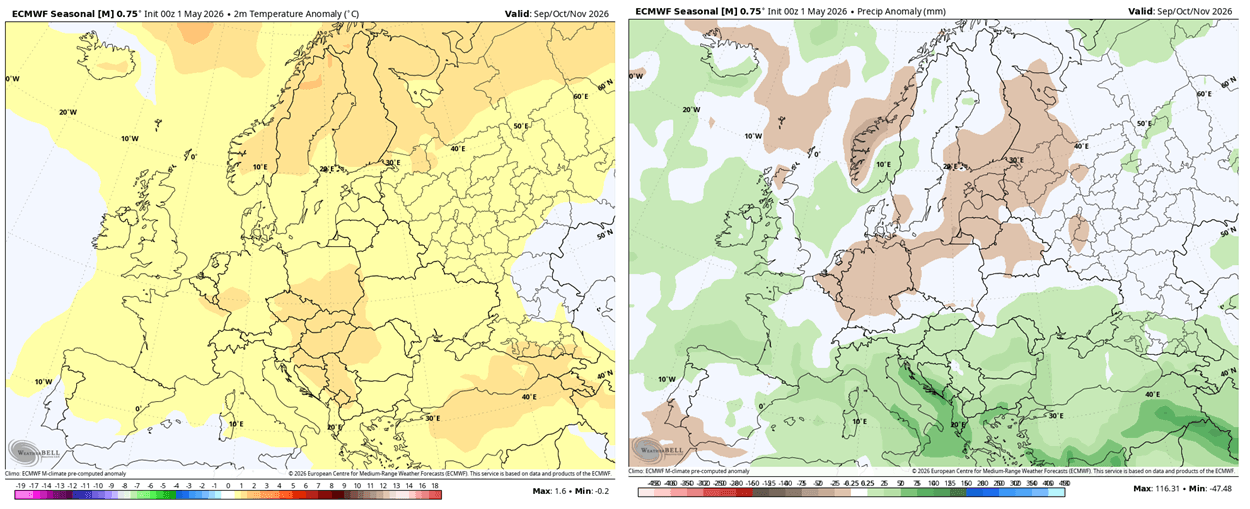
That positioning of the low-pressure zones also brings moisture into western and northwestern parts, along with unsettled autumn weather. The low-pressure area in the Mediterranean causes increased rainfall over the southern, south-central, and southeastern parts.
These are just the first Fall seasonal trends. But given the forecast strength of the El Niño event, that can often help to stabilize the predicted atmospheric pattern, making the forecast slightly more reliable in the long range, as it has a clear, strong driver behind it.
Forecast and analysis images in this article are from cyclonicwx.com, Copernicus EU, and WeatherBell, using a commercial license.
We will keep you updated on global weather development and long-range outlooks, so bookmark our page. Also, if you have seen this article in the Google App (Discover) feed, click the like button to see more of our forecasts and our latest articles on weather and nature in general.
Don’t miss: