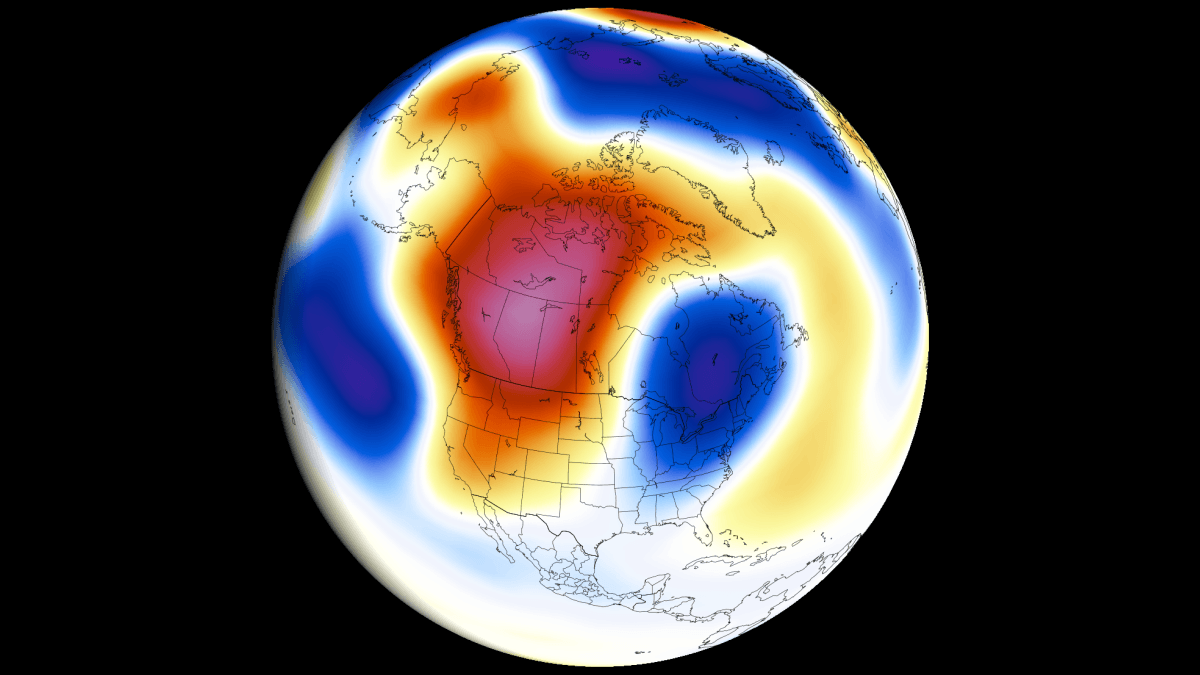
The latest Fall 2026 forecasts indicate an unusually evolved weather pattern across the Northern Hemisphere, as Super El Niño continues to strengthen. The main signal is a strong high-pressure anomaly over Canada, lower pressure over the North Pacific, and a more active southern storm track across the United States, creating a pattern typically seen later in the cold season.
The Super El Niño forcing strongly interacts with seasonal transitions in the atmosphere. This is what makes the Fall-Winter transition particularly sensitive during Super El Niño events, as strong tropical forcing can cascade into much larger shifts in storm tracks and temperature anomalies.
In this updated forecast, I break down the latest Super El Niño data, compare the current setup with past events, and look at the new Fall ECMWF and NMME temperature, rainfall, and snowfall trends, along with the first Polar Vortex signals for the coming Winter 2026/2027 season.
Super El Niño 2026: Ocean Forcing on the Atmosphere
All the latest data show the increasing likelihood that a record-strong Super El Niño will be the main global weather driver in 2026/2027. I usually write a new article each week that is relevant to the Super El Niño event, yet even in this short span, it is surprising to see how much the data changes and how much El Niño grows.
It’s now clear that in 2026/2027, we are facing a powerful El Niño warm phase. The image below shows the change in atmospheric circulation during an El Niño event: Rising air in the central and eastern Pacific increases precipitation and lowers pressure over that region. At the same time, descending air in the western Pacific produces stable weather and high-pressure conditions.
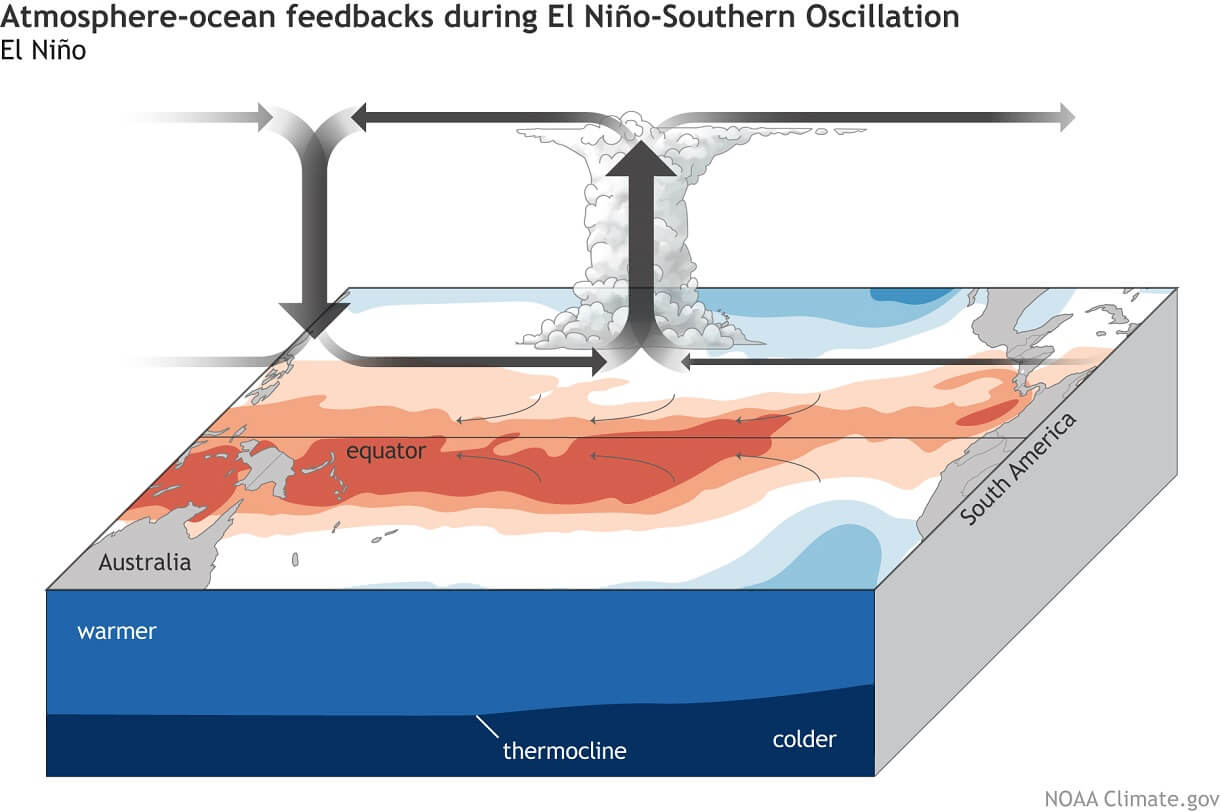
This way, El Niño strongly impacts the tropical rainfall and pressure patterns, affecting the ocean-atmosphere feedback system. Through this ocean-atmosphere system, its influence then spreads to global pressure anomalies and our daily weather.
We are currently observing a Super El Niño event developing, forecast to peak as one of the strongest such events in decades. Such an event is expected to also bring along powerful seasonal weather impacts.
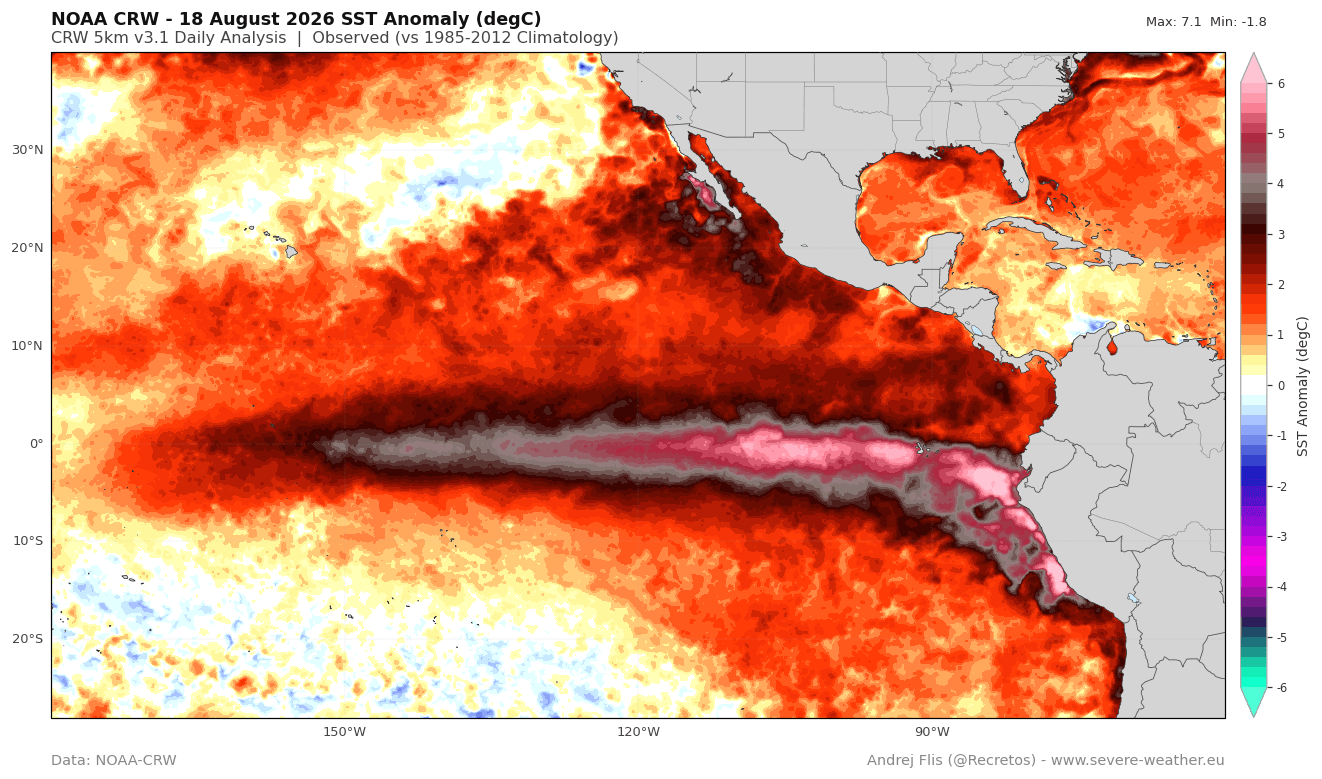
Below is my latest ocean analysis, from NOAA-CRW data. You can see substantial warm anomalies emerging, with peak anomalies in the whole area exceeding 7°C (12.5°F) above normal. This is an exceptionally strong anomaly for this stage of development, with the typical seasonal peak still several months ahead.
This growth is really unusual and is also confirmed by the latest analysis graph below for the main ENSO region. And compared to the last Super El Niño event line (blue), we have already exceeded it. The values we currently observe with this event in August were not reached in 2015 until late October. I produced this plot using BOM weekly data.
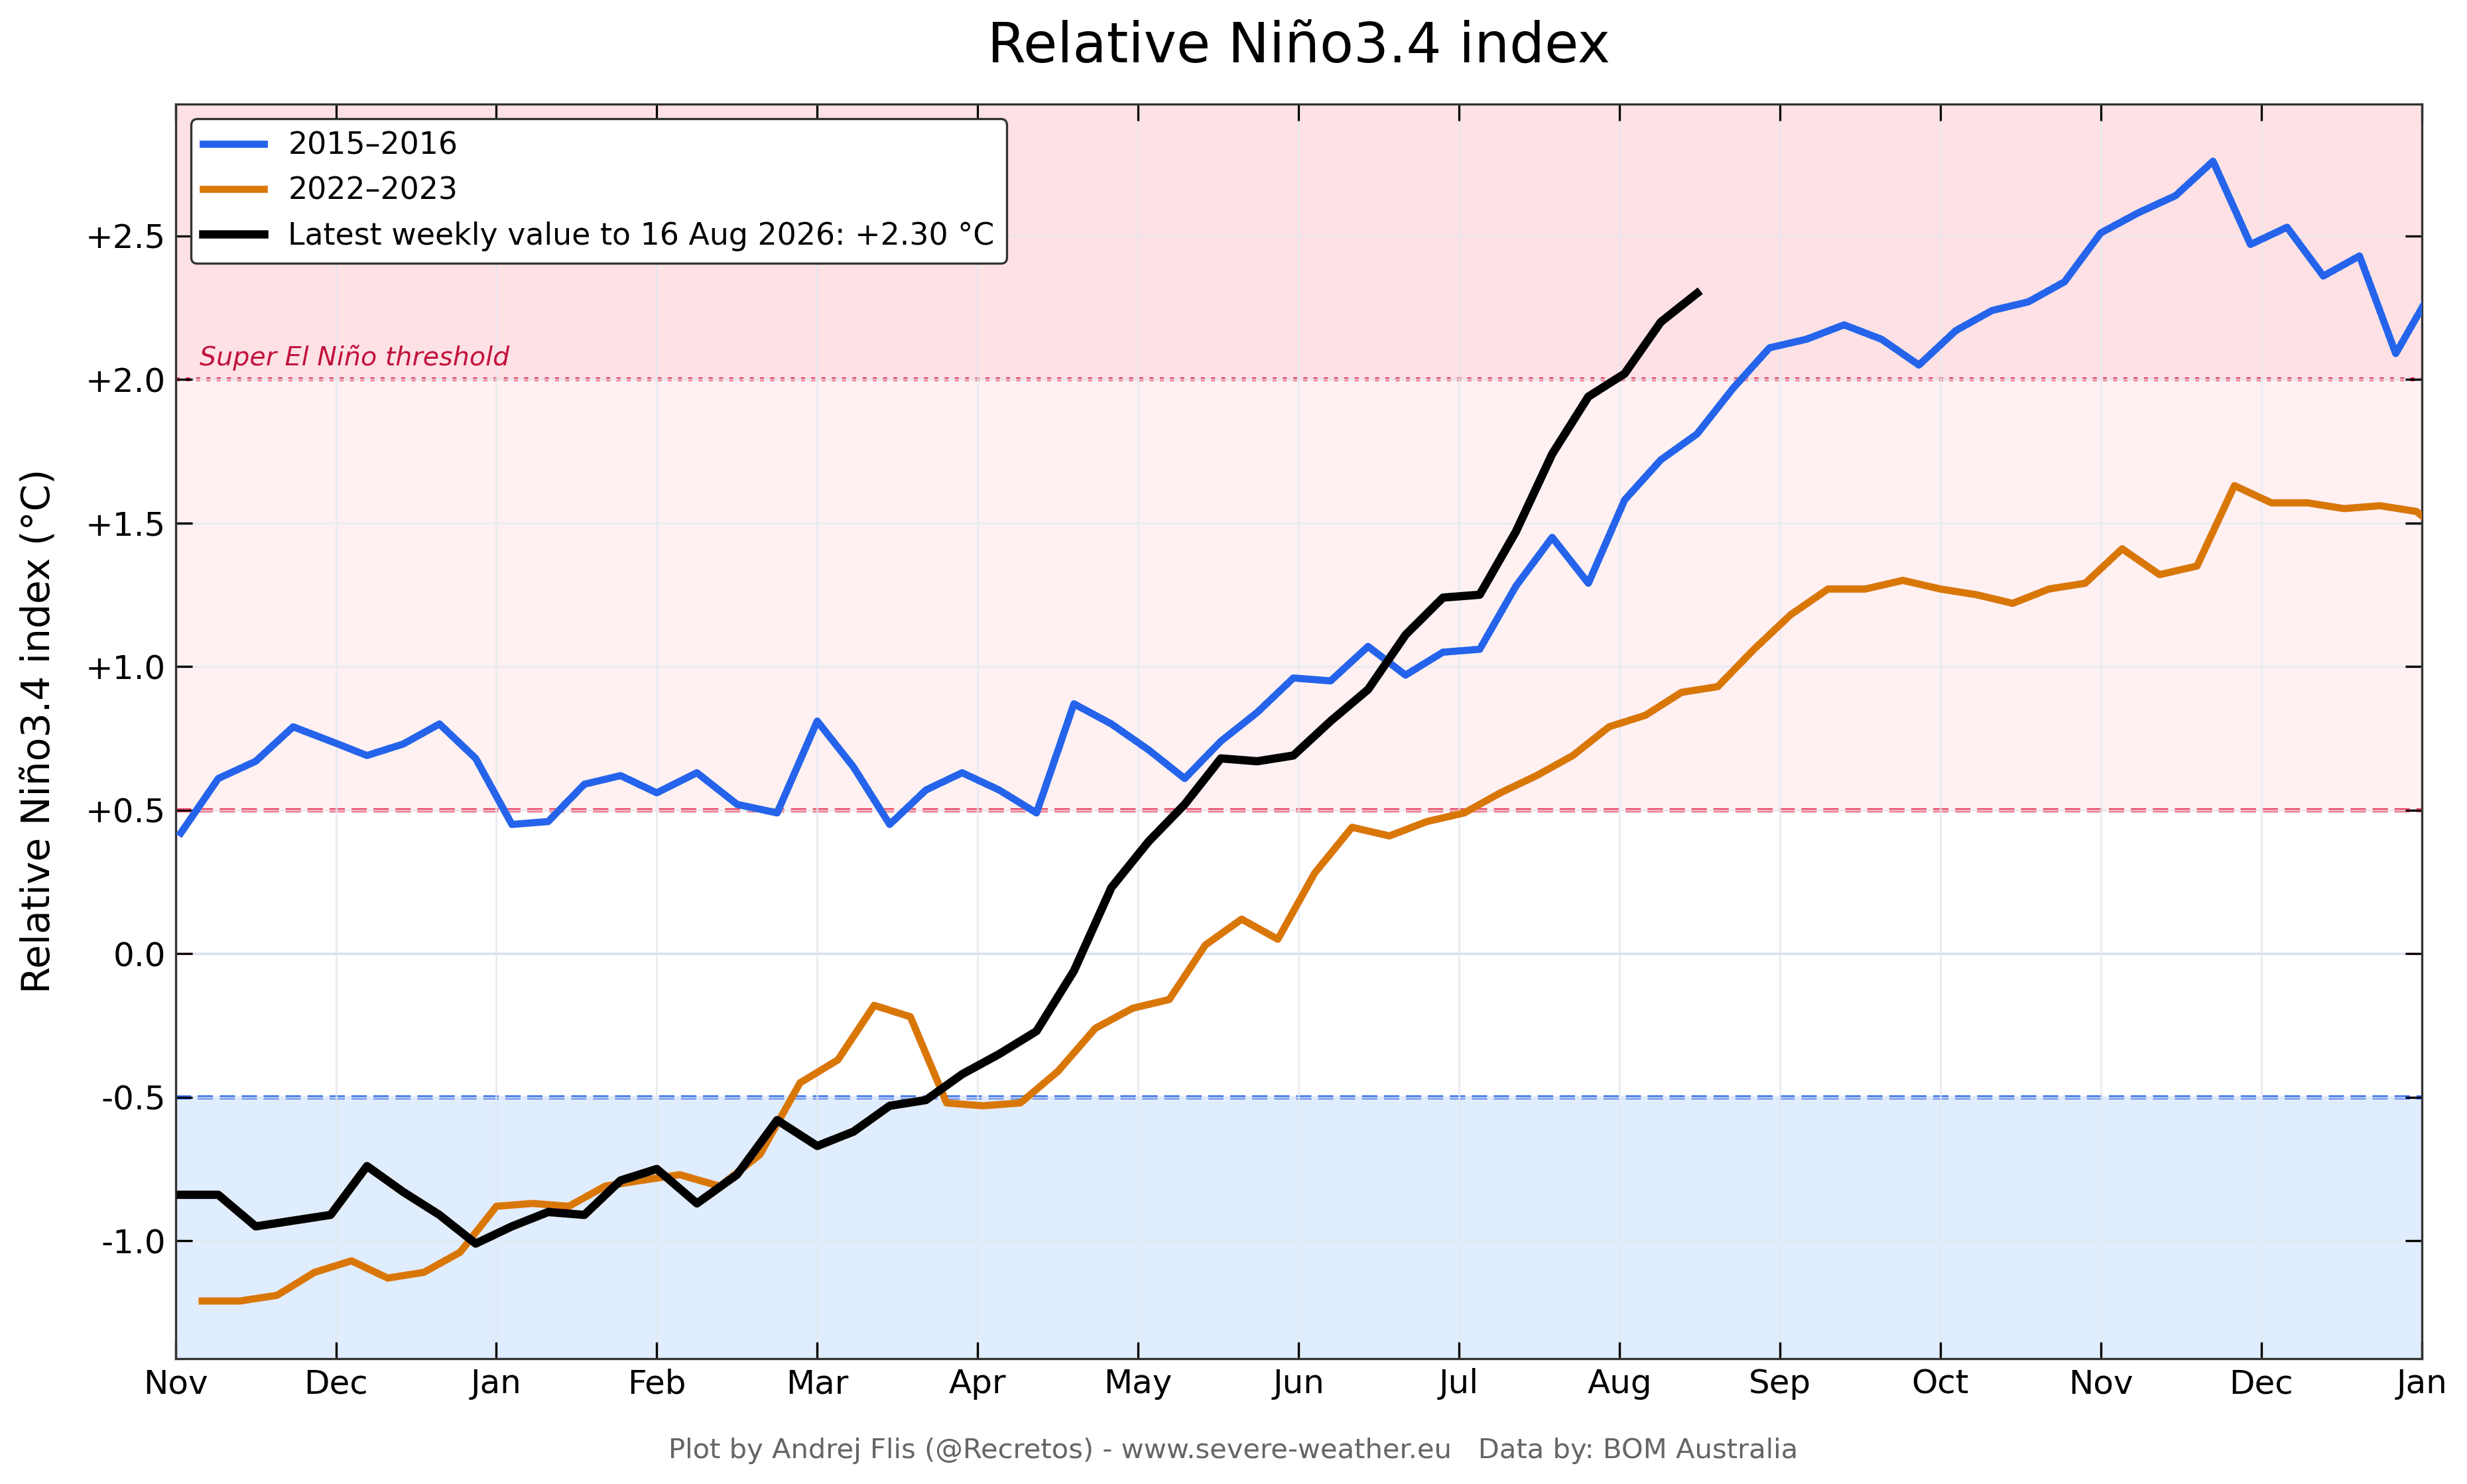
This clearly shows a very strong event emerging, already having a direct impact on weather development, starting in North America and the tropics, spreading rapidly worldwide. To be classified as a Super El Niño event, the sustained seasonal values must be above +2 degrees, which we have already exceeded, and we just need to sustain it.
Below you can see the real core (heart) of this Super El Niño event: a subsurface temperature anomaly across the tropical Pacific in the top 250m (800ft) of the ocean, updated to the latest data. This is a powerful downwelling Kelvin Wave, with peak anomalies over 9 degrees (16°F) above normal. Created by westerly surface winds, it is pushing eastward and rising toward the surface.
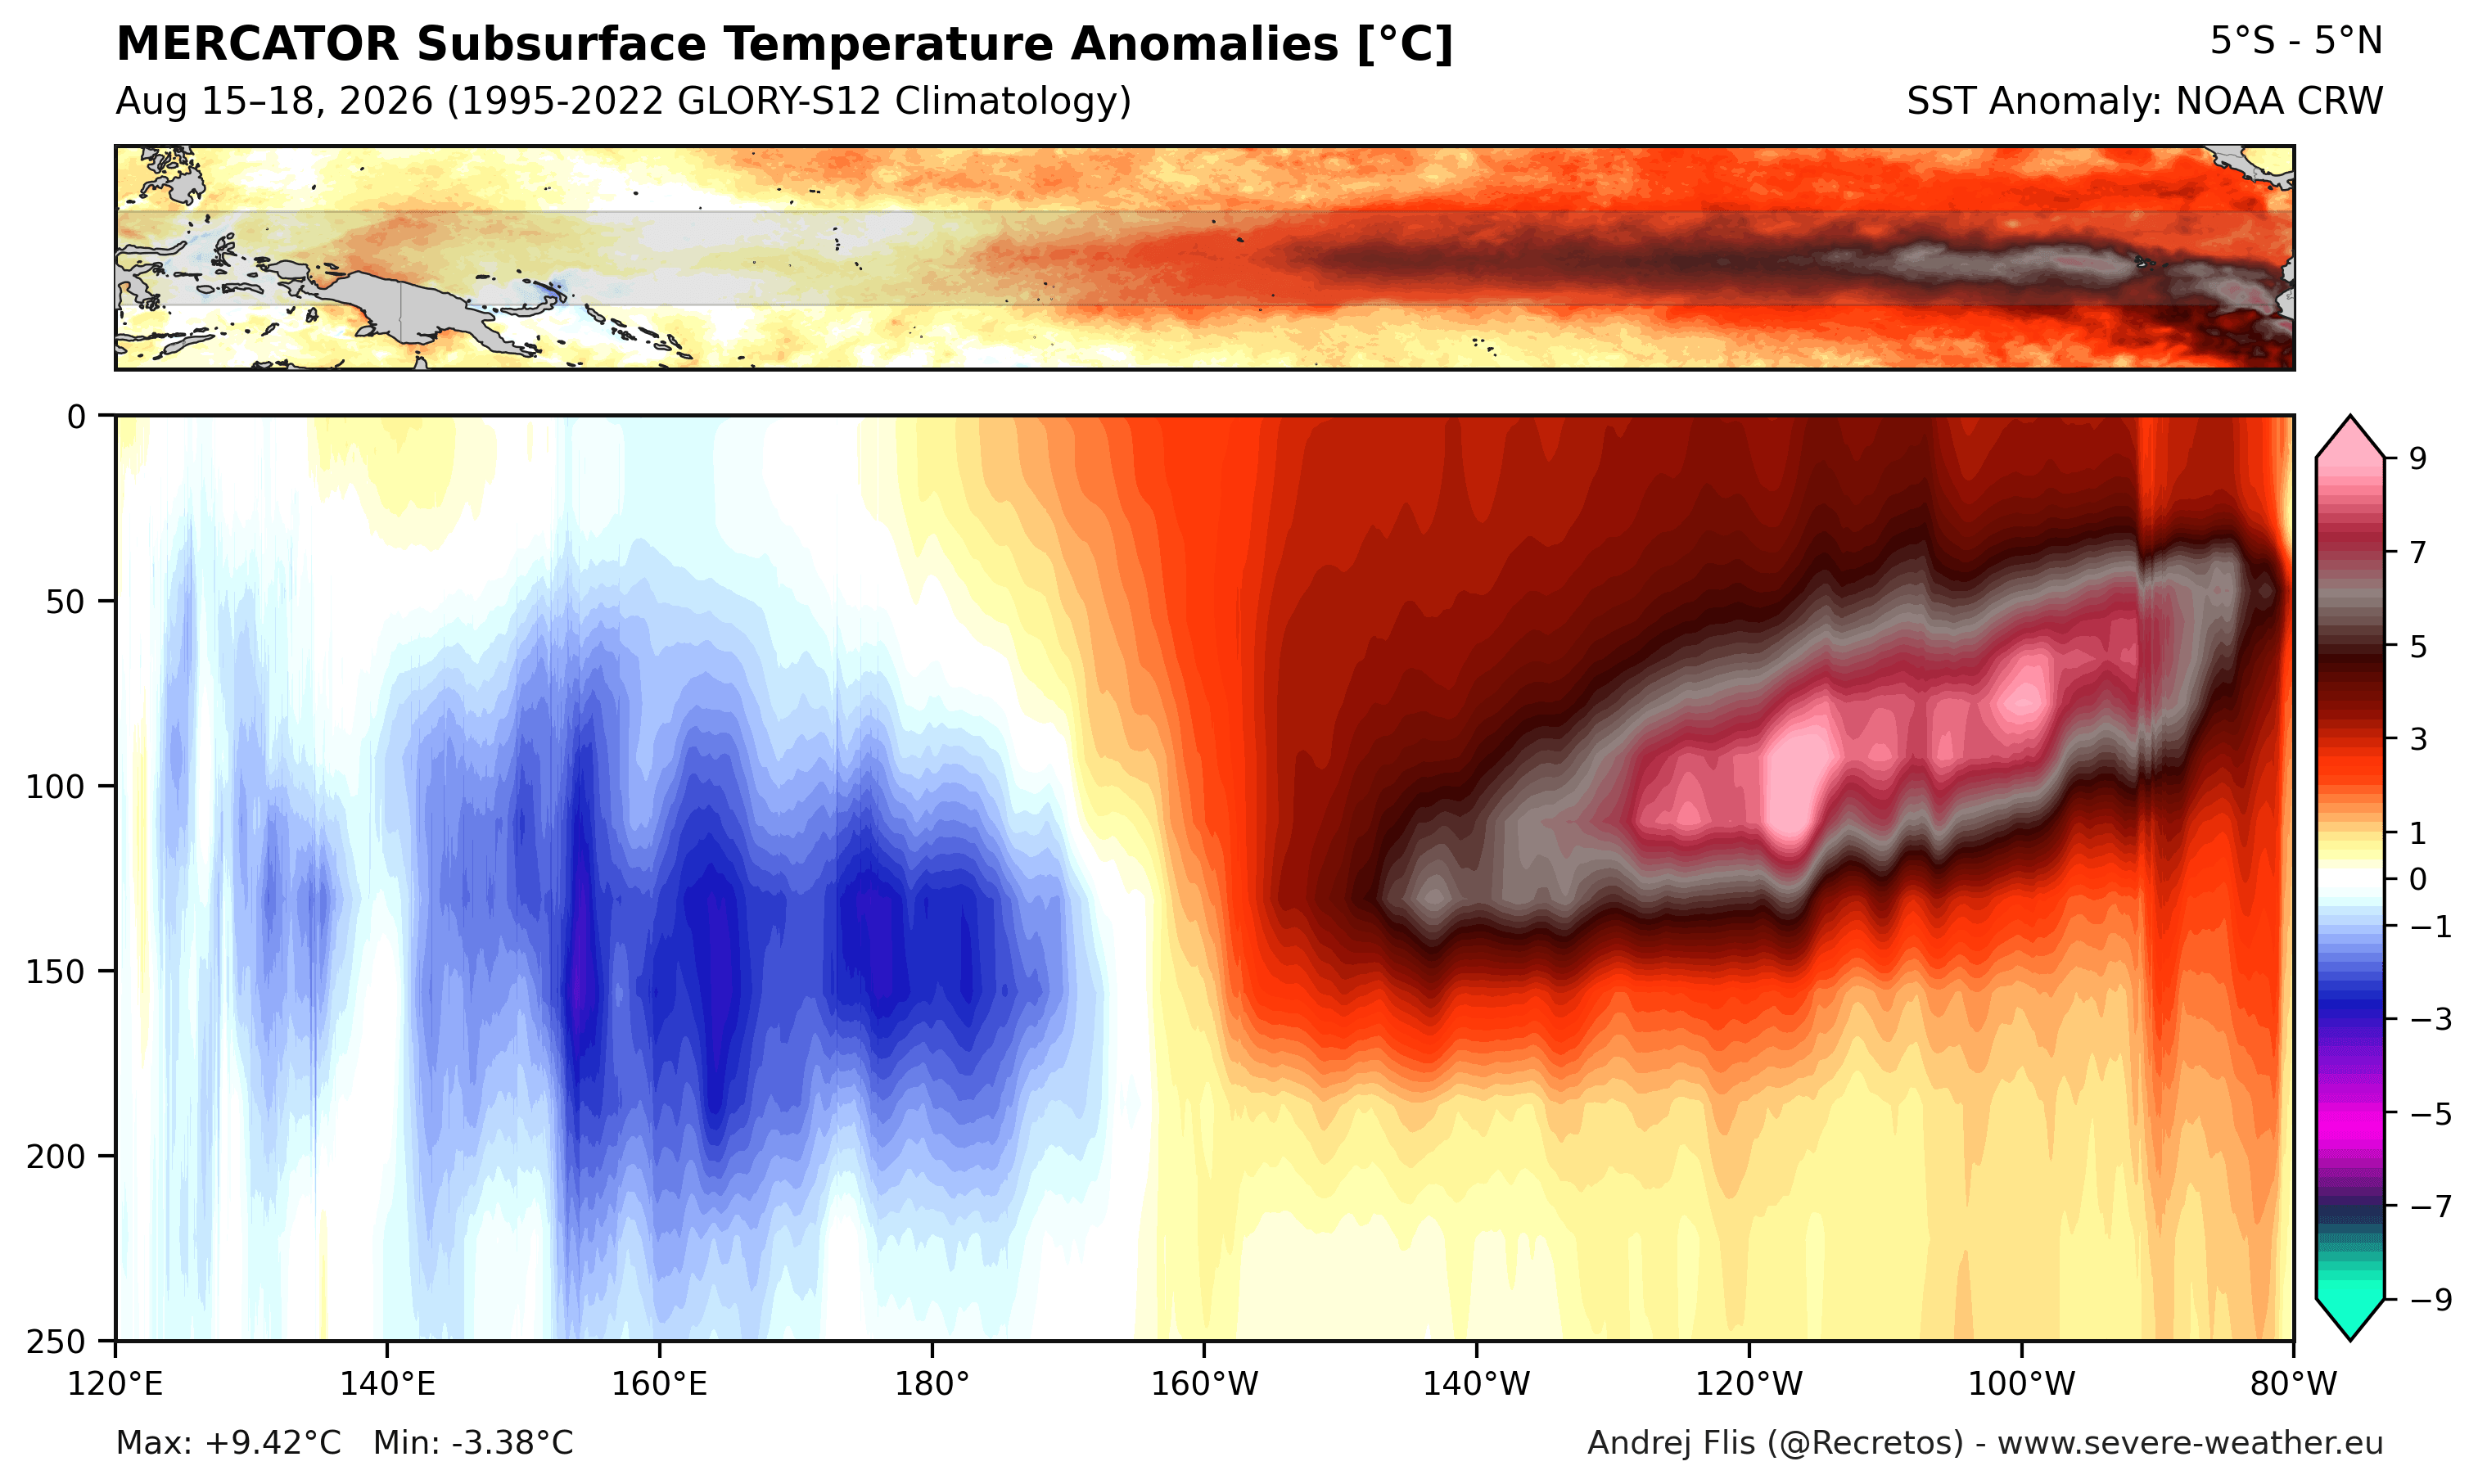
To simplify, the ocean surface anomalies are just the visible surface fingerprint of this large subsurface warm core. As this warm water slowly surfaces, it provides a continuous supply of thermal energy to keep the El Niño strong and healthy well into the Winter season.
I produced a video below that shows the anatomy and development of subsurface temperature anomalies in the past 90 days under the Super El Niño. You can see the eastward movement and rapid growth of this large Kelvin Wave before its eventual rise as a Super El Niño in the eastern parts.
And the latest forecasts show that this event is expected to keep growing, potentially becoming a record-strong Super El Niño.
Super El Niño Forecast: Latest Models Push Toward Record Strength
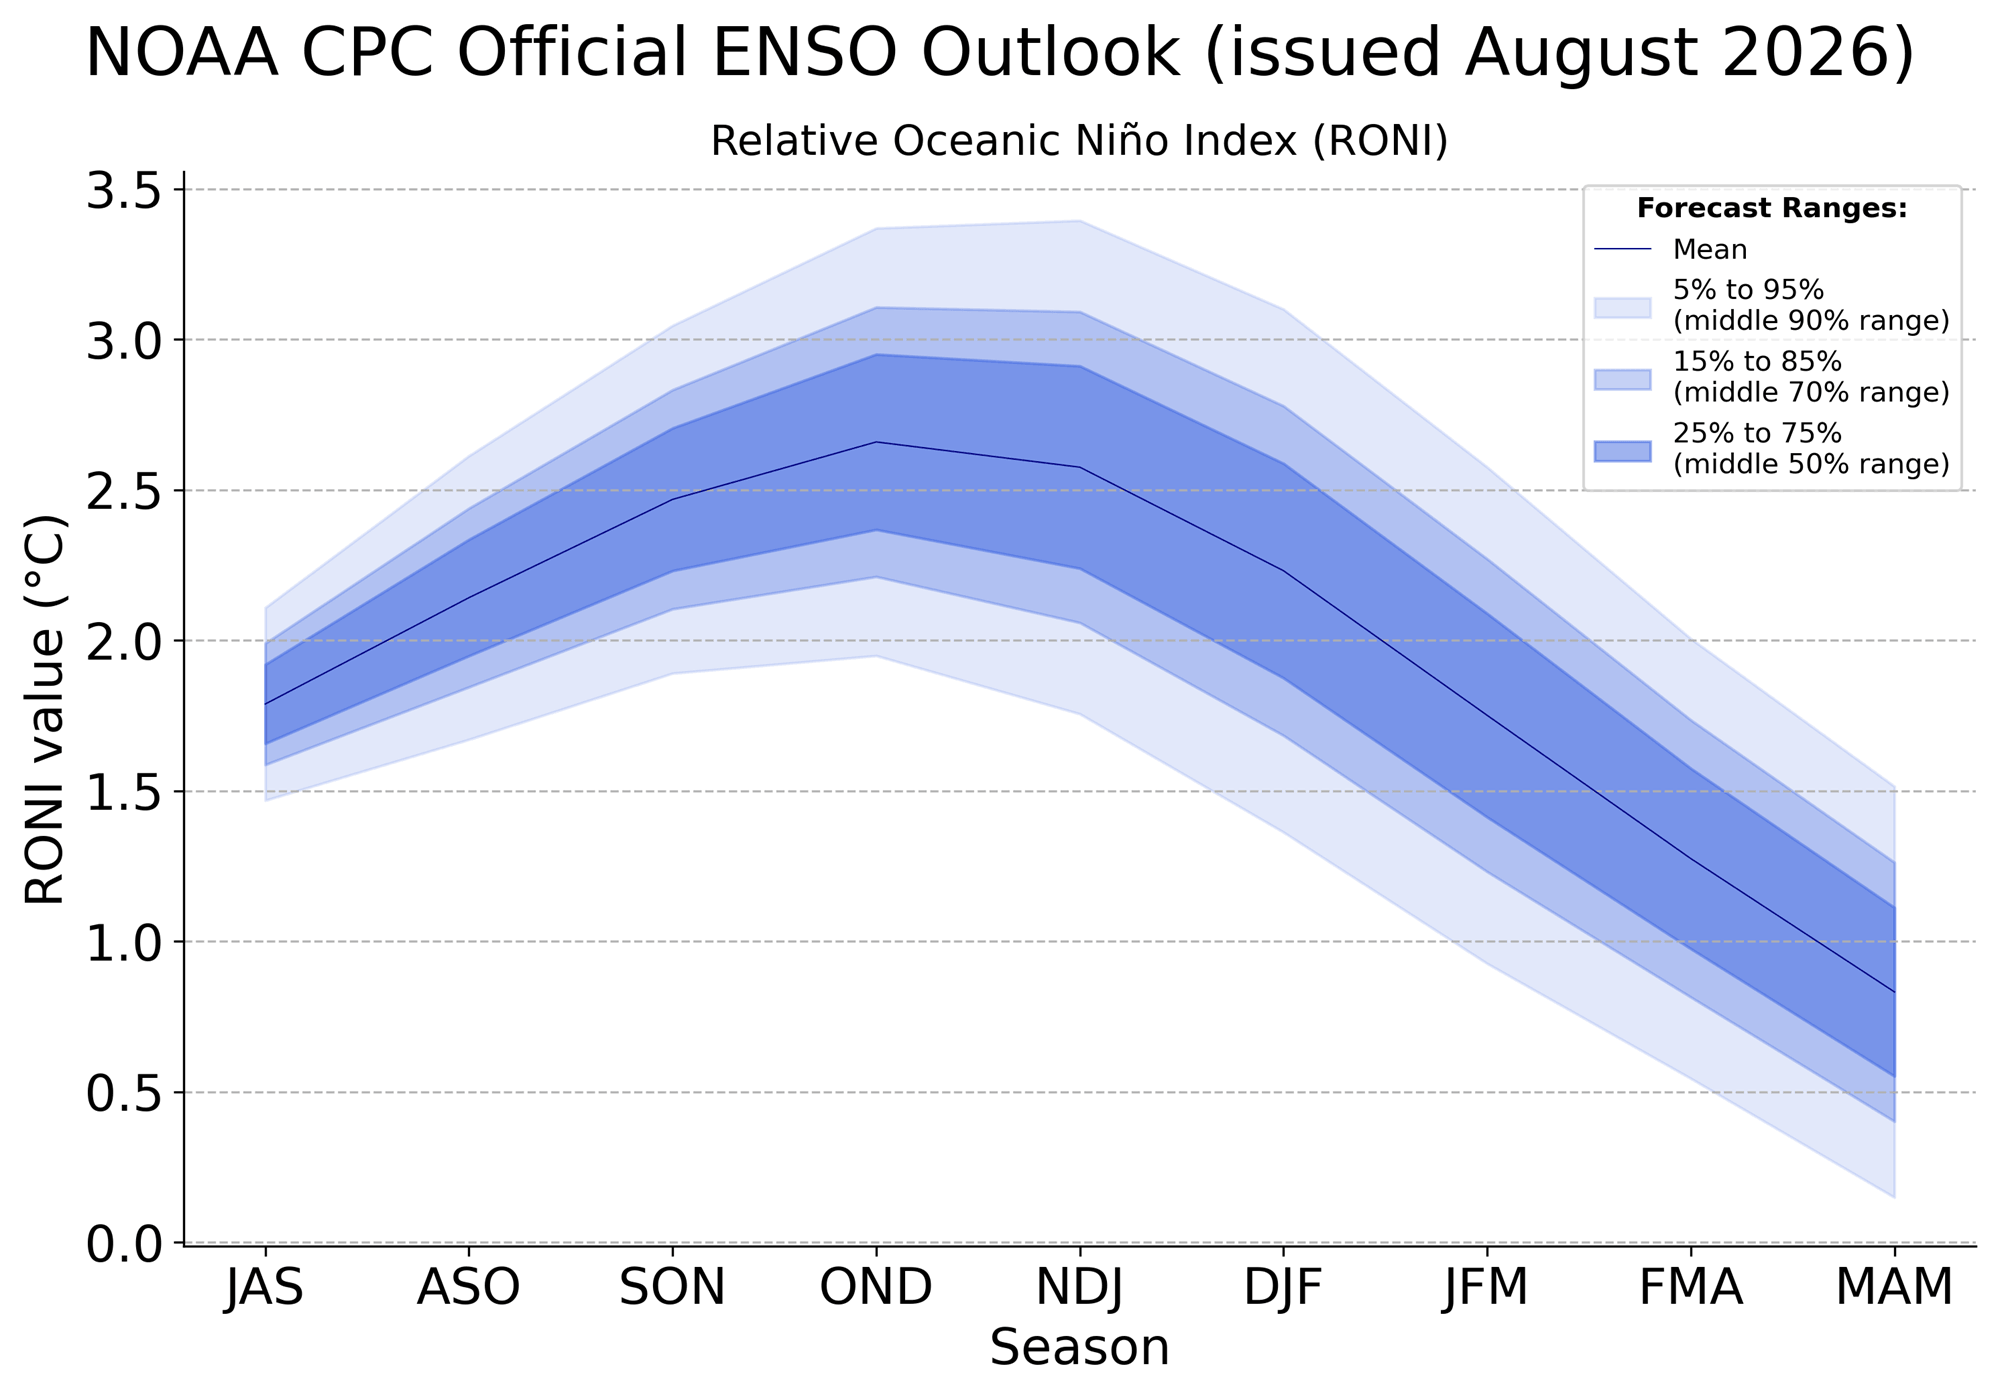
As mentioned, the latest forecasts have really amplified this event toward Winter. Below is the official NOAA CPC ENSO outlook. The average forecast from all the calculations is strongly above the +2 threshold for a Super El Niño. It shows a strong seasonal peak above +2.5 degrees, which is consistent with most other models.
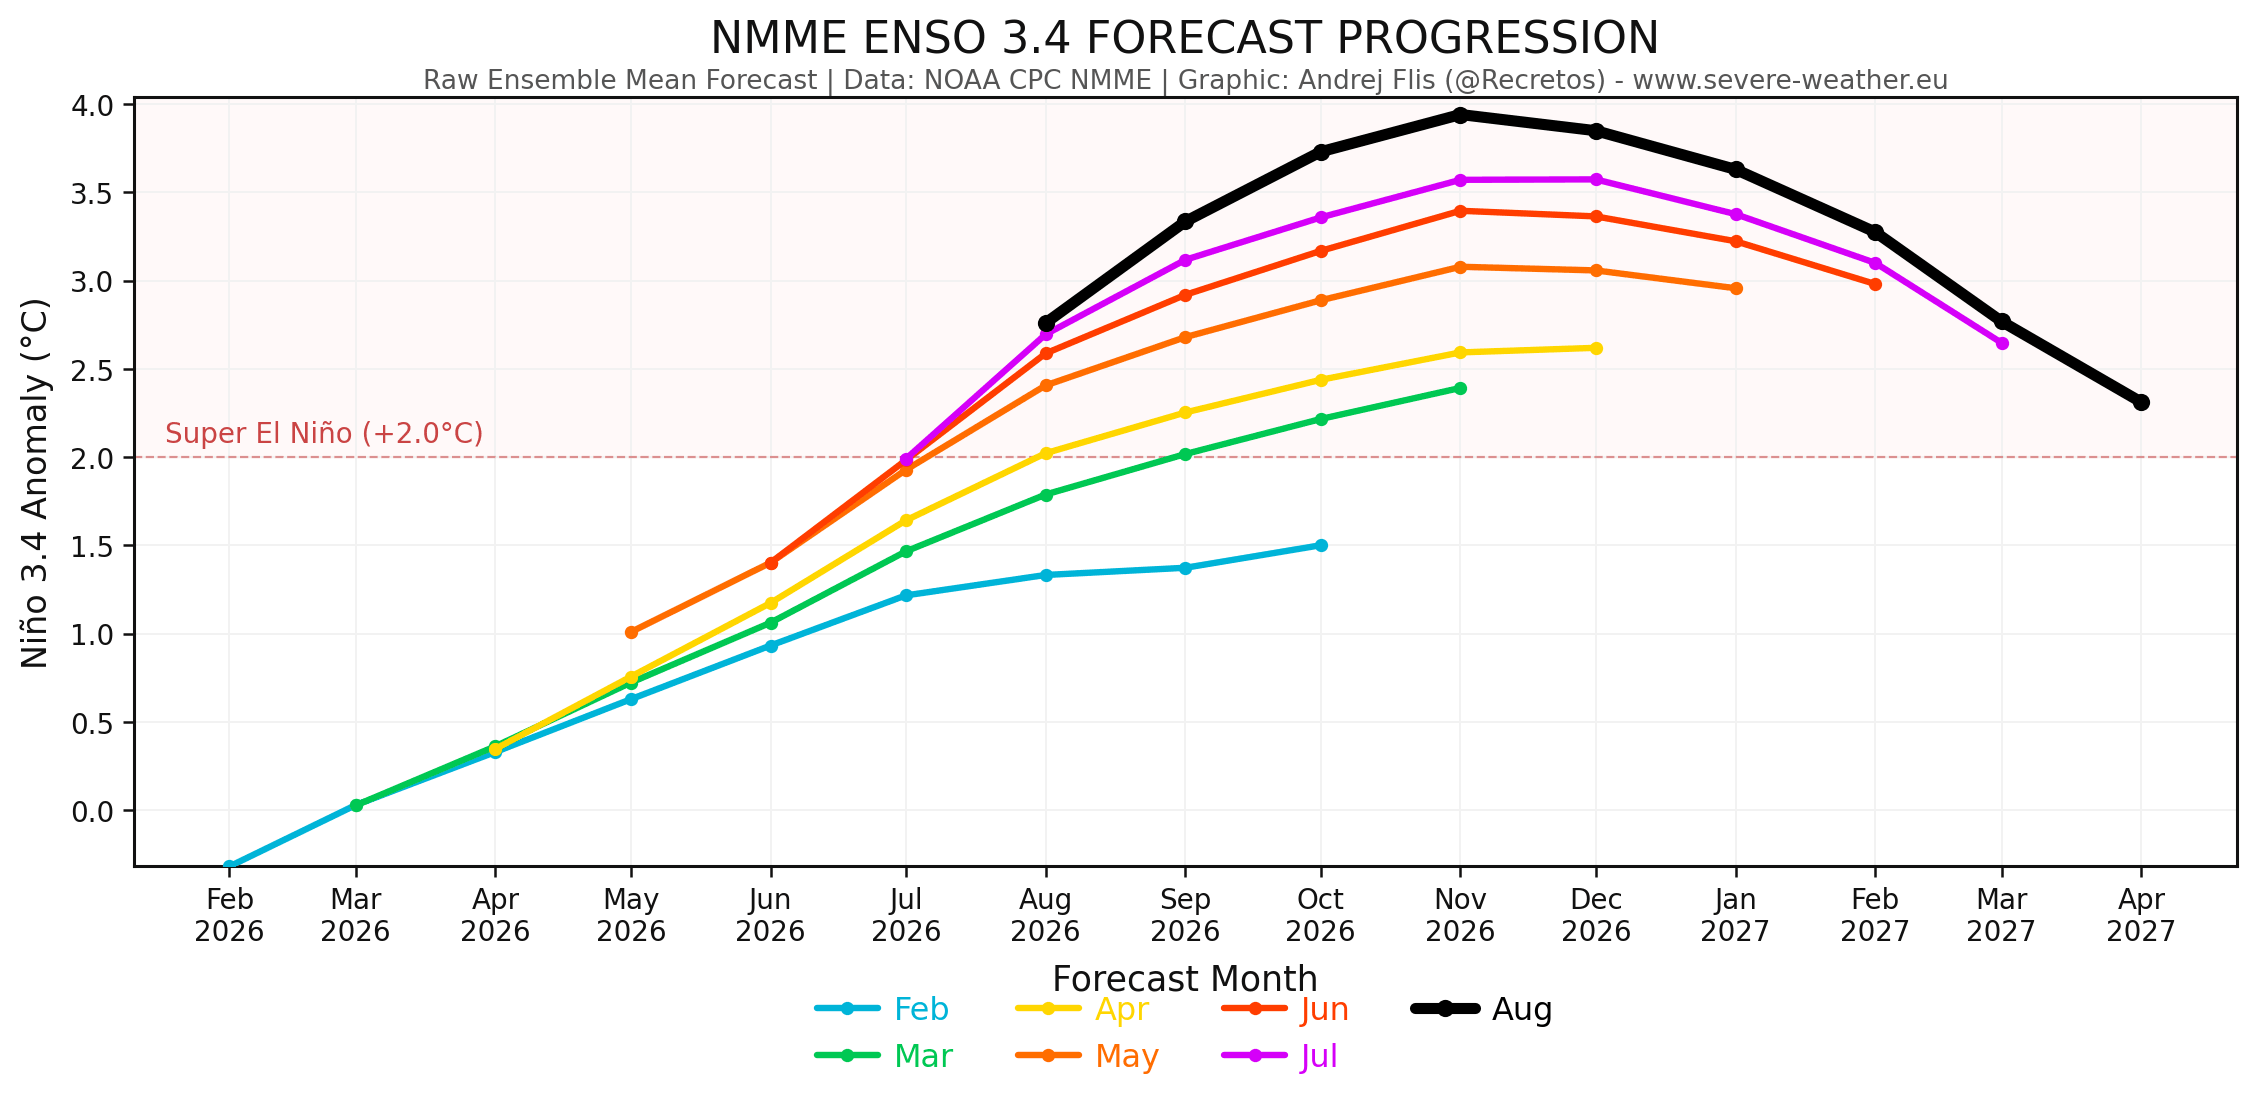
What is even more impressive to see is the trend of a growing peak strength of this El Niño. This is clearly visible on the NMME multi-model forecast below, also trending toward a stronger Super El Niño with each consecutive run since February. It shows higher anomaly values for the main ENSO region, peaking close to +4 degrees, making this a record-strong event if verified.
I will also include the NMME temperature and precipitation forecast for Fall in this article, as it shows a similar El Niño forecast to the ECMWF, also creating a similar large-scale El Niño weather response.
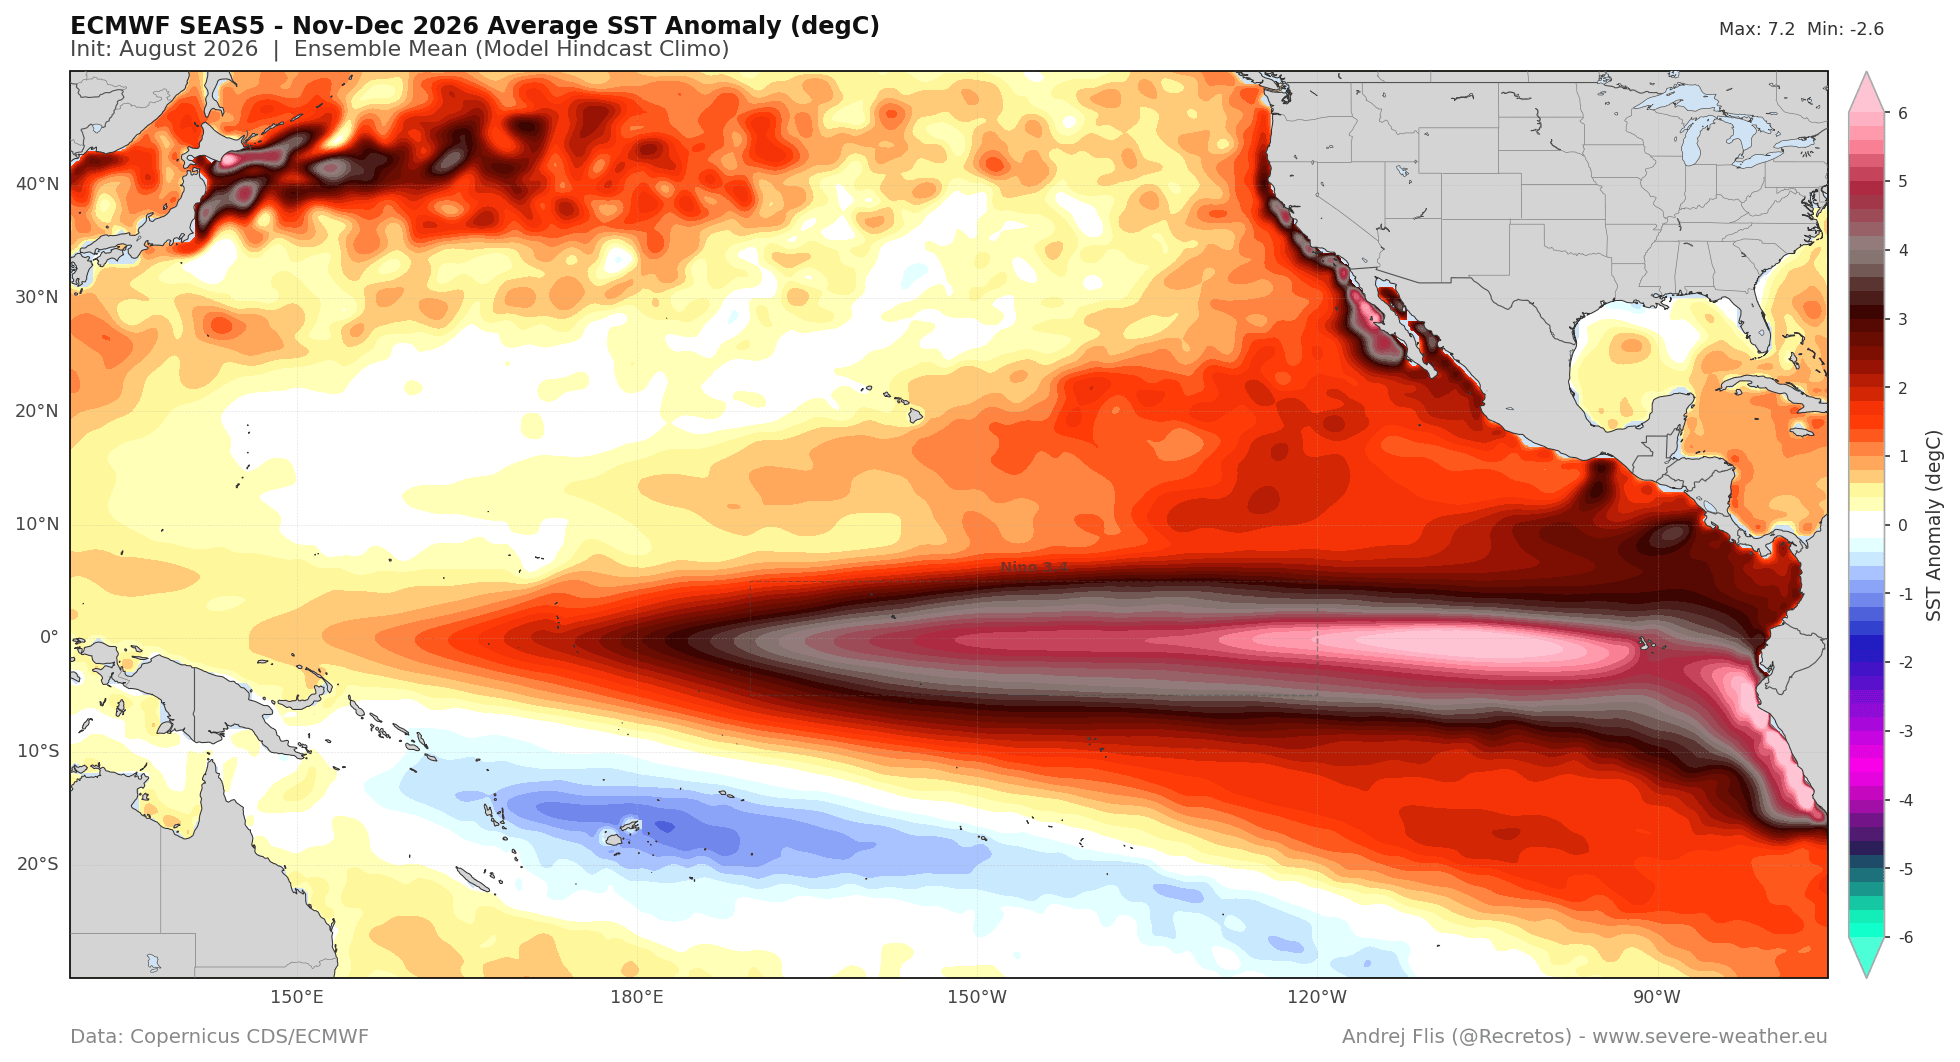
Below is also the latest ECMWF forecast average for the November-December period, revealing a significant Super El Niño event. The strongest anomalies reach +7 in the eastern parts, outside of the main region. This makes this an Eastern Pacific (EP) based event, creating a different set of weather impacts across the globe than in a Central Pacific (CP) event.
A 2012 study (linked below) showed that the Fall impact of El Niño over North America depends strongly on where the tropical Pacific warming is centered. Eastern Pacific El Niño events can generate a stronger North Pacific pressure response and increase moisture transport toward the southern United States, increasing precipitation.
It’s quite impossible to find anything close in the past data to search for potential atmospheric impact on the 2026 Fall season. But a good starting point is the last two Super El Niño events, which were both eastern Pacific events.
Past Super El Niño Events: Fall Temperature and Rainfall Patterns
I produced two graphics showing temperature and precipitation patterns for the Fall season during the last two Super El Niño events. For this analysis, I use the two most recent Super El Niño events to show patterns from the more recent climate period. No past event is a direct match for 2026, so this analysis is used only as a guide to the likely Fall response.
The temperature analysis shows above-normal temperatures over the northern and central parts of the United States, south-central and western Canada, and western parts of Europe. This comes from the El Niño high-pressure system, which usually develops in Fall and is fixed over Canada and the northern United States.
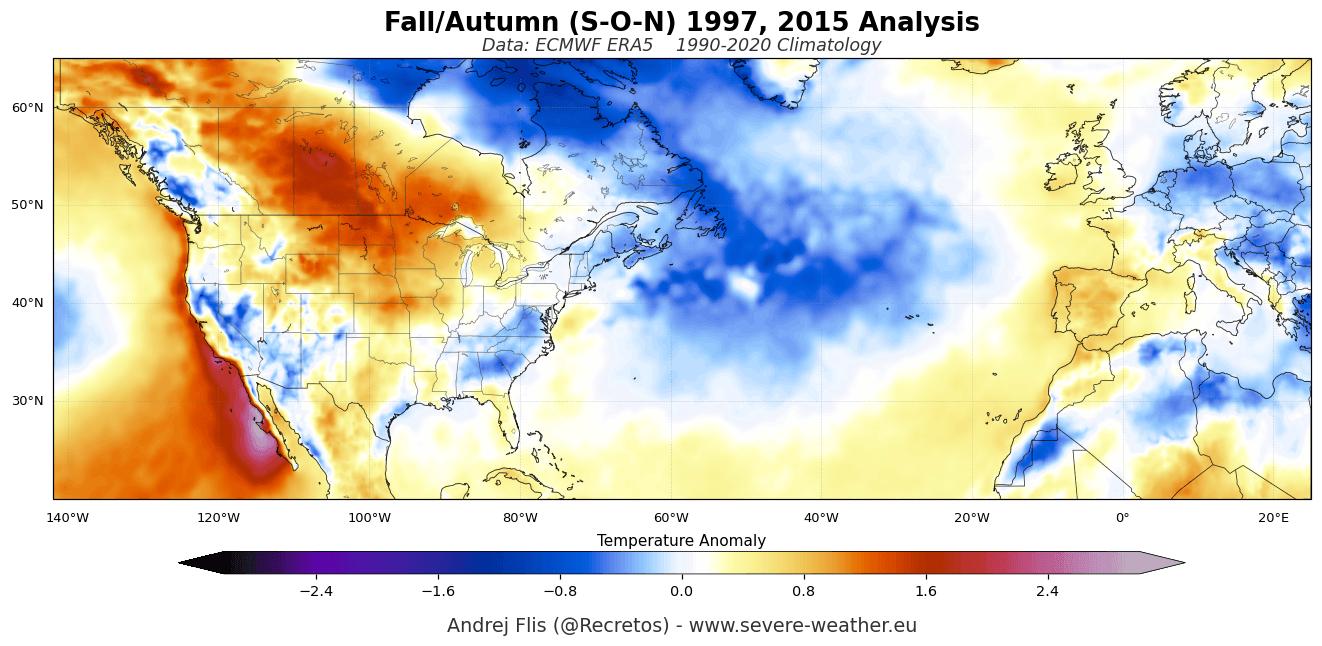
Normal to below-normal temperatures were also measured across the U.S. West Coast, the Southeast, and over northern Canada and central Europe. This comes from the subtropical jet stream, which is really amplified in a strong El Niño.
Precipitation patterns in a Super El Niño follow the amplified subtropical jet stream, which usually starts in Fall. That means more rainfall over the central parts and the entire southern United States. It extends into the Atlantic, creating a pattern that also brings more rain to southern Europe. This is exactly what we expect to see from a strong east-based El Niño in Fall.
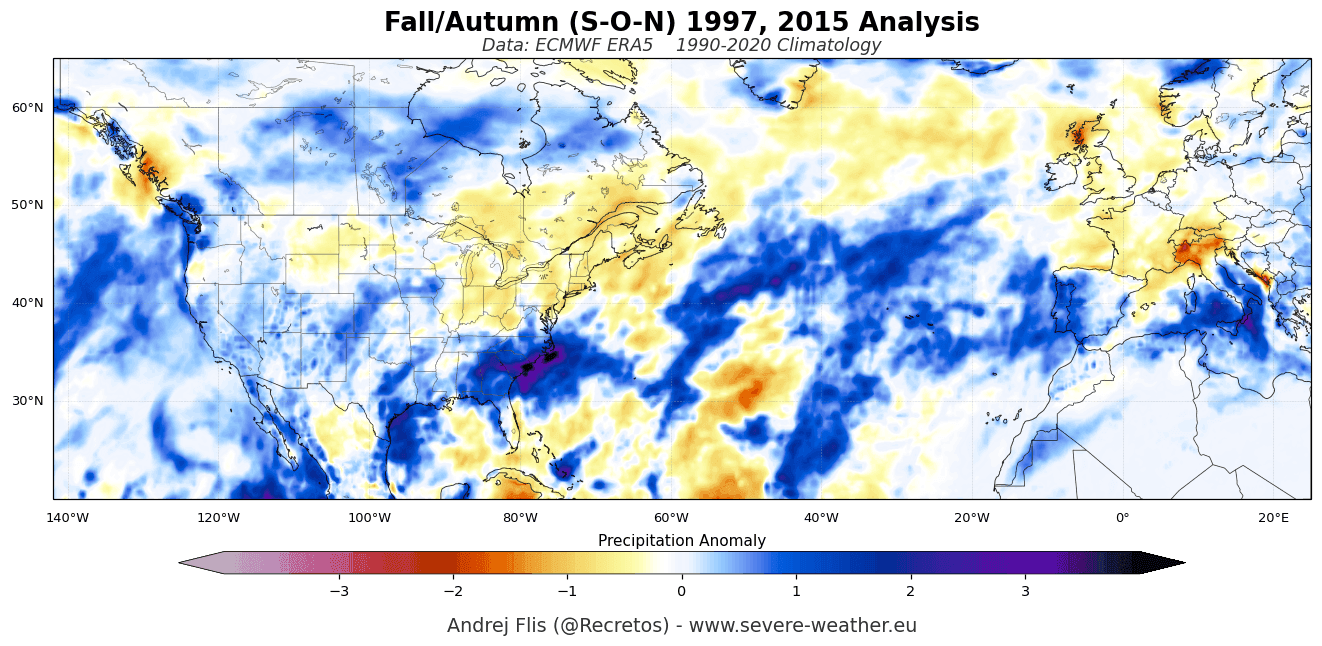
Below-normal rainfall can be expected over the northern and northeastern United States, and over west-central and northwestern Europe.
But these are the weather patterns from only two actual seasons. The latest forecast data for Fall 2026, updated this month, shows a much more evolved weather pattern.
Fall 2026 Forecast: An Early Winter-Like Pattern Emerges
The latest pressure pattern forecast shows an unusually evolved pattern, in the sense that it looks more like a typical El Niño Winter response. This is likely due to the unusual El Niño strength for this stage of development, allowing a winter-like atmospheric response to emerge unusually early.
Below is the latest pressure pattern anomaly for the meteorological Fall (September-November). You can see the main high-pressure anomaly over Canada, with the El Niño Pacific low, and a chain of low-pressure systems (storms) over the southern United States.
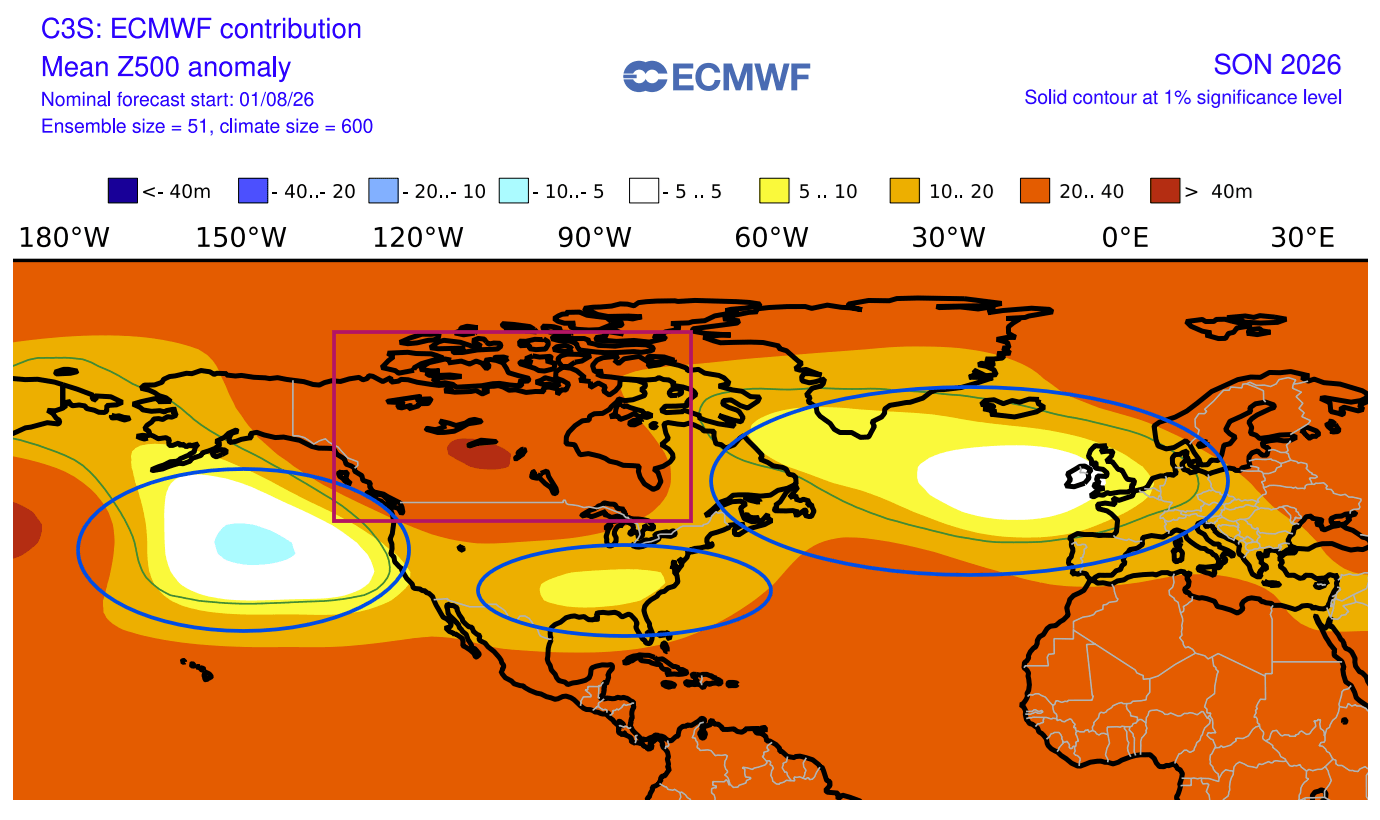
Further east, another low-pressure area is over the North Atlantic, reaching into northwestern Europe. This creates a pronounced westerly flow over the continent and brings a warmer southerly air mass rising toward the north and northeast.
This creates a split-flow setup across North America: the polar jet stream is displaced northward around the Canadian high-pressure area, while a stronger southern jet stream carries low-pressure systems across the southern United States. This type of configuration is more commonly seen with a mature El Niño pattern later in the cold season.
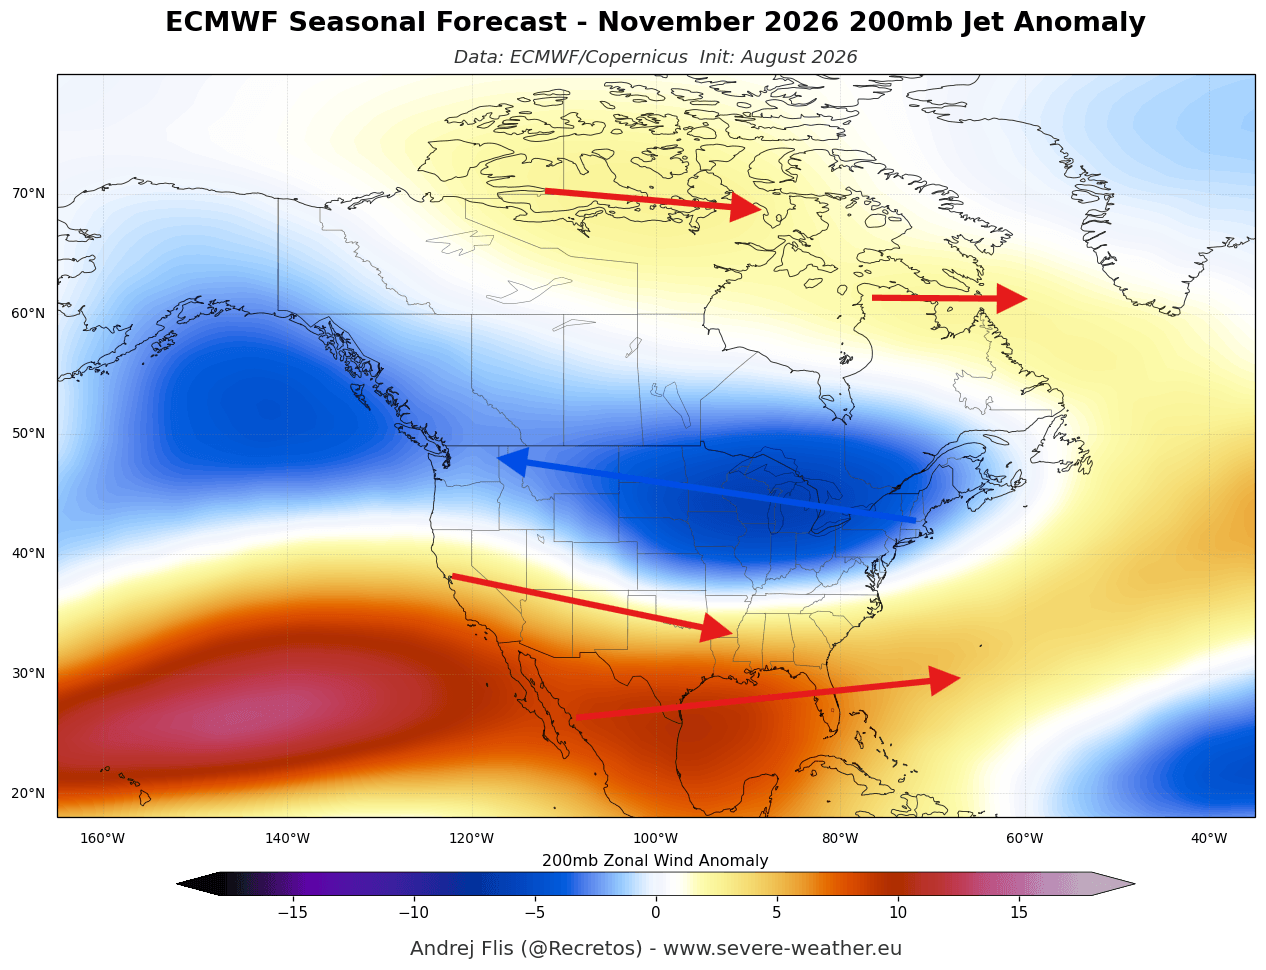
This pattern does not fit with a typical Fall El Niño response, but instead looks more like an El Niño Winter pattern, seen below. It has the same low-pressure area in the North Pacific, a high-pressure zone over Canada, and a low-pressure storm track across the southern United States and into the Atlantic, just as in the Fall forecast above.
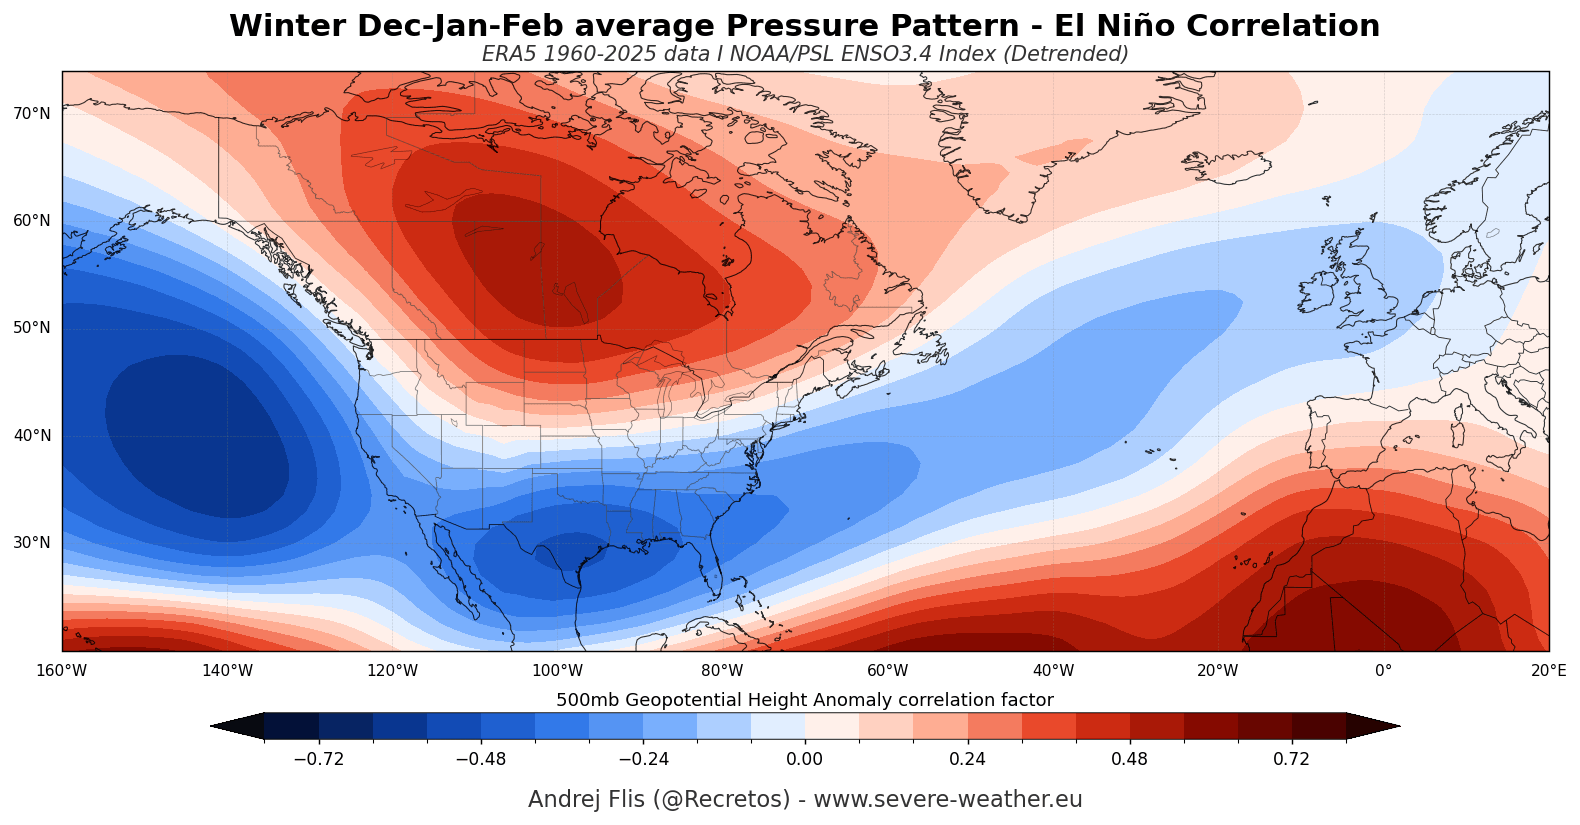
Seeing this is important because it shows just how strong the Super El Niño global forcing really is. And it means that it can (and will) further amplify this pattern into Winter.
The late Fall surface pressure anomaly forecast below also shows an interesting pattern. A broad low-pressure zone is forecast to cover the eastern and central tropical Pacific, indicating a full atmospheric El Niño presence, with high pressure in the rest of the belt. This is a clear confirmation of the El Niño influence on the tropical and global circulation in the forecast data.
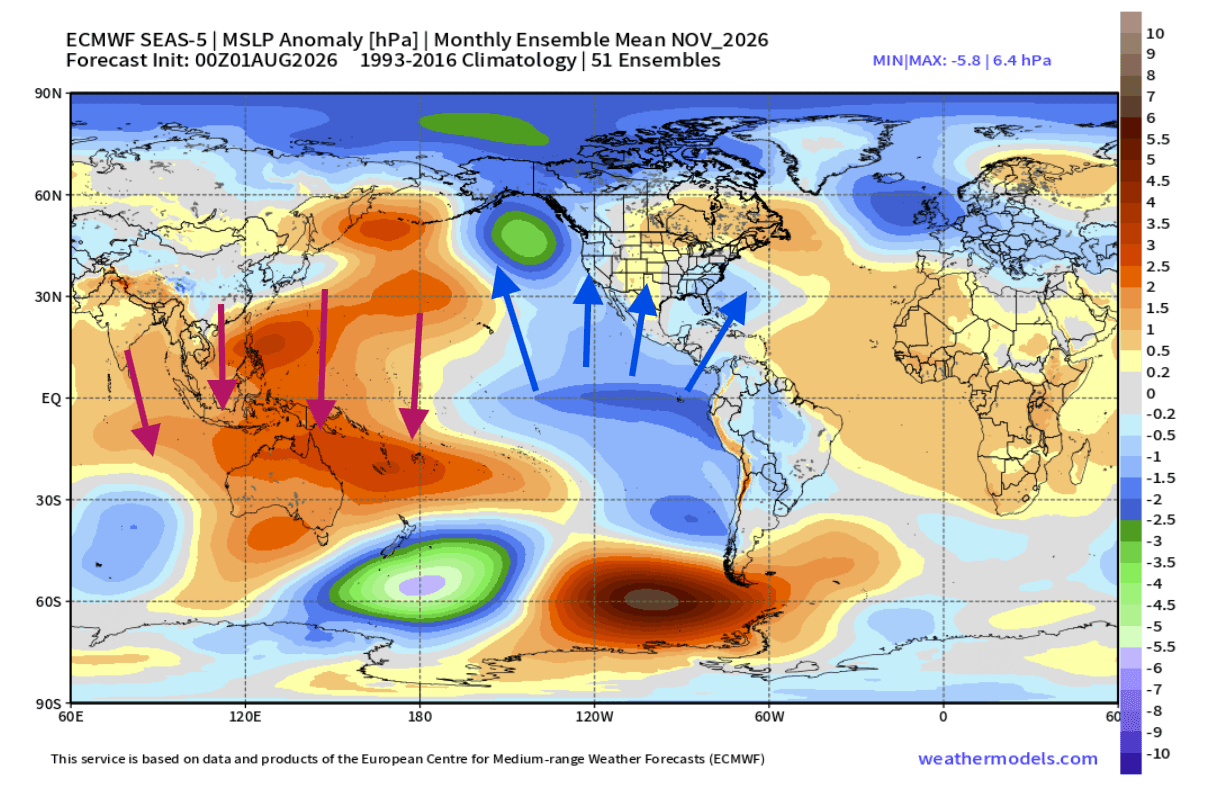
Such a pattern is also a great demonstration of the Walker cell: lower pressure on one side of the globe indicating rising air, and sinking air causing higher pressure on the other side of the Planet.
This is the clearest signature of the Super El Niño, as it deepens its influence on seasonal temperature and precipitation patterns.
Fall 2026 Temperature, Rainfall and Snowfall Forecast
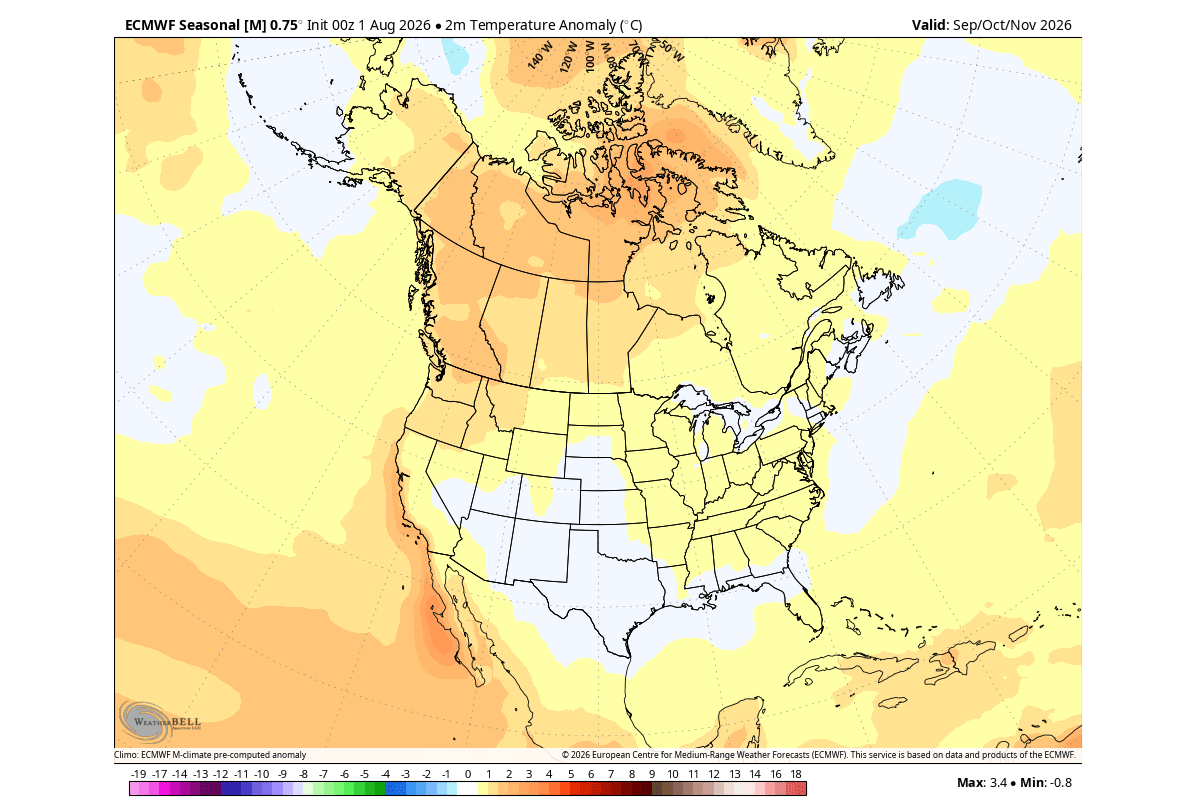
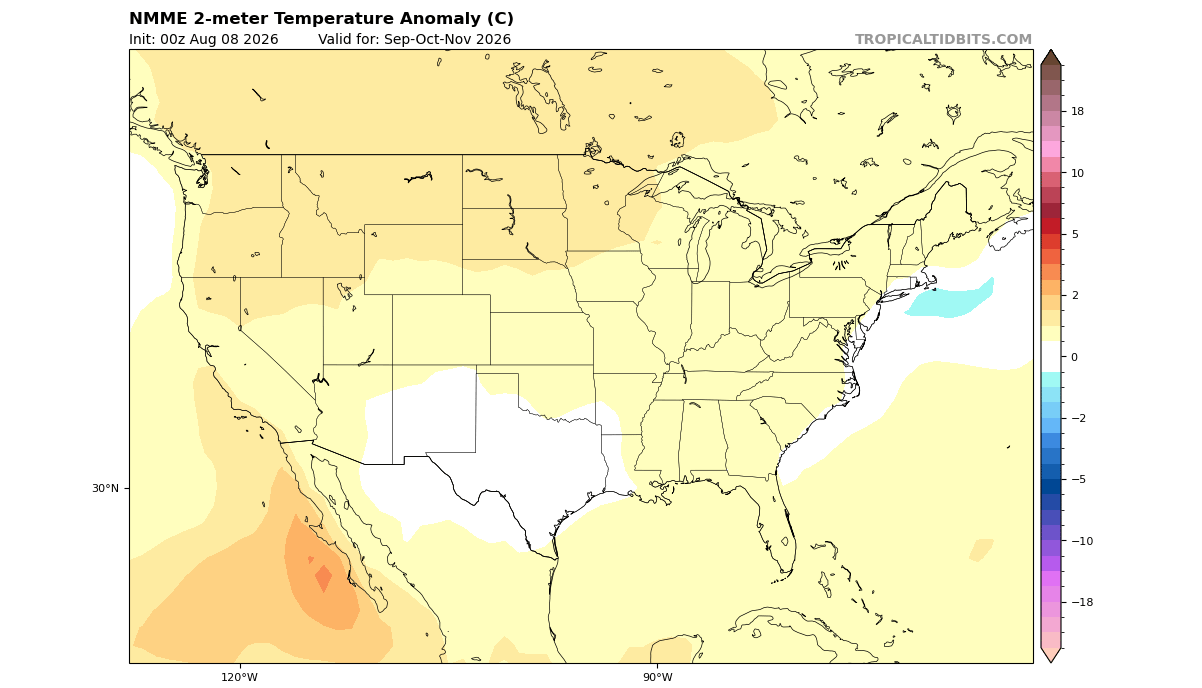
The Fall temperature forecast for North America shows a large area of warmer temperatures under the high-pressure area over the northern United States and over west-central Canada. With a more persistent low-pressure storm track starting to establish in the southern half of the United States, it should keep temperatures close to normal. A slight increase in temperatures is expected toward the east.
Looking at precipitation, you can see a well-developed El Niño signature, with increased rainfall over most of the United States, especially in the south, due to an amplified Pacific jet stream. An amplified Pacific jet brings more moisture and low-pressure systems, creating increased precipitation and unsettled weather.
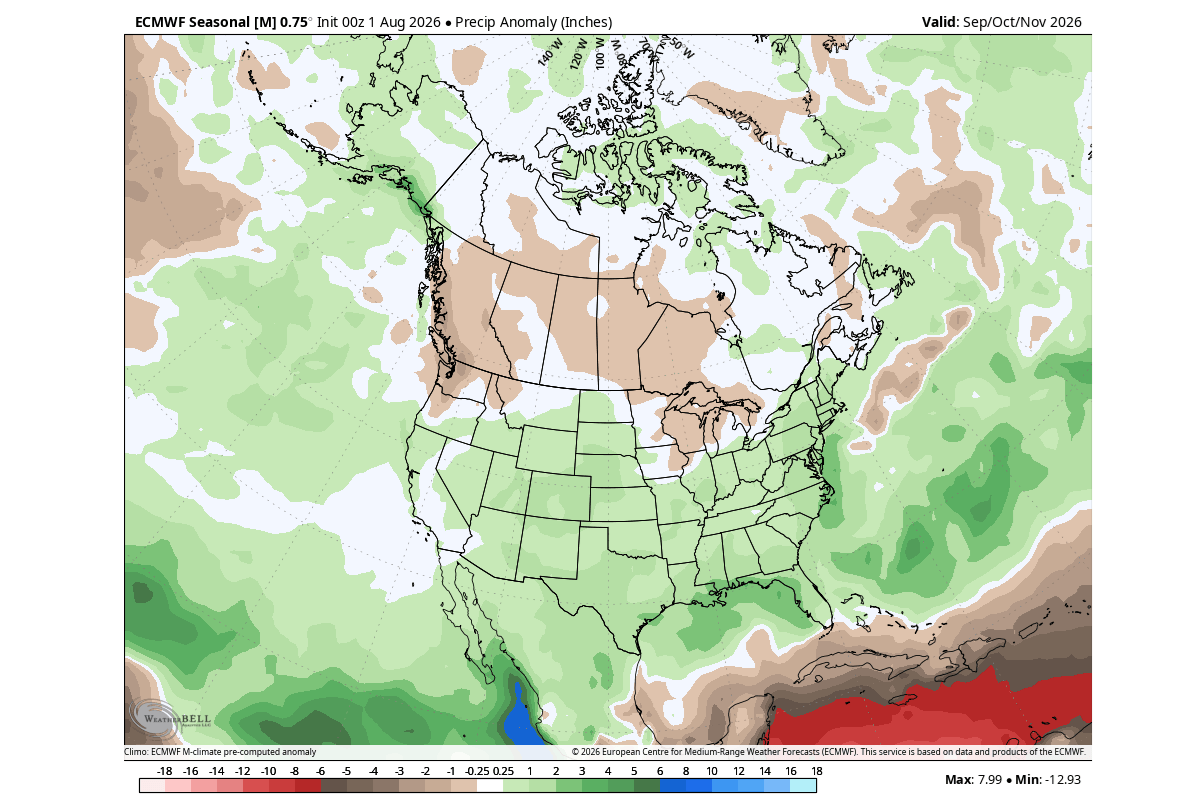
We can see areas with below-normal rainfall in the northwestern United States, the upper Midwest, and over southern, western, and northeastern Canada.
As we get into late Fall, the snowfall chances start to increase again as temperatures drop. But in a Super El Niño year, things are more complicated.
Below is the November snowfall forecast, which shows mostly below-normal snowfall amounts, relative to the long-term average. This is the influence of the high-pressure anomaly over Canada. But surprisingly, we can see an area of above-average snowfall over the U.S. Northern Plains and over the west Texas elevations.
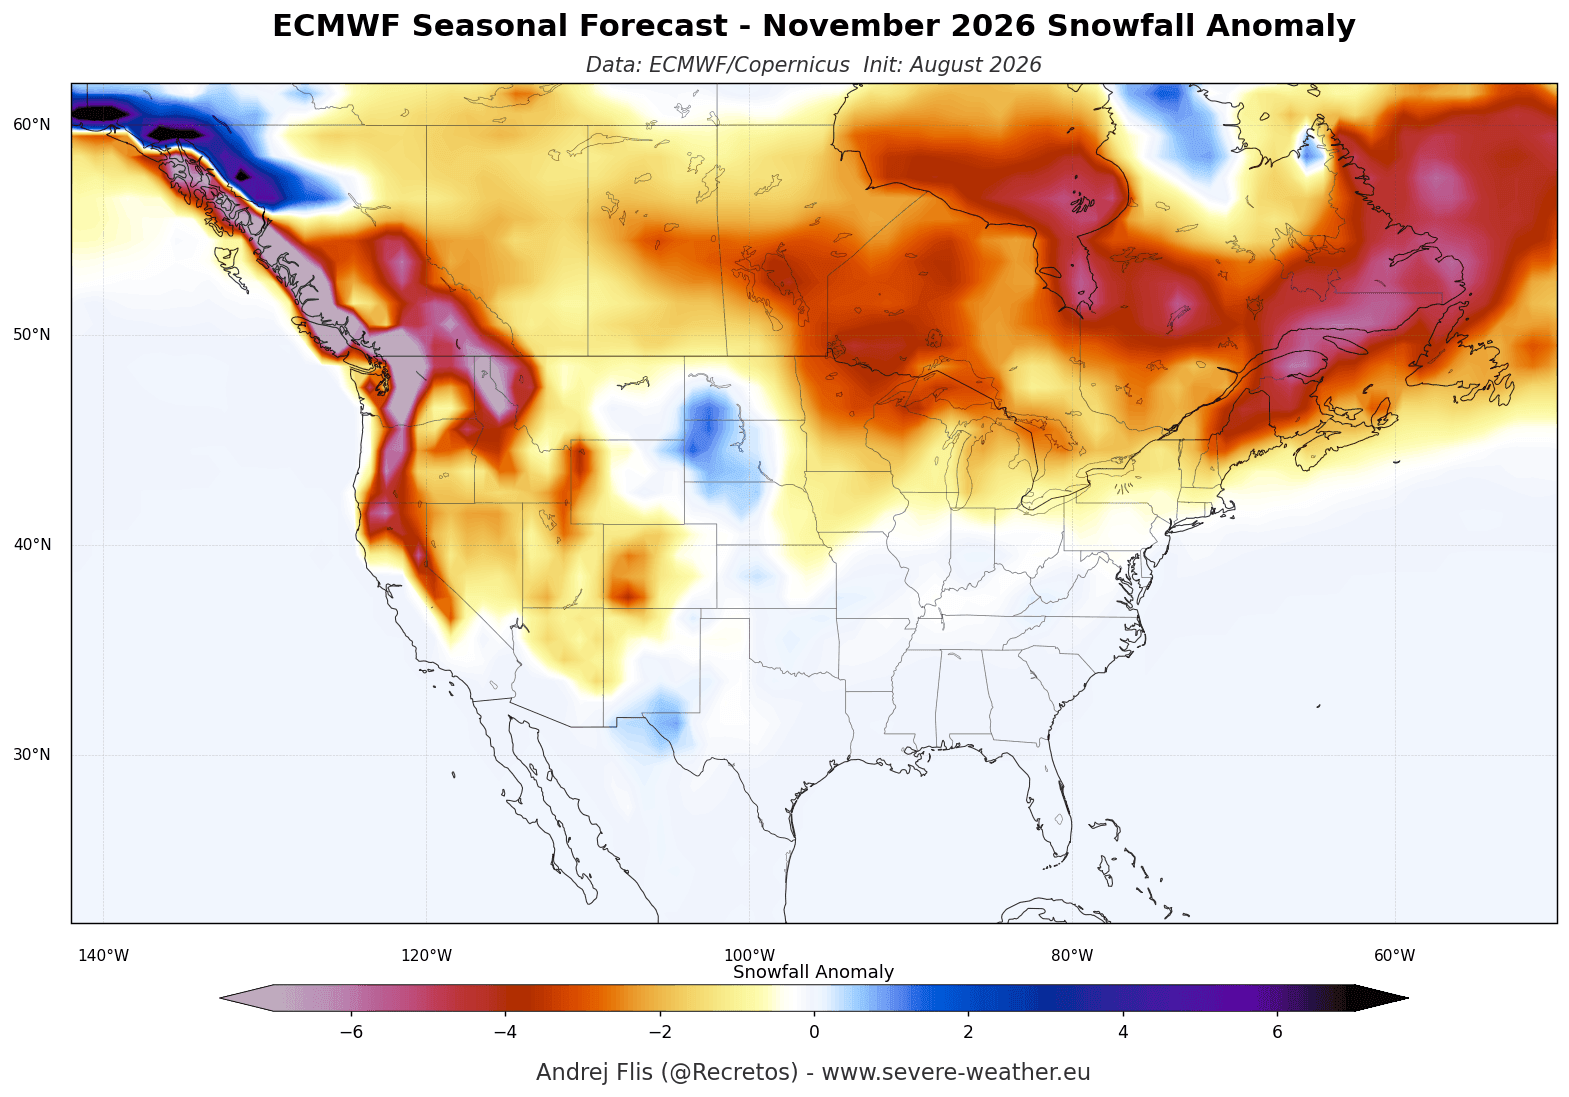
This is due to low-pressure anomalies and a stronger subtropical jet stream over the southern United States, bringing a lot of precipitation and moisture, allowing some snowfall events at higher elevations in late Fall.
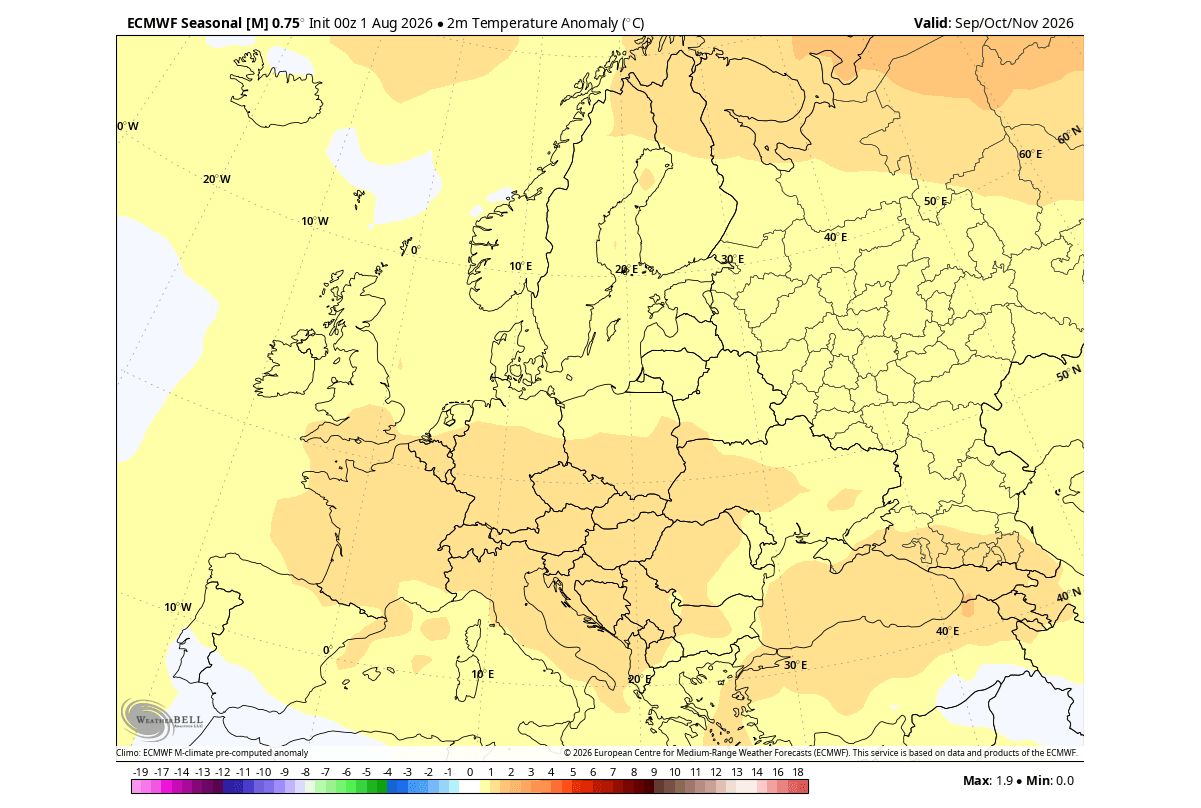
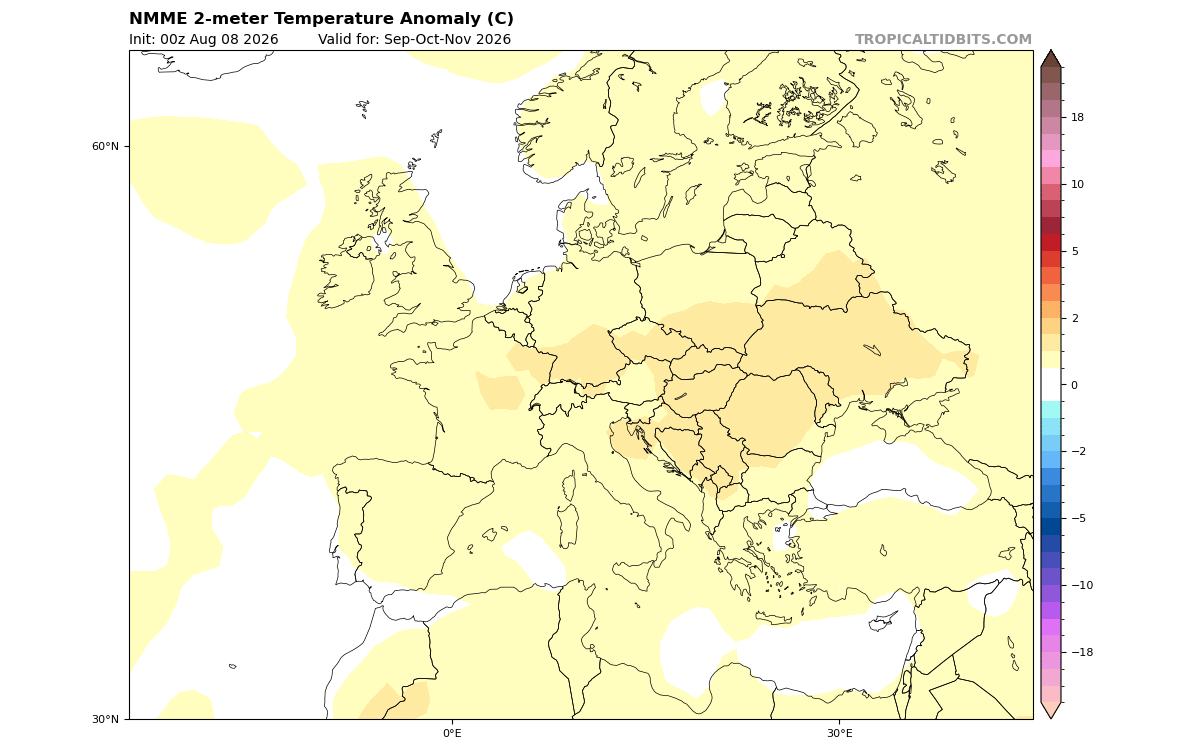
Over Europe, we can see the impact of the low-pressure area in the North Atlantic, bringing warmer-than-normal surface temperatures over much of the continent. Peak warmer anomalies are forecast for central, western, and southeastern regions, driven by the westerly and southwesterly flow.
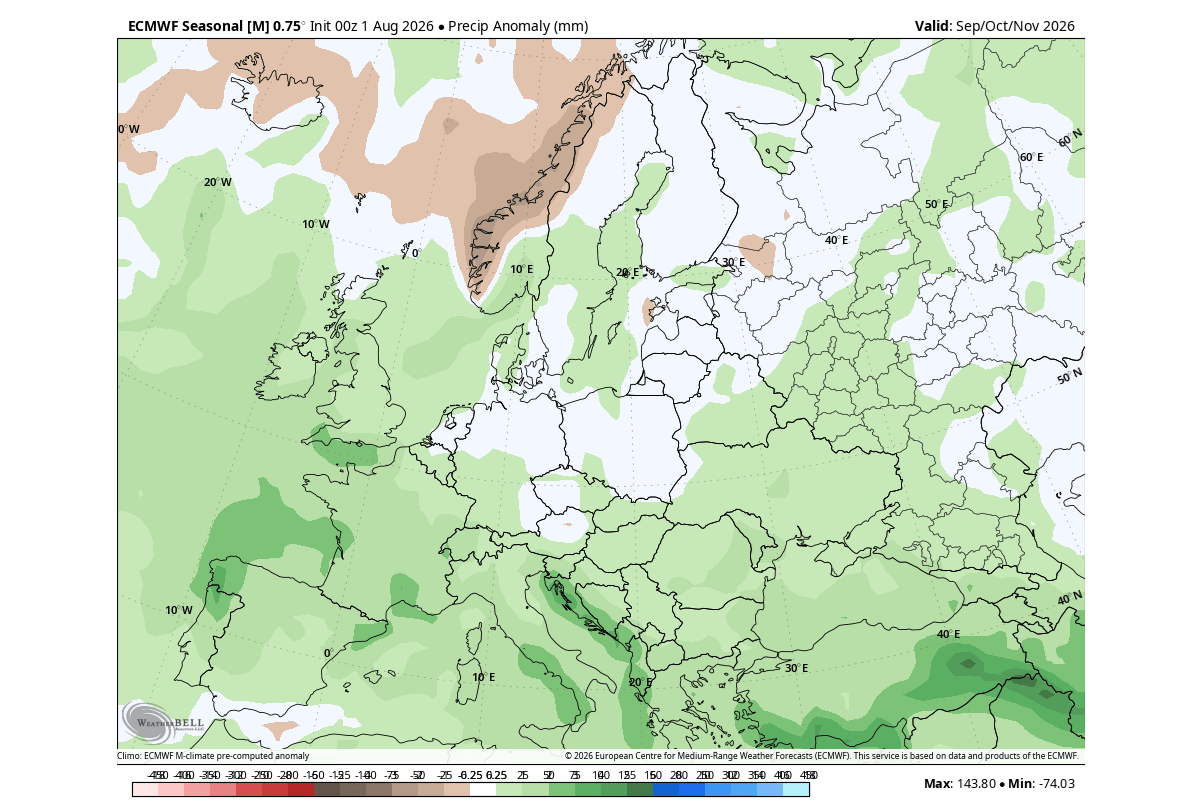
The precipitation forecast shows above-normal Fall rainfall across much of the continent. The westerly and southwesterly flow from the Atlantic brings in a lot of moisture, increasing precipitation potential over much of the continent, especially the southern and western areas.
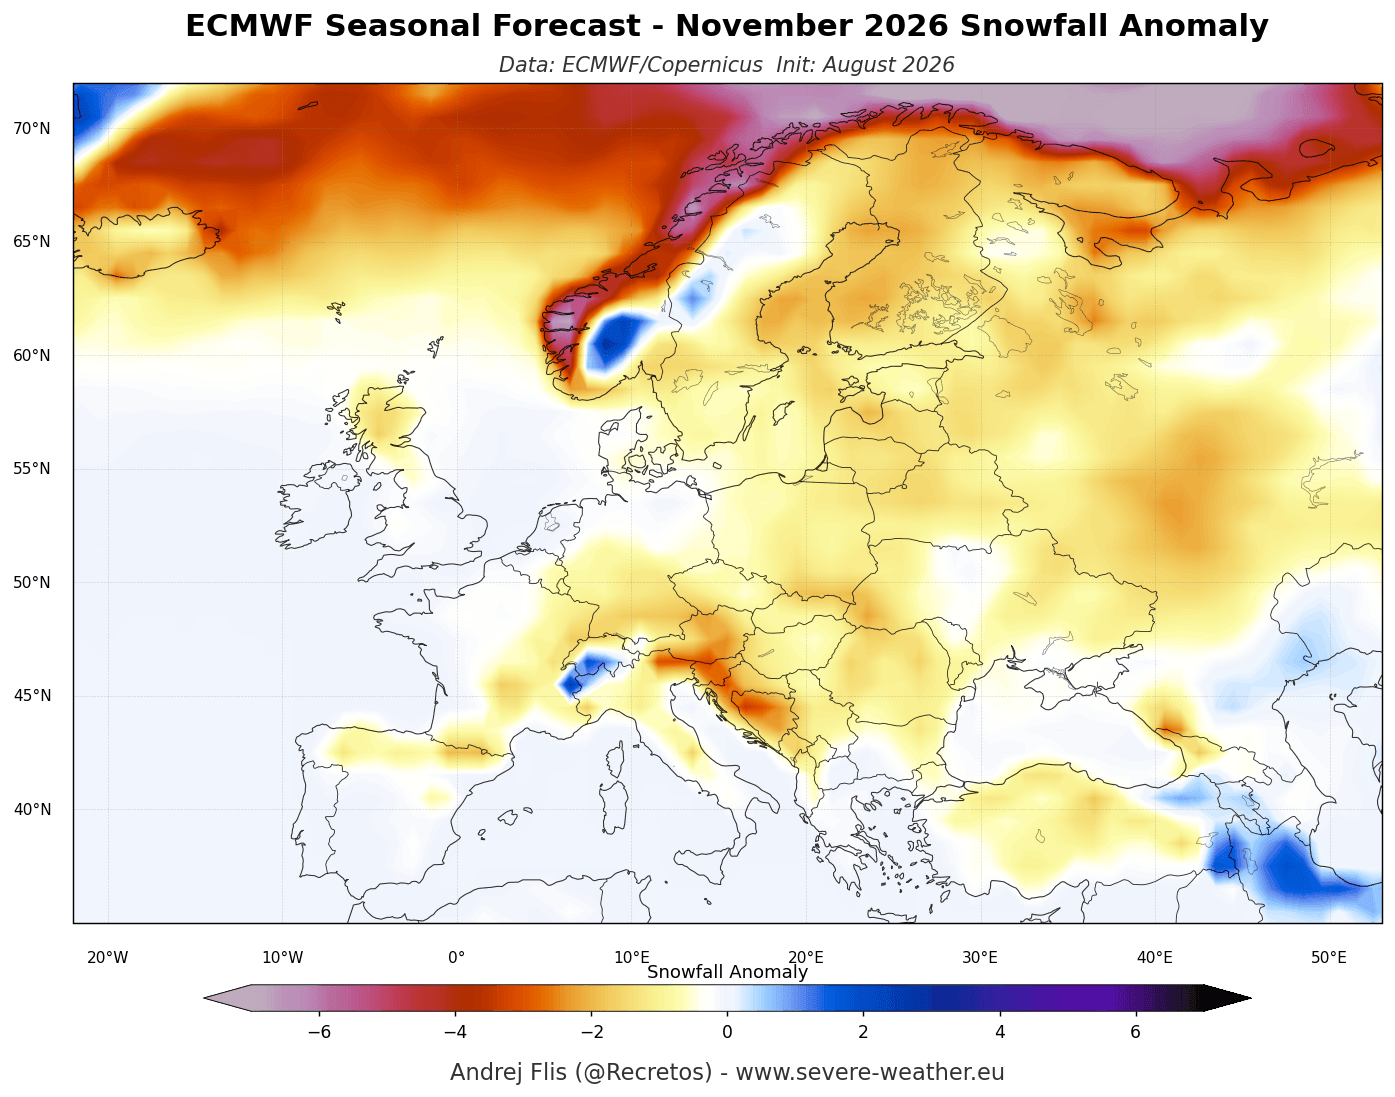
The November snowfall forecast for Europe reflects the milder pattern, creating a slow start to the snow season and below-normal snow accumulations. The exceptions are the elevated areas like the western Alps, which are cold enough to turn more moisture and precipitation into increased snowfall.
Overall, the Northern Hemisphere pressure pattern is rather surprising, because it indicates a very evolved state of the atmospheric El Niño impact, more typical to see for early-mid Winter. And the North American NMME system also agrees.
A Multi-Model Fall 2026 Forecast: United States, Canada, and Europe
I often use the NMME forecasting system. It’s short for North American Multi-Model Ensemble. This system combines several individual models from the United States and Canada to show an average forecast picture, merging different solutions.
Looking at North America, it shows a similar forecast to ECMWF, with the main warm anomaly focused over the northern United States and in the western half of Canada. You can also see the same reduced warm anomaly over the southern U.S., due to the expected low-pressure track and a stronger Pacific jet stream.
The NMME precipitation forecast for North America also confirms a stronger southern jet stream will be active, bringing moisture and rainfall. As in the ECMWF forecast, the bulk of the above-normal rainfall is over the southern and southeastern U.S. in this model as well, with increased rainfall across the central and eastern United States.
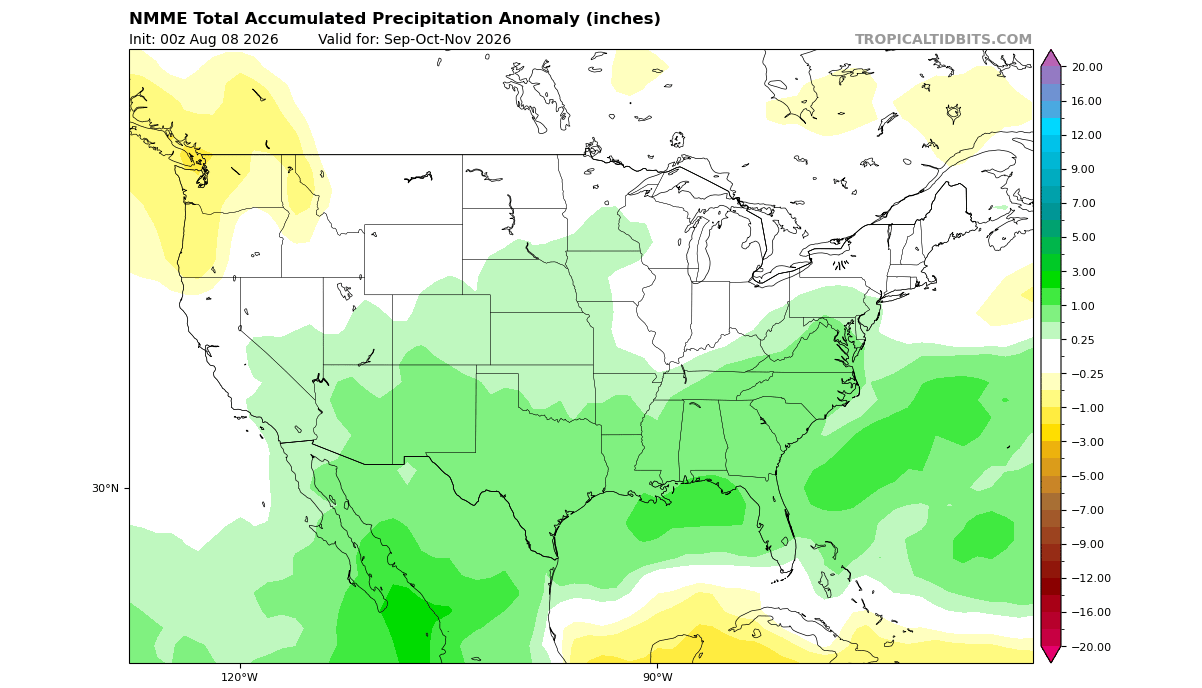
Below-normal rainfall is forecast over the Pacific Northwest and parts of southern Canada due to a high-pressure area building over Canada, bringing a change in atmospheric flow.
The surface temperature forecast for Europe shows a warm anomaly over much of the continent. The strongest warm anomalies are in the central areas. This indicates a more westerly flow, the same as in the previous model above.
This westerly pattern is confirmed by the precipitation forecast for Fall, which shows wetter conditions across the northwestern, central, and southeastern parts. This suggests a likely low-pressure system in the North Atlantic, bringing in mild, moist oceanic air, very similar to the ECMWF forecast.
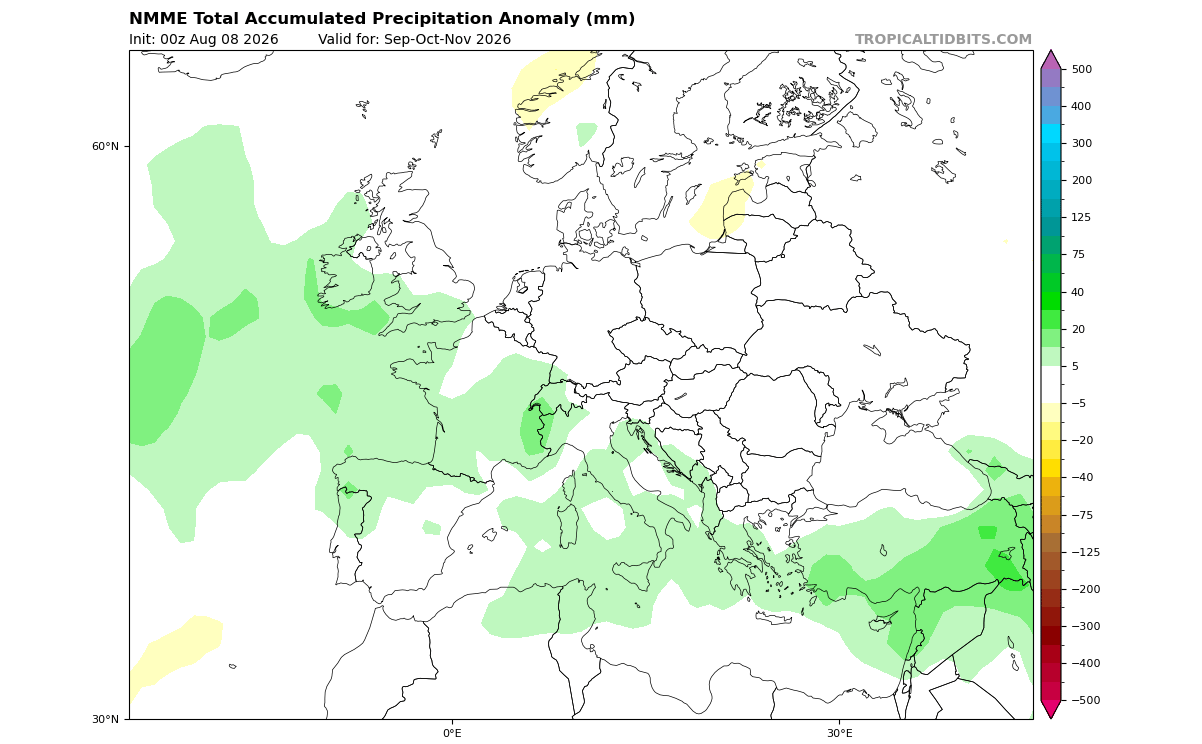
This further confirms (along with ECMWF) that Fall 2026 will feature an amplified pattern development due to the Super El Niño event. An even stronger pattern is expected as we head into the Fall-Winter transition.
Winter 2026/2027 Setup: High-Pressure Blocking and a Split-Flow Pattern
A 2023 study (linked below) found that the atmospheric impact of El Niño does not simply increase equally to the ocean anomalies. The seasonal shift from Fall toward Winter also changes tropical patterns and can rapidly strengthen the Pacific-North American pattern even if Pacific SST anomalies evolve more gradually.
But since we are in a likely record-breaking El Niño event, this further amplifies the seasonal Fall-Winter transition patterns.
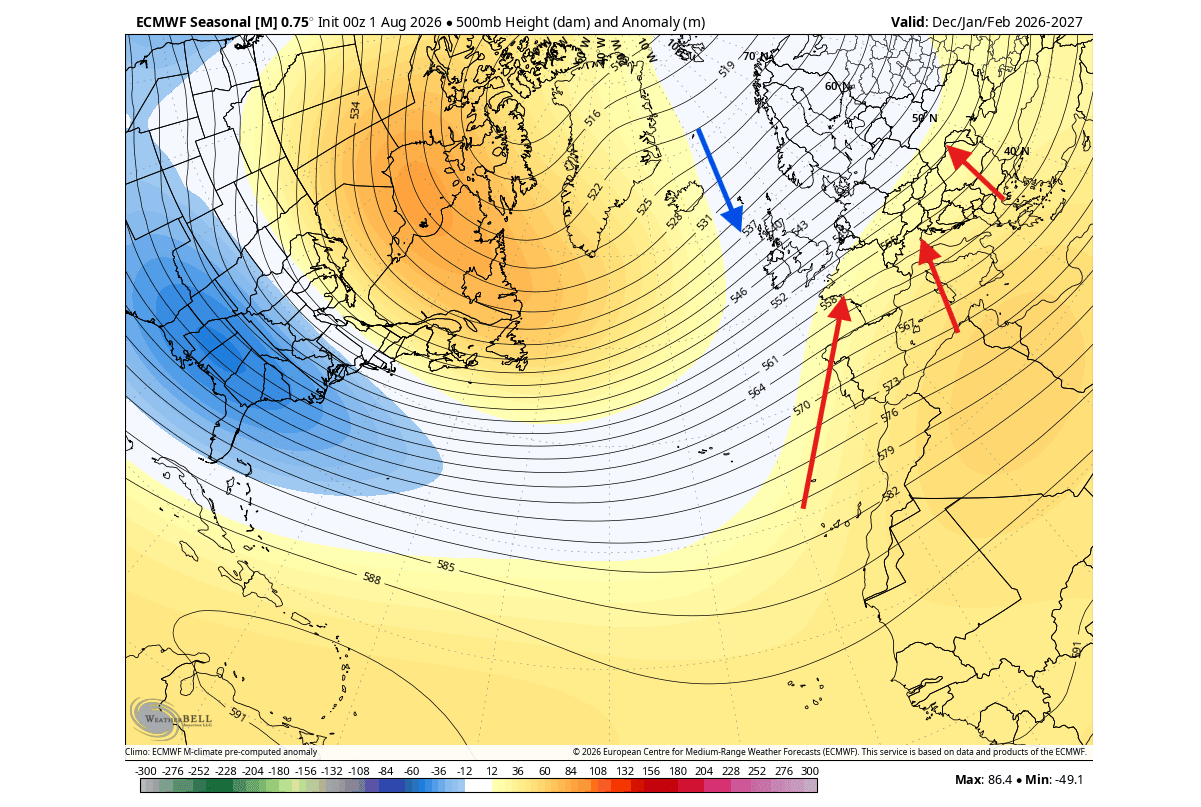
The image below shows a direct comparison of the December, January, and February forecasts (from left to right). You can see a significant change in the strength of the anomalies in the otherwise same pressure pattern layout. This pattern is a continuation from Fall, but very amplified as we head into Winter.
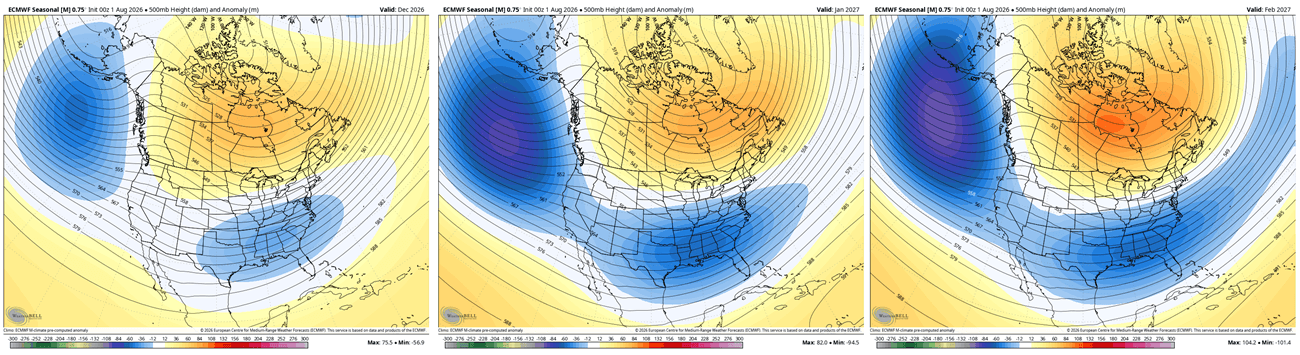
It is normal for pressure systems to get stronger into Winter, creating deeper anomalies. But instead of the usual shifting anomalies, we are looking at persistent anomaly centers that strengthen from month to month. This gives a clear indication of a very strong El Niño forcing in the atmosphere.
Looking closer at the February forecast trend, we see a Winter pattern dominated by a high-pressure blocking anomaly over Canada in the mid-levels. This strong atmospheric blocking zone acts like a large boulder in a river, disrupting the polar jet stream, creating a milder, warmer-than-average Winter across most of Canada and the far northern United States.
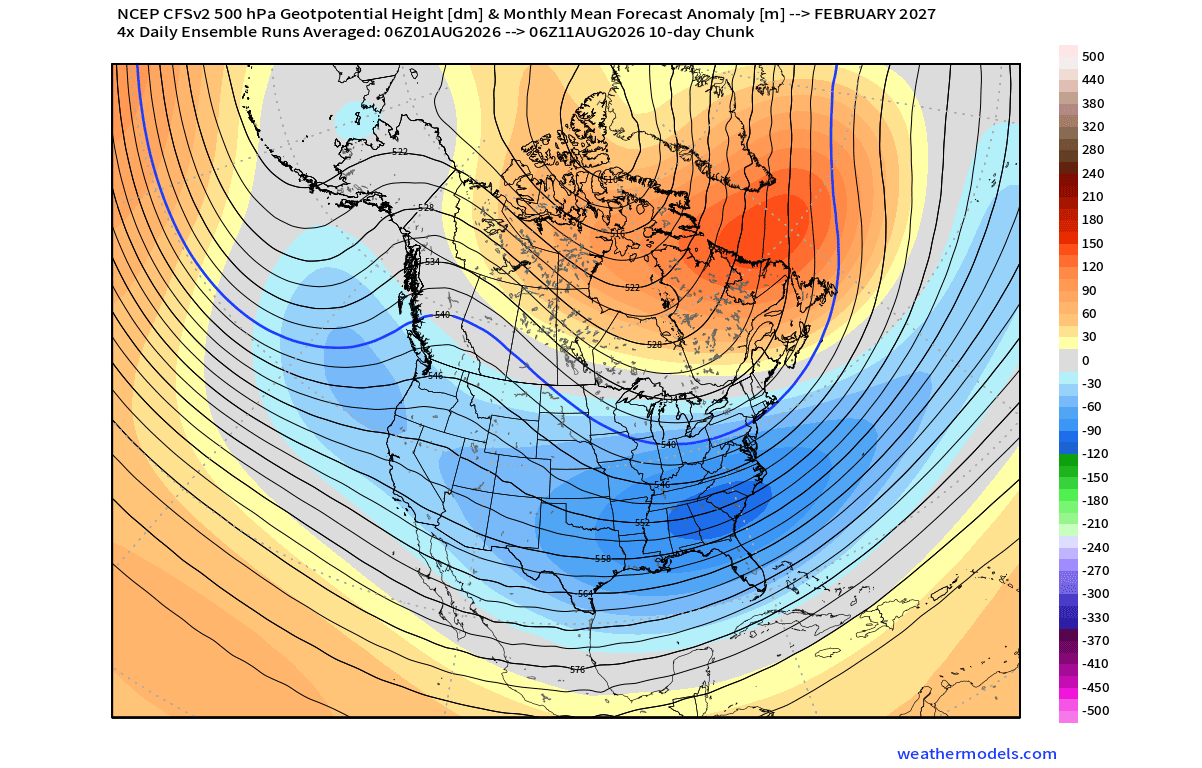
But a highly active low-pressure zone is forecast across the southern and eastern United States. This represents a supercharged subtropical jet stream, which brings frequent, moisture-rich systems to the Southern, Central, and Eastern United States.
This pattern supports a stronger southern storm track across the United States, while the Canadian high-pressure anomaly can help deflect colder air southward into parts of the central and eastern United States. It does not guarantee individual snow or cold outbreaks, but it signals a winter pattern with increased potential for stronger storm systems and higher temperature contrasts in mid-to-late winter.
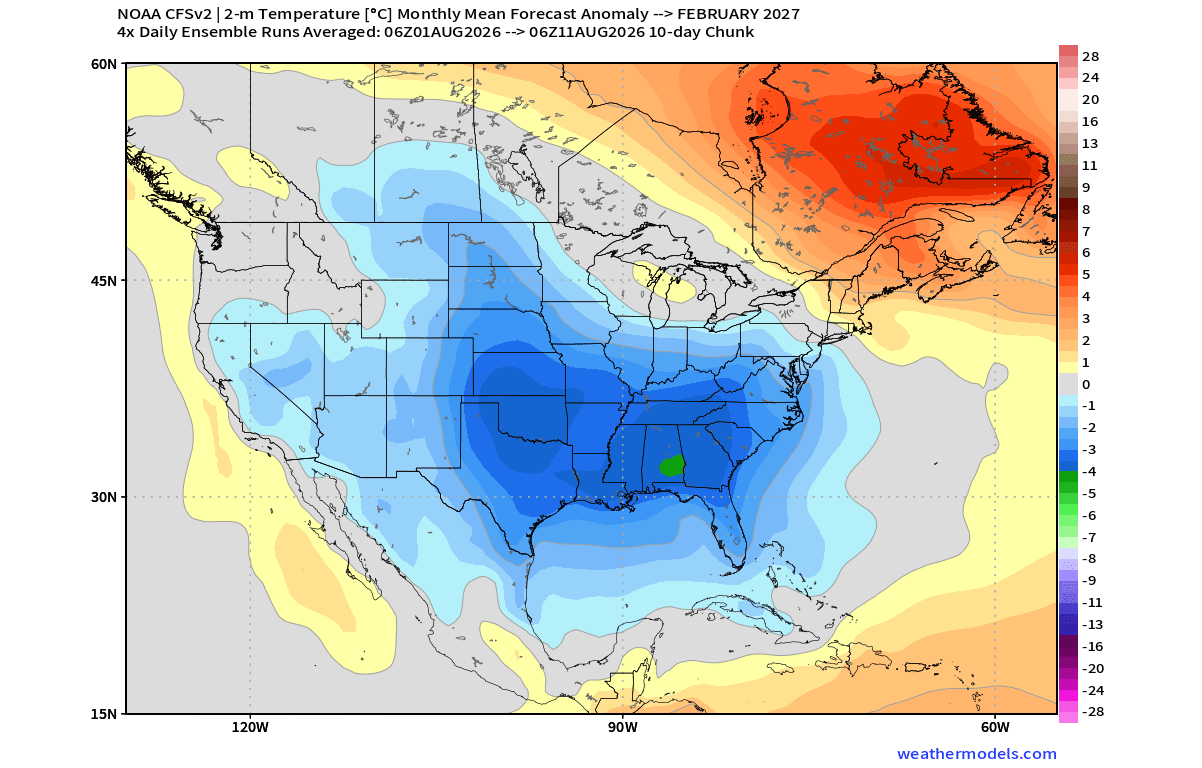
Below is also the NMME temperature forecast for January to March, covering the mid-to-late winter period. It also shows a very similar below-normal temperature area, driven by the amplified low-pressure zone. Above-normal temperatures dominate Canada and the northwestern U.S., as well as the upper Midwest and the Northeast.
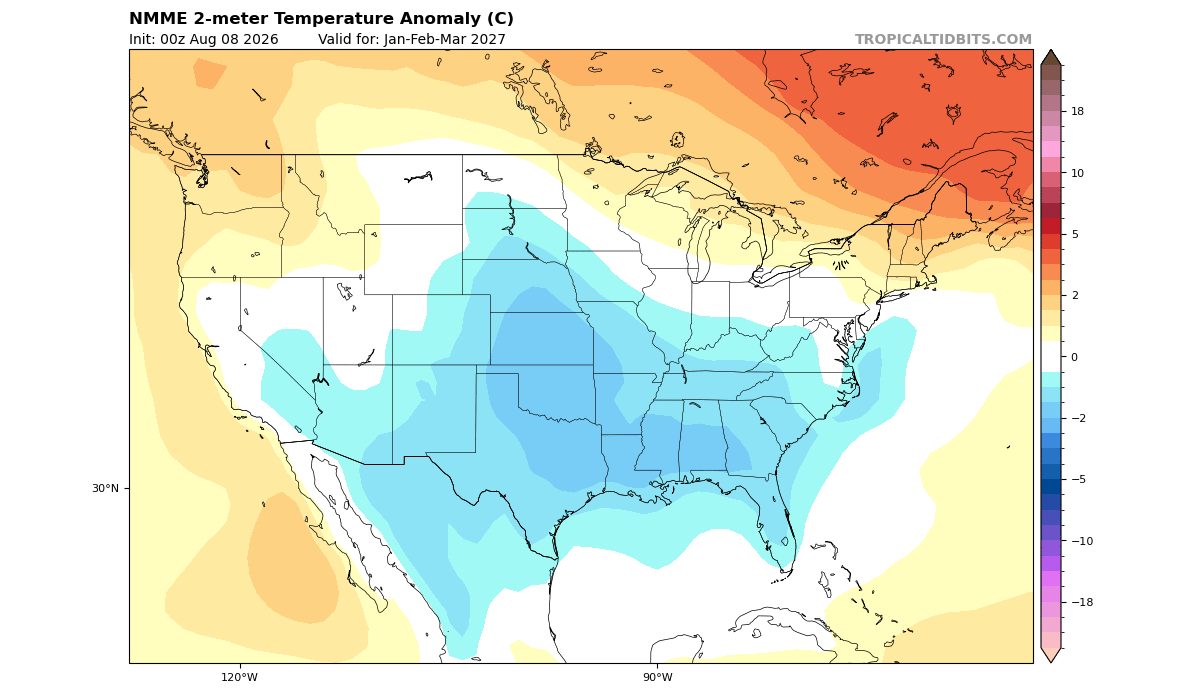
But the farther north we go, the lower the base temperatures are. So an above-normal anomaly in an area with low normal temperatures is much less limiting for winter potential than in a more southern environment.
The pressure pattern over North America also has a downstream impact, creating a low-pressure zone in the North Atlantic. This creates an active storm track, with frequent low-pressure systems, stronger winds, milder air, and above-normal precipitation potential across mainland Europe. The main cold air corridor is over the far northern parts, potentially also favoring the northwestern region for some cold spills.
Below is the NMME temperature forecast for December-February, and it reflects the low-pressure Atlantic scenario and an amplified pressure ridge from the south. That brings mild or above-normal temperatures into most of the continent, boosted by the low-pressure in the Atlantic, driving a westerly to southwesterly flow.
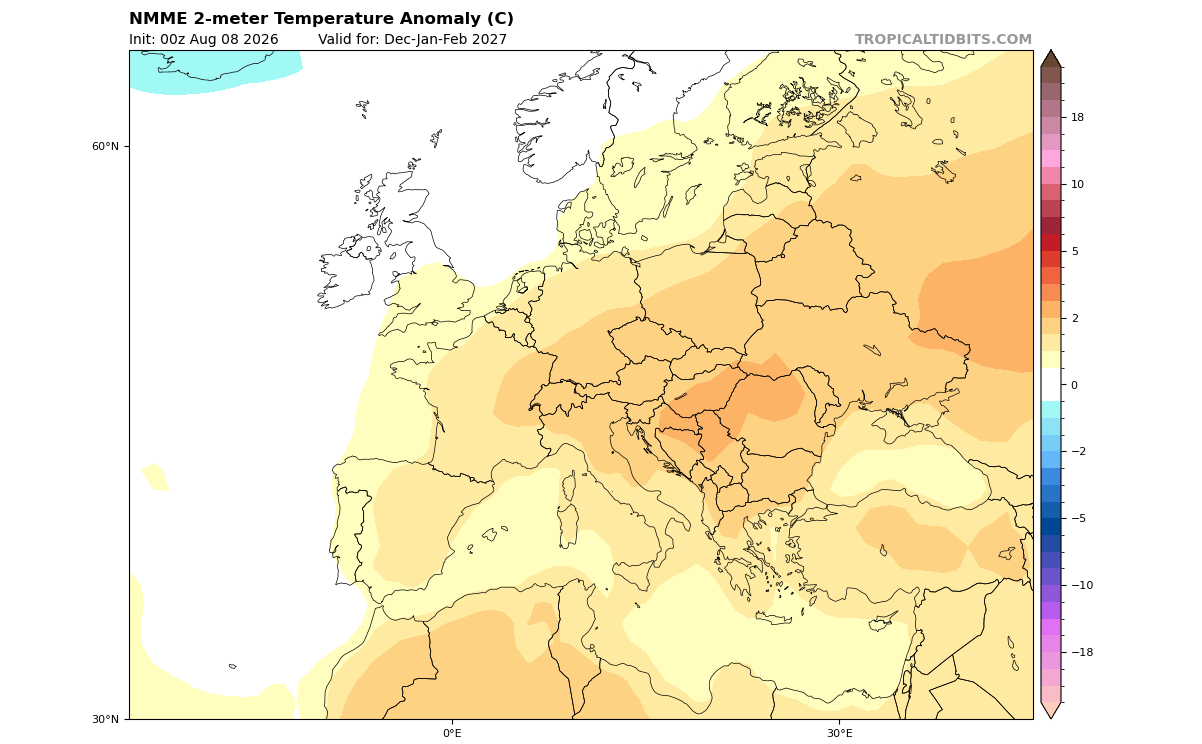
This pattern can really limit any proper or long-lasting winter potential, but there still is room to improve. Unlike North America, where the models show a clear, direct Super El Niño signal, the current Winter trends over Europe remain more sensitive to changes in the North Atlantic circulation.
I will soon write a full, in-depth look at the latest Winter 2026/2027 trends and patterns, where I will break down this Super El Niño pattern in more detail, along with historical context.
But every Fall, another large-scale factor emerges that has a very important role in winter weather and can impact the entire cold weather season: the Polar Vortex.
Polar Vortex Outlook: Stratospheric Warming Risk Increases Under Strong El Niño
The Polar Vortex re-emerges every Fall and plays a key role in seasonal weather development from November to March. It also makes for an interesting pairing with a Super El Niño.
The Polar Vortex is a large cyclonic area that is spinning over the entire Northern Hemisphere, from the ground up to the top of the stratosphere, reaching over 50km/31miles in altitude.
To give you a better idea, I made a 3-dimensional model of the Polar Vortex using real analysis data from a disruption event in January 2026. Here, a high-pressure anomaly in the stratosphere has disrupted its structure. This caused the Polar Vortex to push its lower core into North America, allowing a strong northerly flow with cold air to spill into the eastern United States, Canada, and parts of Europe.
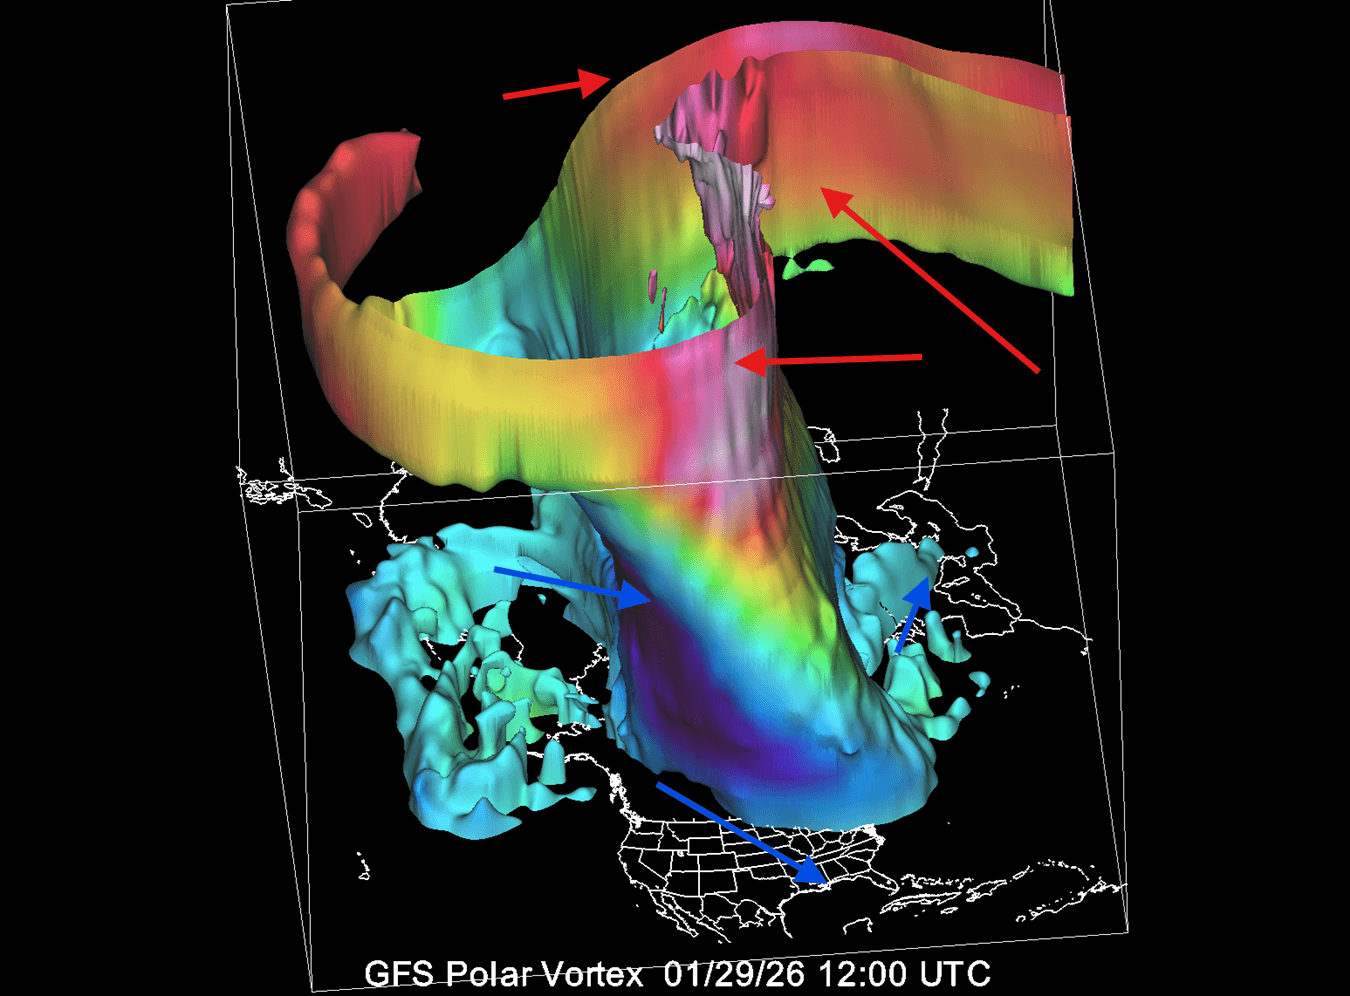
In the example above, the Polar Vortex was undergoing a temporary stratospheric warming event. These events can disrupt the Polar Vortex, weakening its circulation and changing the weather patterns below.
El Niño winters can have an elevated tendency toward Polar Vortex disruption and Sudden Stratospheric Warming (SSW) events. This is likely related to the powerful atmospheric wave in the North Pacific and North America that sends a lot of energy upward into the Stratosphere, disrupting the Polar Vortex.
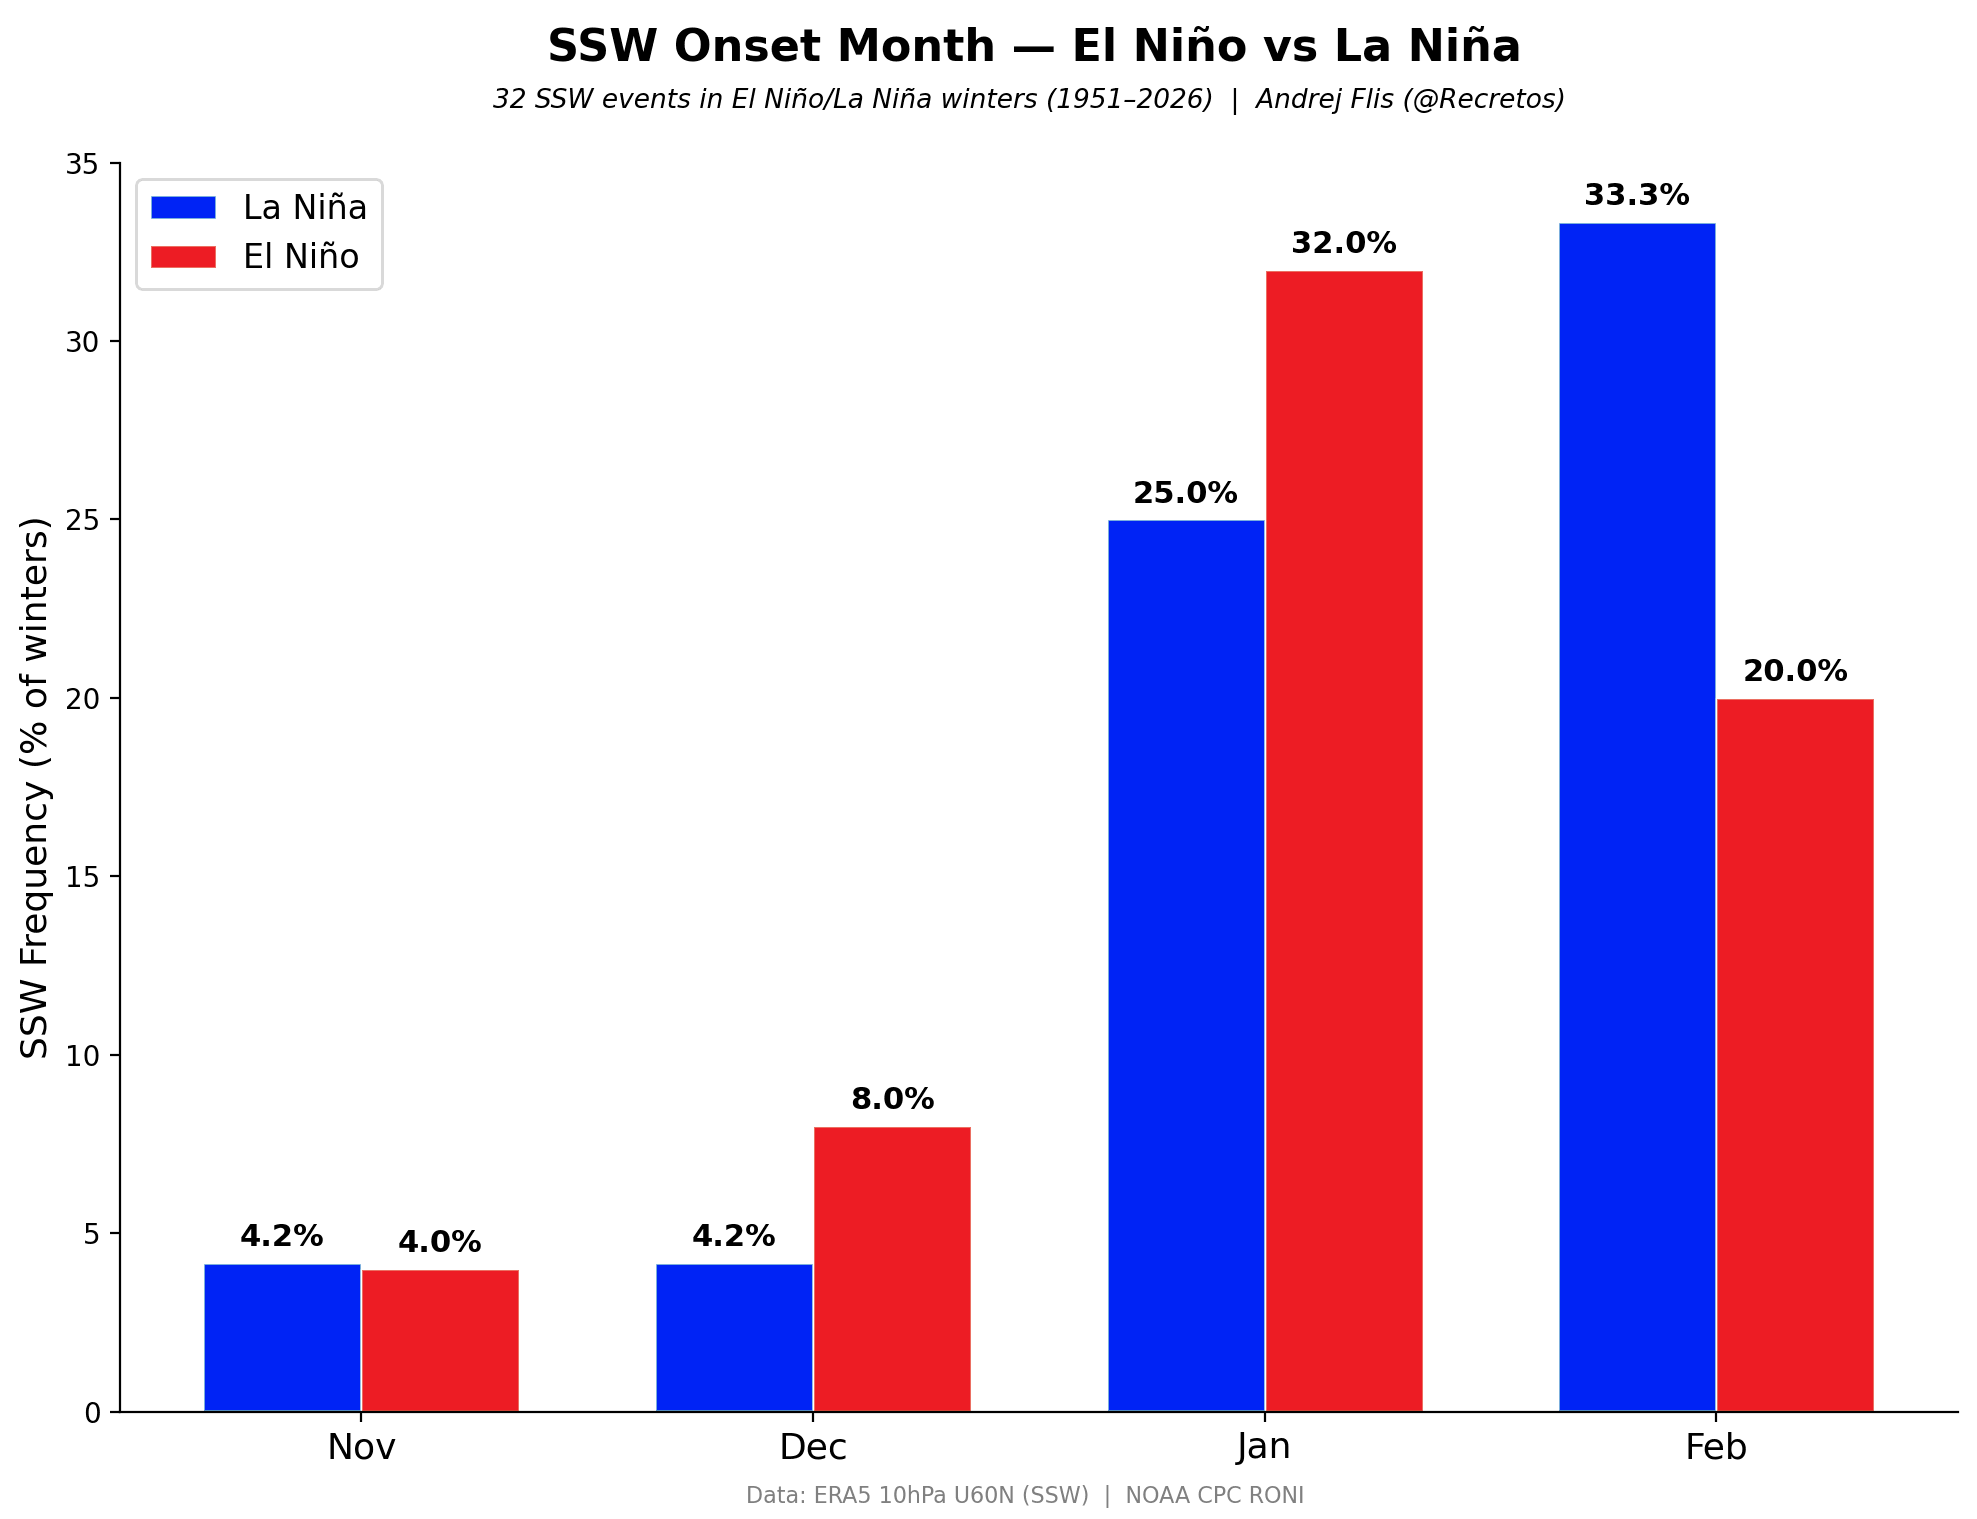
As you can see above, an El Niño phase has a higher chance of producing a Polar Vortex collapse event in mid-winter. It also shows a better chance for a Polar Vortex disruption in December and January, compared to a La Niña event, with an especially high impact in January.
A weak Polar Vortex creates a disrupted jet stream pattern, leading to a strong weather response. As a result, it has a harder time containing the cold polar air, which then has an easier path from the polar regions into the United States or other mid-latitude areas.
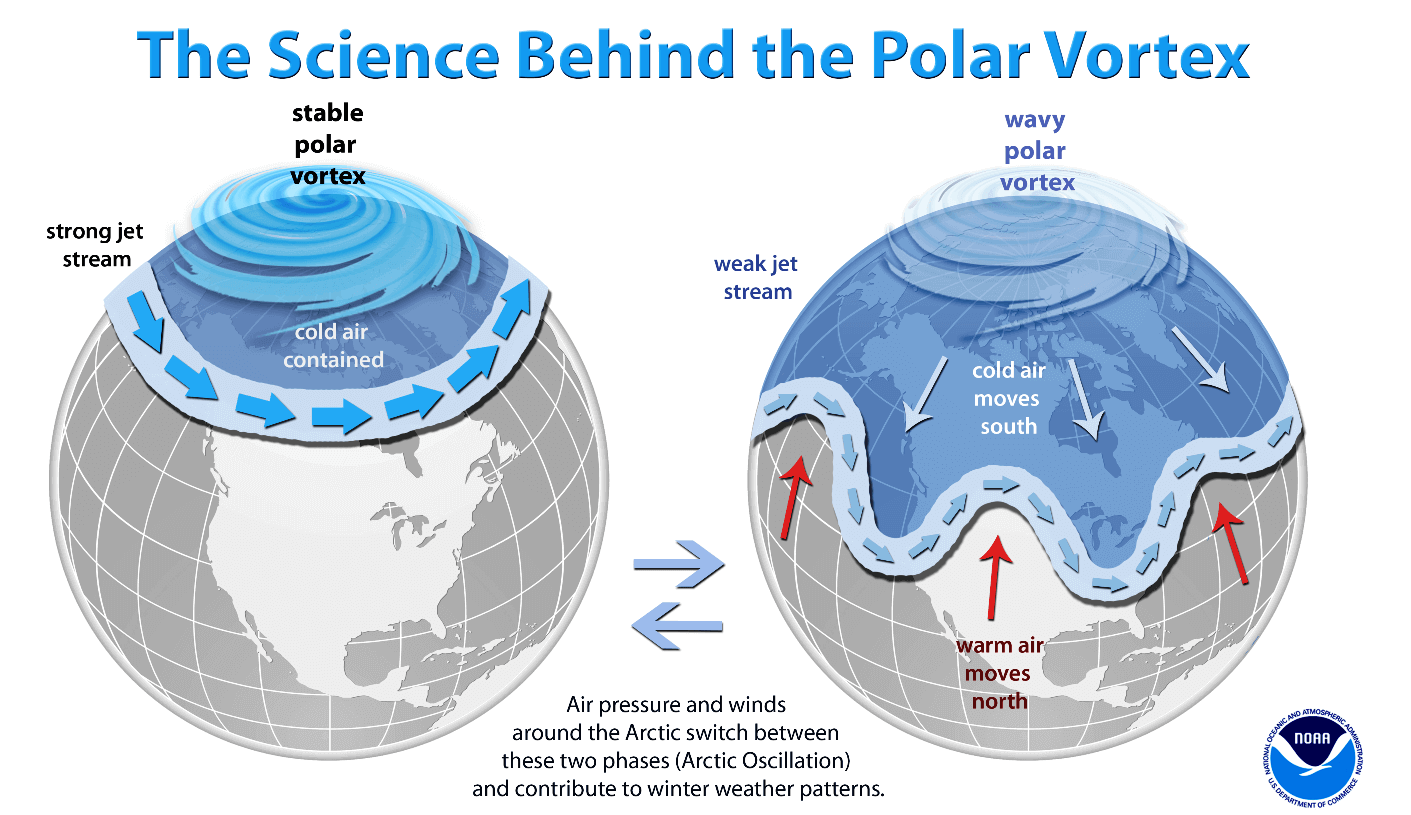
So, if you want a colder and snowier Winter, your best bet is a weak Polar Vortex. In nature, a weak Polar Vortex indicates a full collapse or a major disruption of its structure, resulting in the spill-out of cold air from the polar regions.
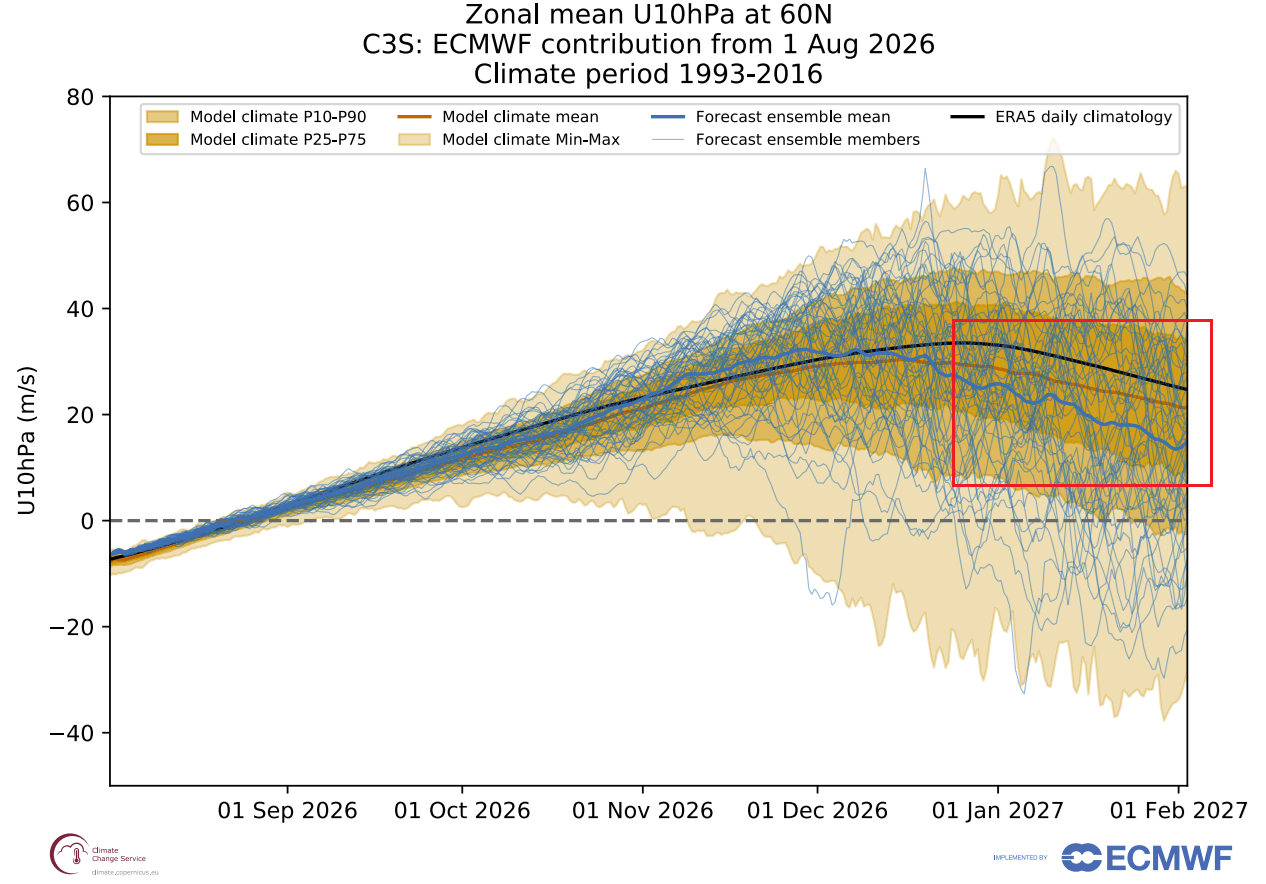
The latest ECMWF forecast for the Polar Vortex actually shows an unusual deceleration of its winds in late December and January, more than is normal seasonally. You can see it in the image below, which indicates below-normal stratospheric winds in mid-Winter, and potentially a disruption event.
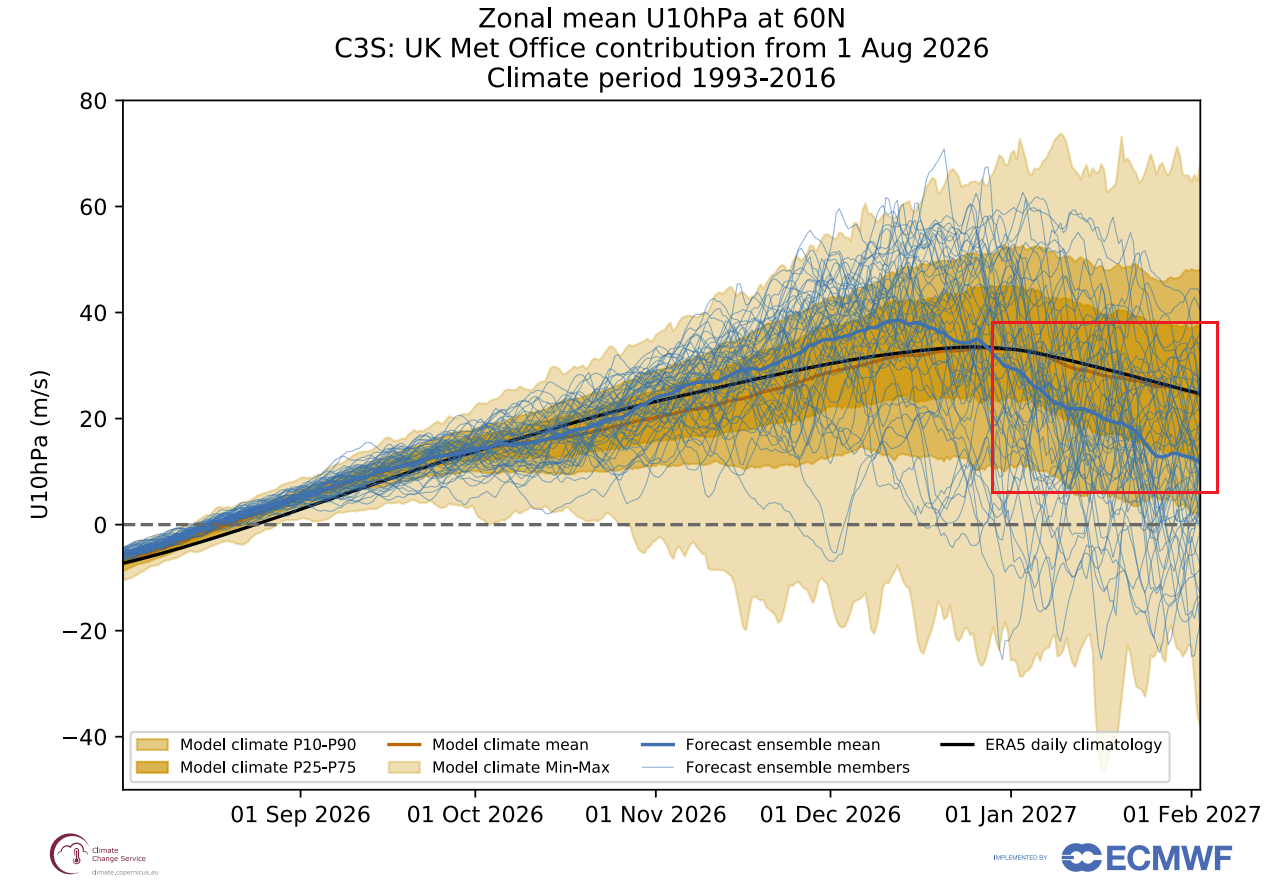
We can also look at the UKMO stratospheric forecast, which shows an even more serious deceleration and weakening of the Polar Vortex in the late December-January period. This is a likely response to the El Niño pattern releasing plenty of energy into the stratosphere.
Overall, we see all signs pointing to a highly amplified Fall and Winter pattern over the Northern Hemisphere. The main culprit is the Super El Niño event, but we can also see early signals from the Polar Vortex emerging that could play an important Winter role down the line.
Scientific Research Used for this Article
- Autumn El Niño Teleconnections: Differences in Teleconnection over the North Pacific and Rainfall Shift over the USA Associated with Two Types of El Niño during Boreal Autumn – Zhang et al. (2012).
- ENSO–PNA Seasonal Transition: Seasonal Dependence of the Pacific–North American Teleconnection Associated with ENSO and Its Interaction with the Annual Cycle – Hu et al. (2023).
Forecast and analysis images in this article are from ECMWF, TropicalTidbits, weathermodels.com, and WeatherBell (using a commercial license).
Read more: A New Ocean Anomaly Joins Super El Niño, Reshaping the Winter 2026/2027 Forecast
We will keep you updated on the global weather pattern development, so bookmark our page. Also, if you have seen this article in the Google App (Discover) feed, click the like (♥) or the star button there to see more of our forecasts and our latest articles on weather and nature in general.