A new ocean anomaly is emerging in the tropics, just as the Super El Niño continues to rapidly strengthen across the tropical Pacific. Known as the positive Indian Ocean Dipole (IOD), this developing pattern creates opposing temperature anomalies across the ocean and a large atmospheric circulation response above the tropics.
Seasonal forecasts indicate that the positive IOD phase could persist through Fall and into early Winter. This allows its tropical forcing to combine with the developing Super El Niño circulation and influence jet stream patterns across the Northern Hemisphere Winter 2026/2027.
In this specialized forecast article, I break down the latest IOD development and its atmospheric connection to Super El Niño. I also take a deeper look at how this combined tropical forcing appears in the newest Winter 2026/2027 forecasts for the United States, Canada, and Europe, including temperature, precipitation, and snowfall trends.
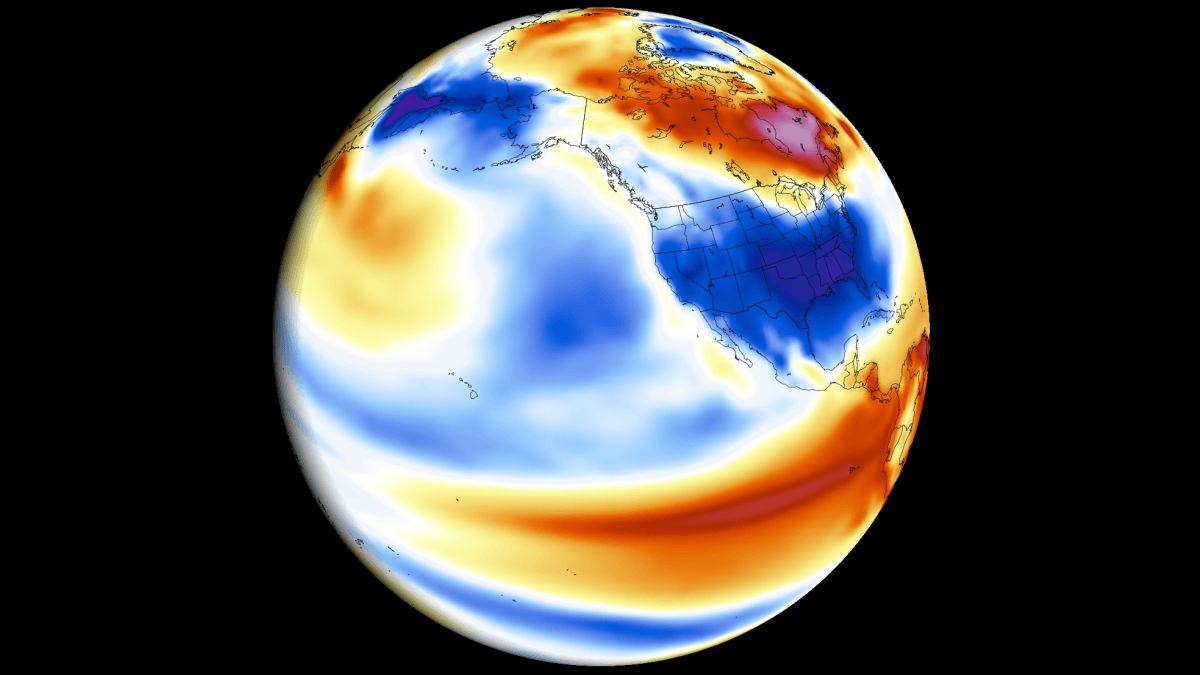
Global Tropics: A New Ocean Anomaly Emerging
This new ocean anomaly is called the Indian Ocean Dipole (IOD). It occurs in the Indian Ocean and consists of two opposite temperature anomalies, hence the name “dipole”.
The schematic below illustrates the atmospheric circulation during a positive IOD phase. In this state, air rises over the warm western waters and sinks over the cooler eastern region. This creates a massive tropical atmospheric cell, transforming the IOD from a localized anomaly into a major driver in the tropical and global weather engine. Image by NOAA-Climate.
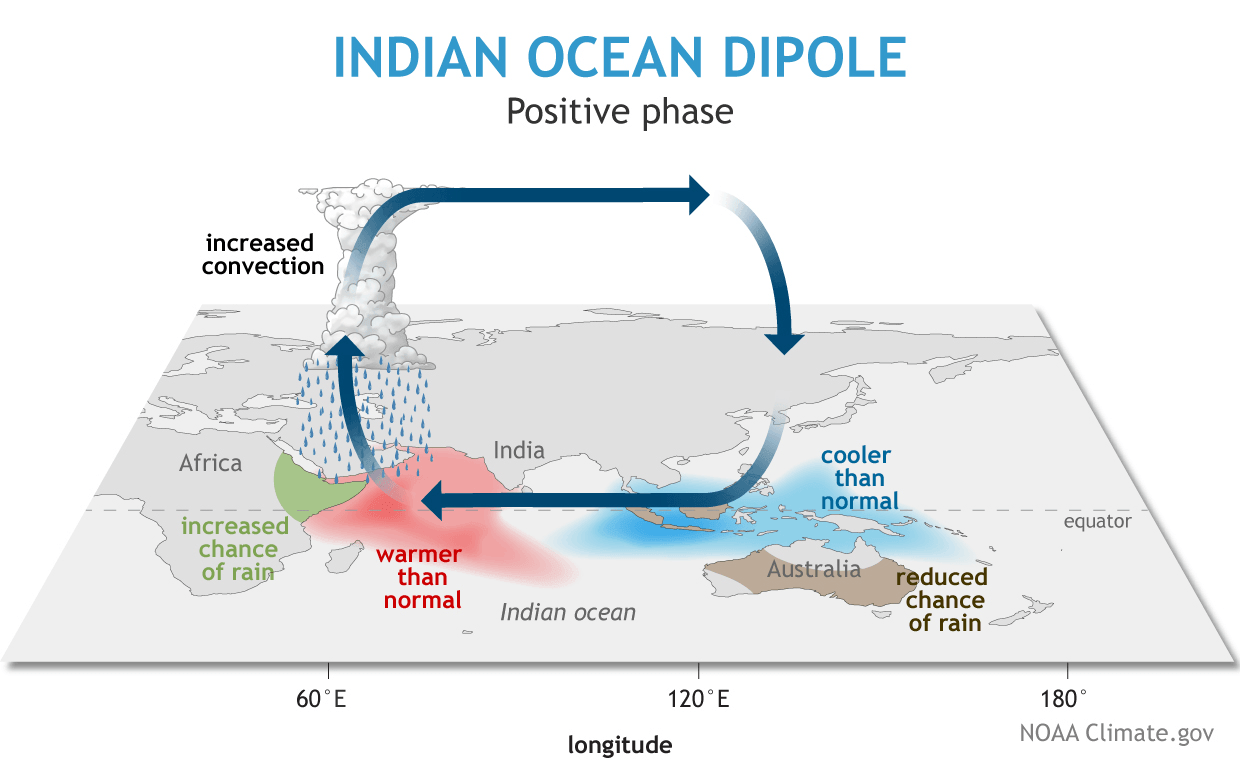
The IOD is basically an imbalance in ocean temperatures between the east and the west. Changes in ocean temperatures between the regions occur due to a shift in trade wind patterns and tropical convection.
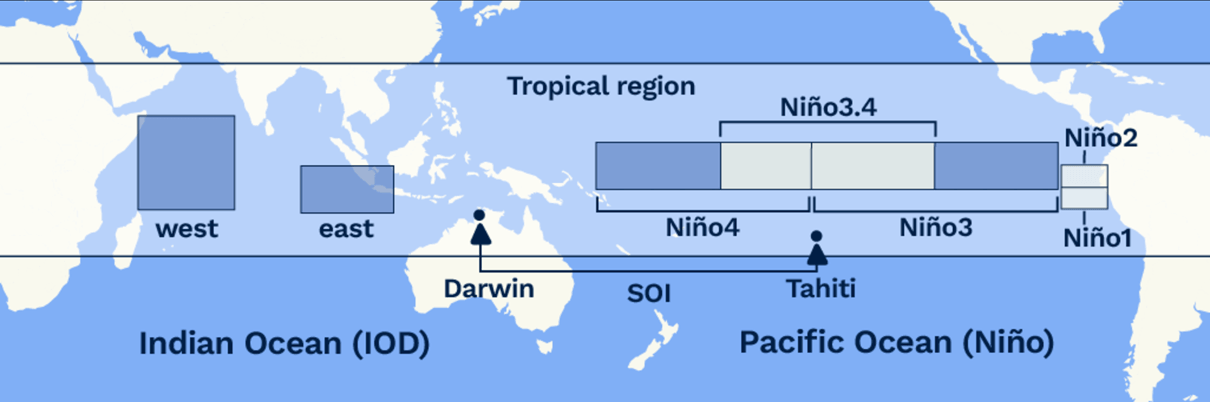
To put it into a broader perspective, you can see in the image below that it sits in the global tropical belt. In the Pacific, you can see the ENSO regions, which are currently in a growing Super El Niño phase. All these areas and anomalies are linked together into the global weather system.
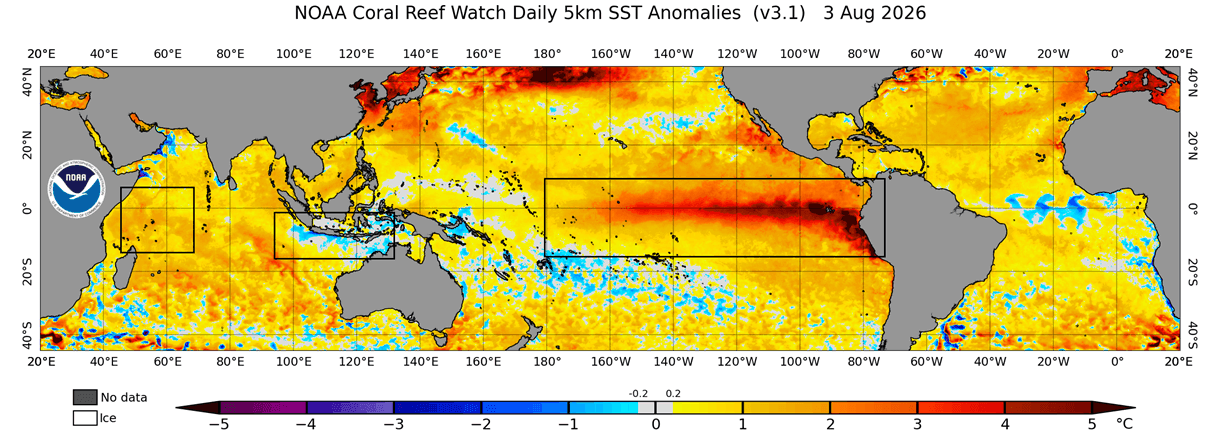
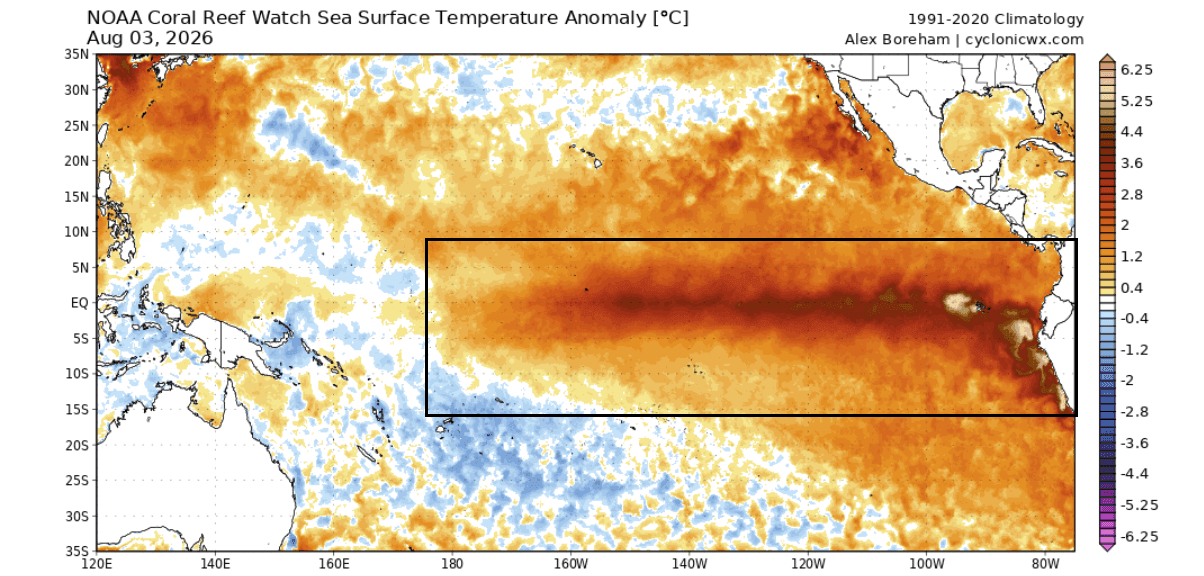
Below is the latest ocean analysis for the same region, which reveals the powerful Super El Niño emerging with +4° anomalies already in the eastern parts. To the west, you can see the two IOD regions, starting to show their difference in temperature trends, just starting the positive phase.
In this way, the IOD and Super El Niño are connected via synchronized tropical wave forcing, through pressure, rain, and trade winds. This allows the anomalies in both oceans to jointly steer the Pacific jet stream.
To summarize, a Super El Niño paired with a positive IOD works as a fully connected, dual-ocean atmospheric system.
Positive IOD Detected: Latest Ocean and Atmospheric Analysis
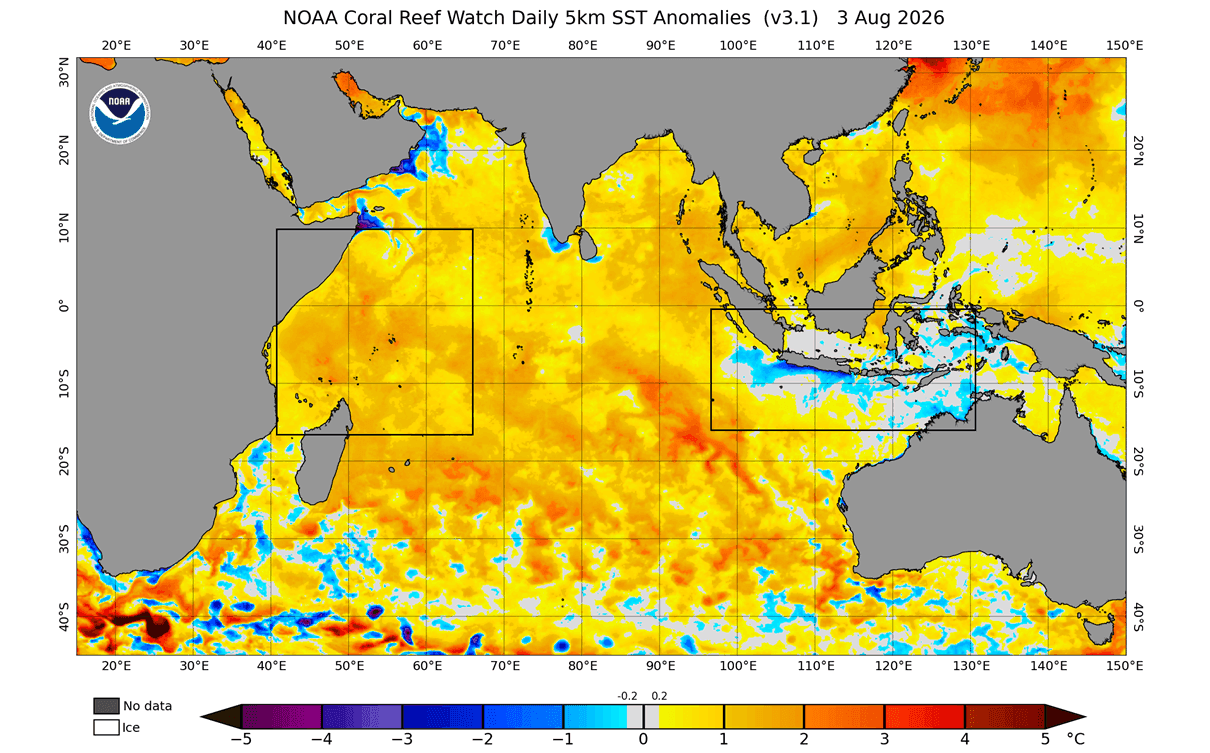
Looking first closer at the IOD region below, you can nicely see the temperature anomaly difference between the eastern and western regions. This is a textbook positive IOD pattern just starting, with the cooling trend in the eastern parts, expected to grow further. Image by NOAA CRW
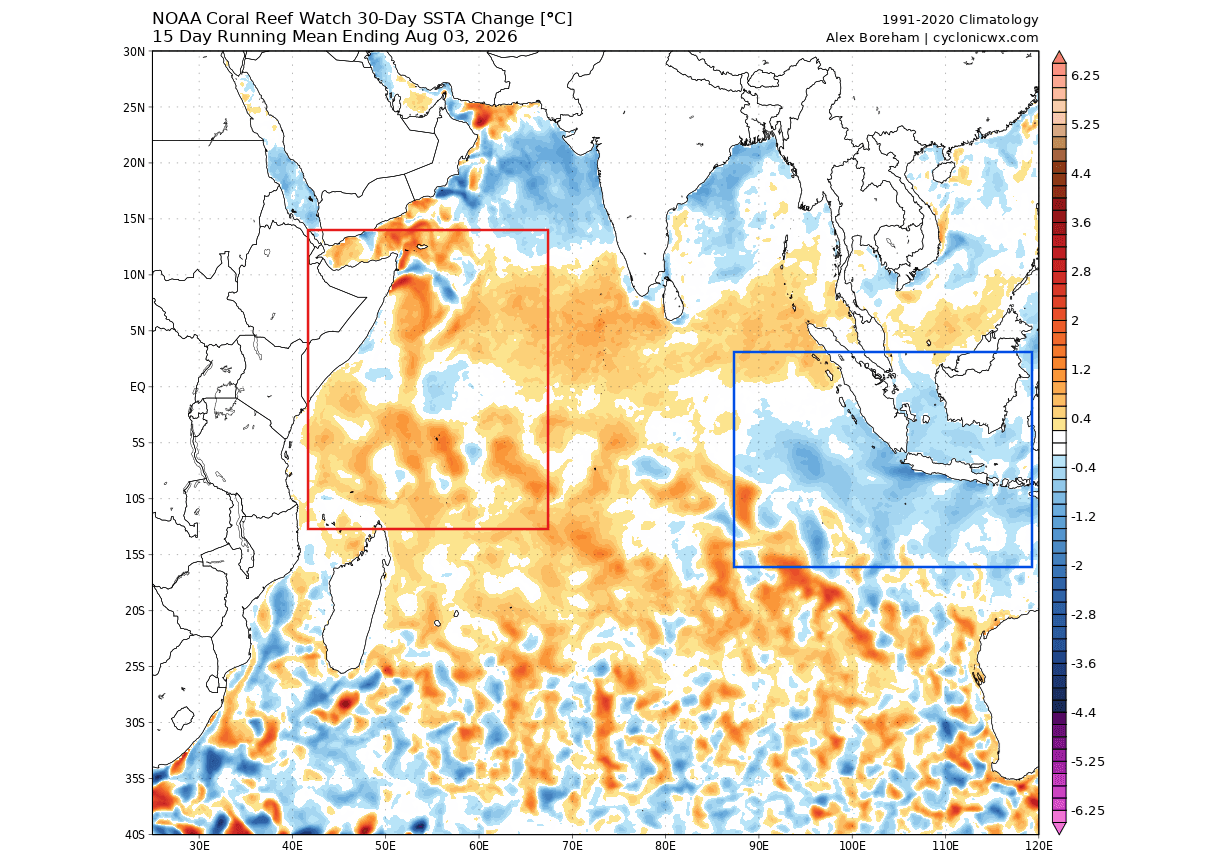
Looking at the 30-day anomaly change across the region, you can properly see the cooling trend of the eastern regions and warming in the west. We are now just entering this positive IOD phase, so the anomaly difference is expected to be more pronounced as we head into Fall.
As mentioned, the tropical trade winds are the driving force behind all these ocean anomalies. They are primarily easterly winds, which cool the ocean surface. But weak trade winds mean less cooling and support a warmup, like in the Pacific El Niño area, which is currently under very weak trade winds.
Below you can see the 30-day zonal wind anomaly in the lower levels of the atmosphere. This nicely shows the weaker trades across the Indian Ocean, which promote warmer oceans in the west, and stronger trade winds in the east, now driving the positive IOD event.
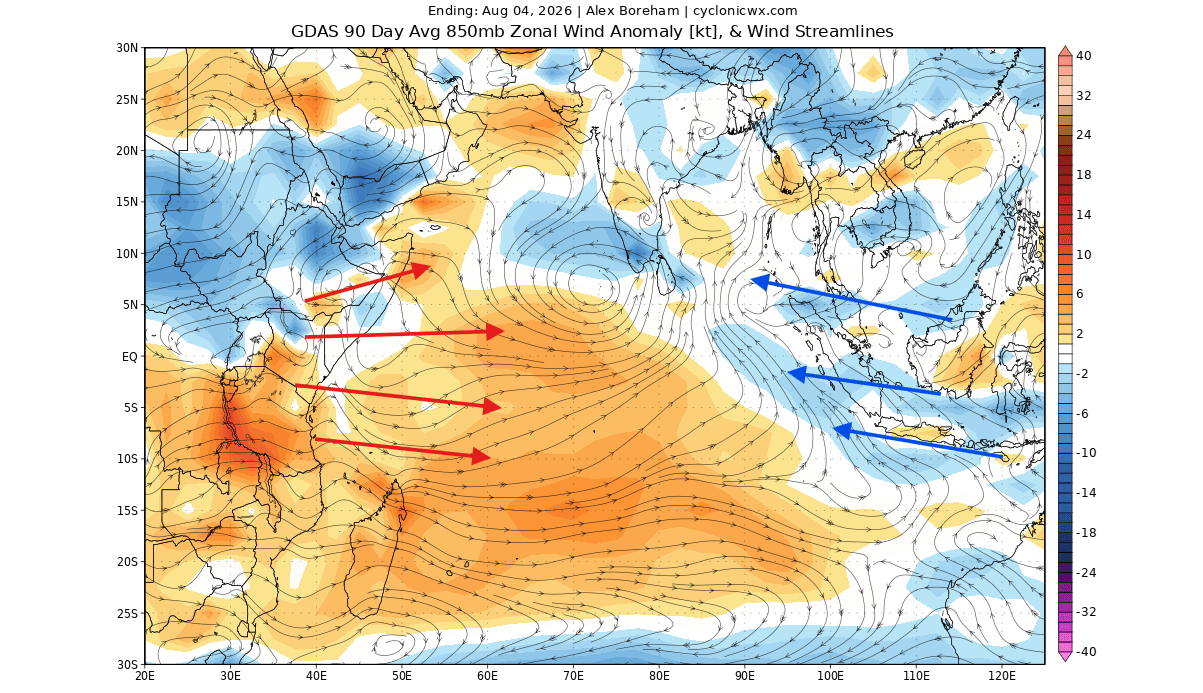
These changes in the trade winds are directly related to the emerging Super El Niño. To create a Pacific warming event of that magnitude, a fundamental shift in pressure and wind patterns is required, also allowing a positive IOD phase to emerge.
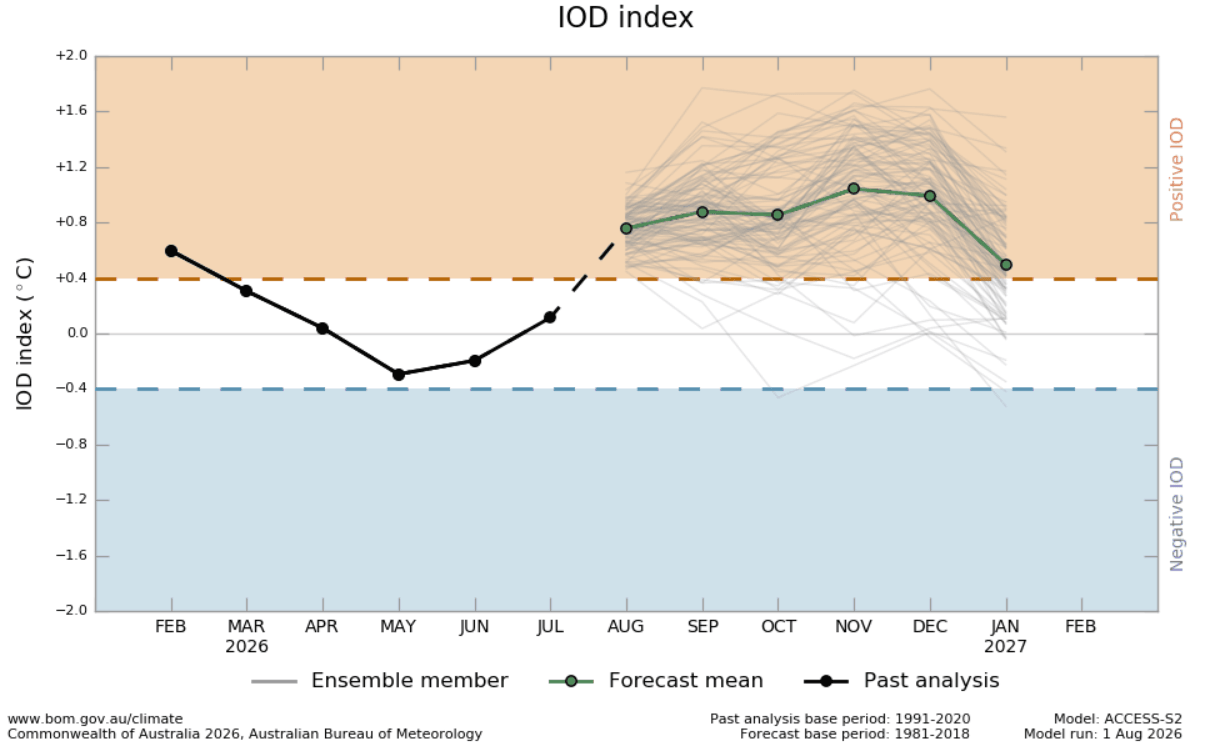
Looking at the latest weekly graph analysis, you can see that the IOD is just starting to rise into the active positive phase threshold. While we can see some brief positive spikes in past months, they are not full power cycles. The last proper positive Fall phase was during the last El Niño event in 2023/2024.
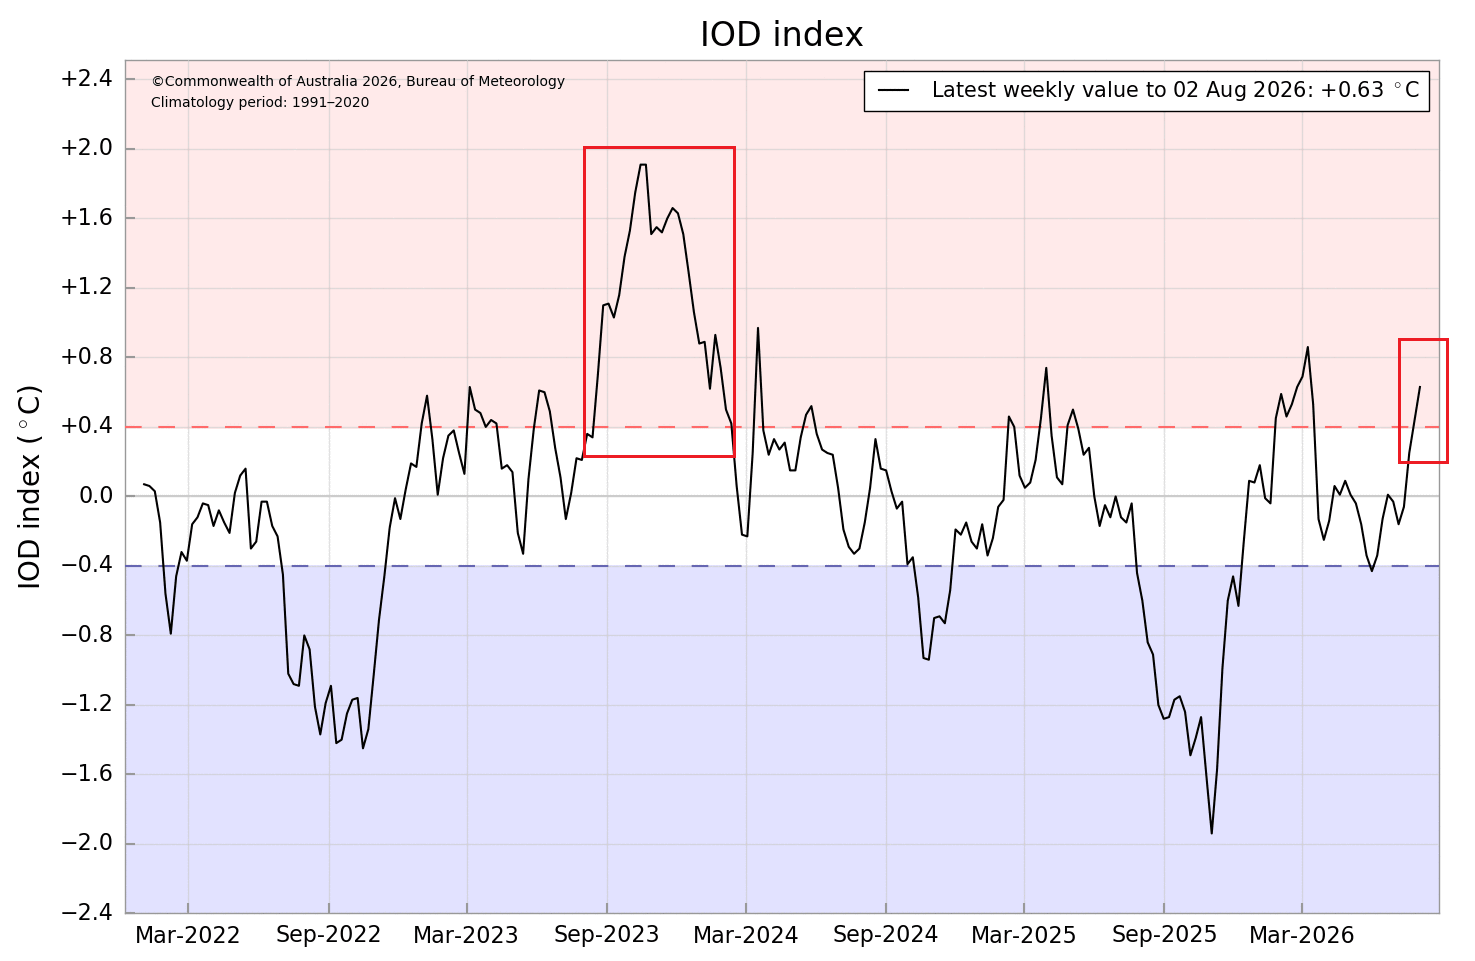
The latest forecasts show this to develop into a sustained positive event, lasting over Fall, and ending in early Winter. This shows that we are not dealing with just another brief spike, but with a proper positive event that qualifies to add its impact to the global circulation.
By far the clearest atmospheric signal can be seen if we look at the ECMWF seasonal precipitation forecast for Fall in the IOD region. Below you can see significantly altered rainfall patterns, with a huge deficit in the eastern parts and very high rainfall in the western warmer parts.
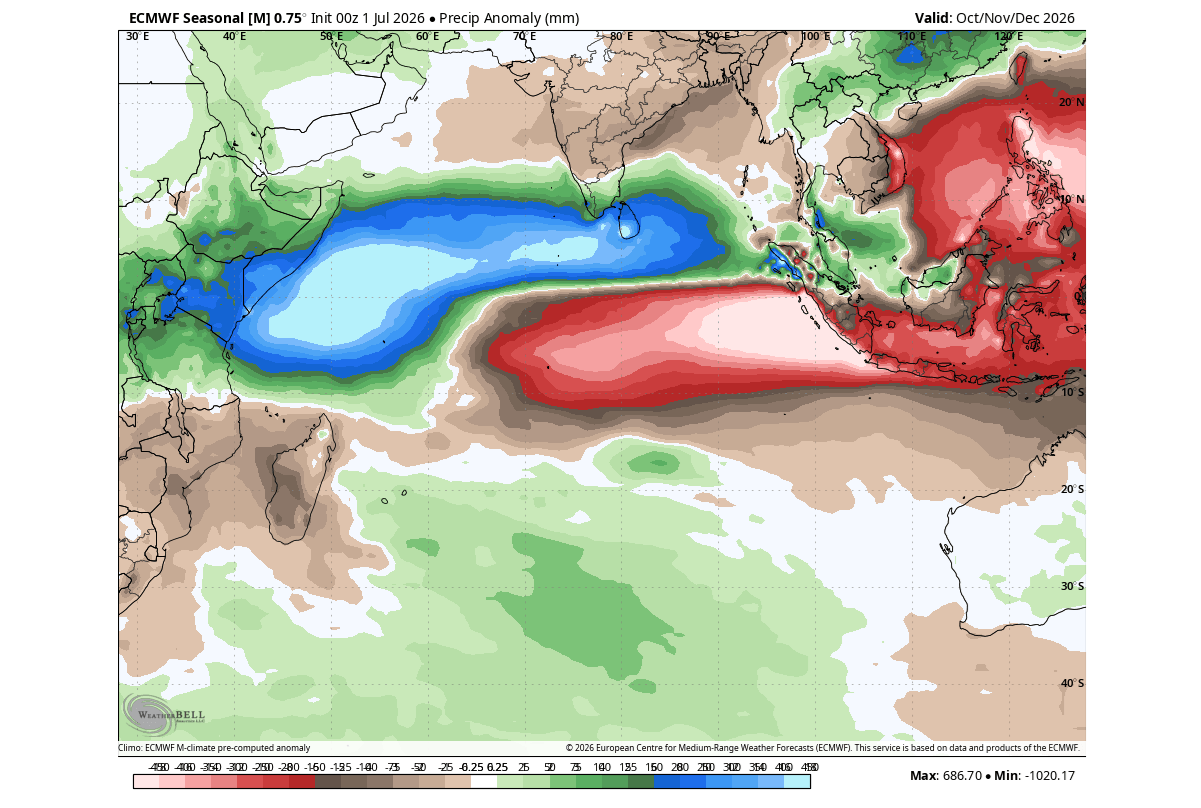
This tells us a lot about the actual atmospheric changes during these oceanic events, which translate from the tropics into global pressure changes. And it is only amplified with a strong Super El Niño developing in the Pacific.
Super El Niño: Pacific Warming Accelerates Into August
A Super El Niño event is currently in rapid development. The available forecast data shows this event peaking as one of the strongest such events in recorded history.
The latest ocean analysis below shows a significant warm anomaly already in the central and east ENSO regions. Peak anomalies reach or exceed +4-5 degrees above normal. This is significant for any El Niño event, but especially when we consider that we have only just entered August, with the peak anomaly still months away.
The true heart and engine of this Super El Niño event is hidden below the ocean surface. Below you can see the subsurface temperature anomaly across the tropical Pacific in the top 500m (1640ft) of the ocean. This reveals the deep core of this Super El Niño event: a strong, warm anomaly that is now peaking over 8 degrees above normal.
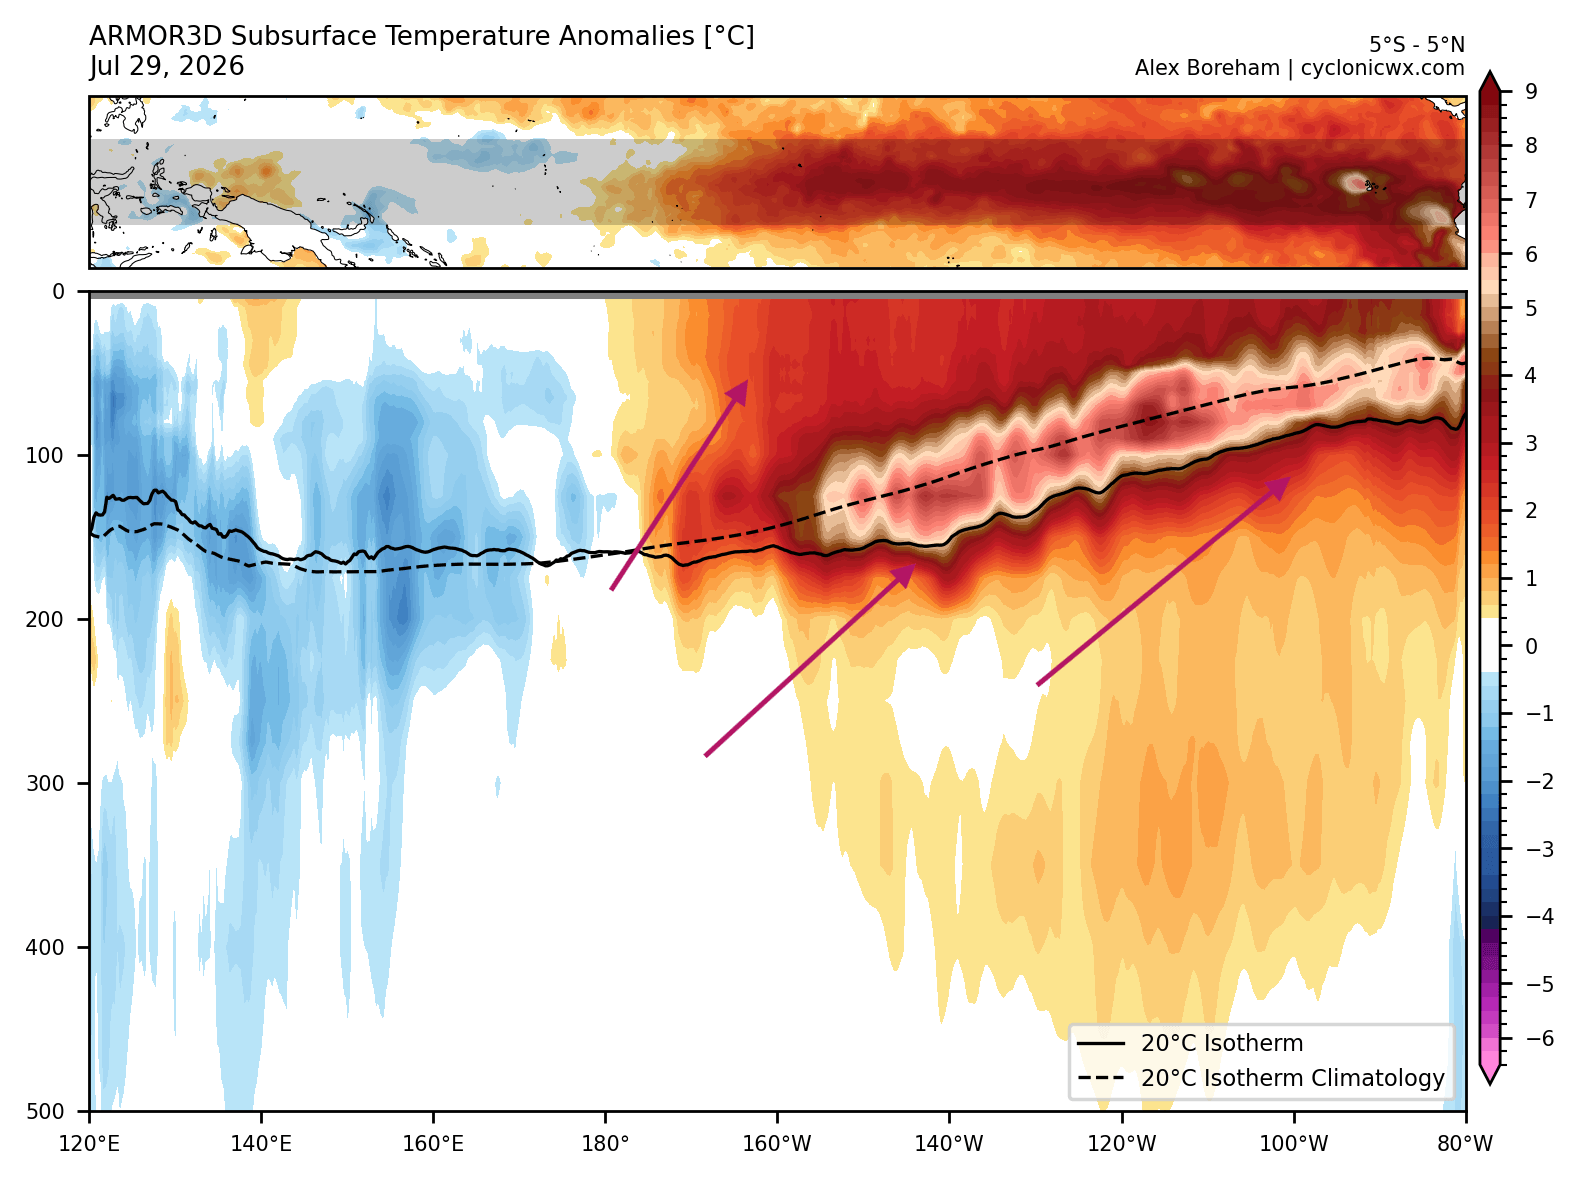
This is called a Kelvin Wave, created and maintained by the strong tropical westerly winds, which push it to the eastern tropical Pacific. There, it begins to rise and manifest on the surface as the Super El Niño event that we see on the ocean maps.
I produced a video below that shows the development of subsurface temperature anomalies in the past week under the ENSO region. It shows clear movement and growth of this large Kelvin Wave and its eventual rise as a Super El Niño.
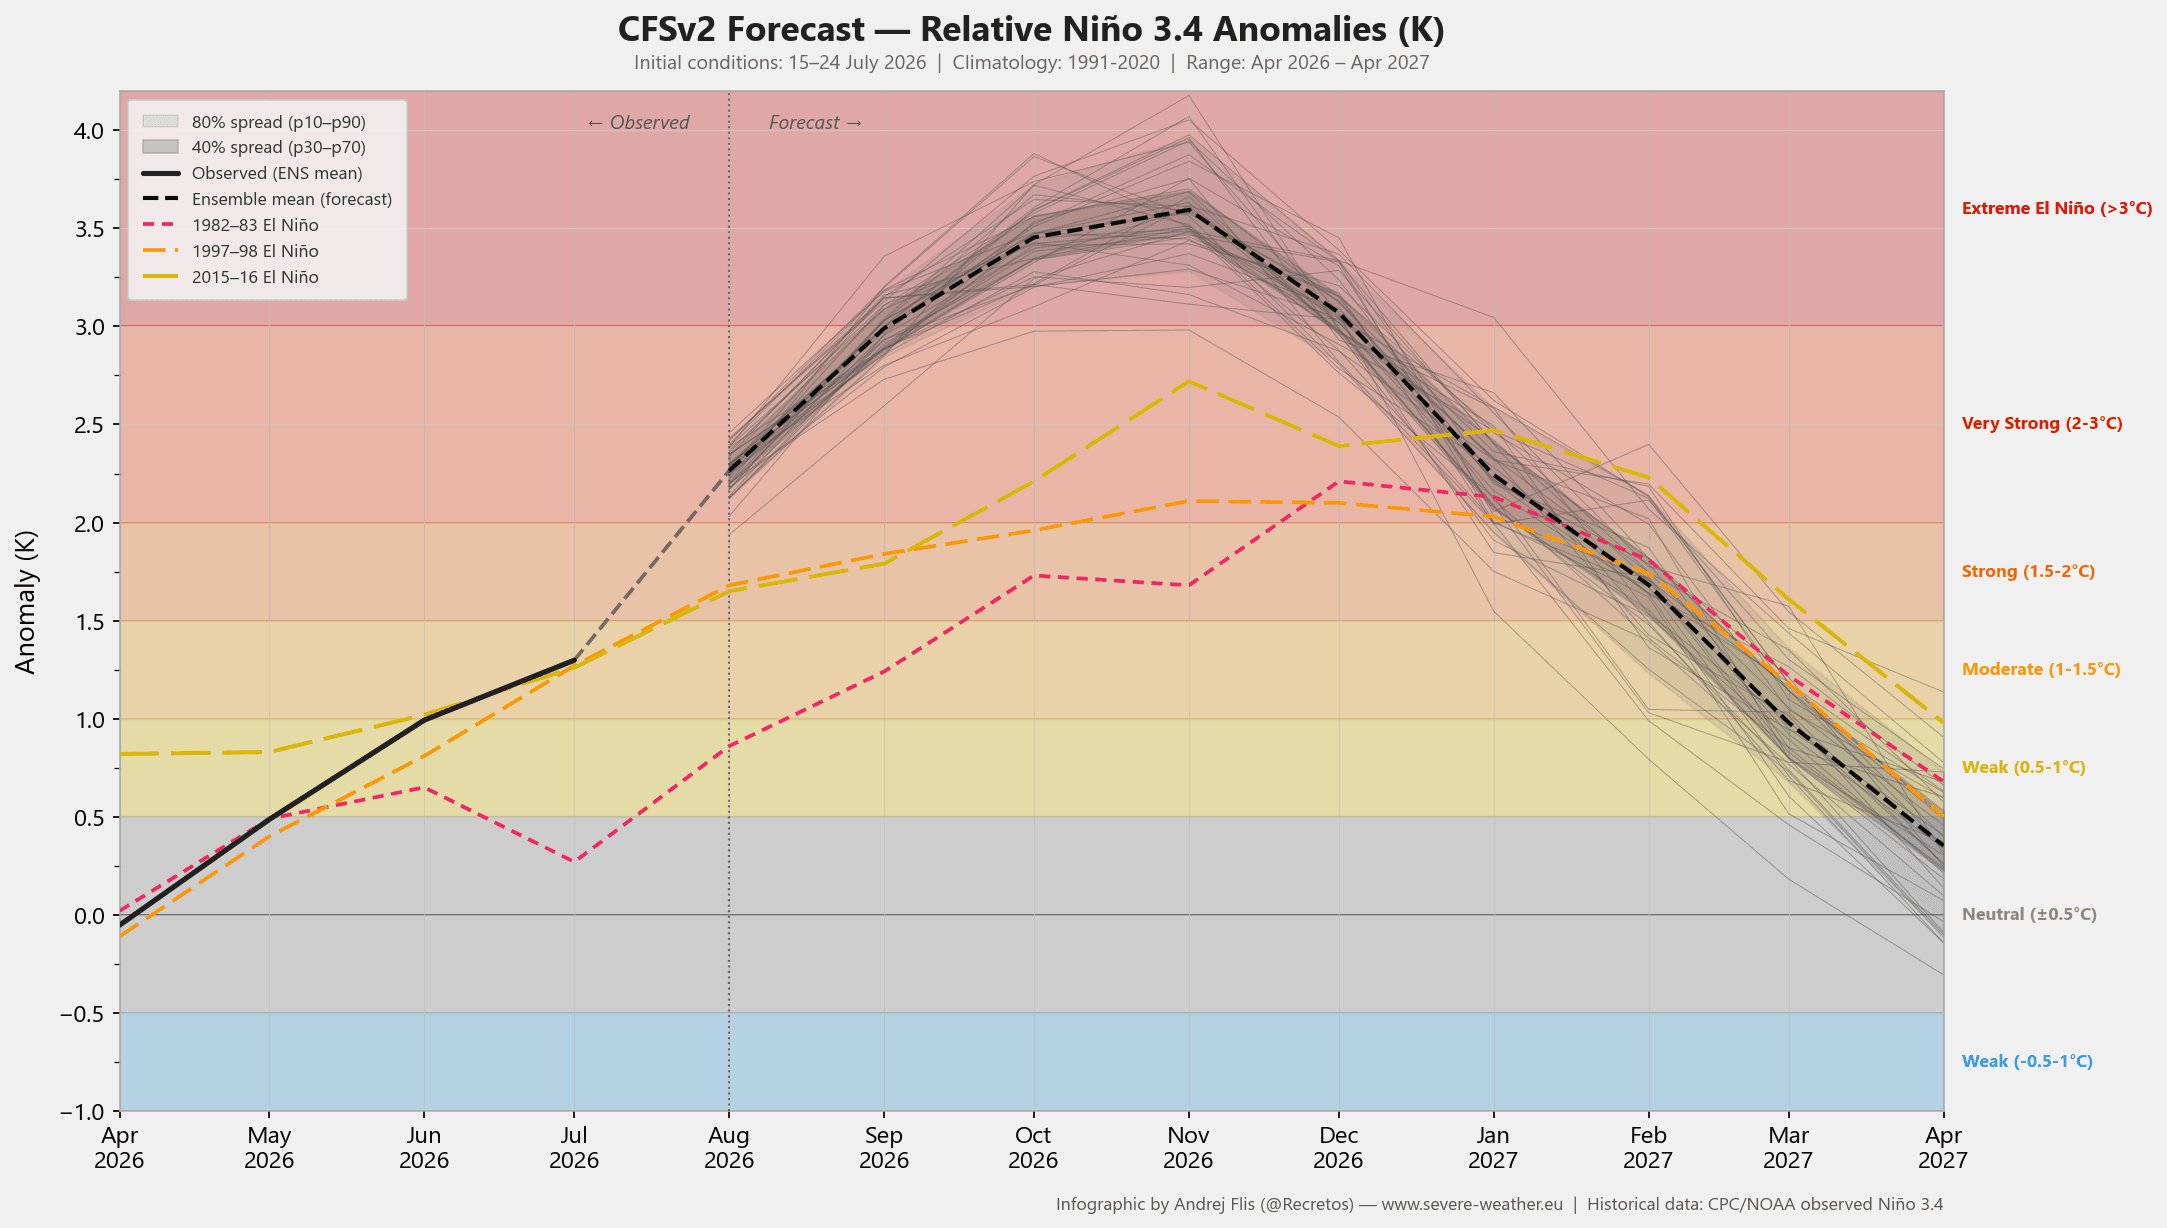
In the image below, you can see the NCEP CFSv2 model forecast, which shows the fully released Kelvin Wave. The El Niño is forecast to reach extreme levels, easily surpassing the Super El Niño threshold (+2 degrees), and exceeding a +3 degree anomaly. If verified (even close), we will witness one of the strongest El Niño events on record.
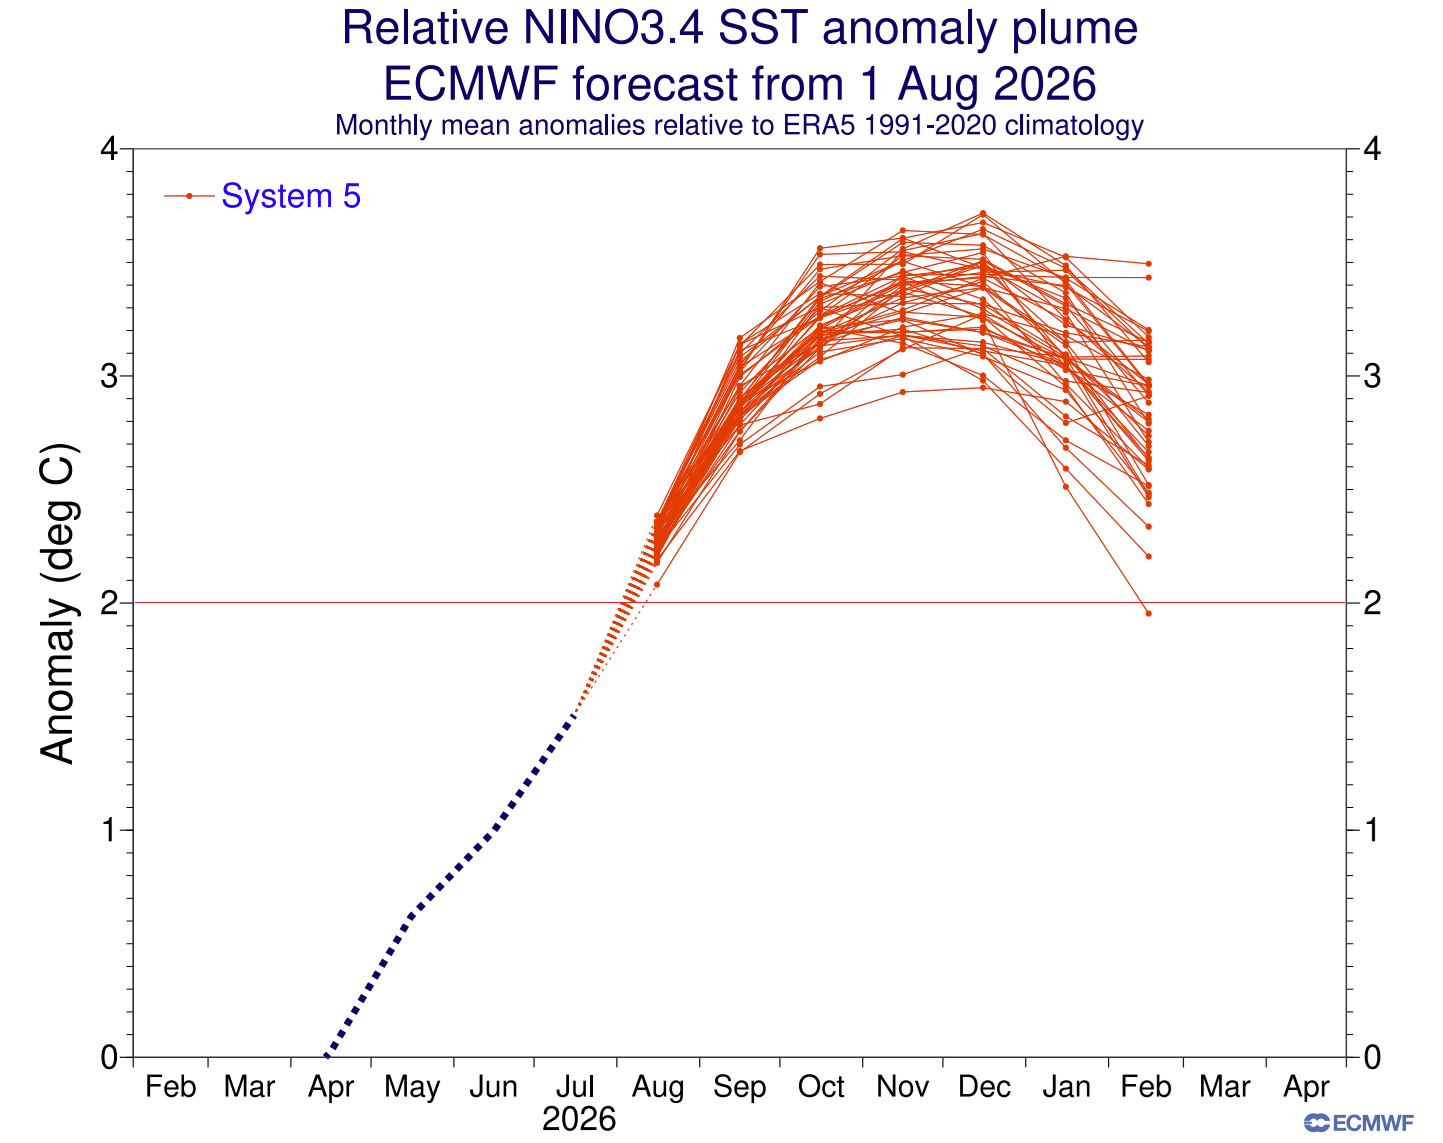
This is also shown by the well-regarded ECMWF seasonal forecast, in all its recent El Niño forecasts. Below is the latest one, released this week, and it is the strongest so far, peaking well over the extreme +3 threshold, making this an exceptional climate event of the current time.
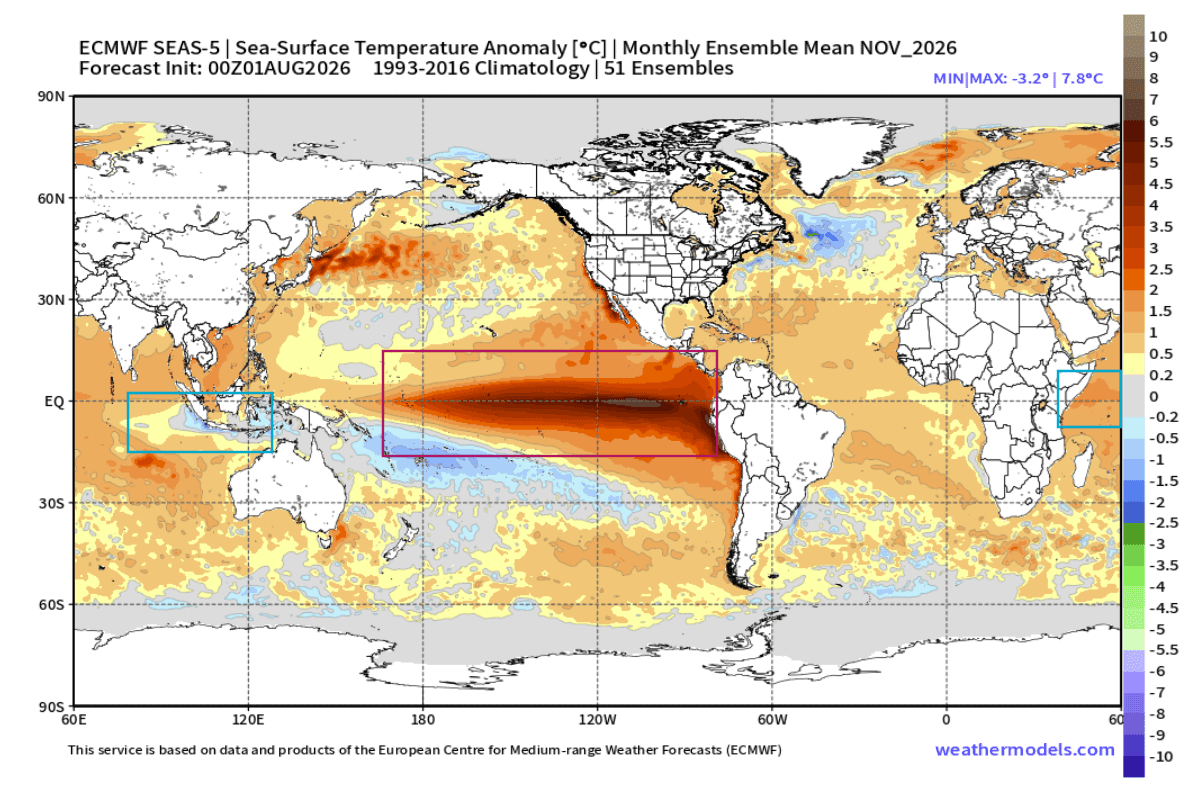
In the global view, the new long-range forecasts really show an exceptionally strong event, without exaggeration, as the multi-model data all show a strong Super event. Below is the new ECMWF ocean anomaly forecast, which shows the large El Niño event, peaking over 6 degrees above normal, and you can also see the two anomaly areas of the positive IOD event.
The real impact is perhaps a bit more hidden in the atmosphere. But if we look at the atmospheric motion, it can reveal the true impact already present in the atmosphere.
Below is the ECMWF ensemble analysis and forecast of atmospheric motion, with green colors for rising air and brown for sinking air. It reveals a large persistent area of rising air over the tropical Pacific, and a strong area of sinking air over the Indian Ocean, a typical Super El Niño atmospheric footprint.
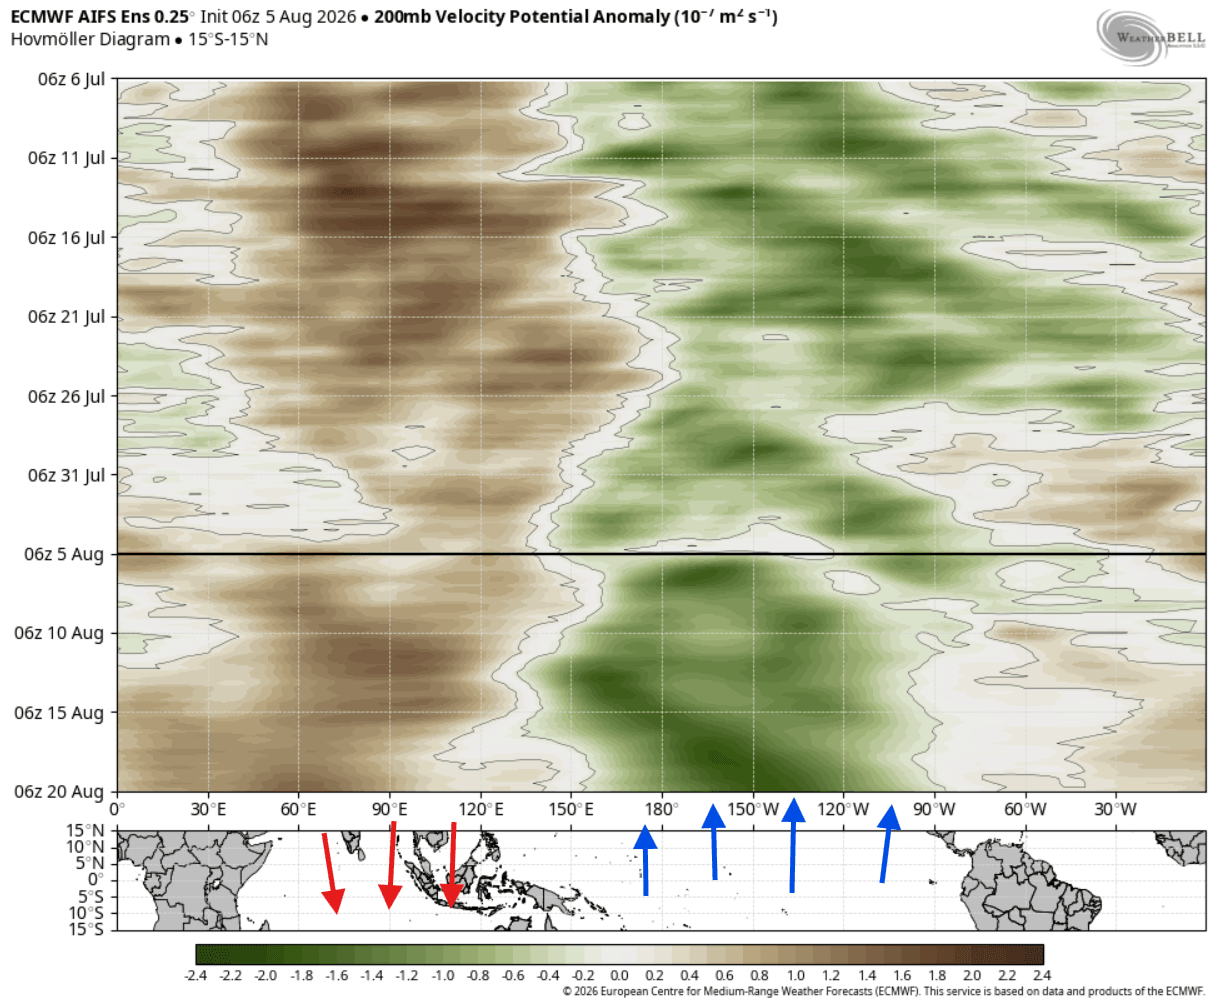
This is known as the atmospheric standing wave, and shows the El Niño lock on the atmosphere. It is also a key to how both the IOD and the Super El Niño will work together as a synchronized atmospheric engine for seasonal weather.
Dual-Ocean Forcing: A Global Seasonal Weather Engine
The global atmosphere is in a constant state of motion. And when strong ocean anomalies emerge, they alter the heat and energy distribution from the tropics to the poles, creating distinct circulation patterns, or “engines”. This is why we often hear the term “winter driver” for a certain event/anomaly like El Niño.
The schematic below from a recent study (link down below) shows how the El Niño and Indian Ocean Dipole connect across the tropics. With strong rising air in both the central Pacific and Indian Ocean, they launch atmospheric wave trains that directly alter the jet stream across the United States and Canada heading into winter.
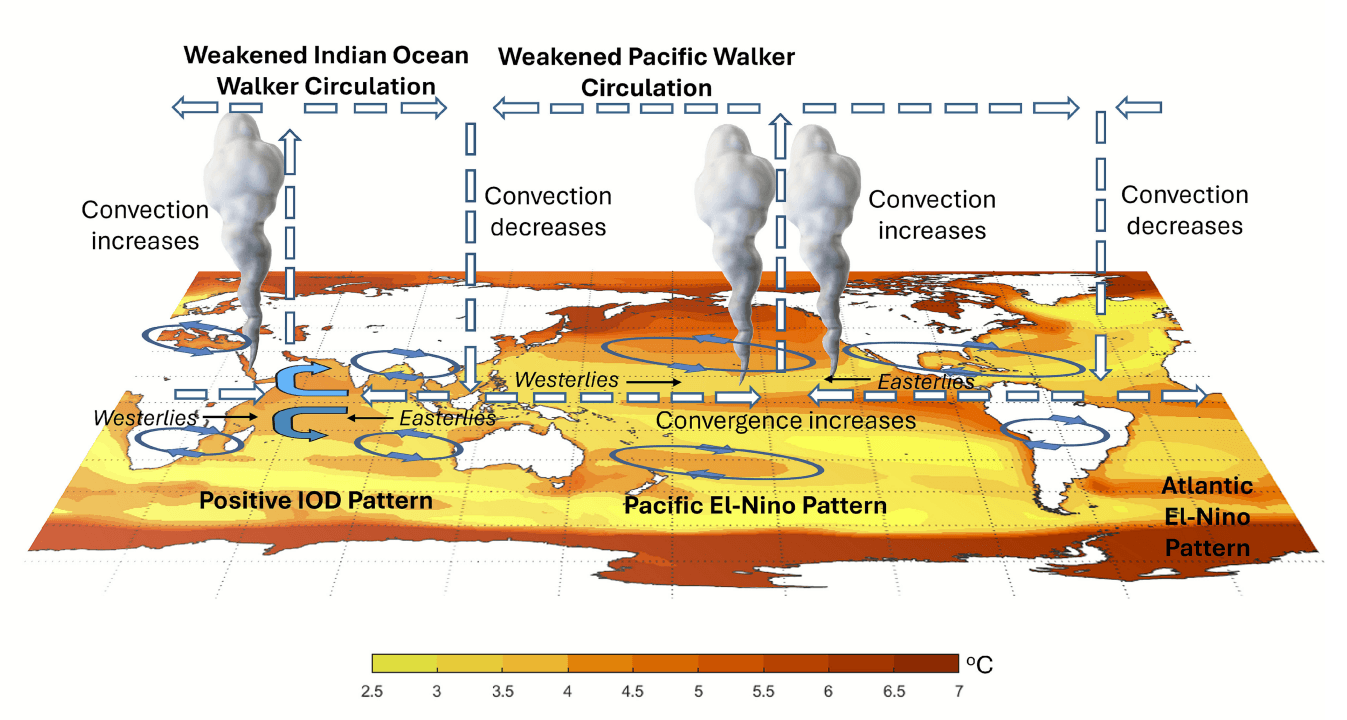
At the same time, dry sinking air is anchored over Indonesia, locking this atmospheric engine into place. This powerful tropical setup reshapes jet stream behavior on a global scale, shifting storm tracks far beyond North America, also driving broad hemispheric impacts throughout the winter season.
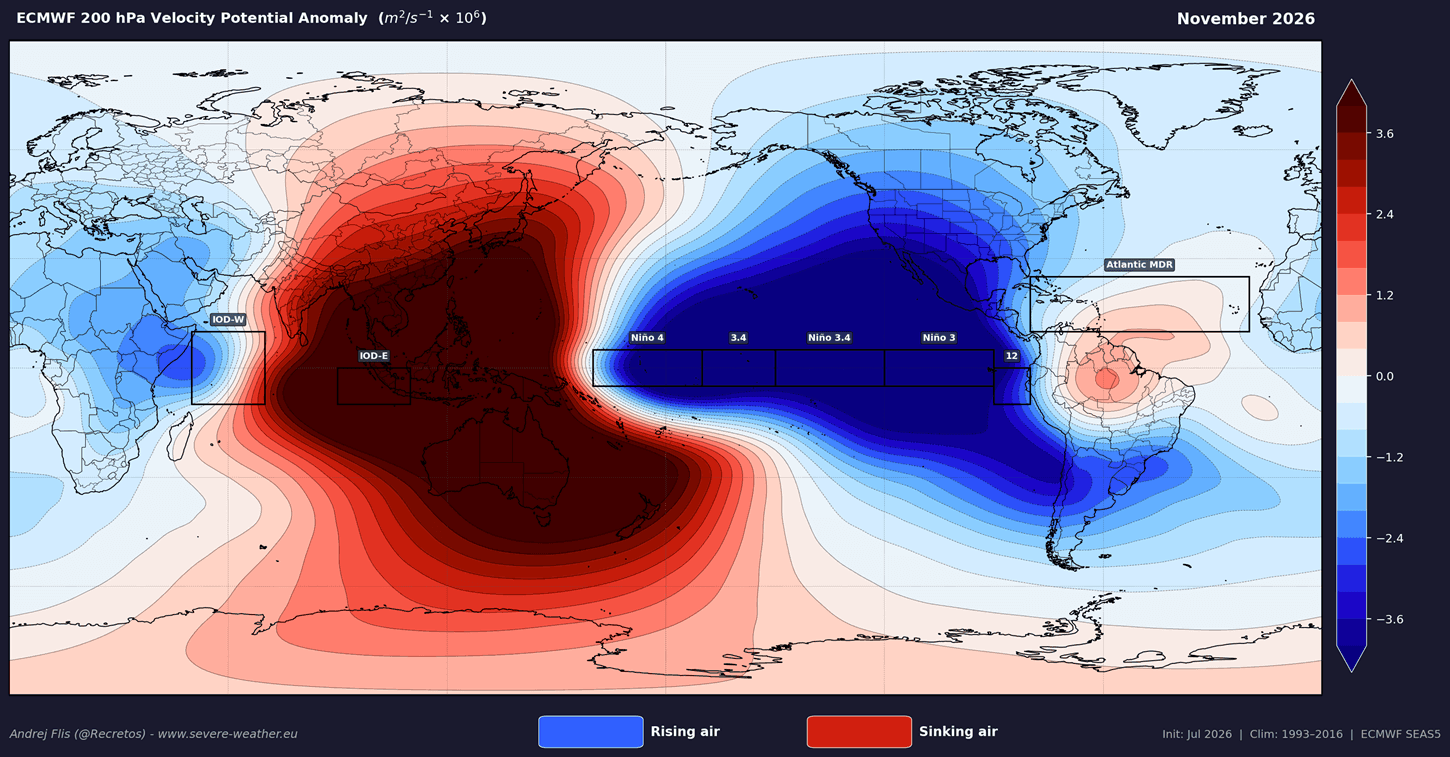
Looking below at the ECMWF circulation forecast for November, we can see exactly this pattern. A strong anomaly of rising air over the Pacific, sinking in the Indian Ocean, and rising air again in the west IOD region. This is probably the most textbook example of the El Niño and IOD pairing, confirming the development of their combined tropical forcing.
As we go into early winter, this really grips onto the weather patterns. Below is another research map for early winter pressure patterns and storm tracks across the Northern Hemisphere. On its own, a standalone Indian Ocean Dipole creates only a minor ripple in the jet stream. But when paired with a Super El Niño, the two tropical ocean drivers create a more aggressive wave pattern around the globe.
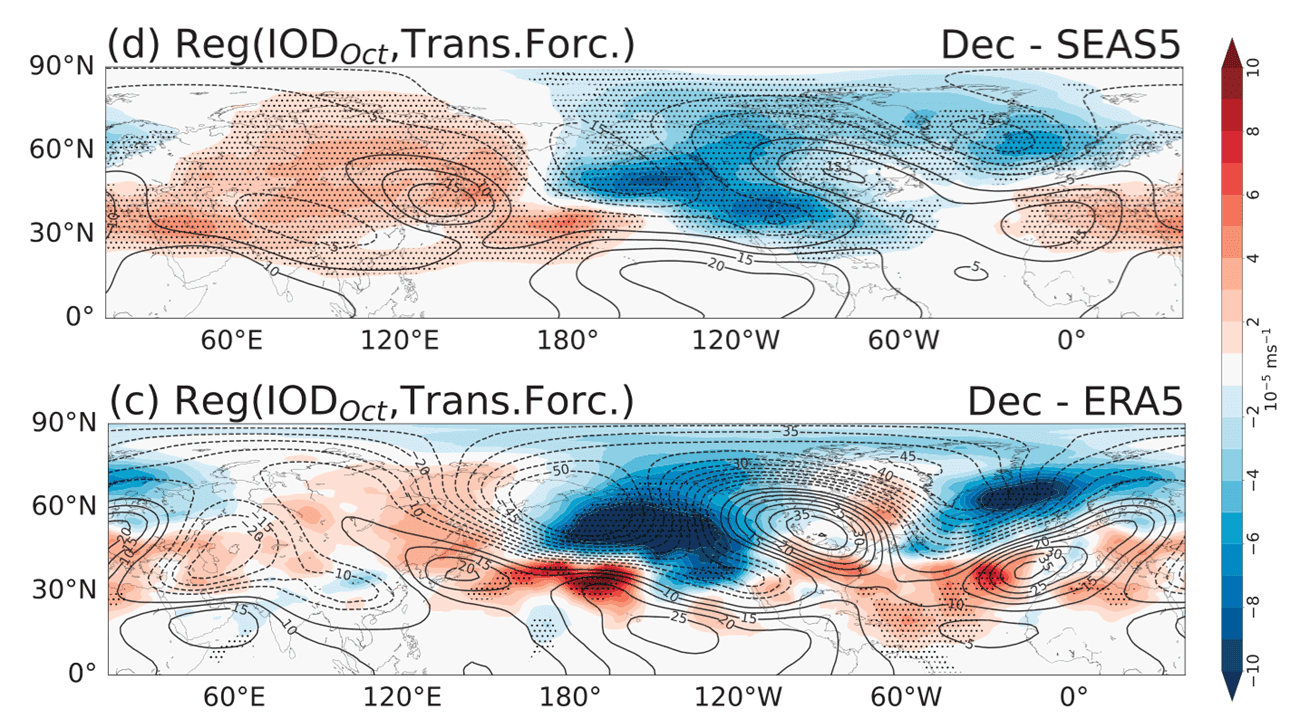
This combined setup fuels daily winter storm tracks over the Pacific, driving a deep low-pressure zone across Canada and the U.S. Notice how the real-world data (bottom) is much stronger than the computer model (above). In simple terms, actual winter storms feed on this tropical energy far more aggressively than models predict, locking in major jet stream shifts much faster as winter begins.
The study also highlights a strong downstream connection to Europe. As this atmospheric wave train crosses North America, the enhanced storm tracks push low-pressure anomalies into the North Atlantic, favoring a more westerly pattern for the continent.
The schematic below (study linked below) shows how combined tropical forcing creates a planetary wave train in upper levels as winter begins. Heavy convection over the Indian Ocean, combined with energy released from El Niño, creates an atmospheric domino effect that spreads across the entire Northern Hemisphere by December.
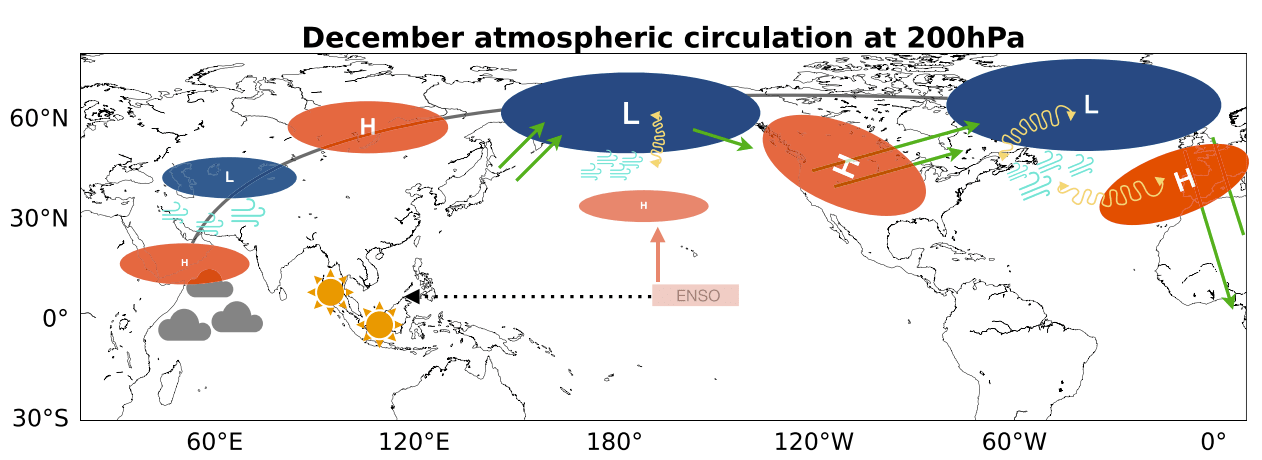
This pressure wave train acts like a giant atmospheric highway, creating a repeating chain of high and low-pressure systems around the globe. The result is a deep low-pressure trough over the North Pacific, forcing a strong ridge over Canada and driving another low-pressure zone over the southern U.S. and the North Atlantic.
With this much excess energy, it also means that the long-range trends are easier to predict. We can use this information and look at the latest early winter trends and the amplification deeper into winter, including snowfall.
New Winter 2026/2027 Forecast: Split-Flow Pattern Across North America
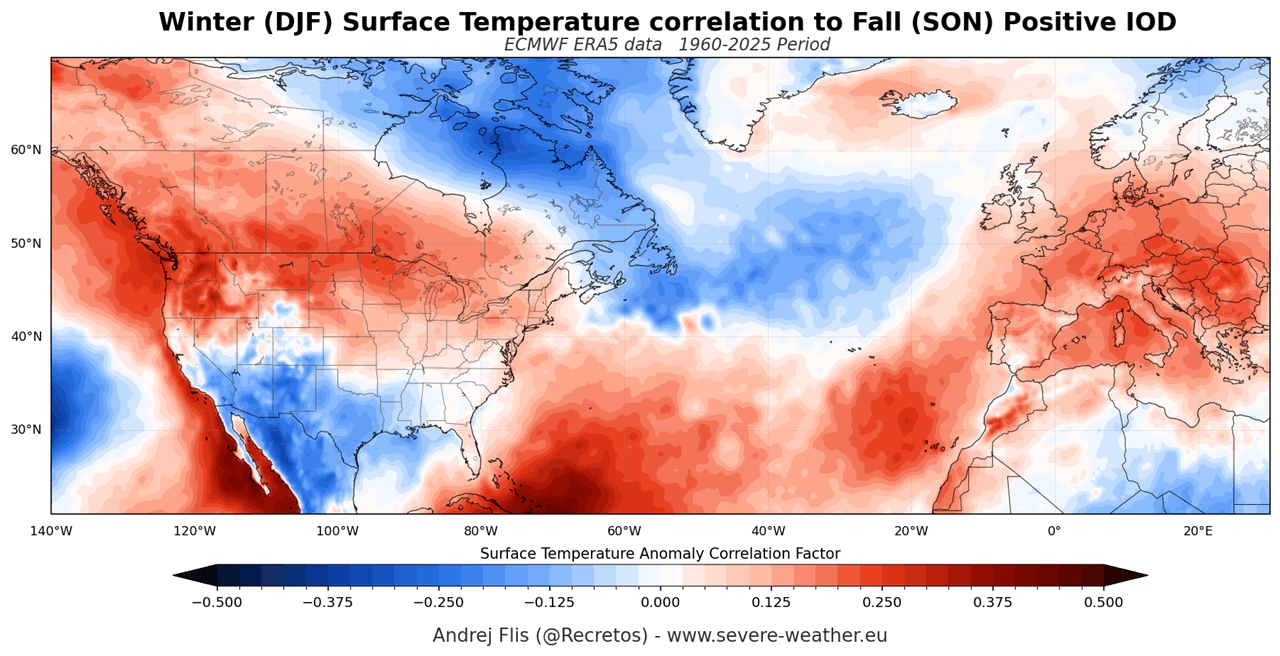
Looking back at 65 years of climate data shows a clear historical Winter signal following a positive Indian Ocean Dipole. This shows the pressure layout that historically takes shape across North America and Europe. This also shows a known El Niño signal, since the positive IOD so often forms during an El Niño event.
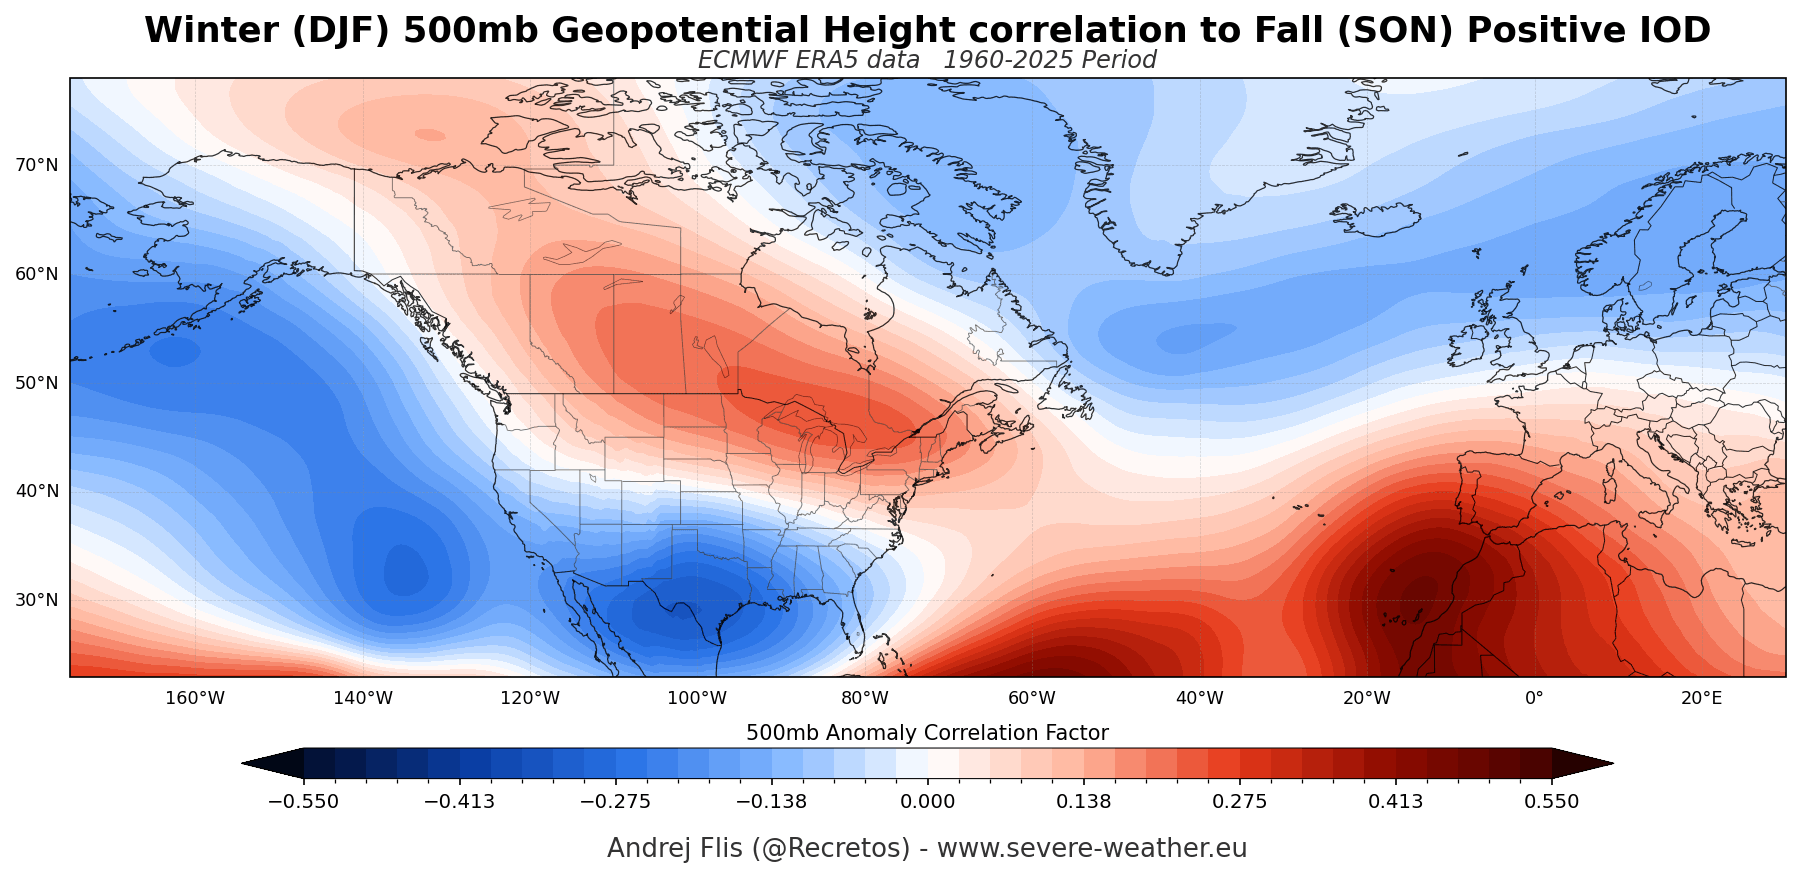
The image above shows a classic El Niño winter setup, featuring strong high pressure (red) static over Canada and lower pressure (blue) across the southern United States. High pressure dominates southern Europe and the Mediterranean, proving that a positive IOD leaves a long-lasting impact on winter weather patterns across the Northern Hemisphere.
The temperature analysis also shows a more El Niño-type pattern with a continental split-flow. Below-normal temperatures are over the southern and southeastern United States, under the Pacific jet stream. An above-normal temperature signal is shown over the northern U.S., Canada, and Europe.
Now we shift to actual forecast data. Below is the very latest ECMWF pressure anomaly forecast, released this week. This is the early winter forecast for December, and it clearly shows the tropical atmospheric engine in full force, given the pressure patterns we analyzed above.
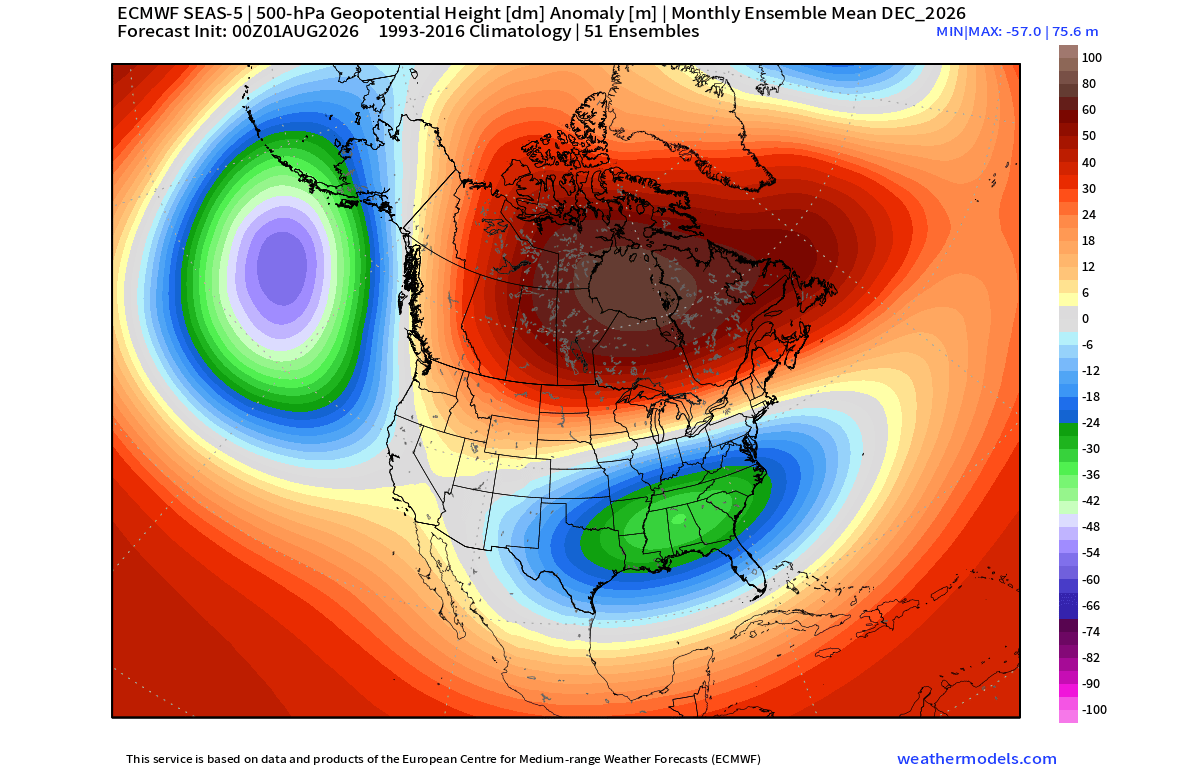
For December, ECMWF shows a high-amplitude pressure pattern across North America, with a large blocking high over Canada and a deep, energetic low-pressure zone from the North Pacific straight across the southern and eastern United States.
Such a pressure pattern translates into a sharp temperature split across the United States at the start of the winter season. Under the high-pressure zone, mild and above-normal temperatures are forecast over Canada, the northern and western United States, and the Northeast.
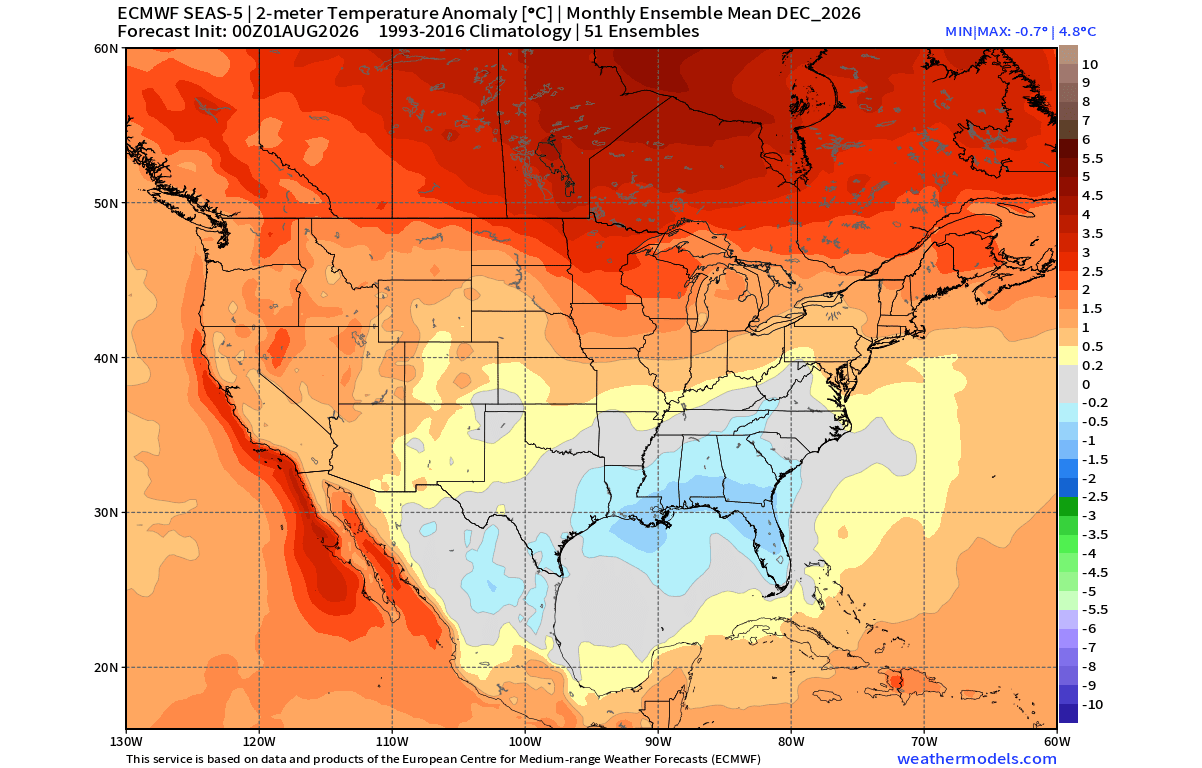
Meanwhile, the deep southern low-pressure systems open the door for cooler-than-normal temperatures across Texas, the Gulf Coast, and the Southeast. This is driven by an active southern storm track that brings persistent cloud cover and rain.
As we move into late winter, the ECMWF forecast shows the pressure pattern not only holding but further intensifying, just as research above suggested. The February forecast below shows a much deeper pressure wave over the United States for mid-late Winter. This locks the continent into a high-impact, Super El Niño setup.
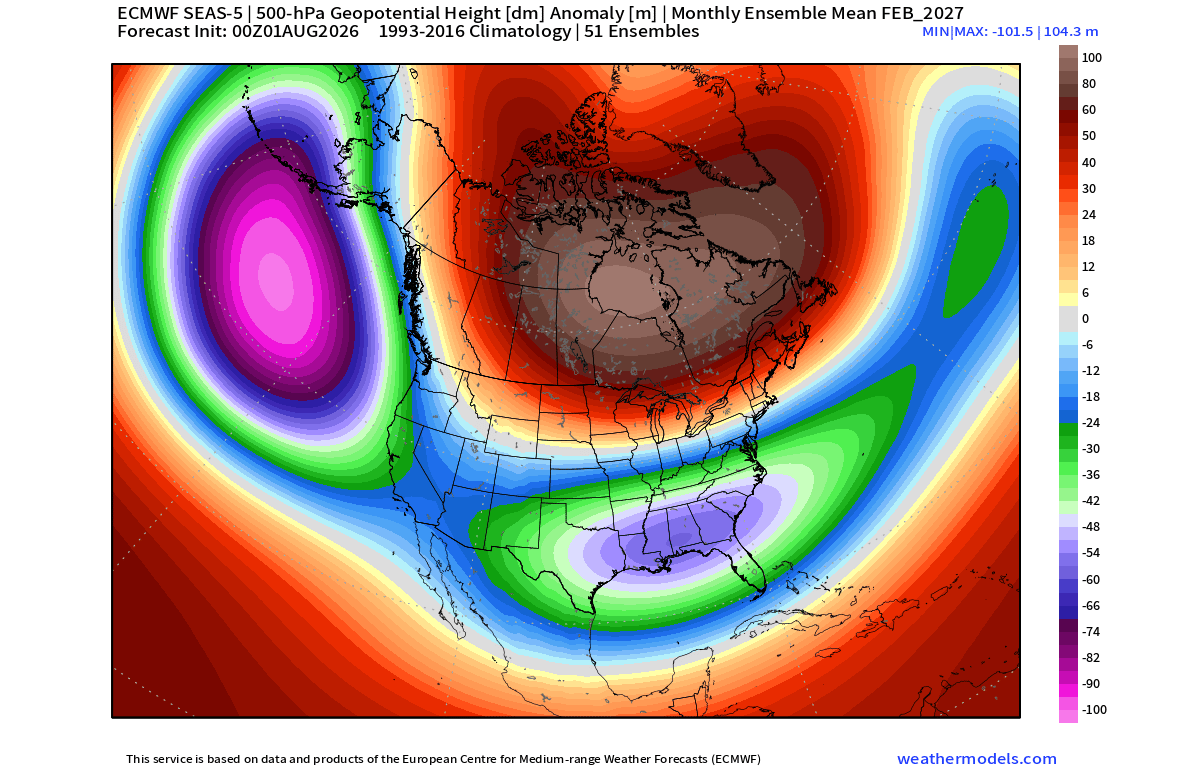
This northern blocking acts like a boulder in a stream, forcing a deep, highly active low-pressure zone from the Pacific straight through the central, southern, and eastern United States. For the southern half of the U.S., this signals a stormy, active, and potentially colder-than-normal finish to the winter season.
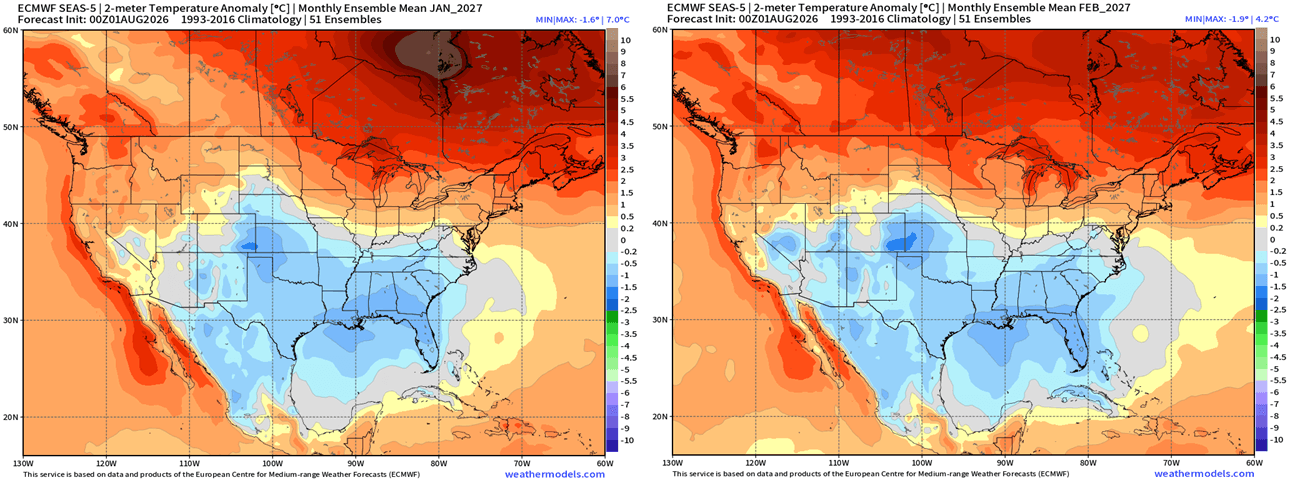
The ECMWF temperature forecast for January and February shows a continental split-flow across North America. At peak winter, the model keeps Canada and the northern U.S. under mild, above-normal temperatures, with a broad zone of below-normal temperatures across the southern half of the United States.
Touching on the snowfall potential, this pressure and jet stream alignment creates a distinct divide across North America. When an active southern storm track overlaps periodic cold air drops from Canada, it shifts the primary winter storm corridor farther south than usual.
This can reduce the snow totals across the Northern United States and southern Canada, while boosting snow opportunities across the Central and Eastern United States. I loaded and plotted the latest ECMWF snowfall data below, and its forecast shows exactly what the pressure pattern and tropical forcing suggested.
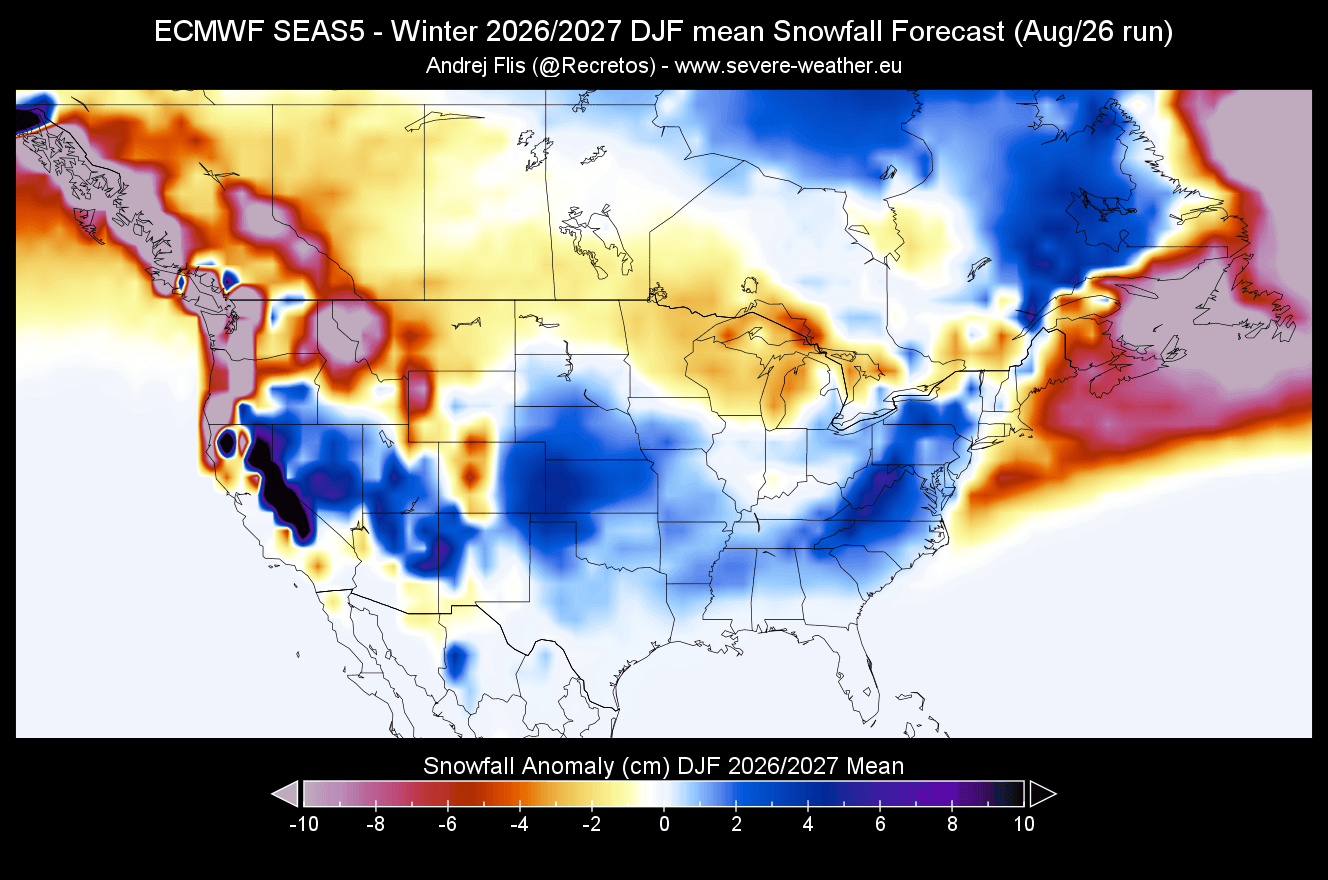
Higher snowfall potential is forecast across the Southwestern and Southeastern U.S., the Central Plains, parts of the Midwest, East, and into the Mid-Atlantic. In these regions, a steady surge of Pacific moisture can meet periodic cold air drops from the north, creating more frequent opportunities for winter storms throughout the season.
Areas across Canada, the Pacific Northwest, and the northern Great Lakes show below-average snowfall anomalies, driven by warmer temperatures and a northern ridge that keeps polar air from settling into higher latitudes.
The overall precipitation forecast shows a classic, active El Niño storm track over Winter, with an amplified Pacific jet stream across the United States. This creates a stronger moisture flow, bringing above-normal precipitation to the southern United States, stretching from California and the Southwest straight across Texas, the Gulf Coast, and up the East Coast and eastern Canada.
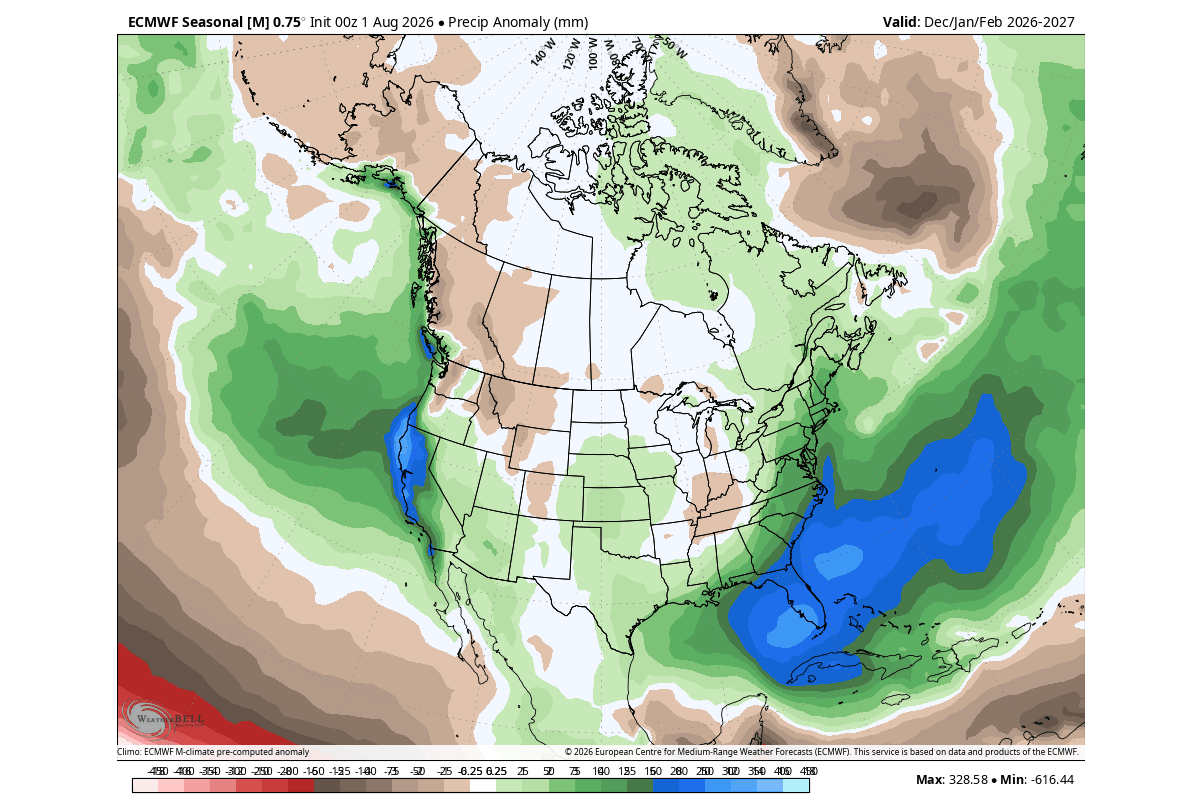
Where this heavy moisture track intersects cold air, the setup significantly elevates the potential for major winter storms, ice events, and heavy snowfall from elevations to the Southern Plains and Mid-Atlantic into the interior Northeast. But it does rely on a proper supply of cold air, which depends on several factors.
Europe Winter Trends: Westerly Flow and a Milder Pattern
Europe is usually not the first in a direct impact line from the tropics. But in a season with a Super El Niño paired with a positive IOD, the research above already showed an amplified low-pressure pattern over the North Atlantic or northwestern Europe.
Below is the very latest early and mid-winter pattern forecast for Europe, by ECMWF. It shows an almost exact pattern as suggested by the research above, with a high-pressure ridge from the south and a low-pressure area over the northwestern and northern parts.
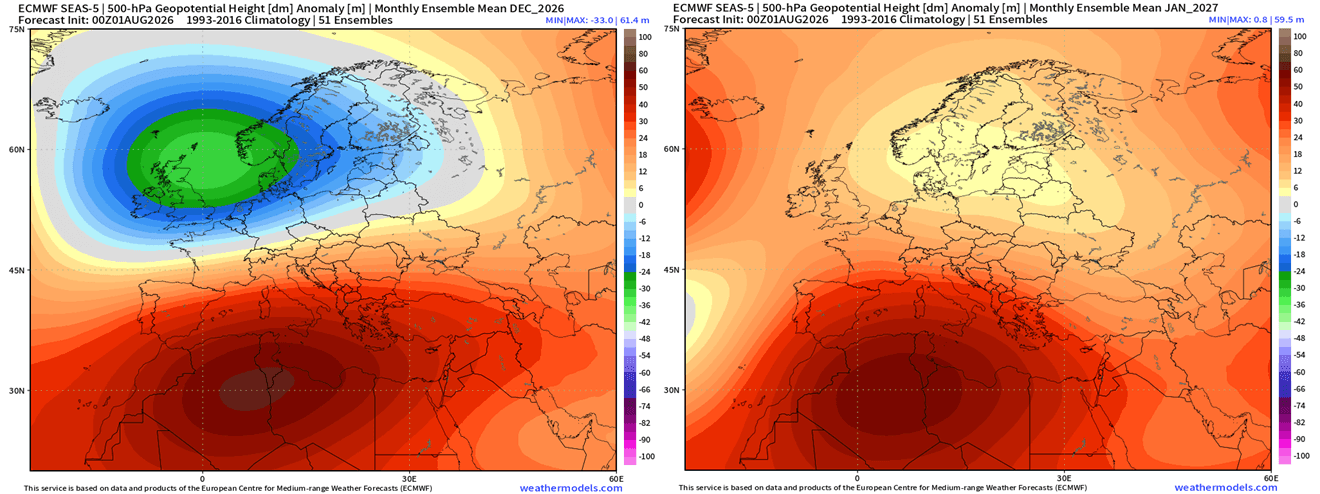
This creates a strong pressure difference from north to south, which is a powerful boost for the westerly flow into Europe from the Atlantic.
This is reflected in the latest December-February temperature forecast, where the ECMWF shows mostly above-normal temperatures in the winter season. This is due to the dominant westerly mild flow. But this still allows some northerly flow into the UK and Ireland, as low-pressure areas move to the northeast periodically.
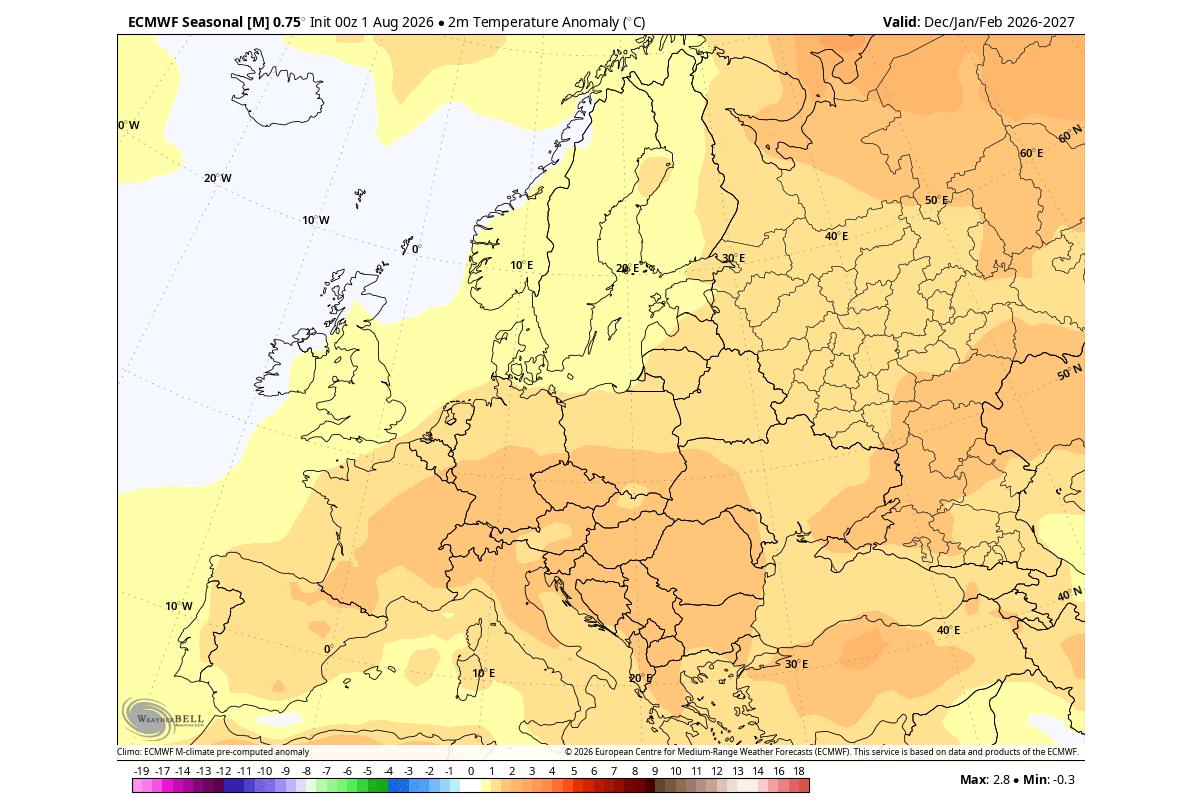
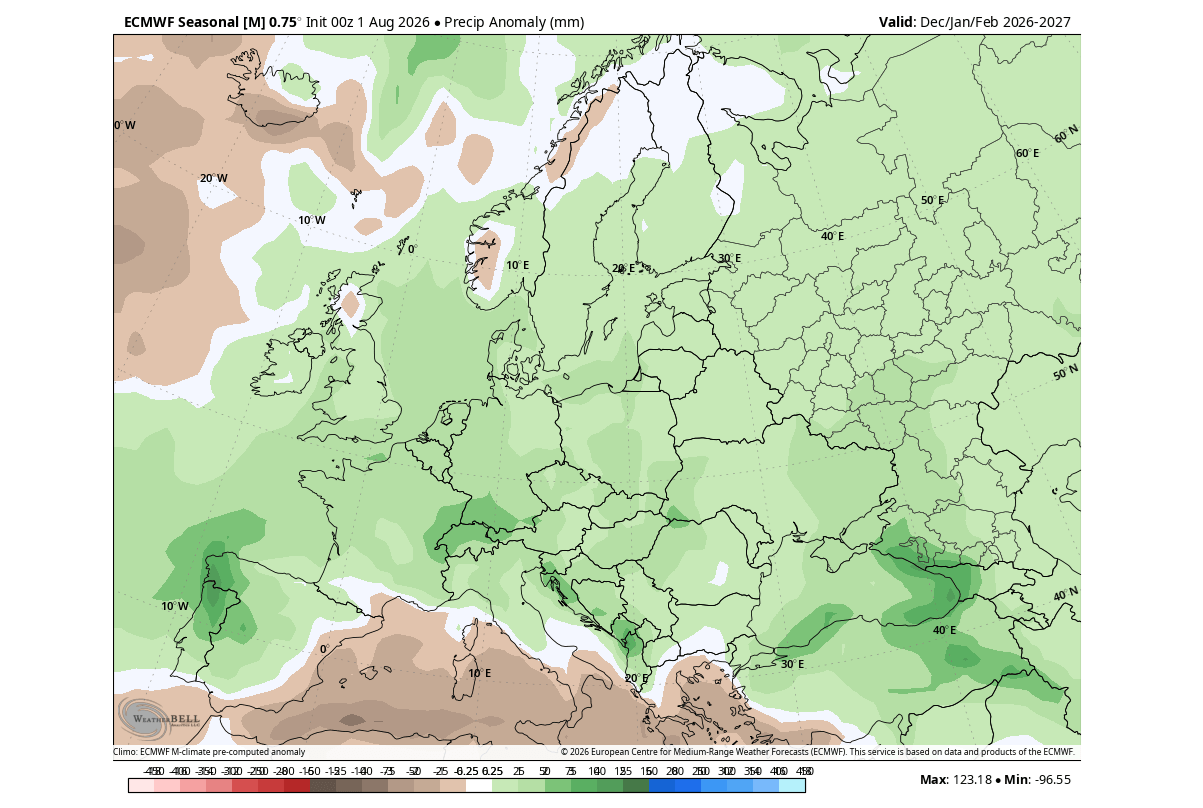
An amplified westerly flow also brings more moisture into the continent, which is the driver of the precipitation forecast below. You can see above-normal precipitation over the December-February period, driven by westerly moisture transport and the low-pressure system over the north/northwest.
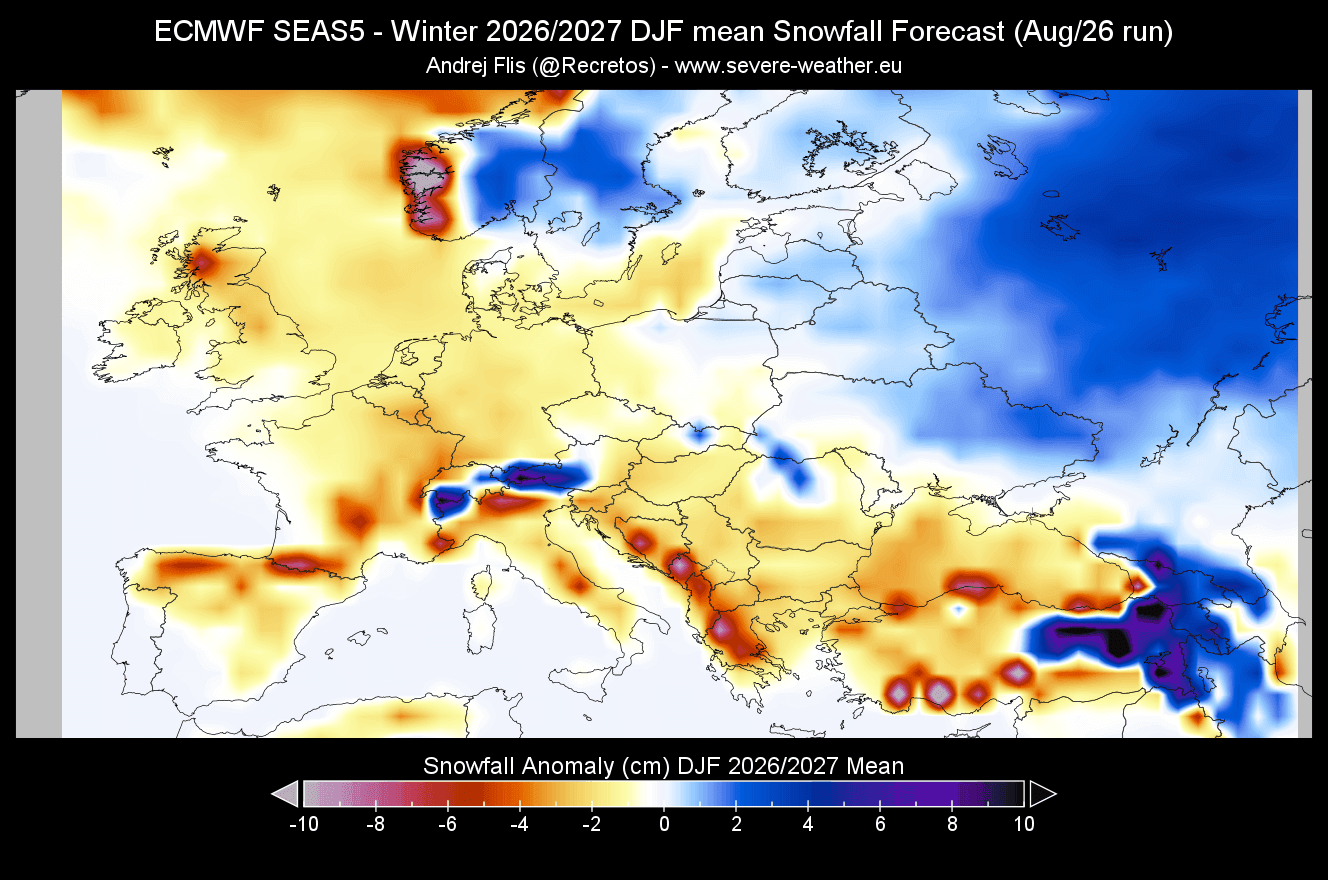
The main snowfall potential comes with individual low-pressure systems moving further inland and to the south, bringing down a more northerly flow. I call this “individual” opportunities, as the overall seasonal pattern is not that favorable for broad snowfall over Europe. The exceptions are the north and northeast, and the central higher elevations.
I will write a separate specialized article for the Winter 2026/2027 forecast over the United States, Canada, and Europe, once all the available data is refreshed in August.
Scientific Studies Used in this Article
- Atmospheric Circulation Changes: Robust Circulation Changes in the Tropics Under a Warming Climate: A Topical Review – Thomas and Bala (2025).
- IOD–ENSO Winter Teleconnections: The Combined Link of the Indian Ocean Dipole and ENSO with the North Atlantic–European Circulation during Early Boreal Winter in Reanalysis and the ECMWF SEAS5 Hindcast – Raganato et al. (2025).
Forecast and analysis images in this article are from ECMWF, BOM, CyclonicWX, weathermodels.com, and WeatherBell (using a commercial license).
Full Fall 2026 forecast: Fall 2026 Forecast: Super El Niño Sets Up a Winter-Like Weather Pattern That Strengthens Into January
El Niño forecast to drive an August shift: Super El Niño Drives an August Weather Shift as Fall and Winter Signals Strengthen
We will keep you updated on the global weather pattern development, so bookmark our page. Also, if you have seen this article in the Google App (Discover) feed, click the like (♥) or the star button there to see more of our forecasts and our latest articles on weather and nature in general.