Ocean and Atmosphere are strongly related and interconnected. Together they form the basis of our complex climate system. Current trends in the Ocean temperature anomalies indicate a potentially important effect on the Severe weather season in the United States and even Summer in Europe.
Global oceans cover 71% of the Earth’s surface and contain 97% of the Earth’s water. They play a crucial role in global atmospheric circulation and climate, impacting our weather in a major way.
First, we will look at the global ocean temperature anomalies. This easily shows us where in the ocean the waters are warmer/colder than the long term average (1982-2010).
We can see in the image below, that much of the globe has above-average ocean temperatures. What stands out is the ENSO region, with its cold La Nina phase currently ongoing.
Another feature that stands out, is the warmer than normal North Pacific ocean. Especially the eastern side, with its unofficially named “warm-blob”.
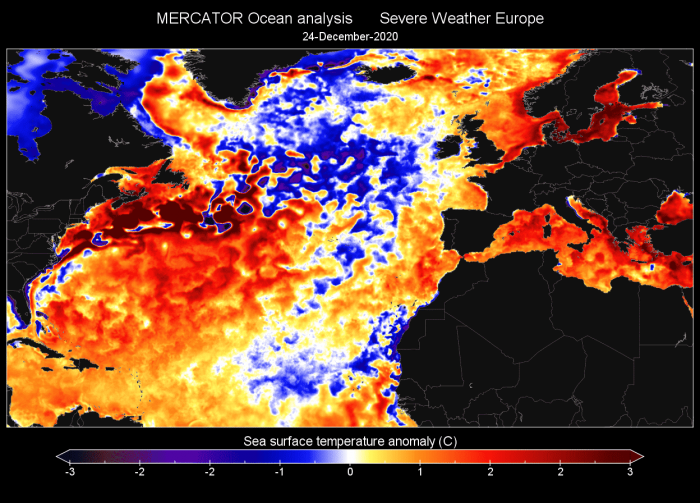
Also important is the North Atlantic ocean. The far northern regions are colder than normal, with the Gulf stream region running abnormally warm.
We produced a high-resolution video of the developing ocean temperature anomalies in the North Pacific and the North Atlantic. It shows that the ocean temperature profile is constantly changing, being largely impacted by the weather pattern and especially the winds.
Looking at the average ocean anomalies for the entire year 2020 so far, we can see all three features standing out. We have the warm blob in the North Pacific, the cold tropical ENSO region, and the cold-neutral North Atlantic.
NORTH ATLANTIC OCEAN
Looking closer at the North Atlantic, we can see a fairly large area of colder than normal ocean temperatures in the subpolar regions. This is largely due to the cyclonic/low-pressure weather activity in this region and the resulting positive NAO during the late Autumn season.
As a quick explanation, the NAO stands for North Atlantic Oscillation. It simply describes the mode of the pressure difference between the Icelandic Low-pressure and the Azores High-pressure systems.
The image below shows the difference in weather between the two NAO phases. A higher pressure difference between Iceland and the Azores (positive NAO) can mean a stronger westerly jet stream and a more mild Atlantic airmass reaching mainland Europe, and warmer weather in the eastern United States. A lower or reversed pressure difference between Iceland and the Azores (negative NAO), means a more north-south flow and a higher chance of colder weather over Europe and the eastern United States.
The pressure anomaly on the image below reveals the pressure pattern from Nov 1st to Dec 23rd. It shows lower than normal pressure over the subpolar North Atlantic and Scandinavia, and higher pressure over central North Atlantic regions. This is essentially a variation of a positive NAO phase we have seen above.
Constant strong cyclonic activity and cold fronts, tend to mix the ocean surface with deeper cooler waters, and also removing some of the heat from upper ocean layers, further cooling the ocean surface.
This is evident in the graphic below, which shows the North Atlantic temperature anomaly graph over time. It does reveal a very significant anomaly drop from October into November. That corresponds with the dominant positive NAO phase which began in November.
The image below shows the NAO index in the past weeks. We can see it was positive for most of November, going neutral into December. It nicely corresponds with the ocean temperature graph above, which shows the temperature going below normal as the NAo turned positive.
So, why is the temperature of the North Atlantic ocean important? Because there is a known connection between colder subpolar North Atlantic ocean temperatures and summer heatwaves in Europe.
Several scientific studies suggested that the cold North Atlantic ocean anomaly and the resulting temperature differences could have initiated a stationary Jet Stream position that favored the development of high pressure and temperature extremes over Central Europe.
To simplify, the winter/spring North Atlantic Ocean temperature anomalies can have an influence on the developing pressure patterns in summer, affecting the position of the jet stream, allowing higher pressure to build over Europe, causing strong heat waves.
Partially we also have to consider that the positive NAO pattern holds or transfers into summer, allowing for higher pressure to build over central Europe this way.
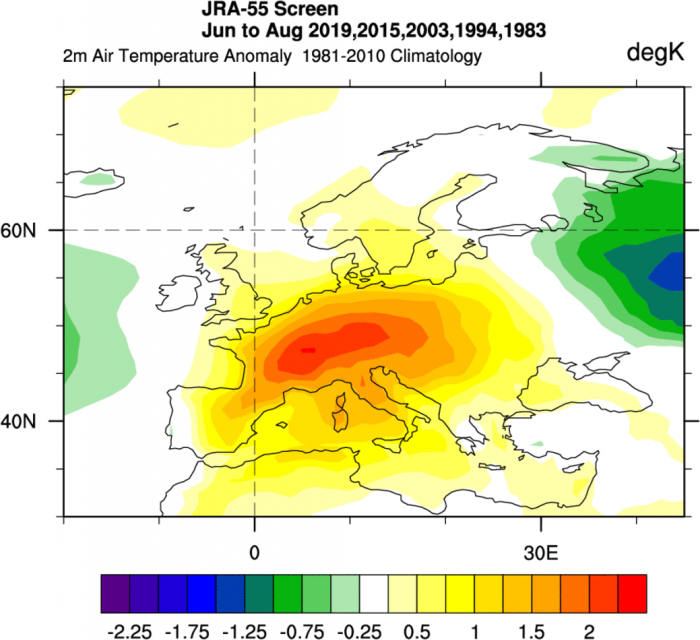
Below we have prepared two graphics. The first one shows temperature anomalies in summer, during the years with strong heat waves. We have 2019, 2015, 2003, 1994, and 1983. All these years featured strong heat waves during summer over parts of central Europe.
The second graphic shows the ocean temperature anomalies in spring, prior to these years with strong heatwaves. We can see a very similar picture to this year, with the cold subpolar North Atlantic, and warmer central North Atlantic regions.
Looking at the ECMWF long-range forecast, we can see that it continues the colder North Atlantic temperatures into Spring 2021. We can see a pretty significant temperature anomaly gradient between the subpolar North Atlantic and the Gulf Stream region.
The surface temperature anomalies below actually reveal the colder air extending from the subpolar North Atlantic towards western Europe. This would imply a low-pressure extension towards northwestern Europe.
This would mean more southerly warmer flow for Eastern Europe, with cooler air over western Europe. Central Europe is in-between the two poles, with both occasional cold front from the west/northwest and warmer episodes with the southerly flow.
Over North America however, we can see a pretty significant positive temperature anomaly over the western United States and over the North Pacific.
It is too far to look out into actual Summer 2021 forecasts, but the trend of a colder than normal North Atlantic ocean is the first sign that points towards a potentially increased number/duration of summer heatwaves over Central Europe.
LA NINA – THE COLD ENSO PHASE
We have already covered ENSO and La Nina extensively in the past weeks and months. But the strong cold ENSO phase is now really starting to show its influence and will be one of the major weather factors in the coming weeks and months.
To simplify, ENSO is short for “El Niño Southern Oscillation”. This is a region of ocean in the tropical Pacific, which shifts between cold and warm phases. The tropical trade winds (easterly winds that circle the Earth near the equator) usually initiate or stop a certain phase, as they mix the ocean surface waters and change the ocean currents.
Below we have an image that shows all the ENSO regions, also called the Nino regions. The main ENSO regions are 3 and 4 and cover a large part of the tropical Pacific. But most calculations and analysis is based on a single region called Nino 3.4, which partially covers both regions, 3 and 4.
ENSO plays a major role in the tropical rainfall and pressure patterns and the complex interaction of the ocean-atmosphere system. Through this ocean-atmosphere connected system, the ENSO influence is distributed around the world.
We usually observe a global shift in pressure patterns during the emergence and duration of the ENSO phases, each having a unique impact on our weather during the changing weather seasons.
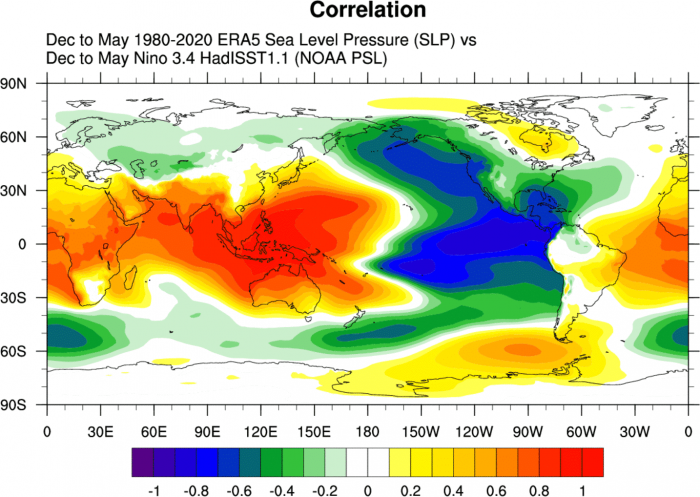
The next image below shows the correlation between the ENSO temperatures/phases and the surface temperatures around the world. A very simple way to explain this is to say that we are observing what happens to one variable when the other one changes. In this case, we are looking at the Winter/Spring temperature patterns compared to the ENSO values.
Positive values mean, that as the ENSO values go up, so do the surface temperatures. That is nicely seen in the tropical ENSO regions with a strong positive signal. A negative correlation signal means that as ENSO values rise (positive phase), the surface temperatures drop.
A practical example is the negative values in the southern United States and Mexico. It simply means that as ENSO gets warmer (positive phase) the temperatures there get lower than normal, as the weather patterns change in response to the changing circulation.
Another example is when we look at the correlation between ENSO and pressure patterns. We can see a large negative area in the eastern Pacific Ocean. This for example implies that as ENSO values rise (positive phase), the pressure there drops. It also means that as the ENSO values drop (negative phase), the pressure there rises.
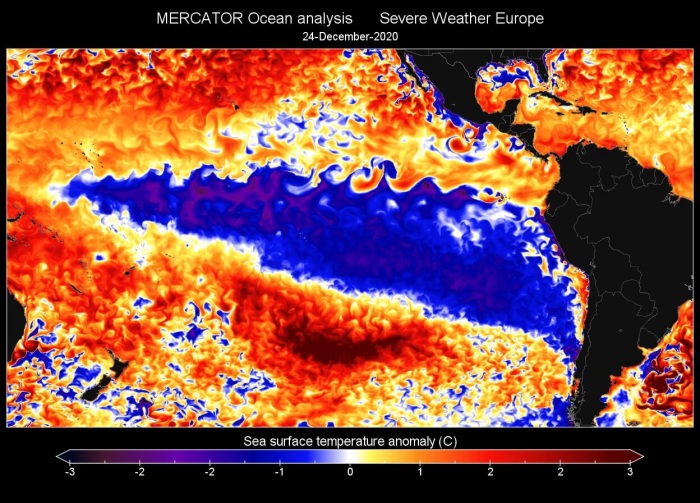
The cold ENSO phase is called La Nina and the warm phase is called El Nino. The ENSO phase is determined by the temperature anomalies (warmer/colder) in the ENSO 3.4 region in the tropical Pacific that we showed at the start of this segment.
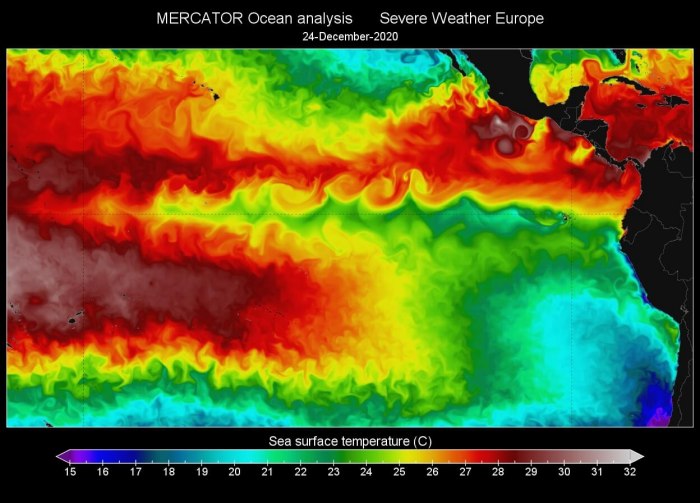
The image below shows the current analysis of ocean temperature anomalies and the quite extensive colder area in the tropical Pacific. That large triangular batch of colder than normal waters is the La Nina-
Raw temperatures also nicely show the La Nina, as an obvious colder (relative to the surroundings) water stream along the equator. The tropical trade winds blow from the east, and occasionally they get stronger and mix the ocean layers, bringing colder deeper waters to the surface, triggering a La Nina.
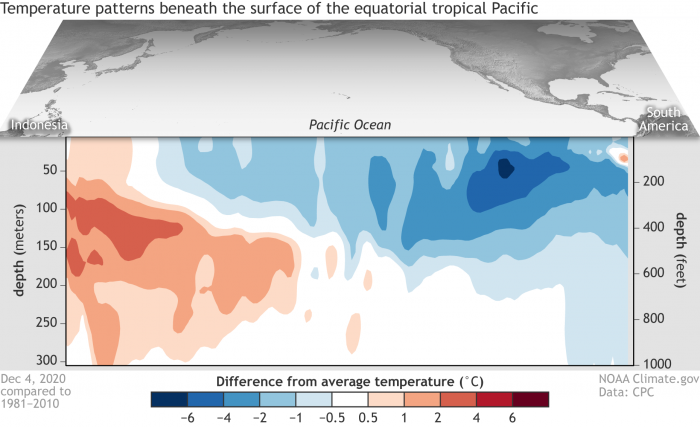
We can see the temperature anomalies below the surface in this analysis image from NOAA Climate. It shows quite colder waters lingering below the surface in the eastern tropical Pacific in early December. They were transported near the surface from deeper colder layers of the ocean, by the various wind and ocean transport processes.
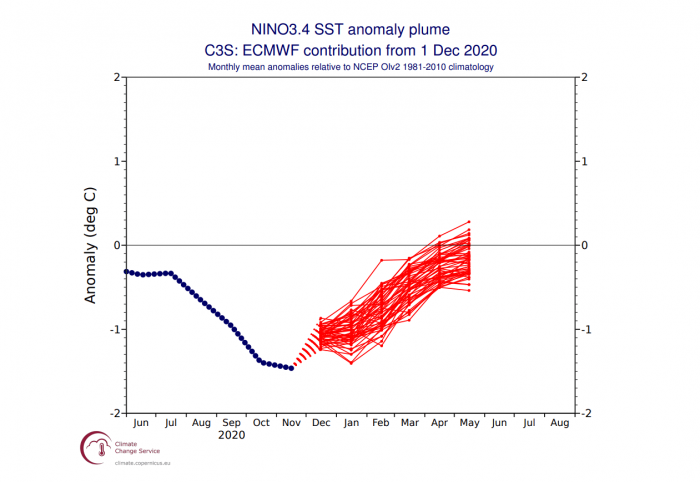
The anomaly graph over time shows that the La Nina is currently in the “strong” category, reaching the average anomaly of -1°C. It has reached below -1.5°C negative anomaly in late October and has weakened little since then.
The long-range forecasts currently indicate that La Nina has already reached its peak strength, and is expected to start weakening towards Spring 2021.
Below are two forecasts, from ECMWF and the Australian BOM, and they both show the temperature anomaly forecast for the main ENSO 3.4 region. La Nina is expected to start weakening in early 2021, but its influence will be far-reaching for quite a large portion of 2021.
WEATHER IN THE LA NINA WORLD
Tracking the infamous “La Nina influence” is not all that easy. It is not as simple to just point at a certain weather event and simply call it ENSO powered. Global weather is a very delicate system, where everything has an influence on everything. Tho at quite different “power levels”.
For example, it is quite simple to find evidence for direct La Nina or El Nino related weather patterns over the North Pacific or the United States in winter or spring.
But over Europe, the direct La Nina influence slowly fades, due to the generic weather pattern volatility. The influence is still there, but it is mitigated/modified by the existing weather patterns in the North Atlantic.
One way of searching for the “fingerprint” of the La Nina, is by looking at the atmospheric circulation, more specifically its angular momentum. Keeping it very simple, the Atmospheric Angular Momentum (AAM) is a measure of how the entire atmosphere rotates around the Earth. ENSO phases are strong enough to cause measurable changes in this atmospheric circulation around the Earth.
Positive anomalies are related to the positive phase of the ENSO, while negative values are more related to the negative ENSO phase, namely La Nina.
So far we saw positive values in early December, indicating a weak influence of the La Nina. But we are currently observing negative AAM values and still forecasted to drop further, indicating that the La Nina presence is potentially strong in the global circulation.
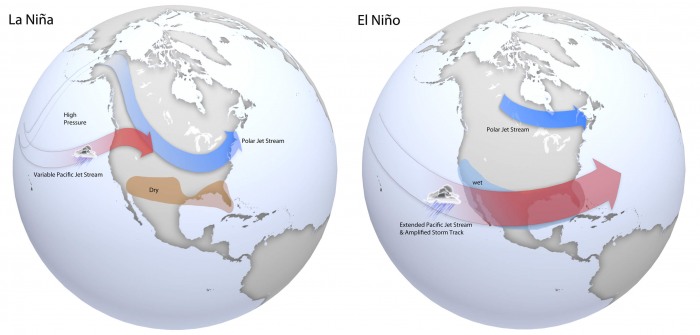
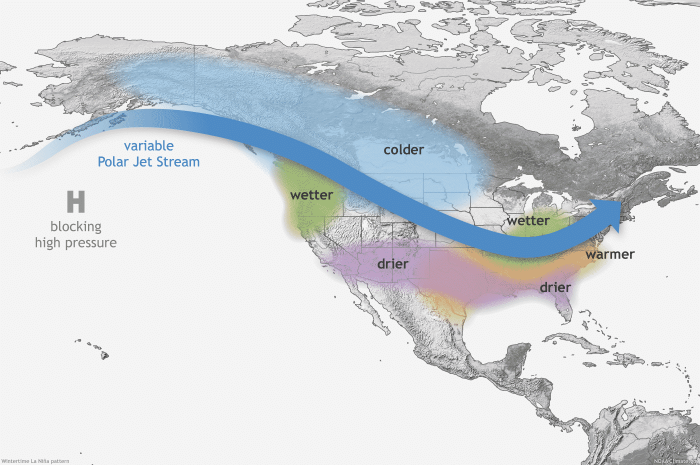
Both phases of the ENSO, warm and cold, have a unique influence on their own. Below is an image that shows the winter weather pattern over North America in El Nino (warm phase) and La Nina (cold phase).
Starting with La Nina winter, we can see it features a strong high-pressure system in the North Pacific. This actively bends the polar jet stream, turning it downwards toward Northwestern and northern United States, along with the colder air and snowfall. This keeps the southern United States relatively drier and warmer than normal.
In an El Nino winter, the North Pacific features a lower than normal pressure, amplifying the more southerly Pacific jet stream. This brings many low-pressure systems into the southern United States, featuring a cooler and wet winter in these regions. The northern United States usually experiences a milder winter on average during an El Nino.
Below we have a closer look at a typical La Nina winter, with the temperature patterns emphasized. The twisted jet stream brings colder air and storms down from Canada into northern and the northwestern United States, and warmer and drier weather to the southern parts. The jet stream over the United States can actually divide the country into 2 different weather regions in any strong ENSO phase.
But, beyond winter, lies perhaps a more ominous weather threat from the La Nina. As proven with science over time, La Nina can have a profound influence on the Spring tornado season in the United States. And not in a good way.
Going straight to the point, we have a very interesting image below from NOAA Climate. It shows a very nice comparison of hailstorm and tornado frequency during the spring season in the United States, between El Nino and La Nina years.
It is quite shocking to see, that in a La Nina season, there is a substantially higher frequency of hailstorms and especially tornadoes in the southern and southeastern parts of the United States. It very profoundly outlines the central and eastern parts of the Tornado Alley.
Tornado Alley is a common nickname given to an area in the southern plains of the central United States that consistently experiences a high frequency of tornadoes and other severe weather each year.
But why are there more tornadoes and other severe weather in the southern United States during a La Nina?
It has a lot to do with the weather pattern we have seen earlier during a La Nina winter. We saw that it bends the polar jet stream towards the south, over the United States. Going towards spring, this effect can usually persist, as it can take some time to “remove” a decayed La Nina from the circulation system.
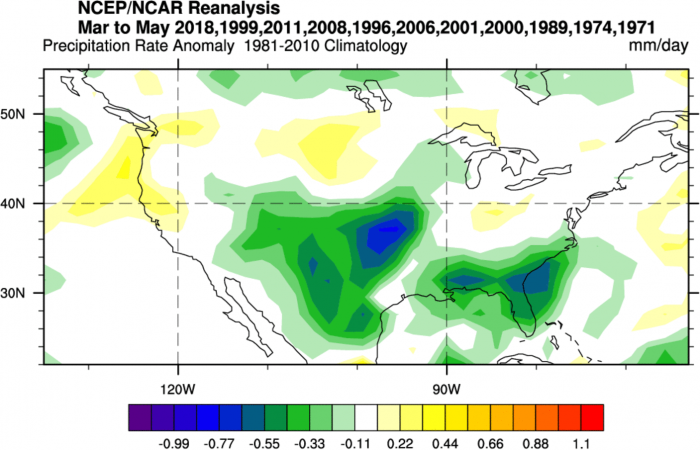
We produced simple reanalysis charts, which show the average La Nina spring weather pattern, based on the historic La Nina events in the past 40+ years. Note that there can be great variance between one La Nina season to another. The global weather system is very complex, and can sometimes interfere with the weather development in different ways, despite an active ENSO phase.
The first image shows the 500mb geopotential height anomaly, outlining the location of the main pressure systems. What is special about this chart is that we can see a large low-pressure area over western Canada and the northwestern United States.
This can act as a source for frequent cold fronts moving from Canada down into the central United States, along with the jet stream, providing a lot of support and trigger mechanics for severe weather development.
But severe weather also needs an active source of energy, namely warm and moist air. That is usually sourced from the south, as far as the Gulf of Mexico.
The image below shows the surface pressure pattern, with a strong low-pressure anomaly in the south-central United States. A low-pressure system spins counter-clockwise, which means that on this map, this low-pressure area promotes strong southerly flow on its eastern side. That is directly from the Gulf of Mexico, towards the central and eastern parts of the Tornado Alley.
The precipitation anomaly chart shows the above-normal rainfall in the southern United States, especially in the hearth of the Tornado Alley. Together with the presence of the polar jet stream and the low-pressure systems, this is a clear indicator that a typical La Nina spring can be very violent with severe weather in the southern and eastern United States.
Current combined long-range forecasts for Spring 2021 show that a very classic looking weather pattern is setting up. It is still very early to speculate, and we need to wait for the January 2021 updates for anything specific. But the early forecast does show that the severe weather season in Spring 2021 could be amplified by the current La Nina cycle.
Another concerning factor along with the pressure anomalies is the signal for warmer than normal sea temperatures in the Gulf of Mexico. This can provide warmer air with more moisture, potentially increasing the available energy for severe weather development in the southern United States.
All in all, the chances are increasing for the severe weather season in the United States to be more active than normal, due to the La Nina influence. We will keep you updated with fresh info and weather forecasts as new data is available.
DONT MISS:
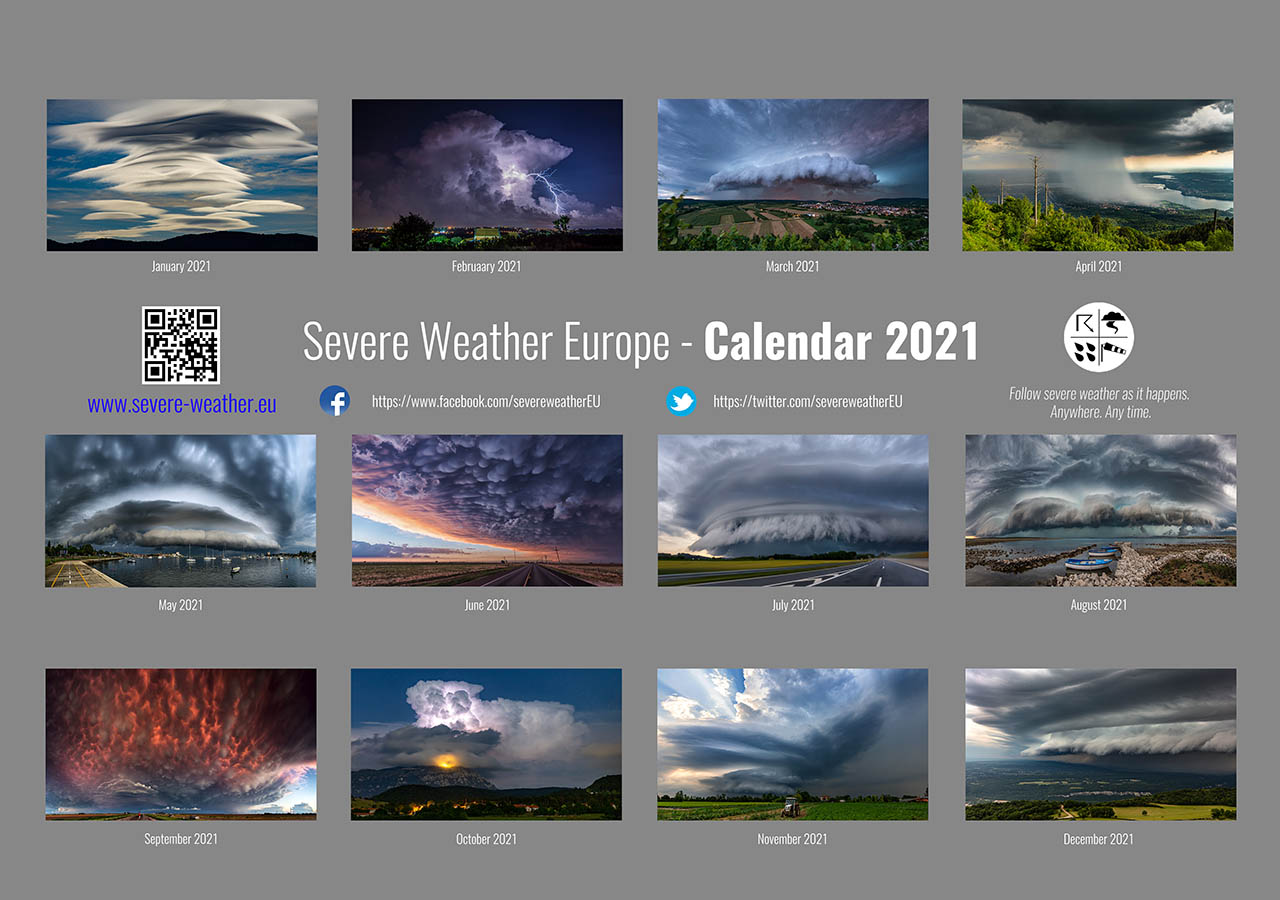
Thinking of a nice Christmas gift for your friends, family, or someone special to you? Weather calendar could be the perfect gift for them – see below:


