Rain, rain, and more rain has been the consistent pattern for most parts of the country so far this Australian winter. And, aside from some unseasonal and record-breaking warm weather in Queensland last week, we can add widespread and persistent cold weather across most of the country, including some near-record low daily maximum temperatures.
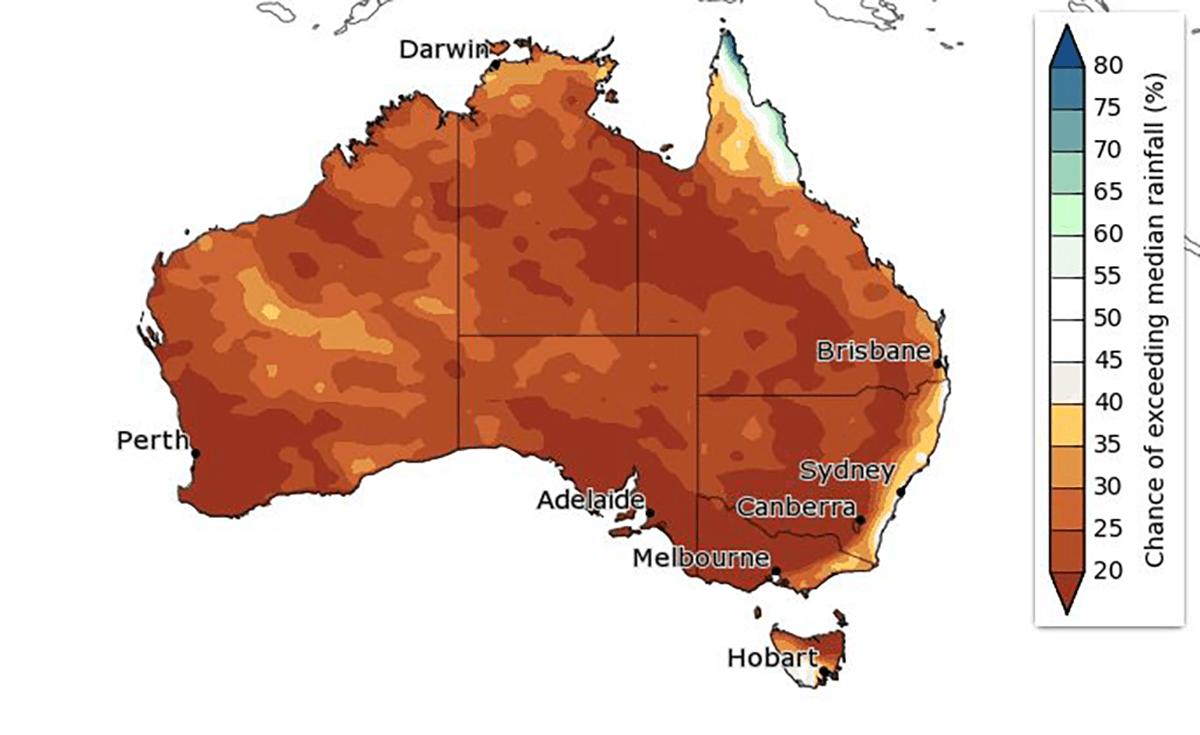
Most of the weather we have experienced in Australia so far this winter has been so wet and cold, it has actually defied the winter weather outlook issued by the Bureau of Meteorology. Their official outlook for winter predicted below-average rainfall and above-average temperatures for almost the entire country, as depicted in the image below:
WHAT ON EARTH IS HAPPENING TO THE AUSTRALIAN WINTER WEATHER?
The Australian winter weather before this week has been a departure from ‘normal winter conditions’ for many locations in Australia, with extensive, unseasonable rainfall and persistent miserable cold weather.
But this week, at the time of writing this article, we returned to a more standard weather pattern, including some classic features of winter in Australia including:
- A belt of high pressure stretching across central Australia led to clear skies, sunny days, cold nights and little rainfall
- Strong winds impacting the far south
- Regular frontal systems grazing the southern states
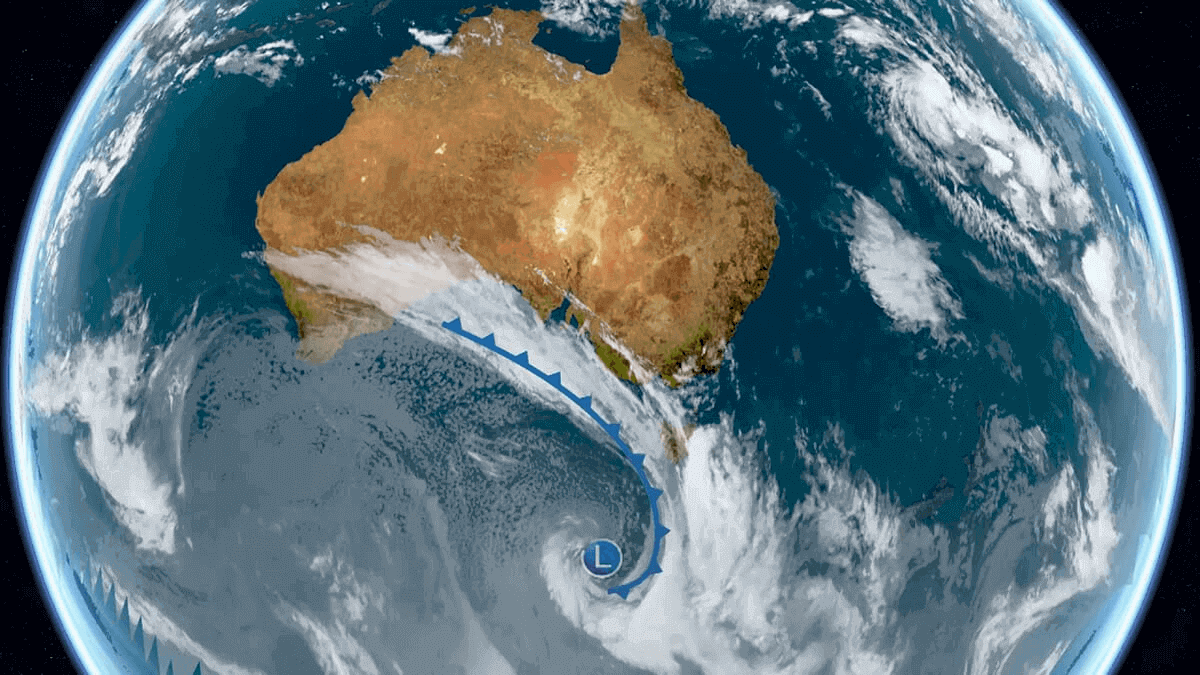
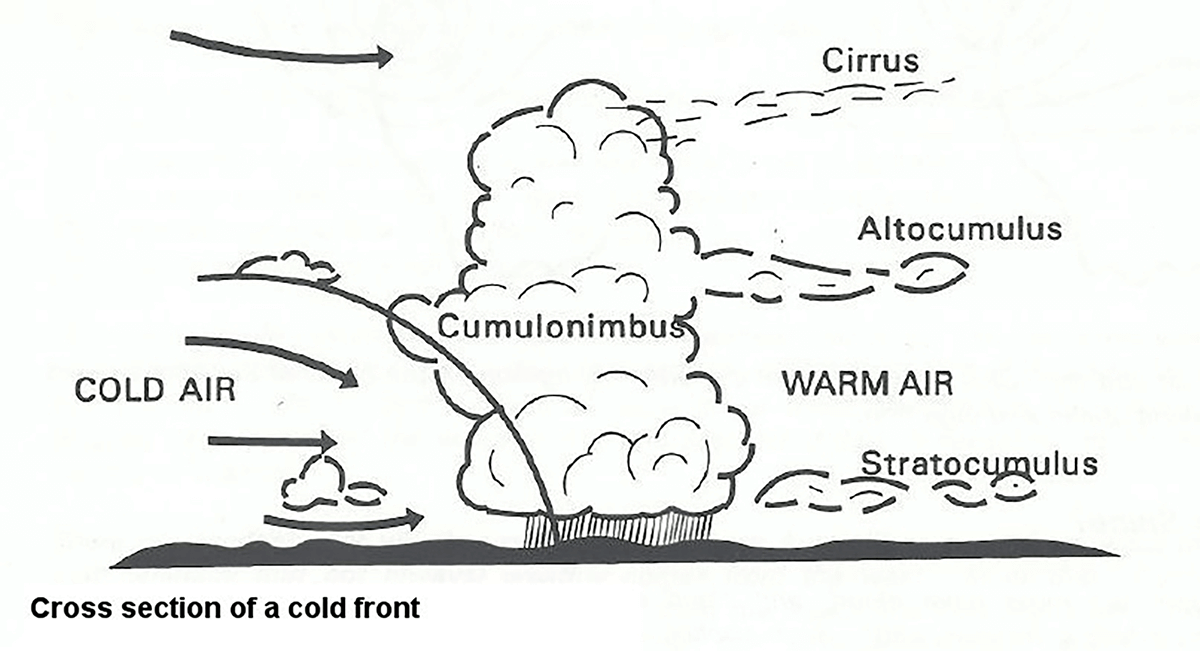
The result of this more normal synoptic setup means that most of the country will have drier weather, while the southern states will get a few showers due to the passing fronts. The image below clearly shows the cloud bands associated with a typical winter frontal zone:
So, as we enter the middle parts of the winter season and start to see a return to a more normal winter weather pattern, it’s a good time to look back at what we have experienced in Australia so far this season and try to make sense of it.
In this article, we aim to compare the wet and cold winter we have experienced to the official Winter Weather Outlook issued by the Bureau of Meteorology. We will try to make sense of the apparent differences; and explain why the wet and cold Australian winter ‘seems’ to be in direct contrast to the media and online hype and what we would normally expect from an El Niño event.
To achieve this, we will need to explore a few important topics, including:
- The persistent wet and cold winter weather across Australia so far and its main influencing factors
- How the winter weather so far compares to normal winter weather
- How the first half of winter compares to the winter weather outlook issued by the Bureau of Meteorology
- How the recent confirmation of El Niño by US authorities and the announcement of an El Niño Alert by Australian authorities can impact our expectations of weather, even in the depths of winter
- Why we haven’t seen the warmer and drier weather usually associated with El Niño yet
WHAT ARE THE MAIN FACTORS INFLUENCING THE PERSISTENT WET AND COLD WEATHER SO FAR THIS AUSTRALIAN WINTER?
Several factors and climate drivers affect the weather in Australia on a day-to-day basis, with a number of these working together to create the very conditions we have seen so far this Australian winter. Let’s take a brief look at these below:
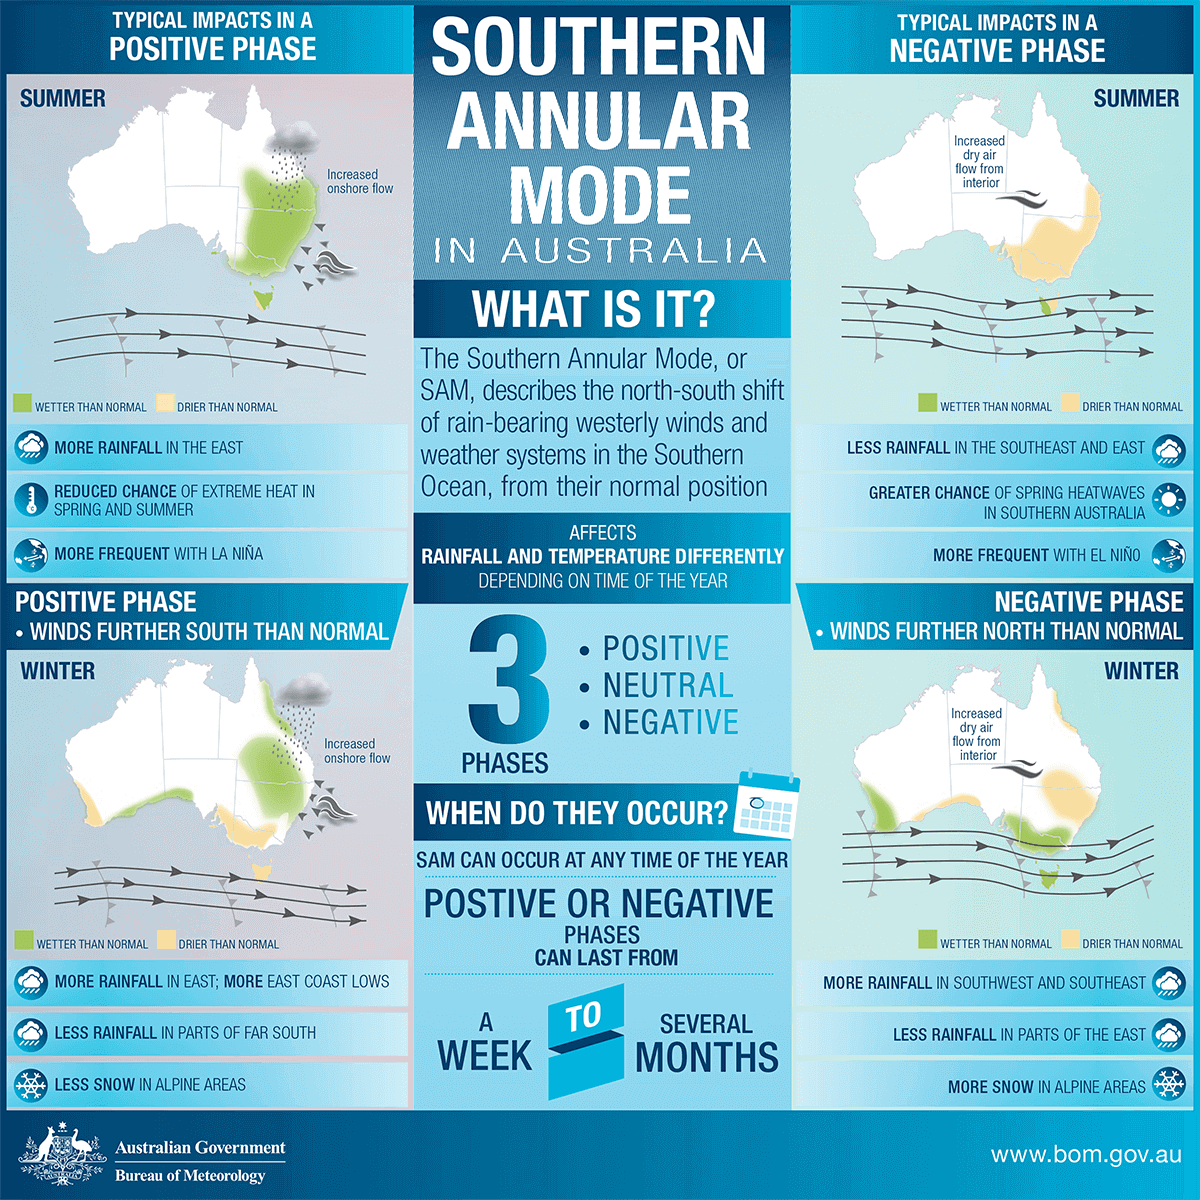
Southern Annular Mode
The Southern Annular Mode (SAM) is a Climate Driver that affects temperature and rainfall primarily across southern Australia. It refers to the north and south movement of the polar westerly belt where active low-pressure systems containing rain-bearing fronts can expand north to increase rainfall (negative phase) across southern Australia.
Similarly, the active westerly belt can shrink and contract closer to the poles, which causes less rain-bearing fronts and low-pressure systems to affect the southern coastline of Australia (positive phase). A neutral phase refers to conditions with a good balance of rain-bearing fronts but also more settled conditions with no lean towards wetter or drier conditions.
So far in winter 2023, we have seen a mix of neutral to negative conditions with only a brief spike to positive levels in the index. The current SAM forecast index is currently negative and is expected to remain negative for a week before returning to neutral values for at least the next two weeks.
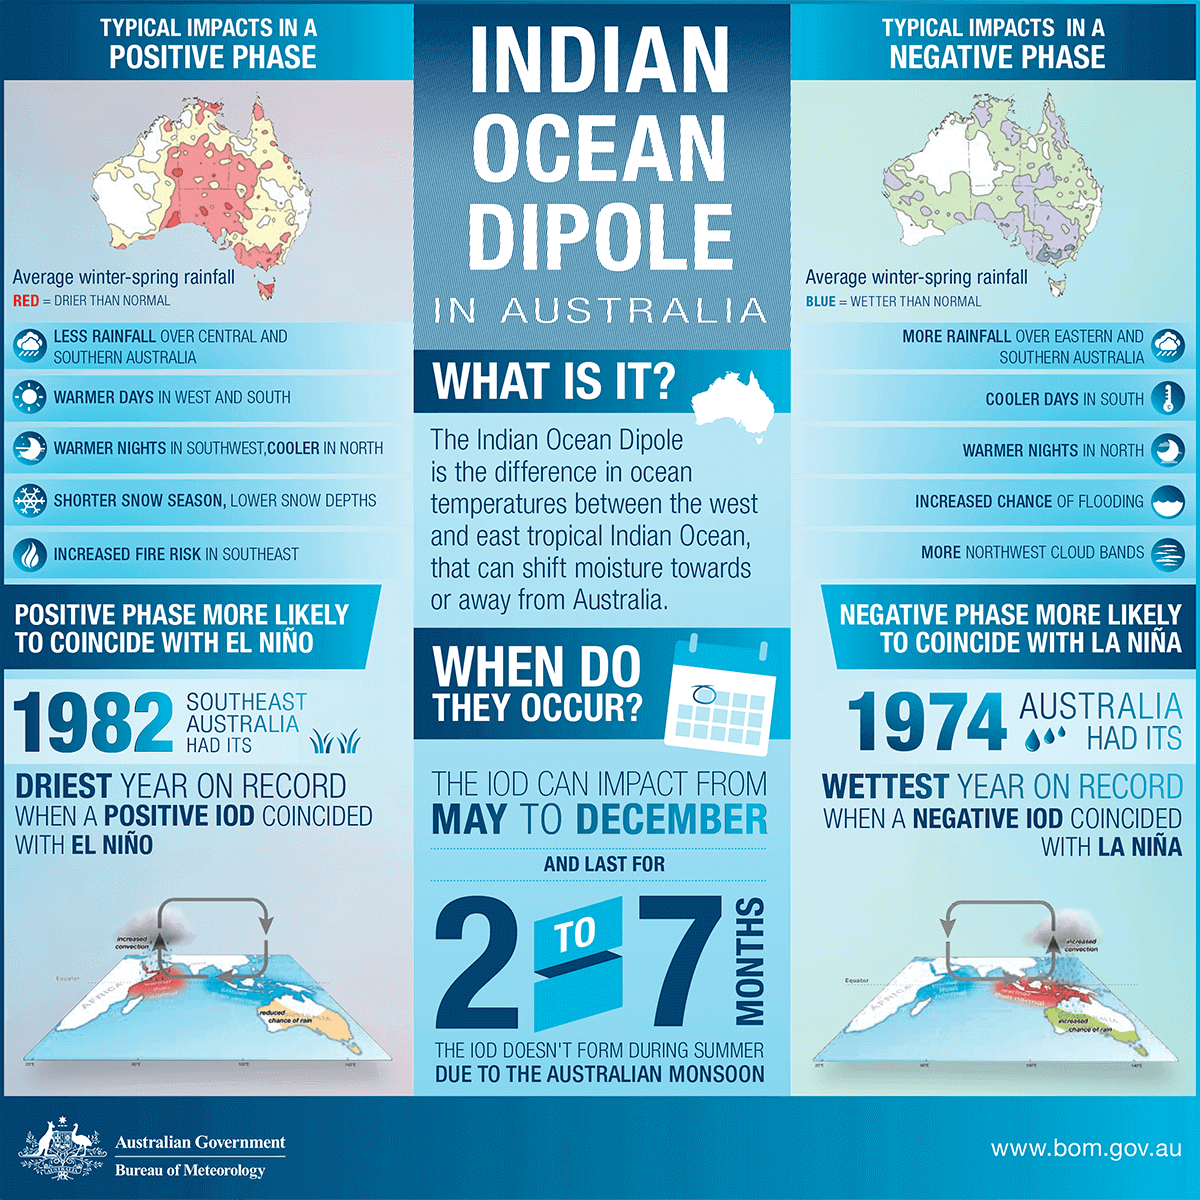
Indian Ocean Dipole
The Indian Ocean Dipole (IOD) essentially measures the difference in sea surface temperature anomalies between the Eastern Tropical Indian Ocean (waters west of Sumatra) and the Western Tropical Indian Ocean (waters off the horn of Africa). It is an important climate driver for determining rainfall over Australia and often is overlooked compared to the ENSO from the Pacific.
Negative phases of this index result in the warming of waters off Sumatra and Java, causing rising air and moisture-laden clouds to develop and feed into Australia with relative ease. At the same time, the waters off the horn of Africa are cooler than normal, and thus with sinking air and much drier conditions, including droughts for those neighbouring countries such as Mozambique. When there is a positive phase, the opposite outcomes occur.
In 2023 and throughout the Australian winter so far, we have remained in a neutral state between the positive and negative phases, meaning there is no favouring of either side of the basin. Whilst a positive IOD is expected to occur by late winter and early spring, it is taking longer than expected to develop, which has allowed more moisture than expected to be available to flow towards Australia and form NW cloud bands, as explained in this recent article:
Lack of Ocean-to-Atmosphere Connection
One of the most important features of large climate drivers such as the IOD or ENSO is the ocean-to-atmosphere connection. This is essentially a feedback loop where the warmer or colder oceans in their respective basins are causing a direct response in the atmosphere (such as increased convection, low pressure, and trade winds).
When the ocean and atmosphere work together in a coupled state, they enhance each other, and the cycle feeds itself until otherwise broken.
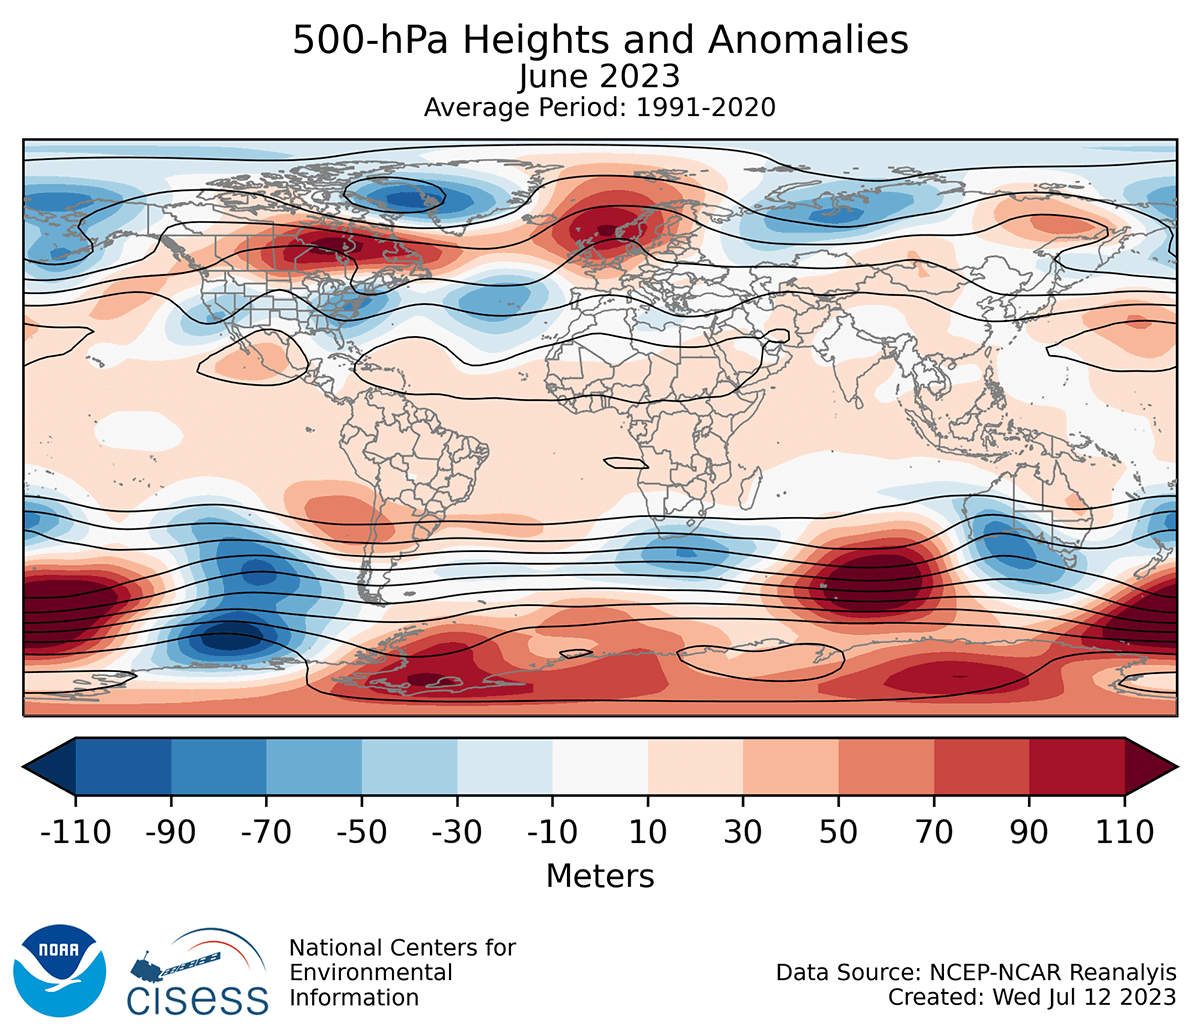
Blocking of Westerlies (Longwave Trough)
One of the main sources of rainfall across southern Australia in winter is the longwave trough. This is a large, broadscale trough in the atmosphere that is connected to the polar vortex that rotates around the South Pole. There are usually 4 or 5 of longwave troughs at any time, separated by upper ridges in a classic wave-like pattern.
Occasionally, these broadscale troughs can get blocked by stationary synoptic scale systems such as upper ridges or cut-off lows upstream. When they do, it can lead to prolonged wet conditions for the region that they are located in, with cold fronts, shortwave troughs, and smaller lows all rotating around the main longwave trough.
In the image below, we can clearly see the blue lower pressure anomalies in the Australian region, allowing that moisture to feed down on the jetstream located north and east of the longwave trough. Higher pressure than normal and drier conditions were present over the southern Indian Ocean.
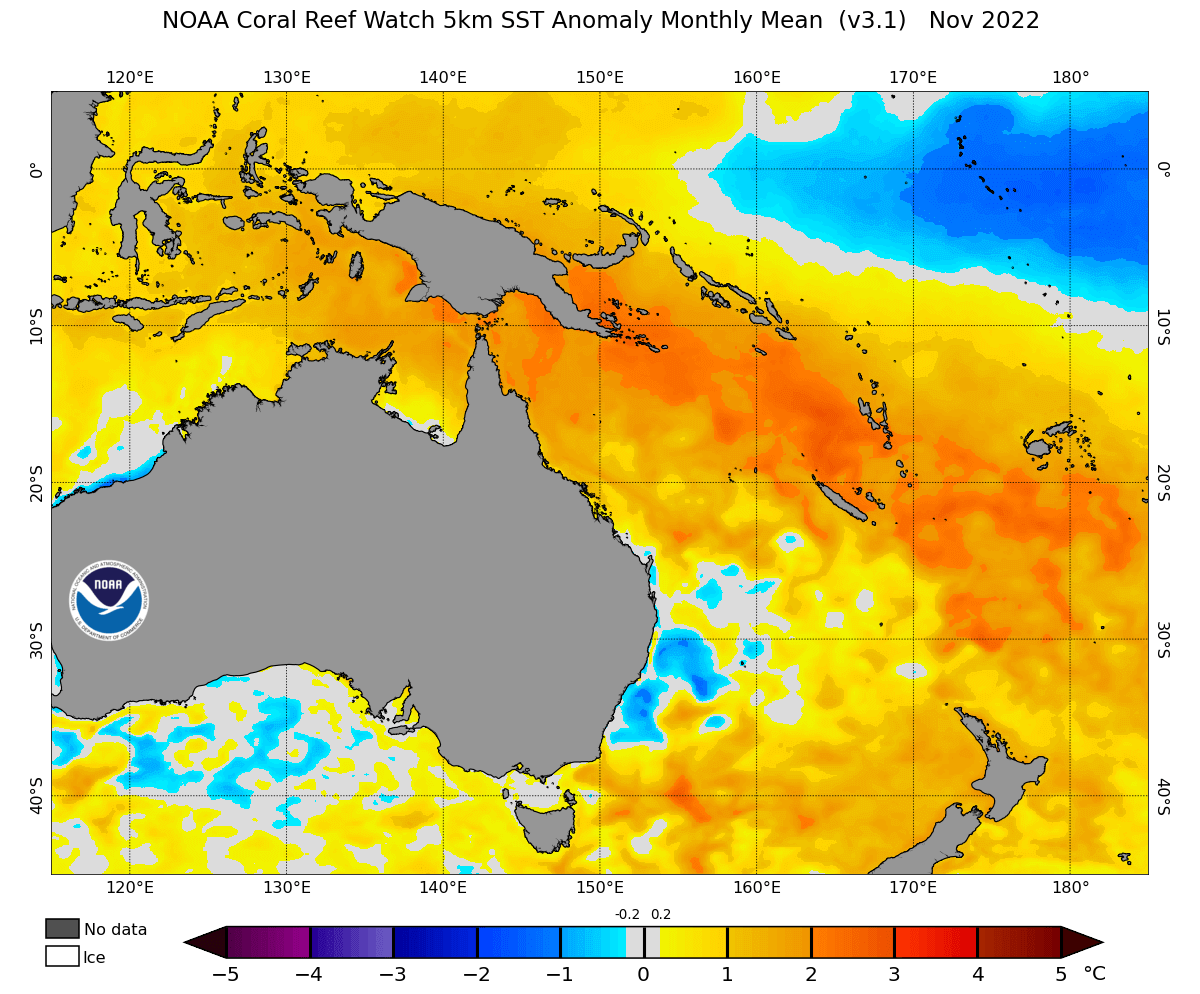
Warm Coral Sea
A warm Coral Sea is important in bringing moist, tropical air into mainland Australia through the lower levels of the atmosphere, typically on trade winds that blow in from the east. Sustained warmer-than-average sea surface temperatures in this region allows a gradual build-up of moisture to be brought inland around the top of high-pressure systems before being dragged south by the northerly winds ahead of any cold fronts and systems advancing east from the westerly belt.
This enhances the low-level moisture profile across mainland Australia, while the Indian Ocean provides the middle and upper-level moisture along the jetstreams, as explained earlier.
Leftover Moisture from La Nina
One important aspect not to be overlooked is the lingering moisture from the recent triple La Nina, one of only three in the last 50 years. Given that we still have not been through an entire dry season cycle through Northern Australia since La Nina, the tropics have remained quite active.
Convection north of Australia has been plentiful, especially across Indonesia, which in turn has kept moisture in relatively close proximity to mainland Australia, ready to be drawn into any approaching synoptic scale systems such as upper troughs and cold fronts.
Moist Soils from 2022 Floods Creating Feedback to the Atmosphere
Another commonly overlooked process that contributes to greater rainfall from weather systems is the feedback of moist soils to the atmosphere. The recent triple La Nina produced widespread flooding across much of inland SE Australia, and those floodwaters took quite some time to soak into the soil. When the sun heats the ground, that extra moisture reserve evaporates, and adds to the atmospheric moisture load.
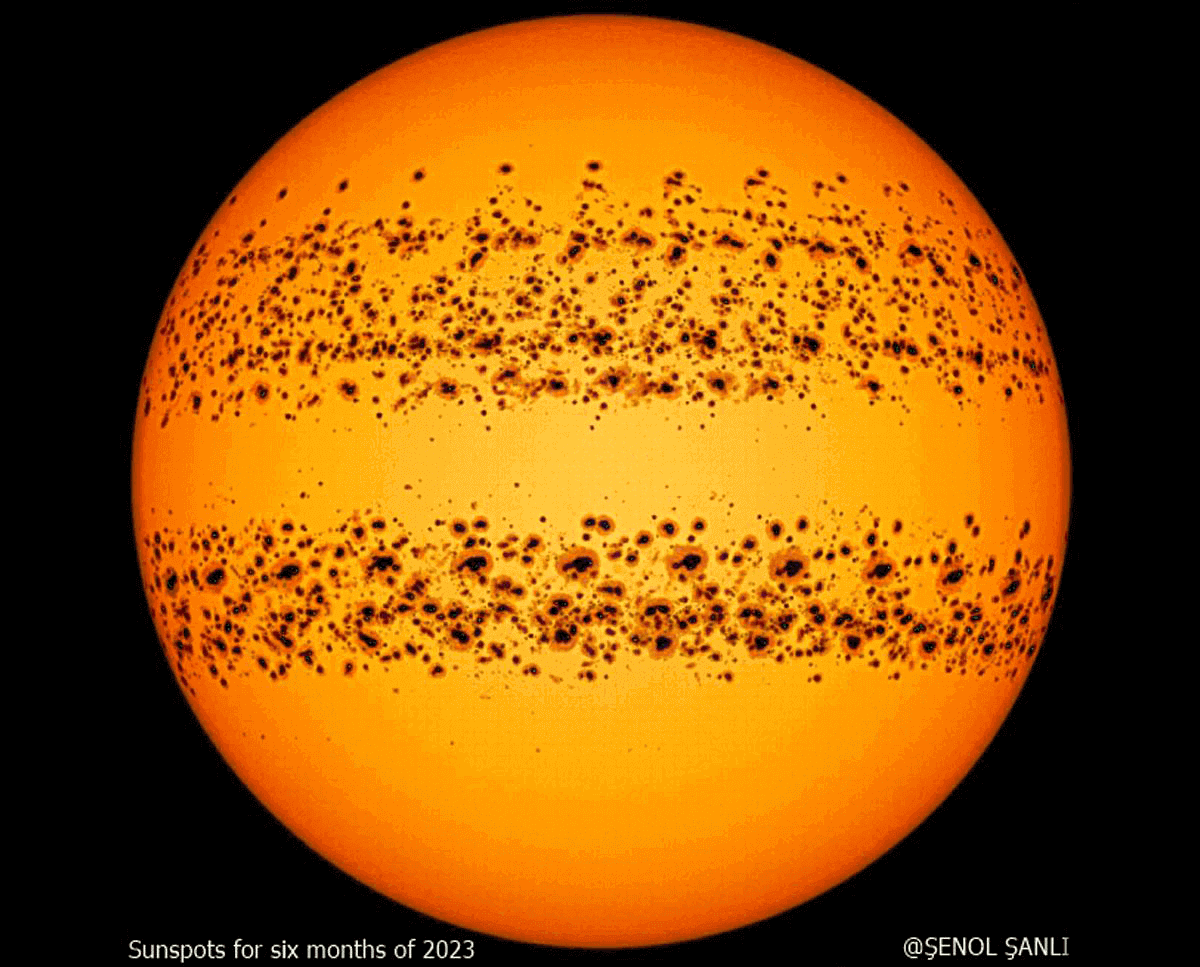
Active Sunspots and Cosmic Activity Such as Aurora Causing Meandering Jetstreams
Activity on the surface of the sun follows cycles. During solar minimums that occur approximately every 11 years, sunspot activity increases. Sunspots are known to directly impact the weather on Earth and increase the meandering of jetstreams, causing them to reach further north (or south, depending on your hemisphere) towards the tropics, thus influencing tropical moisture. A sure sign of the increased cosmic activity from these sunspots is the appearance of auroras at lower latitudes than normal, showing the bombardment of cosmic rays to excite the magnetosphere.
All of the Above Processes Working Together
The final piece in the puzzle of this wet and cold Australian winter so far is the combination of all the processes above working together to deliver what we have seen so far, in contrast to such a dry forecast.
Warmer sea surface temperatures in the Coral Sea allowed moisture to build and move inland; a blocked longwave trough increased the uplift of moisture over Australia; high moisture supply from both the recent La Nina and moist soils, as well as the lack of a positive IOD so far have contributed.
In addition, the increase in the northern extent of the westerly belt from the negative phase of the SAM has kept strong atmospheric triggers in place to lift that moisture, where it has been influenced by the meandering of the jetstreams reaching so far north, which in turn can be linked to the increase in cosmic rays from sunspots.
Meanwhile, we have no direct coupling of the ocean to the atmosphere from the developing El Nino in the Pacific.
THE WEATHER FOR THE FIRST HALF OF WINTER SEEMED UNUSUAL, SO WHAT IS NORMAL FOR AN AUSTRALIAN WINTER?
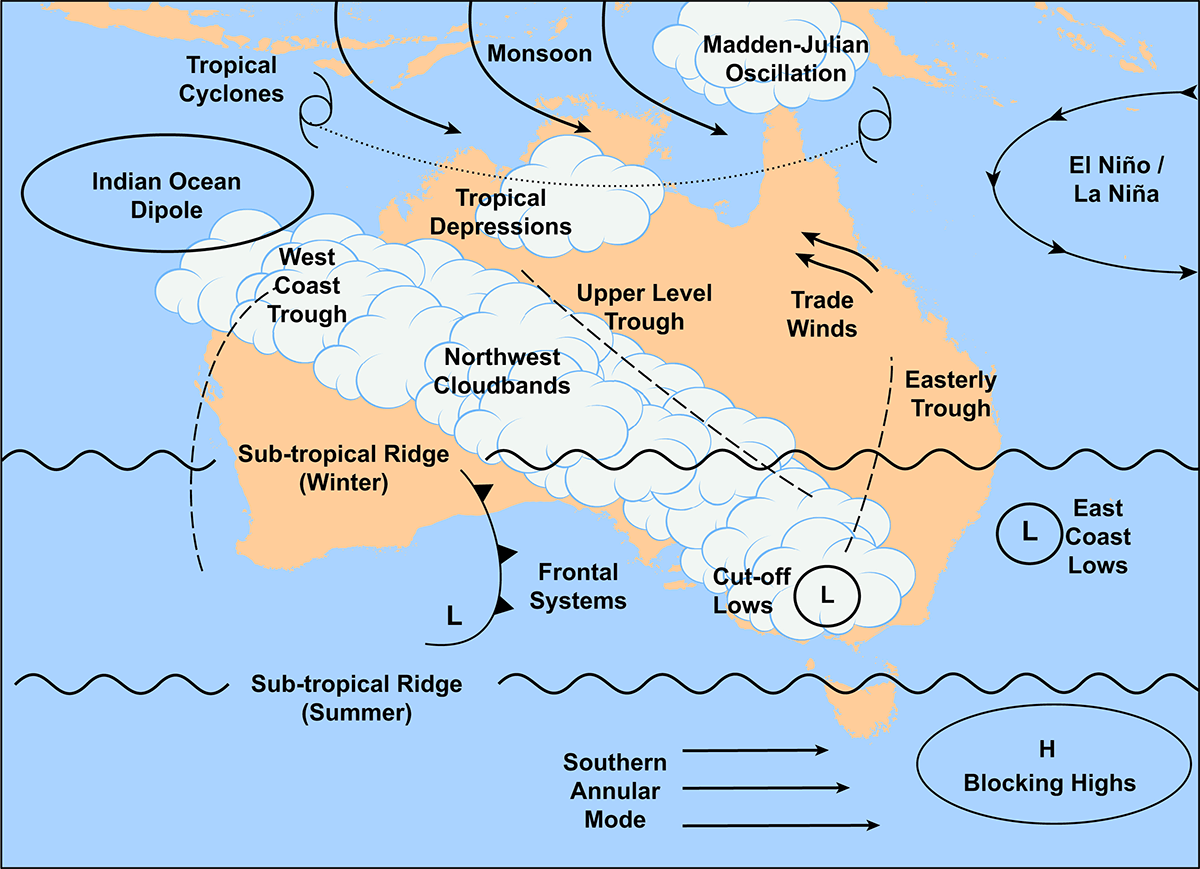
During the Australian winter season, several synoptic features play a significant role in shaping weather patterns. These features include:
High-pressure systems, also known as anticyclones, exert considerable influence over much of the continent during winter. They typically bring clear skies, lower temperatures, and stable weather conditions.
Cold fronts frequently impact the southern and southeastern regions of Australia during winter. These fronts originate from the Southern Ocean and bring cold air masses, resulting in reduced temperatures, increased cloud cover, and precipitation.
Troughs are elongated areas of low pressure that develop across the interior of the continent or along the east coast of Australia and are often associated with increased cloud cover, rainfall, and sometimes thunderstorms.
Low-pressure systems known as East Coast Lows can form off the east coast of Australia during winter, bringing heavy rain and strong winds.
Blocking patterns occur periodically, characterized by stationary or slow-moving high-pressure systems. These patterns can lead to prolonged periods of stable weather conditions or even drought in certain areas.
Throughout the winter season these synoptic features collectively contribute to the diverse weather across Australia, influencing temperature variations, cloud formations, precipitation levels, and wind patterns.
HOW DOES THE FIRST HALF OF WINTER COMPARE TO THE WINTER WEATHER OUTLOOK ISSUED BY THE BUREAU OF METEOROLOGY?
As we have discussed already, the official outlook from the Bureau of Meteorology was for a very dry winter. But we know that the first half of the season has been anything but dry for most of the country.
 You can see in the image above just how widespread and intense the Bureau was expecting the dry conditions to be in June. Almost the entire continent was forecast to be very, very dry!
If we then compare the forecast with the actual monthly chart, we can clearly see that there has been an enormously different outcome so far, with very wet conditions across a large swath of Australia, particularly through the Central and Southern portions of the country.
The reasons for the largely wet June have been outlined earlier in this article, however the main influence for the above-average rainfall over north-western, inland, and southern Australia was a large moisture-rich northwest cloud band. It formed on a jetstream of strong winds around 8-10 kilometres above the Earth’s surface, and the moisture was then influenced by a strong upper-level trough, generating widespread moderate to heavy rain.
 Due to the widespread cloud and longevity of the rainfall, several record and near-record low maximum temperatures were also recorded across Western Australia (WA), the Northern Territory (NT), and South Australia (SA), where there was a sustained lack of solar heating reaching the surface.
June is usually one of the coldest months of the year, so it makes sense that if record low maximum temperatures are being broken for June, some all-time low maximum temperature records were also being broken or were very close to being broken.
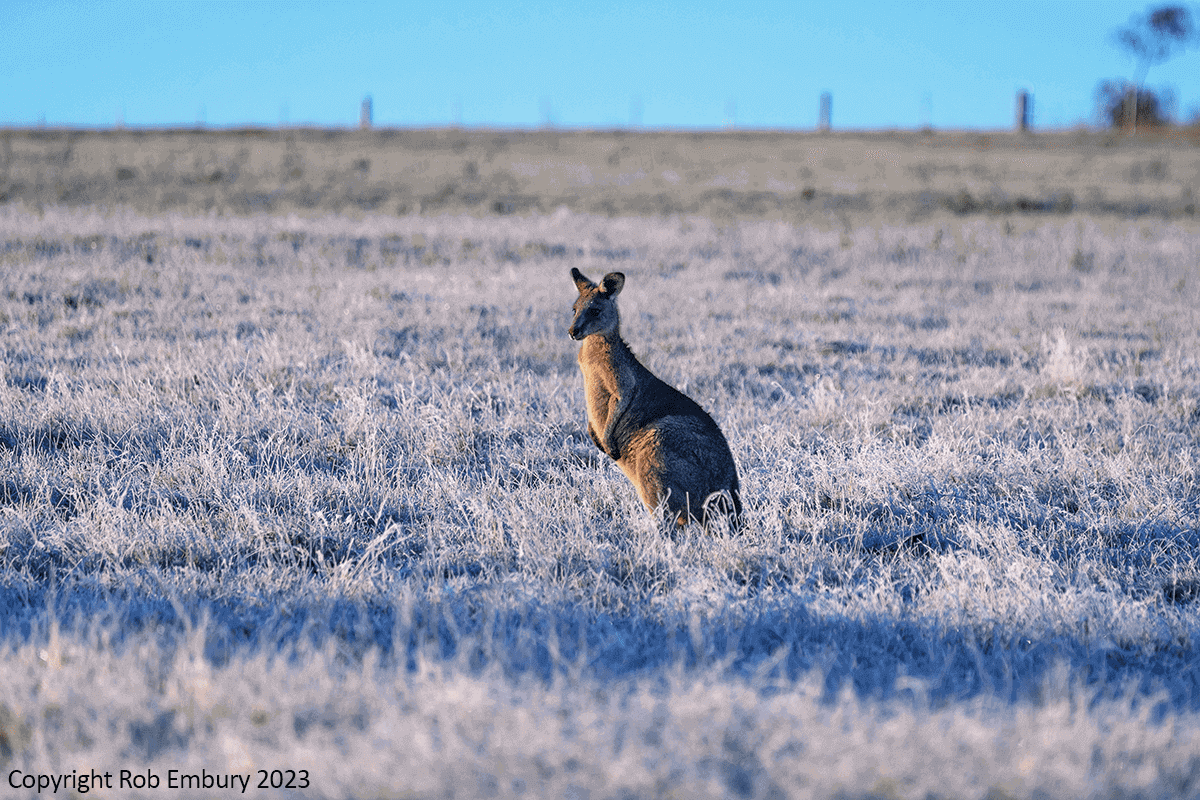
It has been very cold across a lot of Australia!
CLIMATE OUTLOOK FOR THE AUSTRALIAN WINTER – LONG RANGE FORECAST OVERVIEW ISSUED BY THE BUREAU IN MAY
Here is a summary of the climate outlook issued by the Bureau of Meteorology (BOM) in late May 2023 for June to September, encompassing all of the Australian winter and including:
- Below median rainfall is likely, to very likely for virtually all of Australia.
- Maximum temperatures are likely, to very likely to be warmer than the median for virtually all of Australia.
- Above median June to August minimum temperatures are likely, to very likely for much of Australia, with below median minimum temperatures likely for parts of eastern SA and western New South Wales (NSW).
- The Bureau forecast was influenced by several factors, including likely warming in the tropical Pacific Ocean towards El Niño thresholds, the potential development of a positive Indian Ocean Dipole, and record warm oceans globally.
Drier Than Average June to August for Virtually all of Australia
For June, below median rainfall is likely, to very likely for virtually all of the country.
For June to August, below median rainfall is likely for the majority of Australia, increasing to very likely for some southern areas of the country, including southeast parts of SA, most of Victoria (VIC), and northern Tasmania (TAS)
For June to August, much of Australia is at least twice as likely to receive unusually low rainfall, with some parts of southern and north-western Australia more than three times as likely.
Warmer Than Average Days for Virtually all of Australia During June Through August
For June, above median maximum temperatures are likely, to very likely for most of the country, excluding some areas of the top third of Australia.
For June to August, above median maximum temperatures are very likely for most of Australia, decreasing to likely for some areas of the northern tropics.
The southern two-thirds of Australia is at least twice as likely to experience unusually high maximum temperatures from June to August, with areas of VIC, SA, NSW, and western Western Australia (WA) more than four times as likely to experience unusually high maximum temperatures.
For June to August, minimum temperatures are likely to very likely going to be above the median for much of Australia.
THE ODDS WERE STACKED FOR A WORRYING WINTER OUTLOOK
A BoM climatologist was quoted on the winter weather outlook when it was issued as follows by an ABC News reporter:
‘‘It was a worrying outlook, reminiscent of the 2019 winter conditions which, when followed by a dry spring, helped create the dry fuels that fed major bushfires across the country.
“Going past winter, there is high uncertainty, but if it really is as dry as the outlooks say, then that does set up increased bushfire risk in our summer,” he said.
“And for places relying on winter rainfall, especially agricultural areas over southern Australia, then it would be a worry for them.
“Of course, every year is different, and a dry outlook does not guarantee it will happen. Rather, it reflects how the odds are stacked.”
Regardless of how the odds were stacked leading up to the Australian winter, the weather for most of the country this season has not aligned with the long-range forecast overview for June to August or the Winter 2023 Climate and water long-range forecast in the video above.

However, there are recent signs that the weather may have turned a corner and returned to a semblance of normalcy as we enter the second half of winter. Only time will tell if the weather for the remainder of winter aligns more closely with the official outlooks or not.
But for now, at least we have a better understanding of the reasons why the winter weather has been so wet and so cold for such large areas of the country and why the odds that the bureau was banking on with the forecast models do not seem to have been on the money.
EL NIÑO HAS BEEN CONFIRMED IN THE PACIFIC, AND AN EL NIÑO ALERT HAS BEEN ISSUED IN AUSTRALIA. SO WHY AREN’T WE HAVING A DRIER AND WARMER WINTER?
Before we answer this question, let’s take a moment to explain in very simple terms what El Niño is.
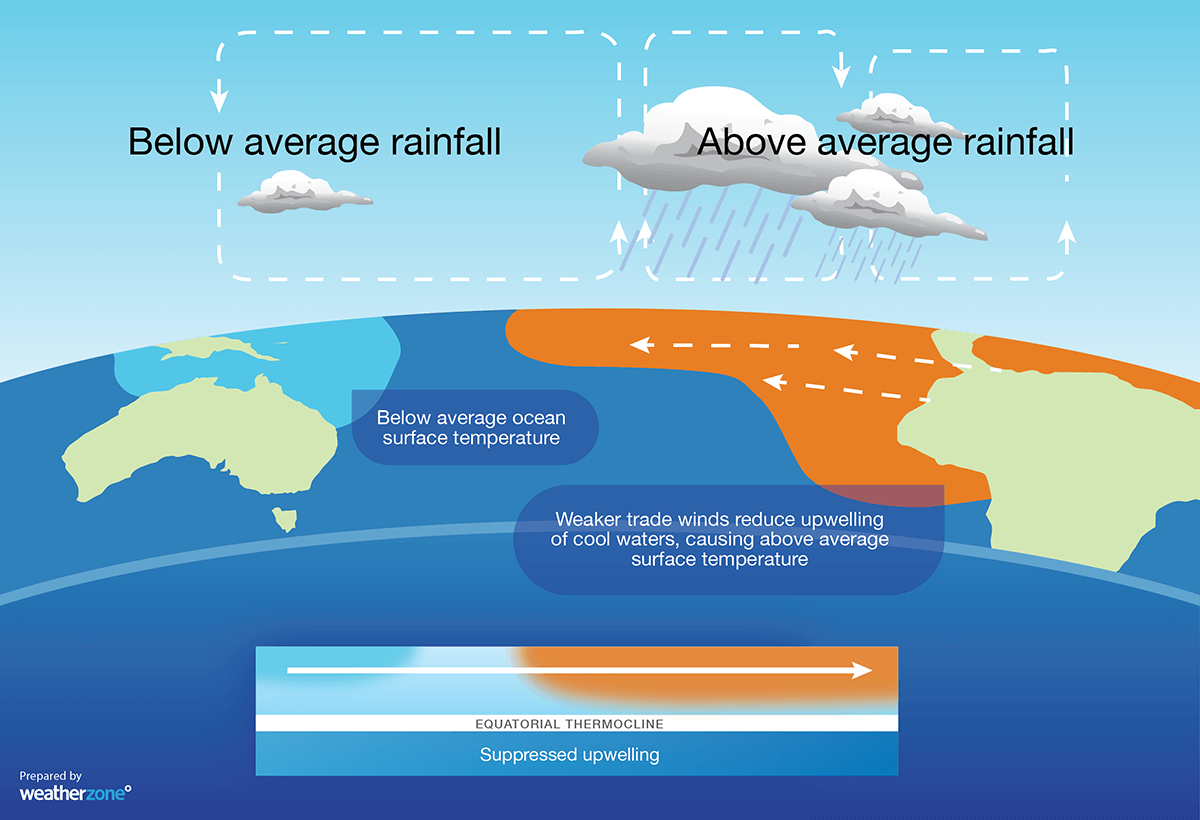
El Niño is a phase of the El Niño-Southern Oscillation (ENSO), which involves the coupled interaction between the ocean and atmosphere in the tropical Pacific region.
It is characterised by unusually warm water in the central and eastern tropical Pacific Ocean and cooler-than-usual water in the western tropical Pacific Ocean. This pattern of abnormal sea surface temperatures typically causes the easterly trade winds that flow across the tropical Pacific Ocean near the equator to weaken or even reverse.
The effects of this phenomenon can drive global climate and dramatically affect Australian weather. Just how intense a developing El Niño will be will somewhat depend on how effectively the ocean and atmosphere work together in the coupled feedback loop, which we mentioned briefly earlier and will explain more in a moment.
 You can read more about El Niño in Australia in this recent article:
EL NINO IN 2023
We keep hearing about El Niño occurring in 2023 and how it will bring warmer and drier weather to Australia. The media love reporting on it and often present a dramatic slant on an emerging El Niño phase focusing on the chances of hot weather, drought, and enhanced bushfire risk, which can be catastrophic for Australia, particularly in the eastern states.
Of course, there are so many variables at play when it comes to our climate and the main drivers, including El Niño, so it is never as simple as it may seem. In addition, weather does not always occur as presented in the media or as forecast by authorities, as we have already covered in this article.
The wet and cold Australian winter thus far seems at odds with the media news narrative earlier this year when ‘possible El Nino’ was announced. And even more-so recently, when El Niño was confirmed by US Authorities and an El Niño Alert was issued by the Bureau of Meteorology in Australia.
Each El Niño event is unique, with some stronger than others. And a switch is not suddenly flicked to enable El Niño to take full effect. It takes time to establish and strengthen through the coupling processes and connection between the ocean and the atmosphere before we see the real impacts on our weather.
It’s little wonder that the general public can become confused, and be a little sceptical about climate and weather when the hype of El Niño doesn’t seem to correlate with the actual weather we are experiencing, especially so far this winter.
What we don’t hear much about at all amongst the hype is the coupling effect which is a relationship between the ocean and the atmosphere during El Niño, and how this critical process locks in the phase and enhances the effects we see in the weather.
When El Niño is described as ‘not coupled yet’, it means that this phase of the ENSO phenomenon is not fully developed or established.
During El Niño, the eastward expansion of the convection and rainfall will depend on how warm the sea surface temperatures become in the eastern Pacific. This means that during weaker El Niño events, we may only see convection and rainfall increase around the Date Line. But during stronger El Niño events, the increase can potentially extend further to coastal South America.
In a coupled state, the oceanic and atmospheric conditions work together, reinforcing the influence of each. During El Niño, warmer-than-average sea surface temperatures in the central and eastern equatorial Pacific are accompanied by changes in atmospheric circulation patterns. These changes can affect global weather patterns.
 If El Niño is not yet coupled, it suggests that the oceanic and atmospheric conditions in the tropical Pacific have not fully synchronized to create a well-defined El Niño event.
The absence of coupling means that the typical atmospheric response and associated impacts on weather patterns may not be fully realised. It indicates that the development and strength of El Niño are still uncertain or not yet pronounced. Essentially, it is too early to know how significant this El Niño will be and certainly too early to be experiencing any direct impacts on our Australian winter weather.
IN SUMMARY
The purpose of producing this article was to compare the wet and cold winter we have experienced in Australia so far to the official Winter Weather Outlook issued by the Bureau of Meteorology and to explain why the wet and cold Australian winter ‘seems’ to be in direct contrast to the media and online hype and what we would normally expect from an El Niño event.
We explored some complex topics and presented them in a manner that was intended to be interesting, and as simple to understand as possible. We now have a better understanding of the climate drivers influencing our unusually wet and cold winter weather so far, and that El Niño is still developing, with its effects not yet impacting Australian weather.
Sources & Credits:
NOAA, Rob Embury, WA DPIRD, National Museum of Australia, Weatherzone, NASA, NOAA Pacific Marine Environmental Laboratory, Bureau of Meteorology, Windy
See also:
El Nino Alert Declared for Australia. What Is El Nino and How Will This Impact Australians?