Arctic sea ice extent 2021 is among the highest in recent years, thanks to a cool summer and autumn, particularly in the western Arctic Ocean. A marked negative anomaly affects instead the Hudson Bay still almost entirely free of ice, delayed by more than a month.
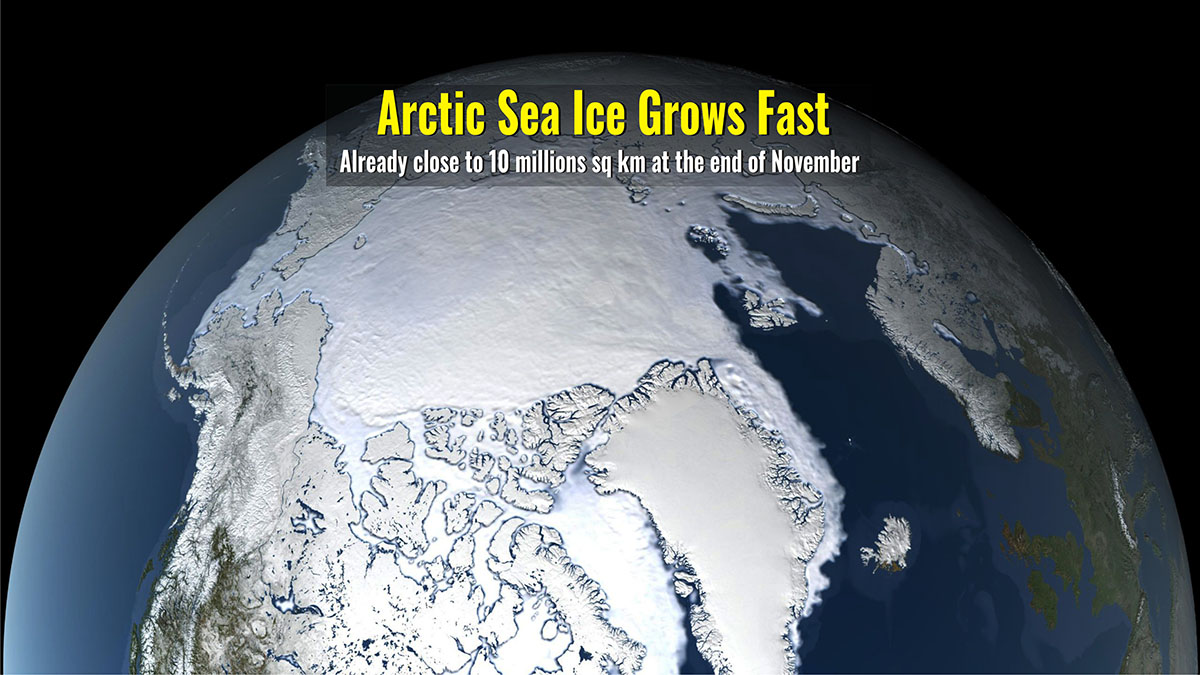
ARCTIC SEA ICE IS GROWING FAST THIS YEAR
The Arctic sea ice extent is actually growing faster than in the latest years. By the end of November, its extent was 9.77 million square kilometers (3.77 million square miles) which is just within the interdecile range according to the National Snow & Ice Data Center of Boulder, Colorado (US).
The interdecile range is a measure of statistical dispersion of the values in a set of data. This means it is actually within the normal sea-ice inter-annual variability, although in the lower part of it. Sea ice extent is actually much higher than average in the Bering Sea. Here, the ice formed along the eastern part of the Siberian coast relatively early compared to recent years
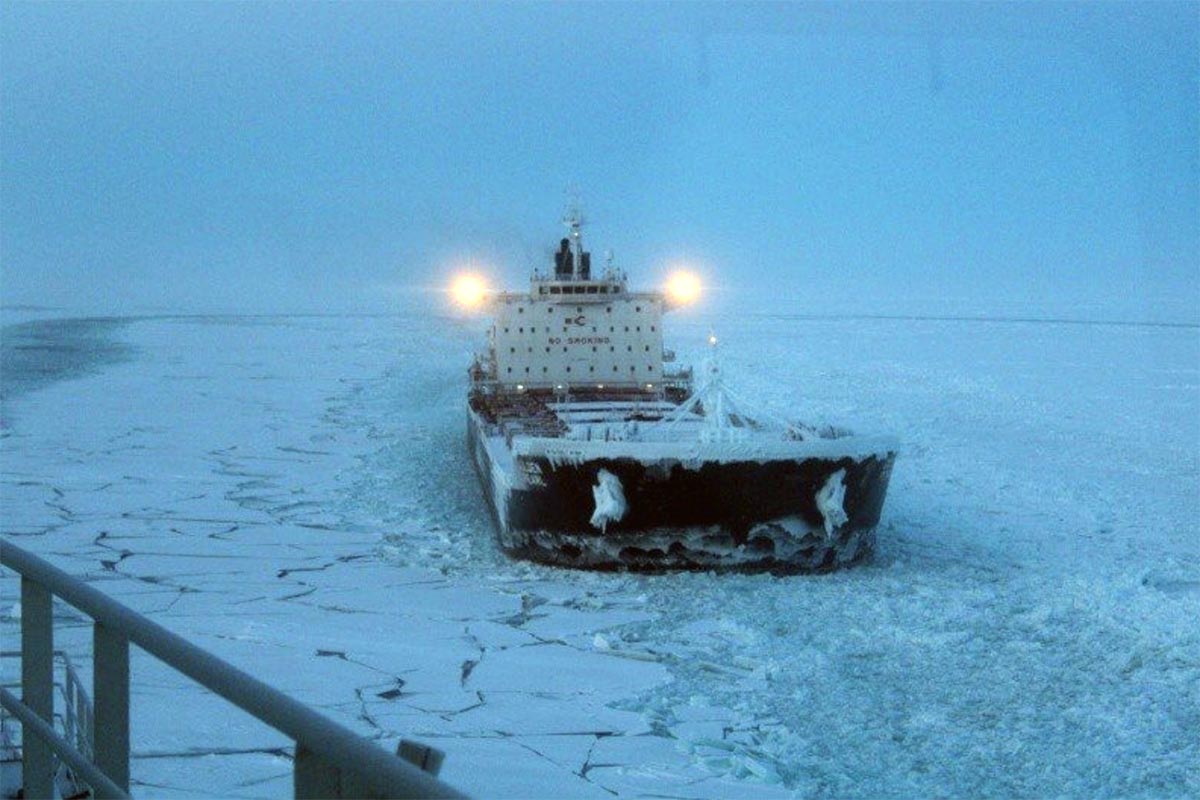
For this reason, several cargo ships transiting through the Northern Sea Route were caught by surprise. Several of them became frozen in, and are now waiting for icebreakers to free them. Several could be stranded for months as they wait for icebreakers to reach them
Shipowners had assumed this month would be no different from recent years. Infact, warmer weather triggered by global warming allowed ships to cross parts of Russia’s Northern Sea Routes in November without any help from icebreakers.
However, Sea Ice grew fast up to 30 cm thick across most of the Laptev Sea and East Siberian seas, according to the Barents Sea Observer. The waters along the eastern parts of the sea route were ice-covered already in late October, which is several weeks earlier than normal.
The present situation originated about October 25th, according to the University’s Center for High North Logistic (CHNL), which has carefully tracked the situation unfold.
In November 2021, a total of 24 vessels traveling along the route became stuck in sea ice and required icebreaker assistance. If all this was also a matter of negligence is not clear, but we are not entitled nor sufficiently informed to unraveling such aspects.
Therefore, let’s see what’s happening in the Arctic this year and why the ice concentrations and extent are higher than average in some sectors. But first of all, let’s see how sea ice is defined. In the video below the sea ice extent in the Arctic is updated every 5 days from half October to the end of November.
WHAT SEA ICE IS
Sea ice means all sorts of ice that form when seawater freezes. Sea ice that is not fast ice is referred to as drift ice, and, if the concentration exceeds 70%, it is called pack ice. When sea ice concentration is lower than 15% this is open water, and the boundary between open water and ice is called the ice edge.
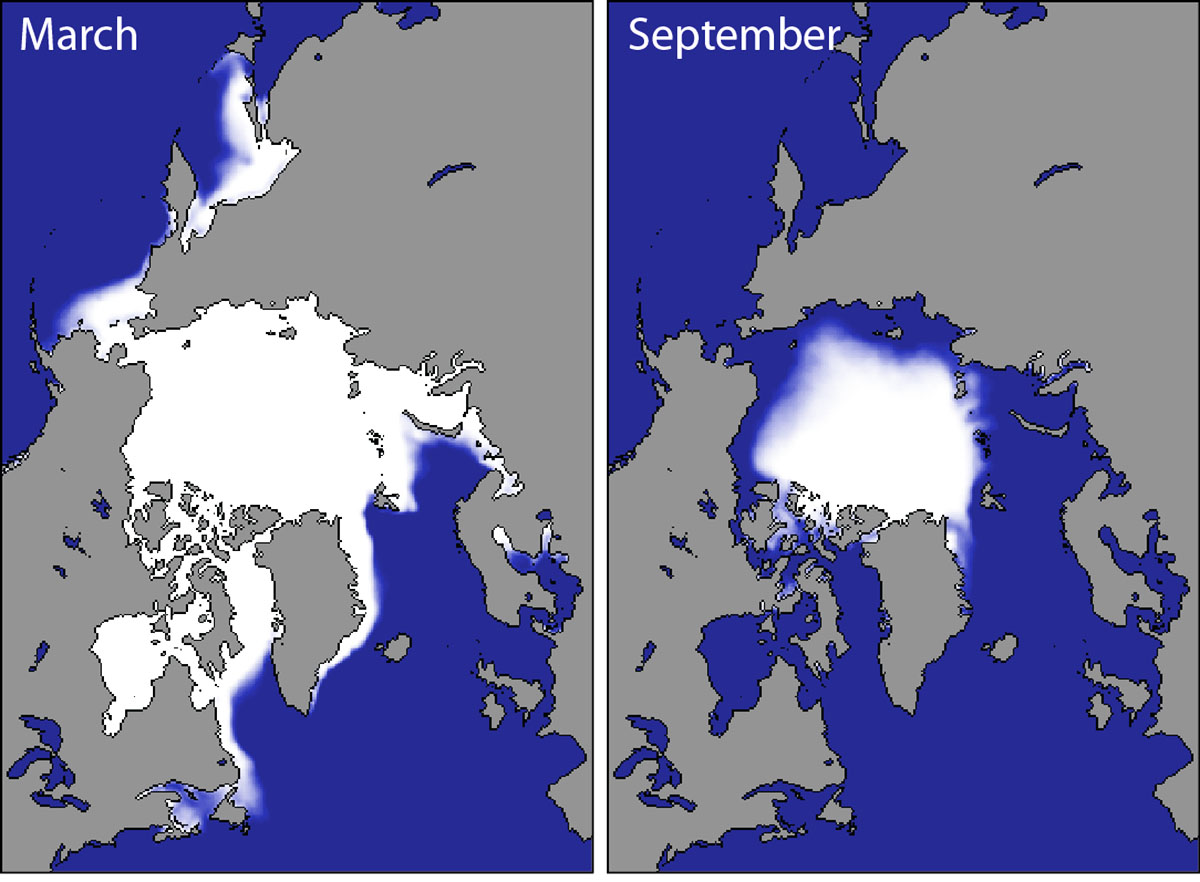
Sea ice cover in the Arctic grows throughout the winter and peaks in March. In September the sea ice extension reaches its minimum, which is generally only around one-third of its winter maximum. In order to get a proper picture of the sea ice state, there is the need of determining both extents and volumes. Such numbers primarily include the ice thickness, generally linked to the age of the ice.
In the image below, Arctic sea ice climatology from 1981-2010 by the Snow and Ice Data Center, University of Colorado, Boulder.
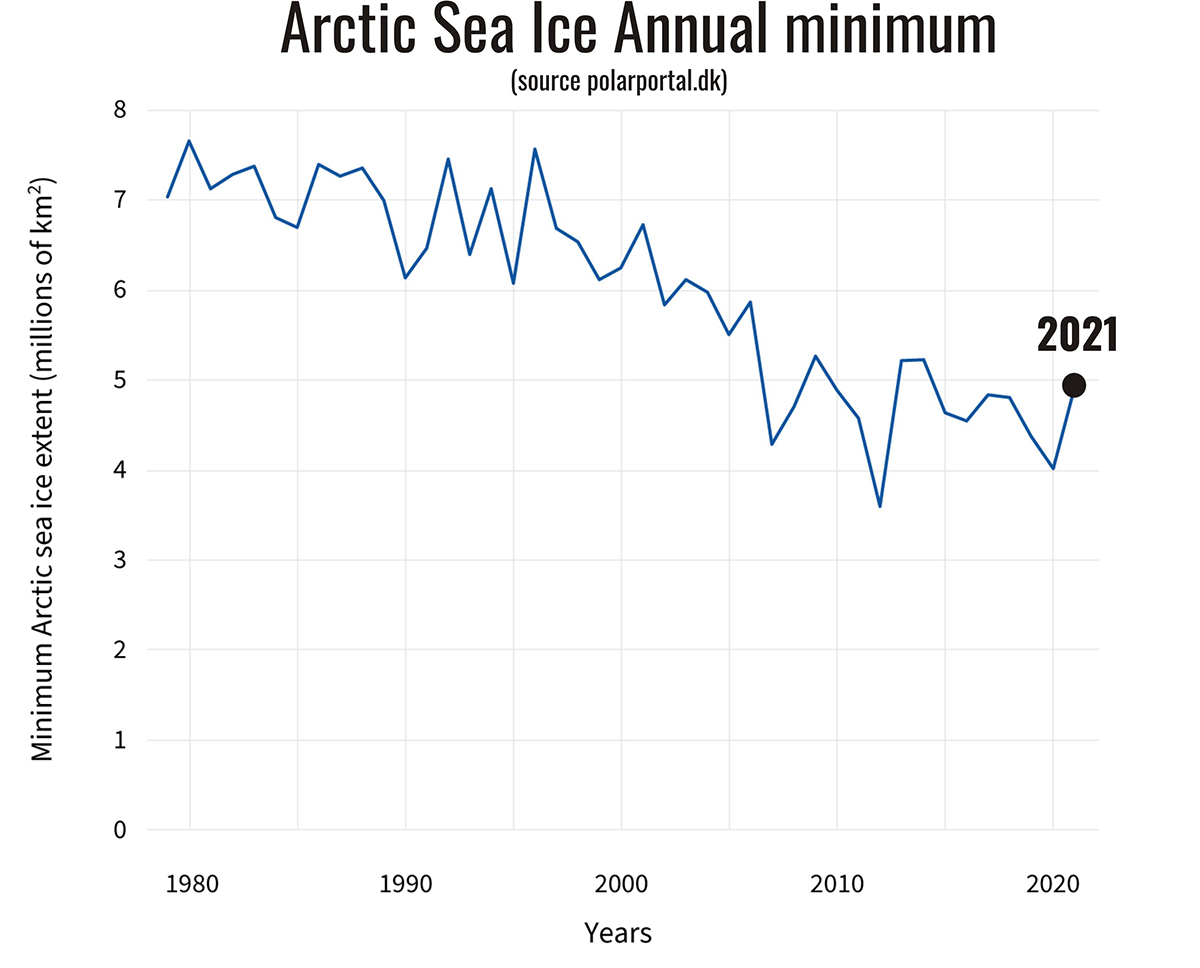
This year, sea ice has reached its minimum extent on September 16th but it was far from the lowest on record and was actually just the 12th lowest in the past decades. The main reason for that is the colder than average weather in the western Arctic Ocean which slowed down sea ice to melt in the Canadian and Alaskan regions.
The 2021 minimum sea ice extent was around 4.724 million square kilometers, roughly 1.6 million square kilometers lower than the long-term mean. A northern hemisphere’s strong negative height anomaly in the geopotential height in late summer kept the western Arctic cooler and reduced the ice melting.
Not only air temperature, but sea temperature as well were colder than normal in the western Arctic sector last summer. This was certainly a favorable trigger contributing to fast and earlier freezing in this Arctic sector when the fall season started.
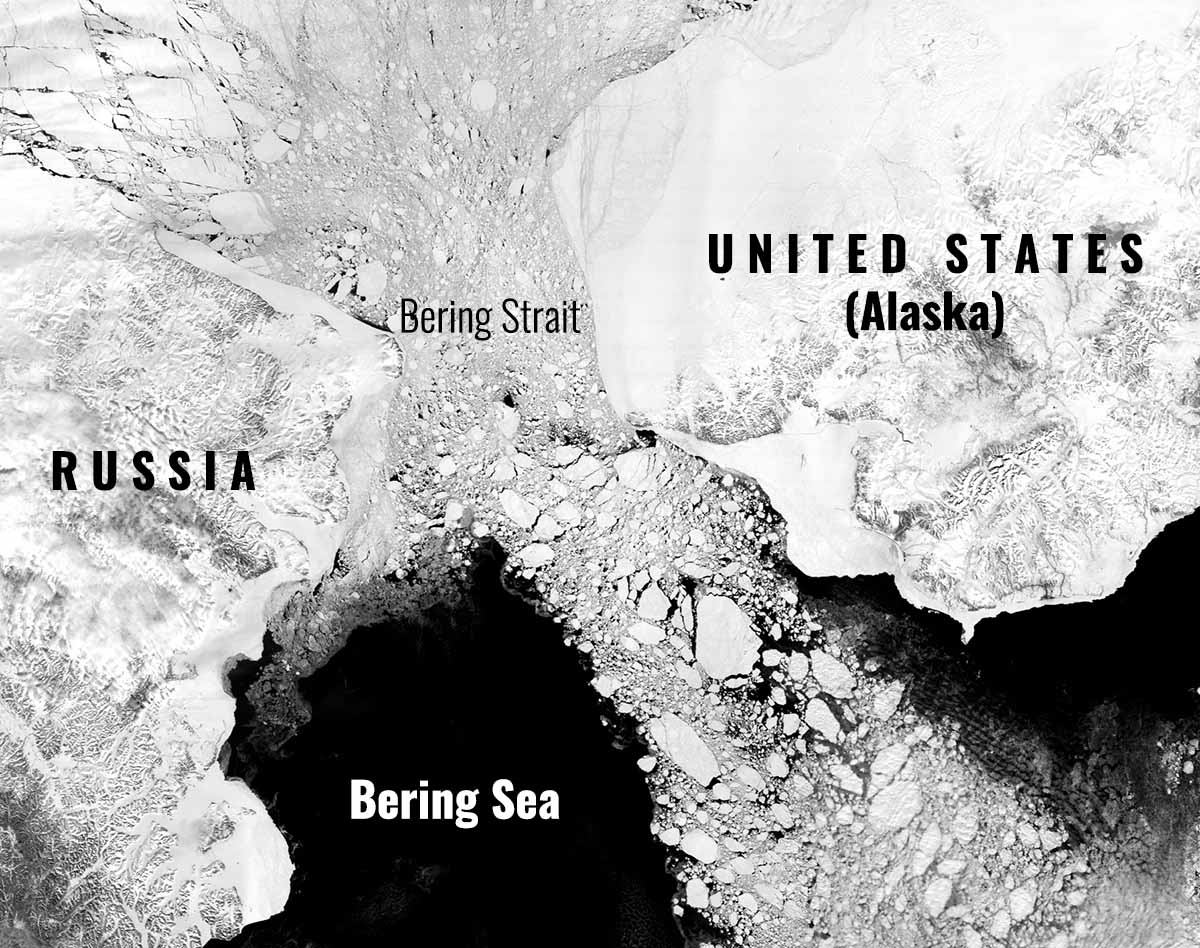
This sector of the Arctic Ocean is rather important. The Bering Strait in particular is one of the few outlets through which sea ice exits the Arctic Ocean. In the image below from NASA Earth Observatory image by Joshua Stevens and George Riggs using data from Terra MODIS, the Bering Strait divides Alaska from Russia.
As a matter of fact, although low, sea ice extent anomaly in summer 2021 stopped falling around July 10th then reduced and kept stable in August and September, rapidly reducing further throughout October and November.
In the picture below the Arctic sea ice extent anomalies for each year from 1979 to 2021 (satellite-era; NSIDC, DMSP SSM/I-SSMIS). Anomalies are calculated using a 5-day running mean from a climatological baseline of 1981-2010. 2021 is highlighted with a yellow line.
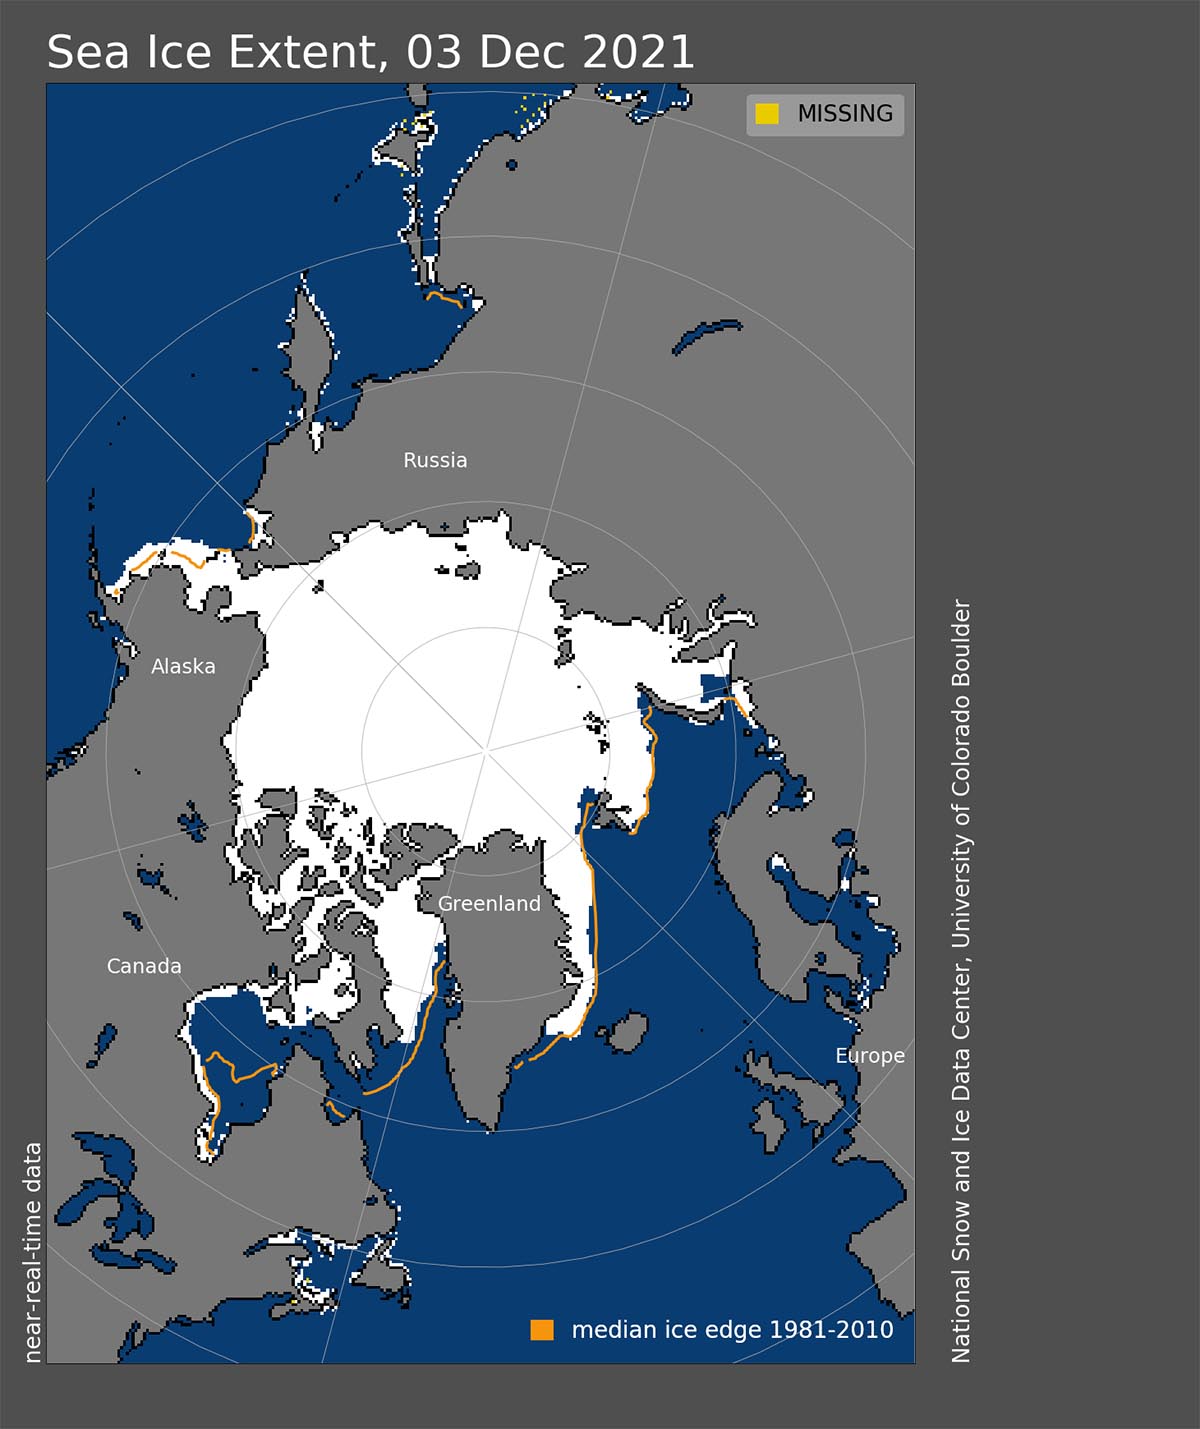
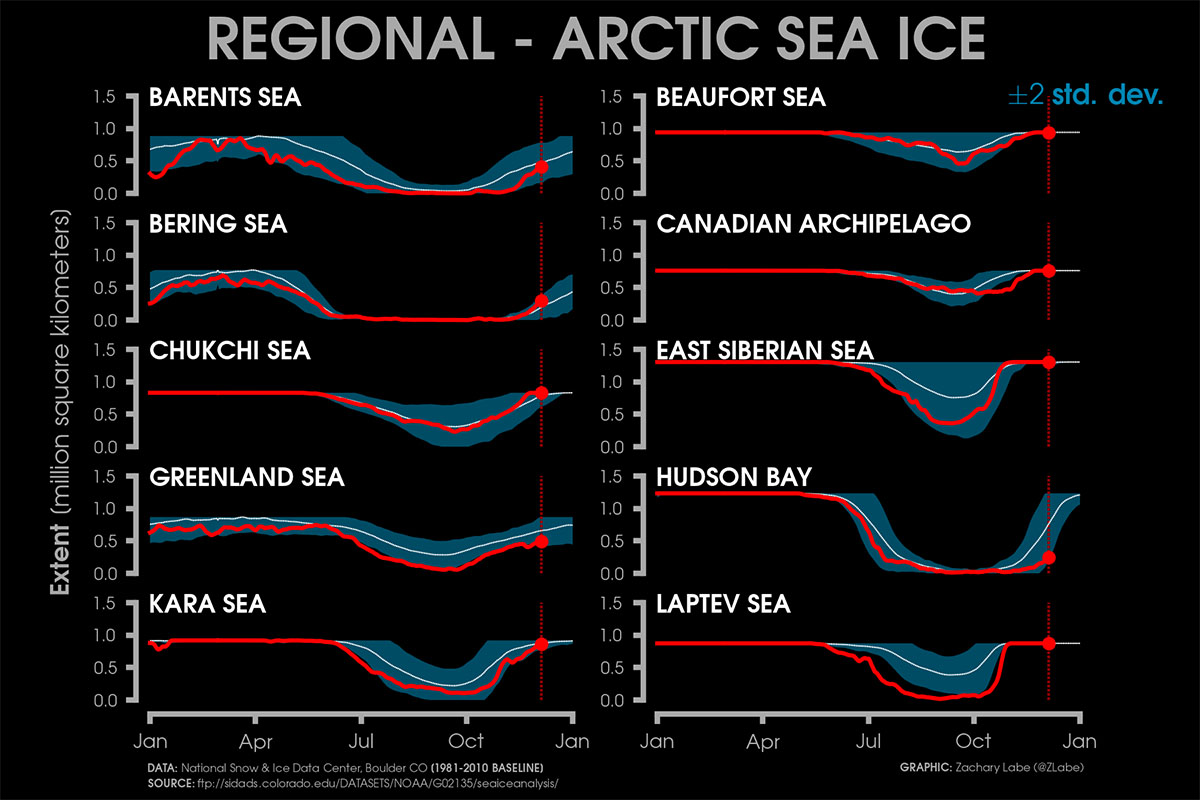
The present situation is mainly due to the contribution from the western Arctic sectors, namely the Bering Sea, the Chukchi Sea, and the East Siberian Sea. In the picture below the current regional Arctic sea ice extents with the red line are compared to the average and two standard deviations from the 1981-2010 mean.
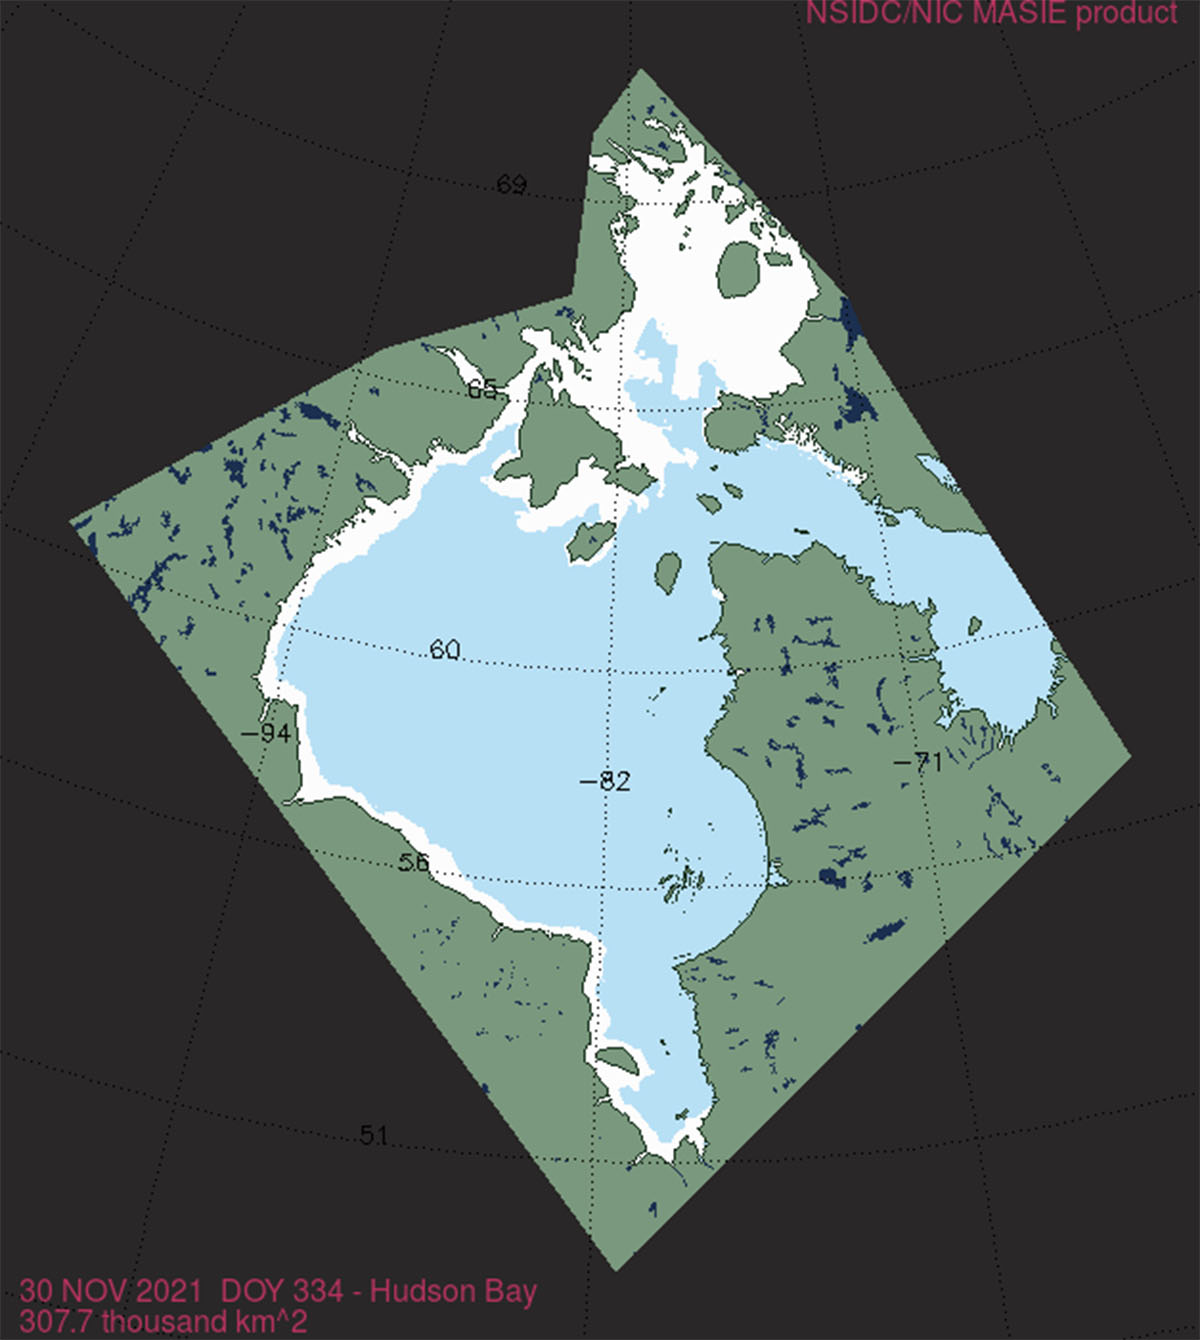
Other sectors are running well below average as the Greenland Sea, the Barents Sea, and the Hudson Bay. Particularly, in sharp contrast with other sectors, sea ice is extraordinarily low in the Hudson Bay which remained unusually ice-free through November. Generally, Hudson Bay starts freezing up by early November, and the northern part of the basin is typically entirely iced over by the end of the month.
Only the far north of the Hudson Bay has frozen over at the end of November 2021. The rest of the bay is almost completely ice-free except for a long, narrow band of ice along the western coastline. The NSIDC reports that this is the second-lowest sea ice extent in Hudson Bay at this time of the year, above only 2010.
The map below reports in detail the sea ice extent on November 30th thanks to the Multisensor Analyzed Sea Ice extent products of the NSIDC.
WHAT WEATHER PATTERNS WERE ASSOCIATED WITH THIS INCREASE IN SEA ICE?
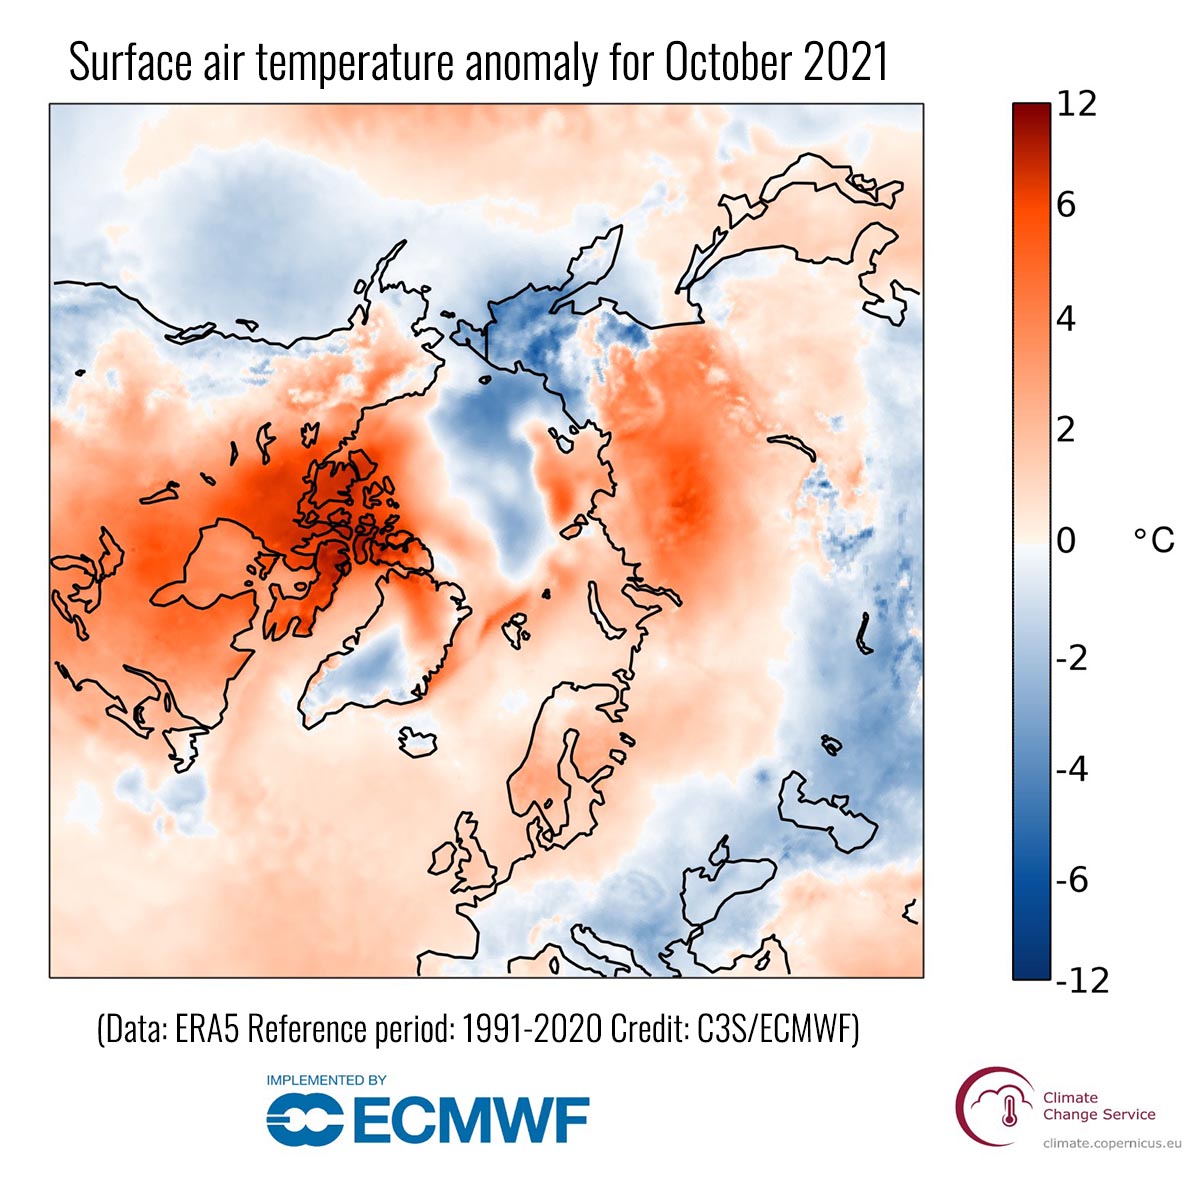
To try to understand the causes at the base of such anomalies, we have to analyze the weather patterns of October as well. The Northern Hemisphere anomaly pattern in October was characterized by regional contrasts in the Arctic, primarily controlled by the dominant jet stream configuration.
The Arctic Ocean was generally characterized by low temperatures.
Eastern Siberia and part of Alaska were much colder than average with anomalies around -10°C in some areas. In contrast, western Siberia and in particular most of Canada were relatively warm.
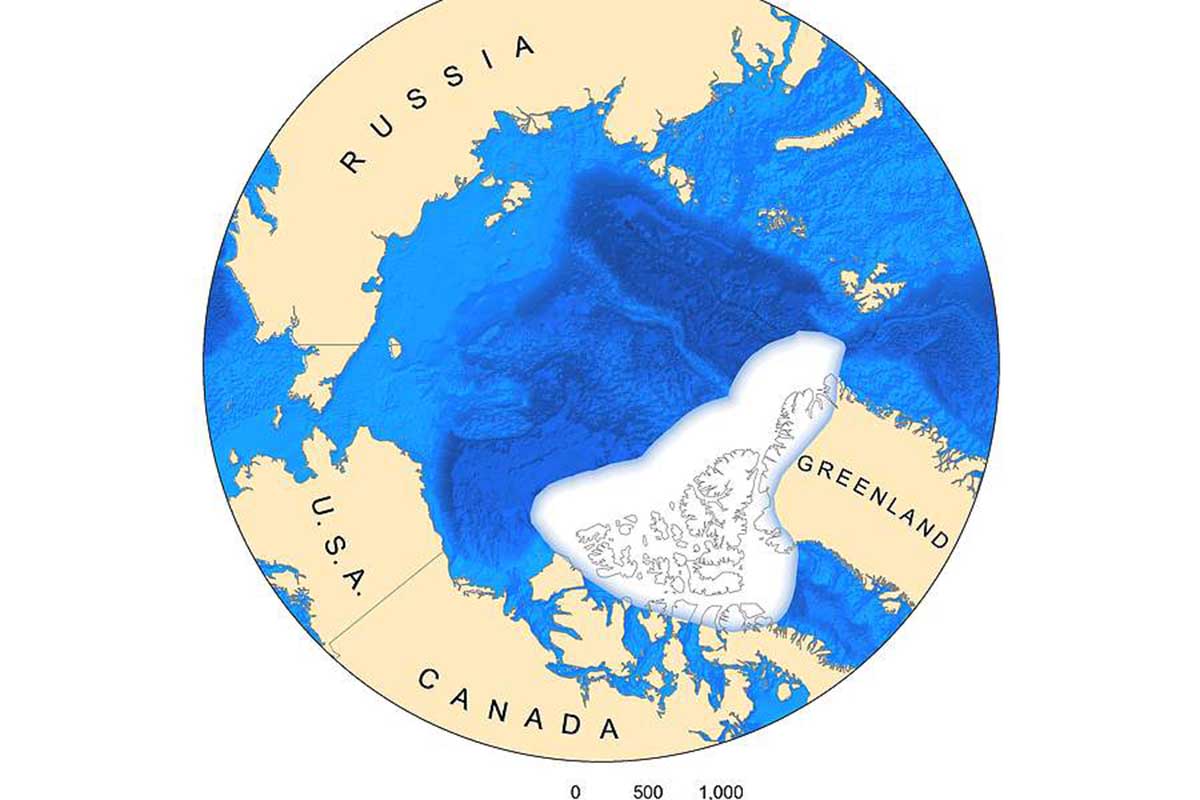
A huge area between Ellesmere Island, Baffin Island, Resolute, Victoria Island and Iqaluit were much warmer than normal. This is very close to the so-called Last Ice Area where the oldest sea-ice of the Arctic still survive
The Last Ice Area refers to the predicted summer sea-ice extent projected to the year 2040 and beyond. In the Last Ice Area, ice is the thickest and the oldest in the Arctic, mainly because ice circulation tends to keep it pressed against the northern coasts of Ellesmere Island and Greenland.
The oldest sea-ice which lasted for more than 4 years, represents today only a miserable part of the total ice. In 1985 the > 4 years old sea-ice represented 35% of all the Arctic ice-pack. On the contrary, the youngest ice with less than 1 year of age, represent the majority of the ice-pack today. It covers an area of about 3.1 million square kilometers (1.2 million square miles), 70% of the total sea-ice area
Temperature patterns in the Arctic, already in October, generally led to a quick recover of sea ice after the summer minimum, and the 2021 situation was definitely much more positive then in October last year.
But around the Last Ice Area the situation was inverted.
The very warm conditions led to the melting of a lot of snow, warmed the ground and in particular the marine surface which has a much lower albedo. A textbook combination of positive feedback effects.
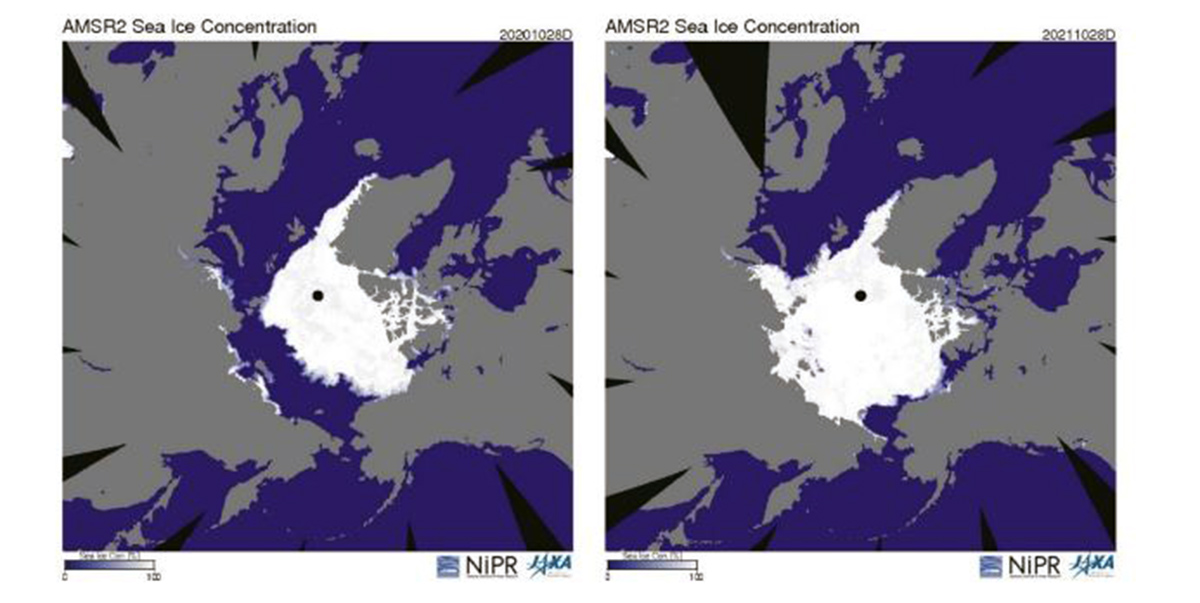
In the image below, diagrams show Arctic sea ice extent and concentration 28 October 2020 (left) and 2021 (right), according to the Japan Aerospace Exploration Agency (JAXA). The lack of ice is also clearly visible compared to 2020, which instead saw generally much lower sea ice extent than in 2021.
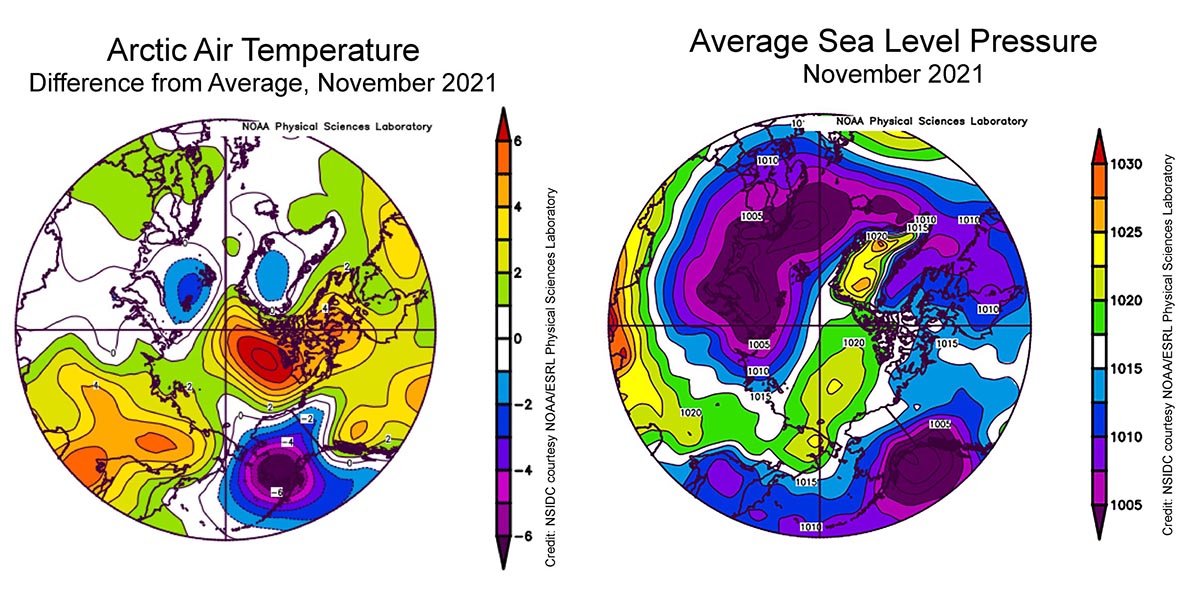
The same Arctic Air Temperature pattern as October was in place throughout November as you can easily see from the map below showing the departure from average air temperature (in degrees Celsius) in the Arctic at the 925 hPa level (source NSIDC).
This temperature pattern was mainly caused by a widespread low pressure over the Atlantic side of the Arctic, combined with a high in the Beaufort Sea. A strong low pressure over Alaska then led to a circulation pattern east of the Bering Strait that brought in cold air from the north. This circulation pattern is favorable for ice growth and may explain the observed positive anomaly.
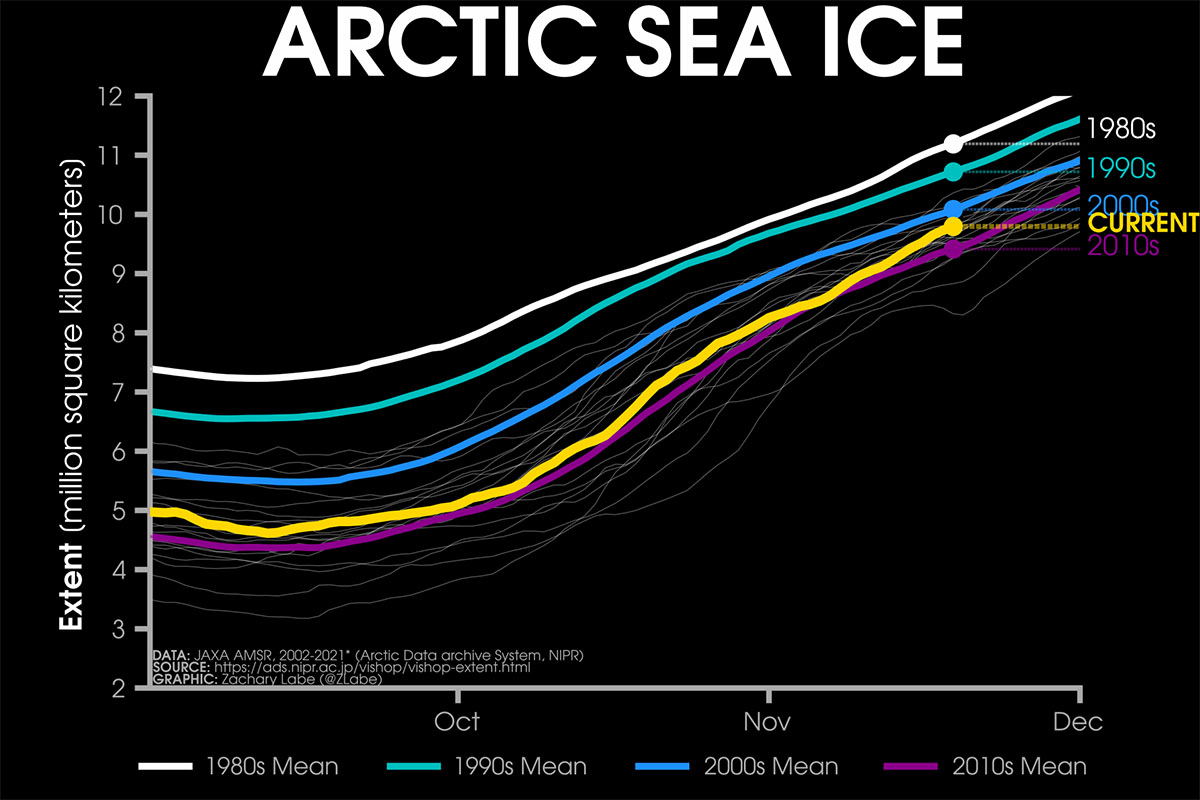
The essence of the speech, in the end, is that the current condition of sea ice is the best in the last 8 years and in line with the normal trend of the years 2000-2010. To find a year with significantly more sea ice you have to go back in time to 2008
What has just been said is well expressed in the image below edited by Zachary Labe, source ads-nipr

The extent of sea ice in the Arctic has important implications for global climate and weather, both in North America and Europe. In particular, for example, it has recently been seen that decreasing sea ice in the Arctic has strong impacts on precipitation in northern Europe.
The sequence of 6 consecutive wet summers from 2007 to 2012 was extraordinary, although none of these individual events were unprecedented in historical records.
Scientist in a dedicated paper published on the Journal Environmental Research letters > state that observed wet summer months in northern Europe tend to occur when the jet stream is displaced to the south of its climatological position. In their simulation, Arctic sea ice loss induces a southward shift of the summer jet stream over Europe and increased northern European precipitation.
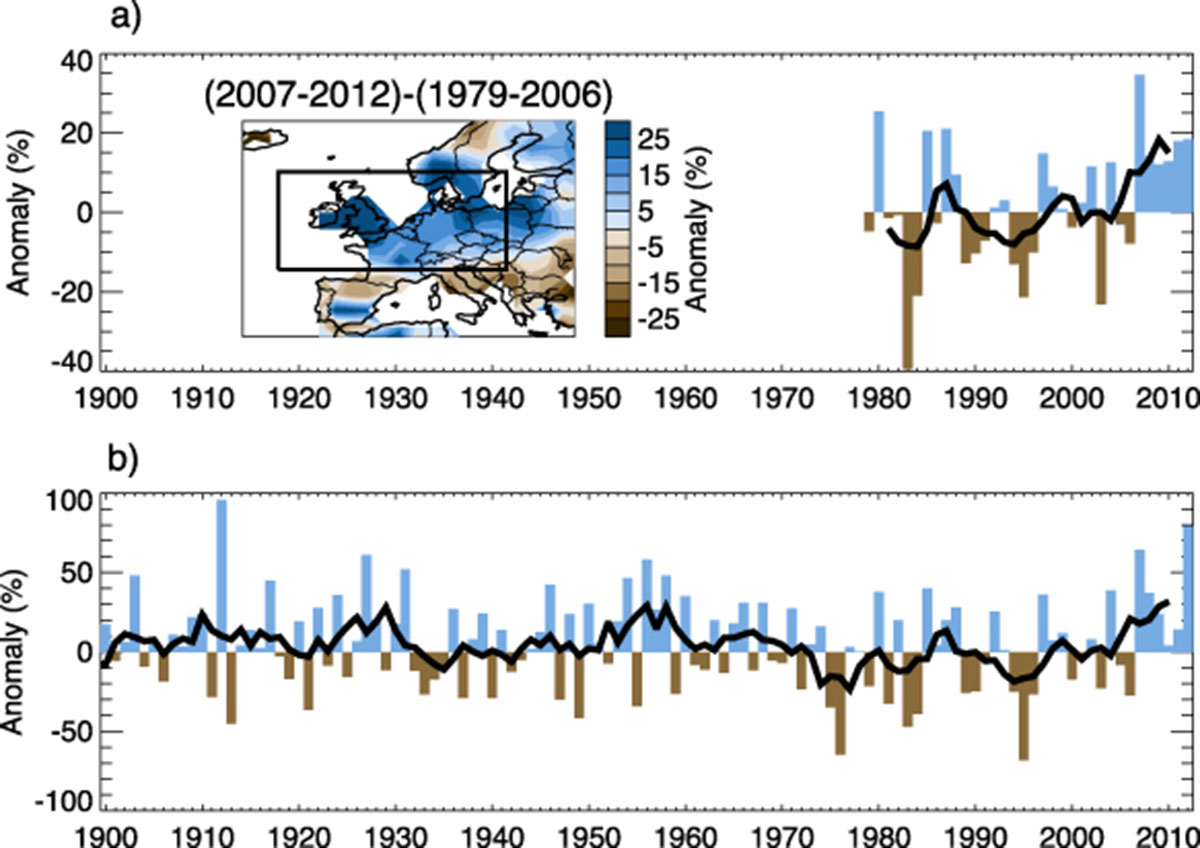
In the image above, Summer precipitation anomalies (% from 1981 to 2010 average) averaged over northern Europe. The inset map shows the precipitation anomalies in the period 2007–2012 relative to the period 1979–2006. (b) Time-series of summer precipitation anomalies (% from 1981 to 2010 average) for England and Wales. The black curves show 5-year running means.
It will definitely be intriguing to watch the evolution of sea ice extent over the coming weeks and months, particularly at a time when global warming is traveling at a rapid pace. At the moment, the Arctic continues to increase its sea ice extent at a steady pace, and if this trend continues in the coming months, there may be important repercussions for next spring’s synoptic and meteorological conditions.
We will keep you updated on this and much more, so make sure to bookmark our page. Also, if you have seen this article in the Google App (Discover) feed or social media, click the like button (♥) to see more of our forecasts and our latest articles on weather and nature in general.
SEE ALSO: