A first look at Winter 2022/2023 forecast shows an obvious influence of the third-year La Nina phase. It will modify the jet stream pattern over North America and the Pacific Ocean, extending its reach to the rest of the world. But there is a new ocean anomaly emerging that will also play its part.
To try and understand the Winter season, we must realize that there are many “drivers” of weather. Global weather is a very complex system, with many large-scale and small-scale climate influencers. We will first examine what this La Nina really is and how it will influence the Winter season of 2022/2023.
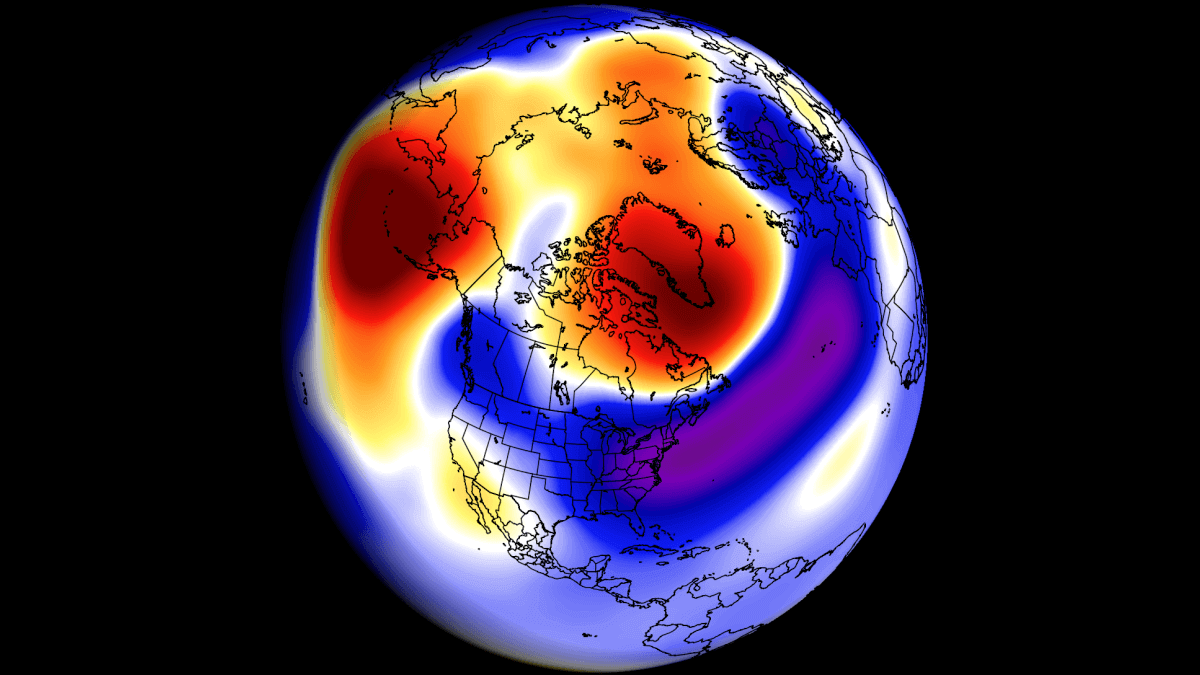
Below we have a pressure pattern of a La Nina winter in 10/11. A blocking high pressure over Greenland and North Pacific, with low pressure and colder air from the United States into Europe. This is what every winter fan in Europe and the United States hopes for every winter. But we will see if we can find any similar trends in the first Winter 2022/2023 forecast.
WEATHER FROM THE OCEAN
Oceans cover over 70% of the planet’s surface and play a significant role in the Earth’s climate system. In the image below, you can see the air-sea interaction. It is rather complex, but you can see a two-way system with many small and large-scale factors.
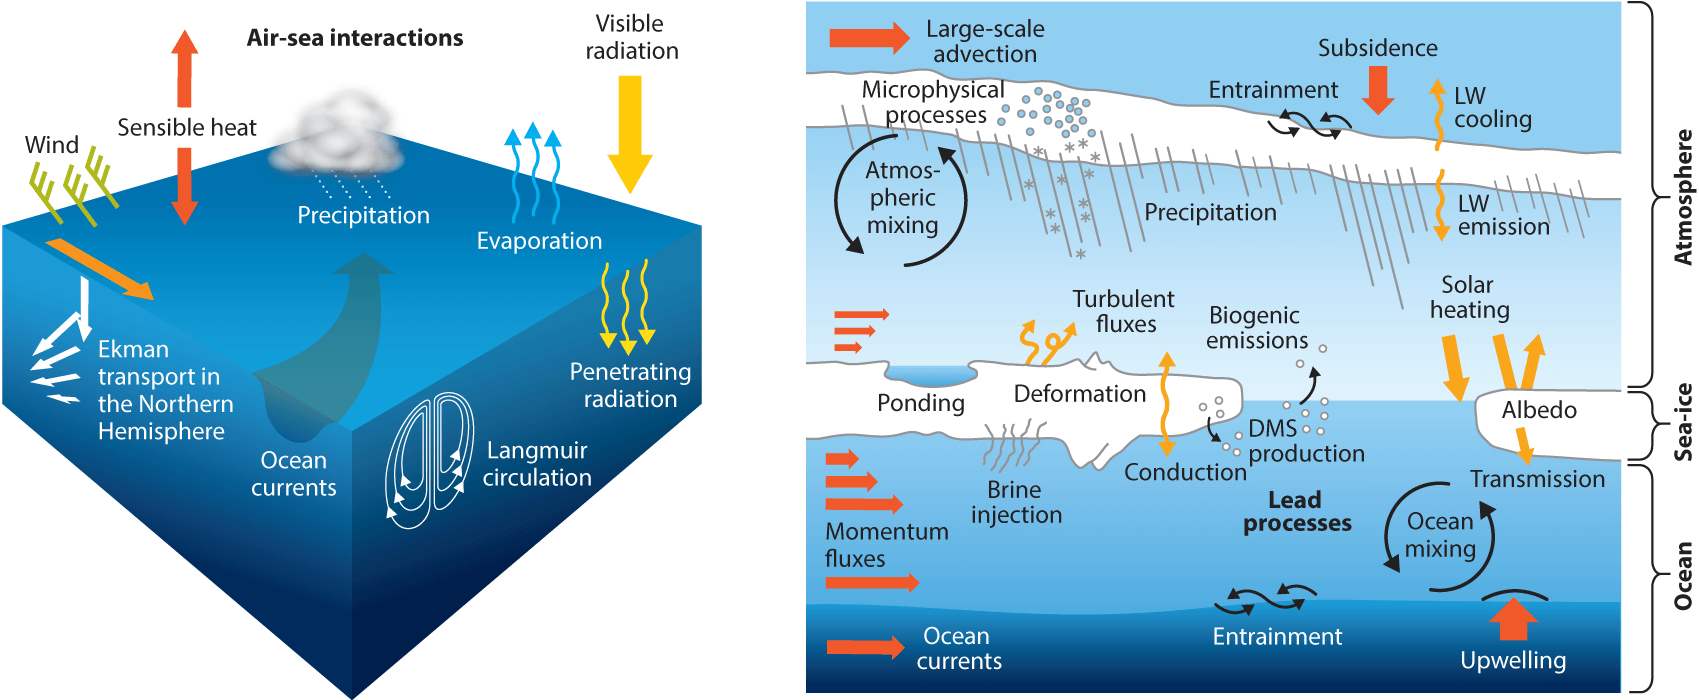
The key here is the word “two-way.” For example, we sometimes look at the ocean anomalies and how they will influence our long-term weather, while the weather also influences the ocean anomalies.
The tropical trade winds are a vital connection between the oceans and the weather. They can mix the ocean surface layers and change the ocean surface currents and temperature. That can then lead to changes in precipitation and pressure distribution.
But what are the trade winds? The trade winds are steady and persistent, blowing towards (and along) the Equator in both Hemispheres. In the image below, you can see the prevailing global winds, with trade winds marked yellow and red.
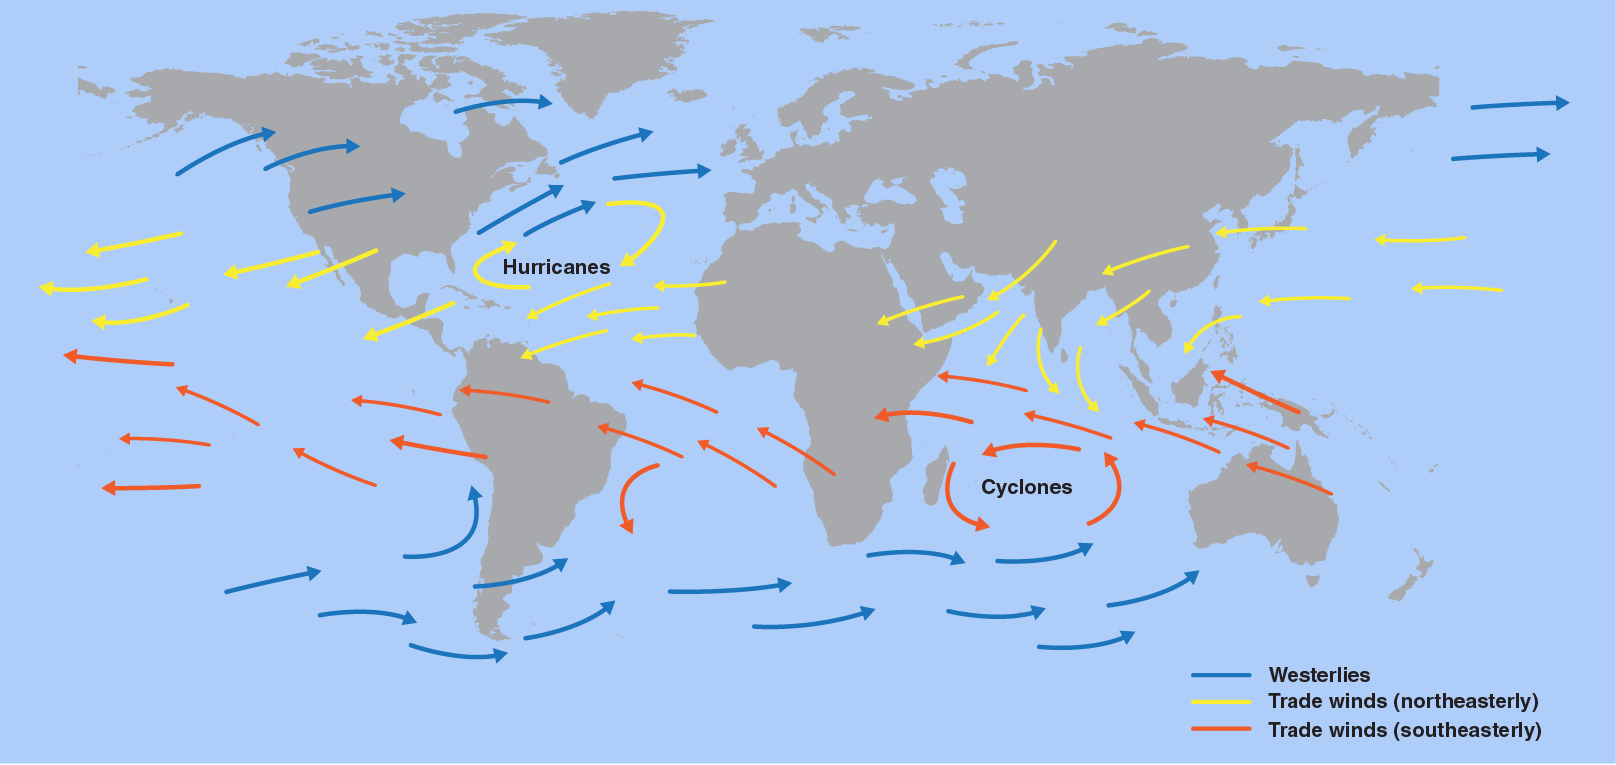
Depending on their strength and direction, they can create strong temperature anomalies on the ocean surface.
So it is very important to note that while the oceans can play their climate role directly, they are also changing due to the weather patterns.
Several oceanic regions across the world hold significance in one way or another. We can have monthly, seasonal, or decades-long anomalies in the oceans. They can sometimes tell us a small part of what is to come in the future.
Looking at the latest ocean anomalies, we have marked two main global regions that we are currently watching for Winter 2022/2023 development. Each has its role and significance in different areas and time scales.
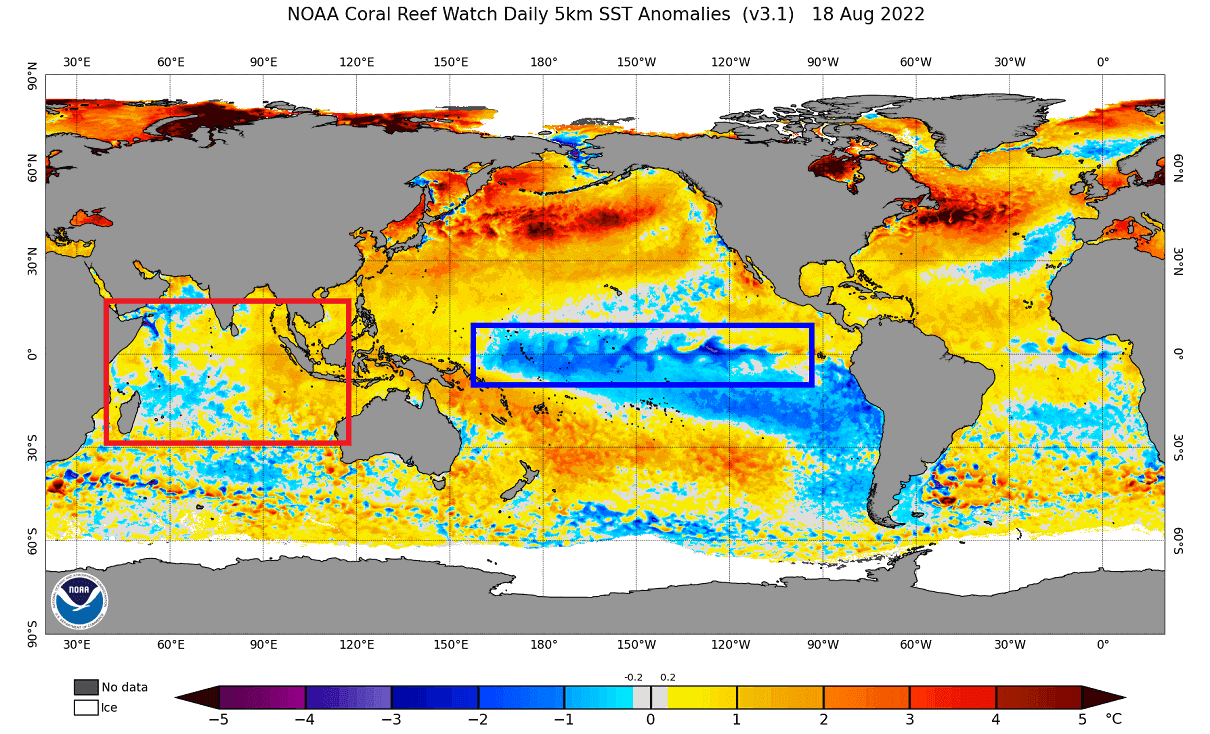
In the center is the El Nino Southern Oscillation or ENSO. This is one of the most well-known ocean oscillations, with an especially strong influence during the winter.
On the left side (red box), you can see the Dual Mode Index (DMI). It oscillates based on the temperature difference between the east and west Indian oceans.
We will briefly cover both these regions with basic information, analysis, and forecast. And also, we will look at the historical pattern associated with these anomalies and what they can tell us for winter 2022/2023.
ENSO AND WEATHER PATTERNS
ENSO is short for “El Niño Southern Oscillation.” This region of the equatorial Pacific Ocean changes between warm and cold phases. Typically there is a phase change around every 1-3 years.
The cold phase is called La Nina, and the warm phase is called El Nino. We are currently in a La Nina phase, entering its 3rd year, which is a rare occurrence.
ENSO significantly influences tropical rainfall, pressure patterns, and the complex exchange between the ocean and the atmosphere. We observe large-scale pressure changes in the tropics with each new developing phase. With some delay, these changes affect the circulation over the rest of the world.
The image below from NOAA Climate shows the typical circulation during a cold ENSO phase. Air descends in the eastern Pacific, promoting stable and dry weather. At the same time, the air is rising in the western Pacific, with a lot of rainfall and lower pressure.
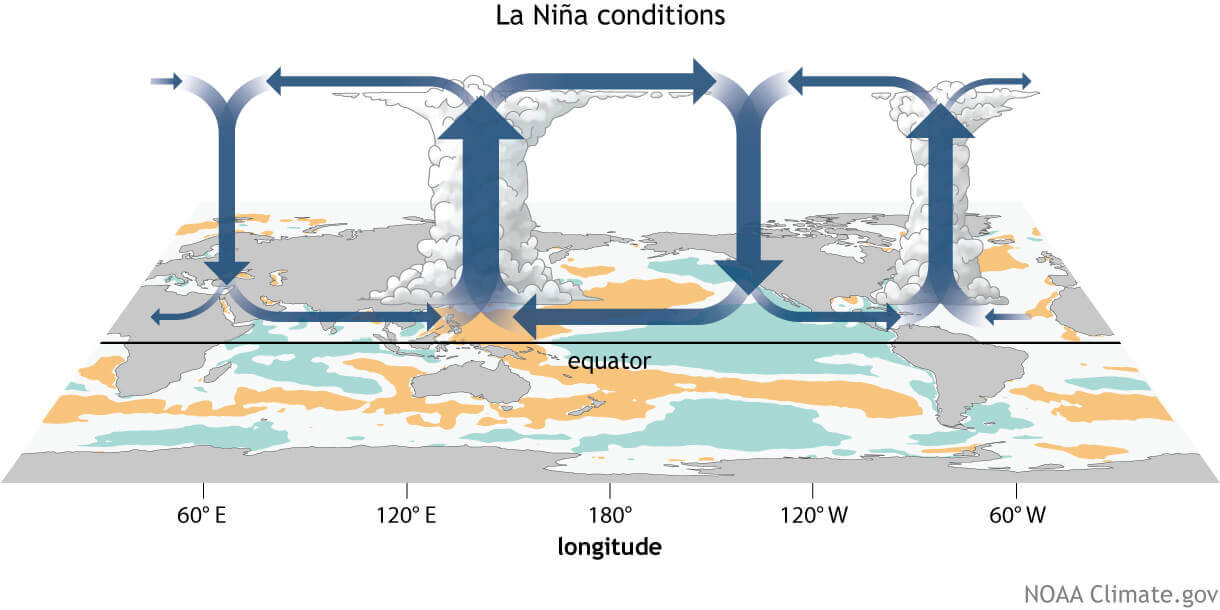
This way, ENSO significantly impacts the tropical rainfall and pressure patterns and thus impacts the ocean-atmosphere feedback system. Through this ocean-atmosphere system, the ENSO influence spreads globally.
Below we have the latest surface analysis of the tropical Pacific Ocean. We can see the cold anomalies over the marked ENSO regions. That is the currently active La Nina entering its third-year phase.
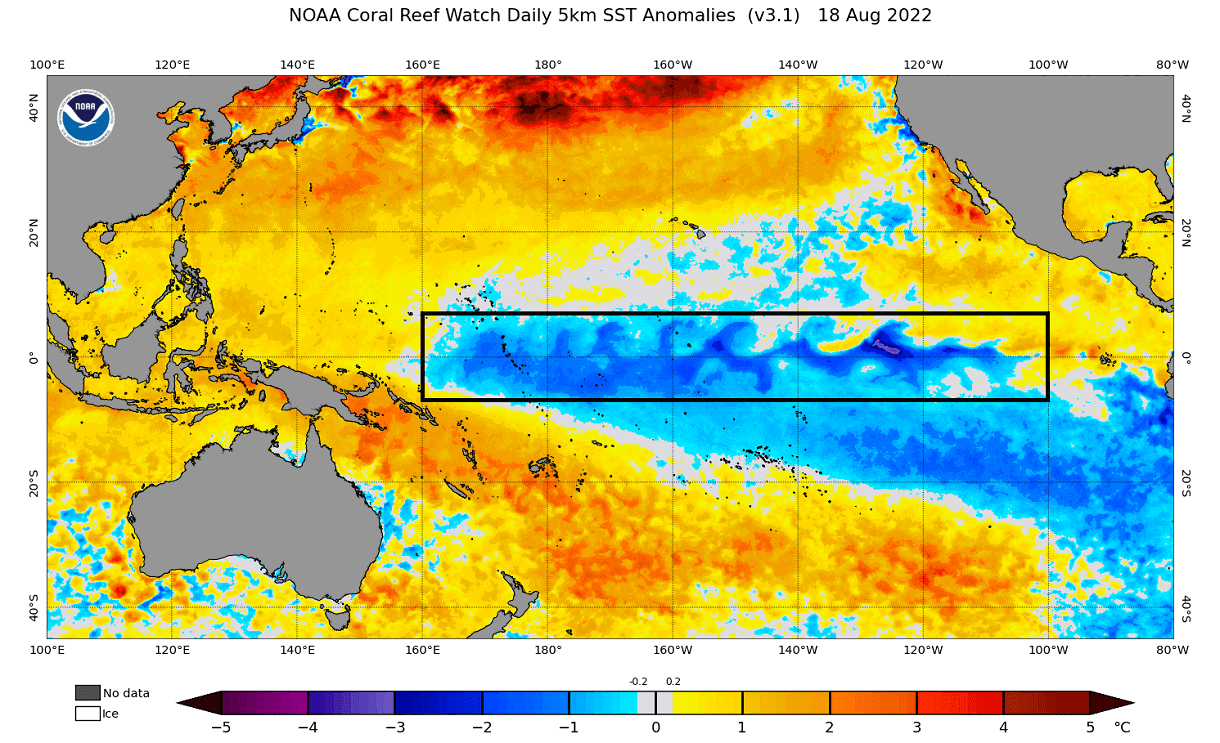
La Nina forms during strong trade winds, which can tell us much about overall global circulation. This way, we can use these anomalies as an “indicator” to know the current state of the global climate system.
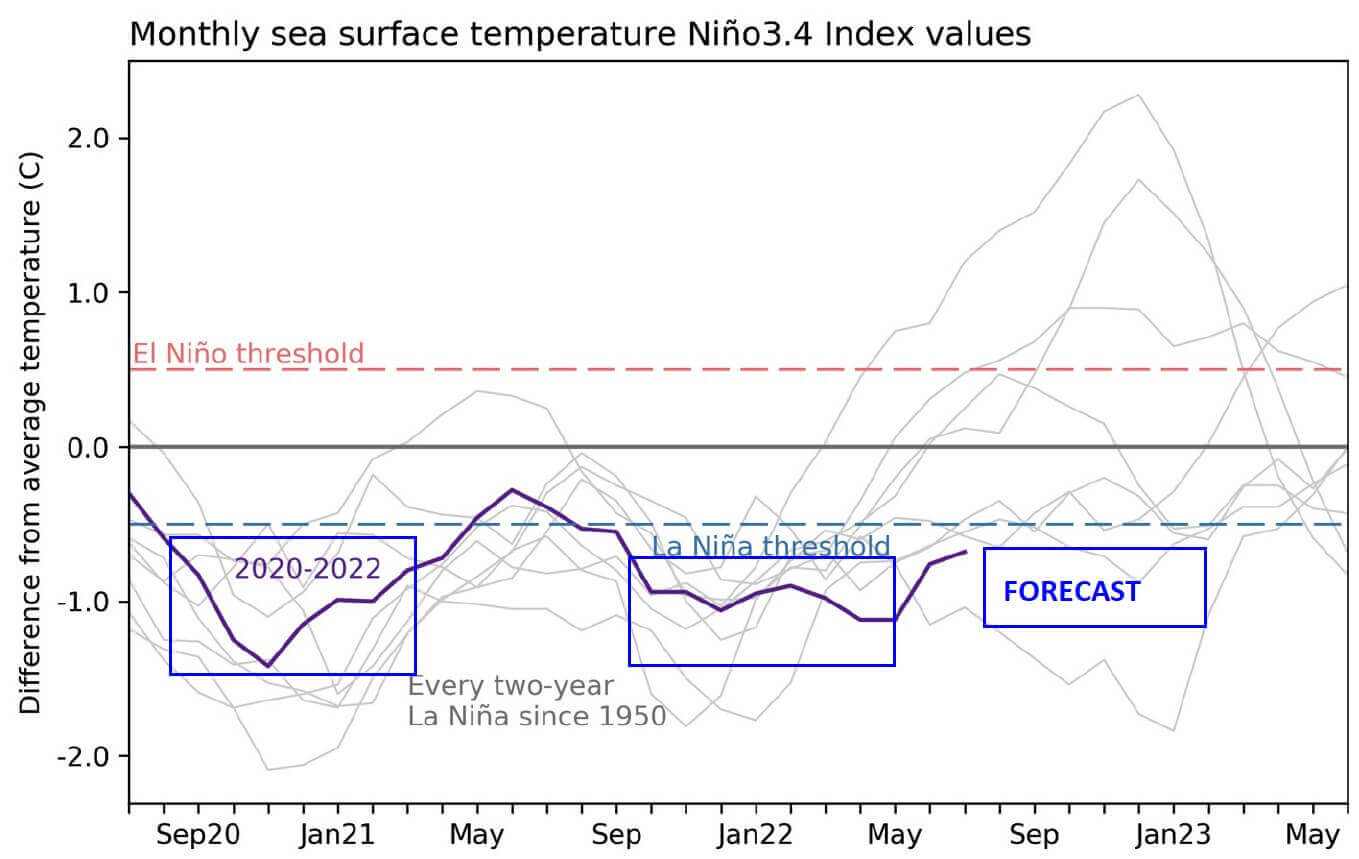
Below, you can see the last two years of ocean anomalies in the ENSO region. You can see the first La Nina event in 2020 and a second-year La Nina in late 2021. A third-year event is forecast to develop over the Fall and Winter 2022/2023.
To better understand the ENSO development, we produced a video showing the La Nina anomalies from late spring over the summer. The video below shows the cold ocean anomalies in the equatorial Pacific. Notice the “waveforms” across the region as trade winds push the surface waters west.
ENSO WINTER FORECAST
Below we have an analysis/forecast graphic by ECMWF, which shows the long-range forecast of the main ENSO region. The La Nina conditions will prevail over the Fall and Winter. But a weakening of the La Nina is expected for early next year, with an El Nino possible later in the year.

The combined model ocean forecast shows the cold anomalies in the Pacific regions over late Fall and early Winter. As you can see in the image, another region of interest is marked towards the west.

THE WINTER JET STREAM
Typically, the first influence of these ocean anomalies can be seen in the changing jet stream. The jet stream is a large and powerful stream of air (wind) at around 8-11km (5-7mi) altitude.
It flows in a west-to-east motion around the entire Northern Hemisphere, interacting with pressure systems and shaping our weather on the surface.
Below is an example of the winter jet stream in winter at around 9km/5.6mi altitude. You can see how the jet stream is curved down over the central United States. It is curved upwards over northwestern Europe. Such formation brings colder weather to the eastern United States and stormy winter weather to Iceland and the British Isles.

The jet stream is an important piece of this story. It is one of the main ways that La Nina can change the weather patterns more directly, especially over North America.
Historically, a strong blocking high-pressure system in the North Pacific is the most typical effect of a cold ENSO phase. That usually redirects the polar jet stream down over the northern United States.
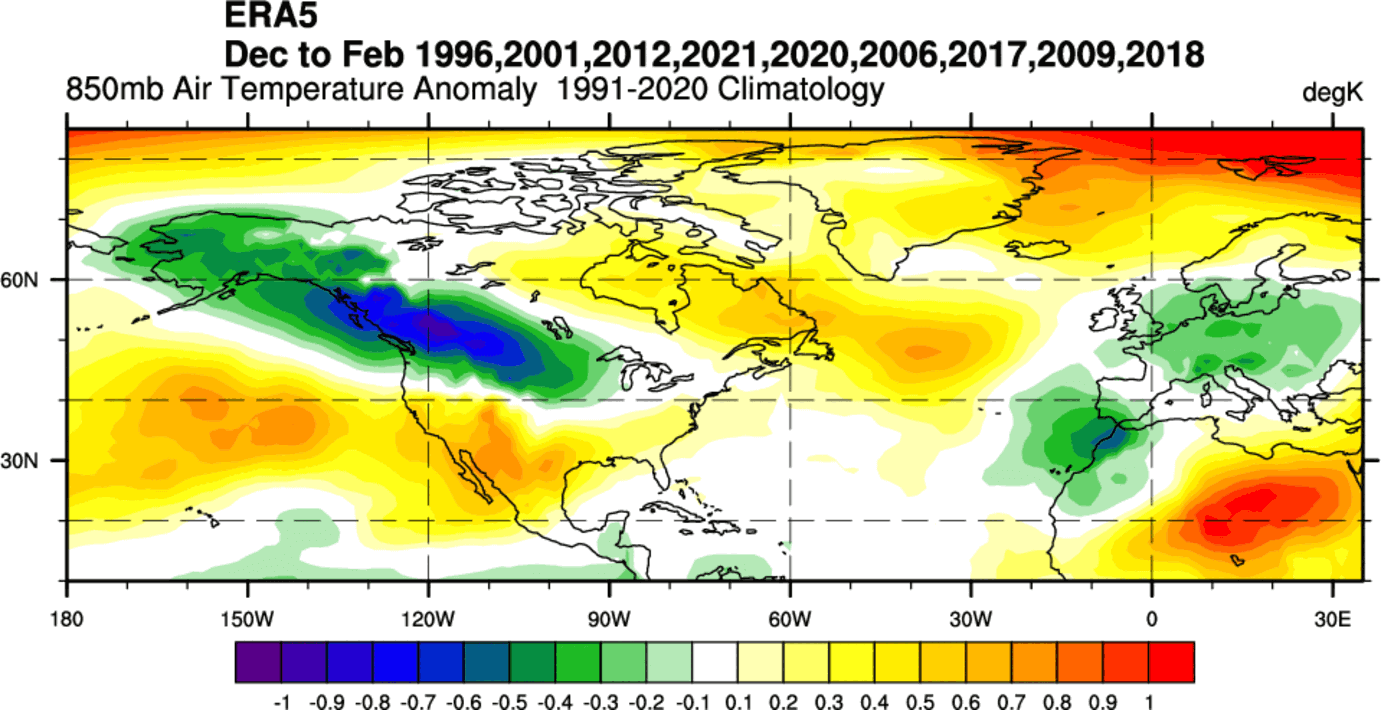
The image below shows the average pattern during the last few La Nina winters. We can see a strong high-pressure system in the North Pacific and a low-pressure area over Canada and southwestern Europe.
The circulation of the strong high-pressure system promotes the development of a low-pressure region over Alaska and western Canada. It curves the jet stream downwards in-between the two pressure systems.
Looking at the temperature analysis for the same winters, we can see the cold anomaly area under the jet stream in western Canada and the northern United States. There are also some cold anomalies over Europe, but can’t be written directly to La Nina.
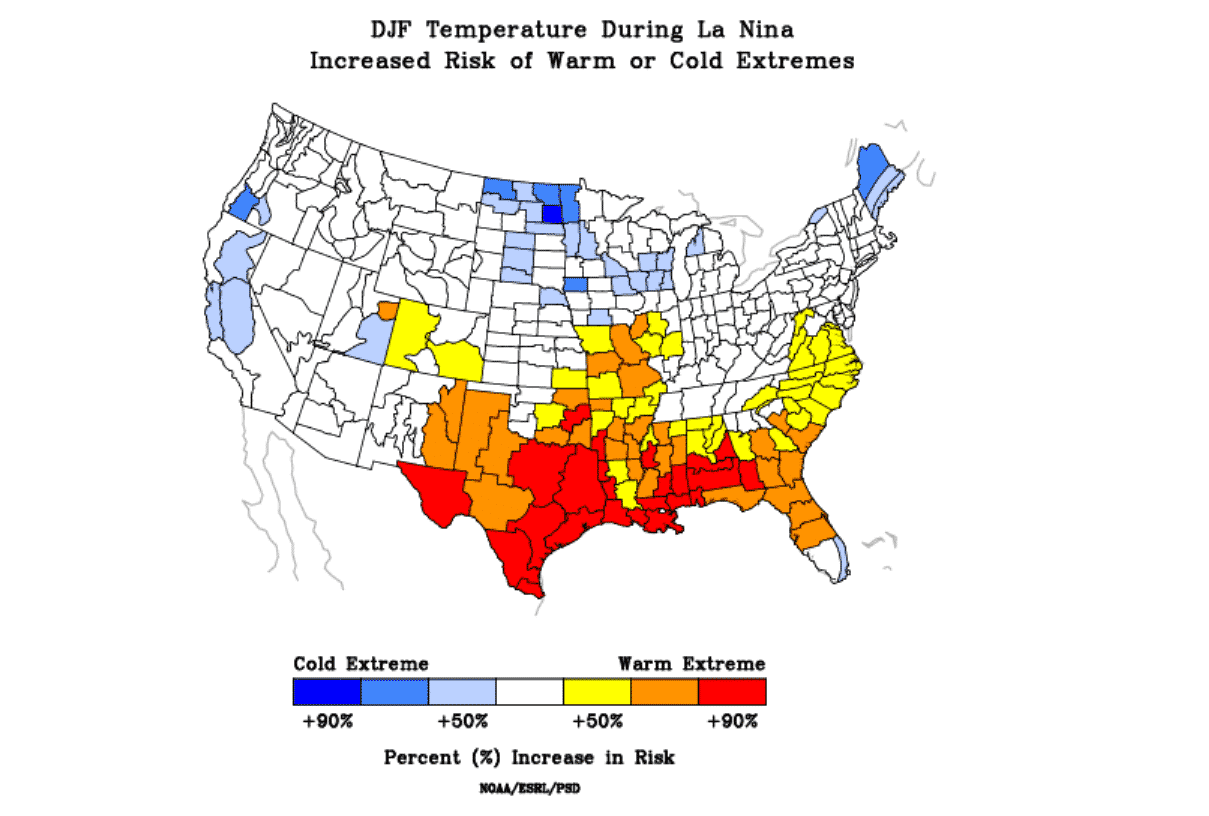
You can see that jet stream redirection in the image below. The image shows the average position of the jet stream during La Nina winters and the resulting weather patterns over the United States and Canada.

The shifting jet stream brings colder temperatures and storms from the polar regions down into northern and the northwestern United States and warmer and drier weather to the southern parts.
In the northern part of the country, we see colder and wetter events are more frequent, as the jet stream directs the storm systems that way. But that can somewhat lockout the southern United States, creating warmer and more stable weather with less frequent storms and cold fronts.
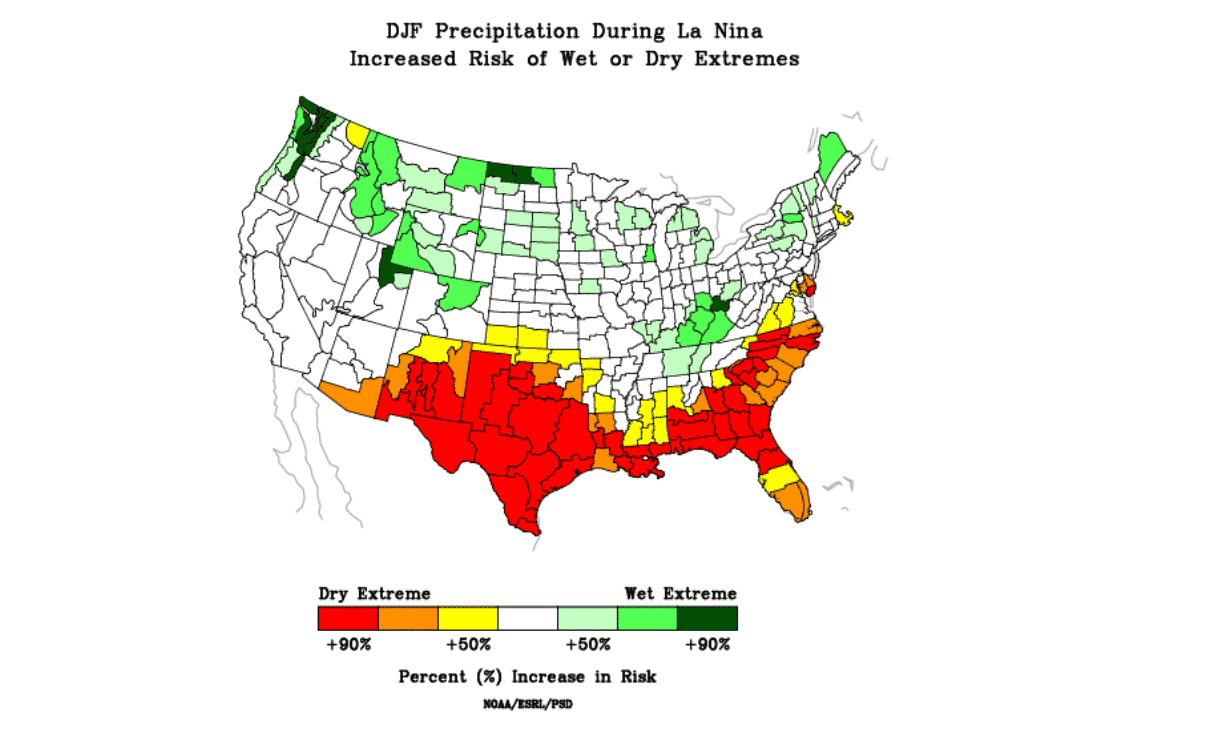
Looking at the precipitation pattern, we can see more precipitation in the northern half of the United States. That is where most of the cold fronts and storm systems travel during a La Nina winter. Over the southern United States, drier conditions typically prevail.
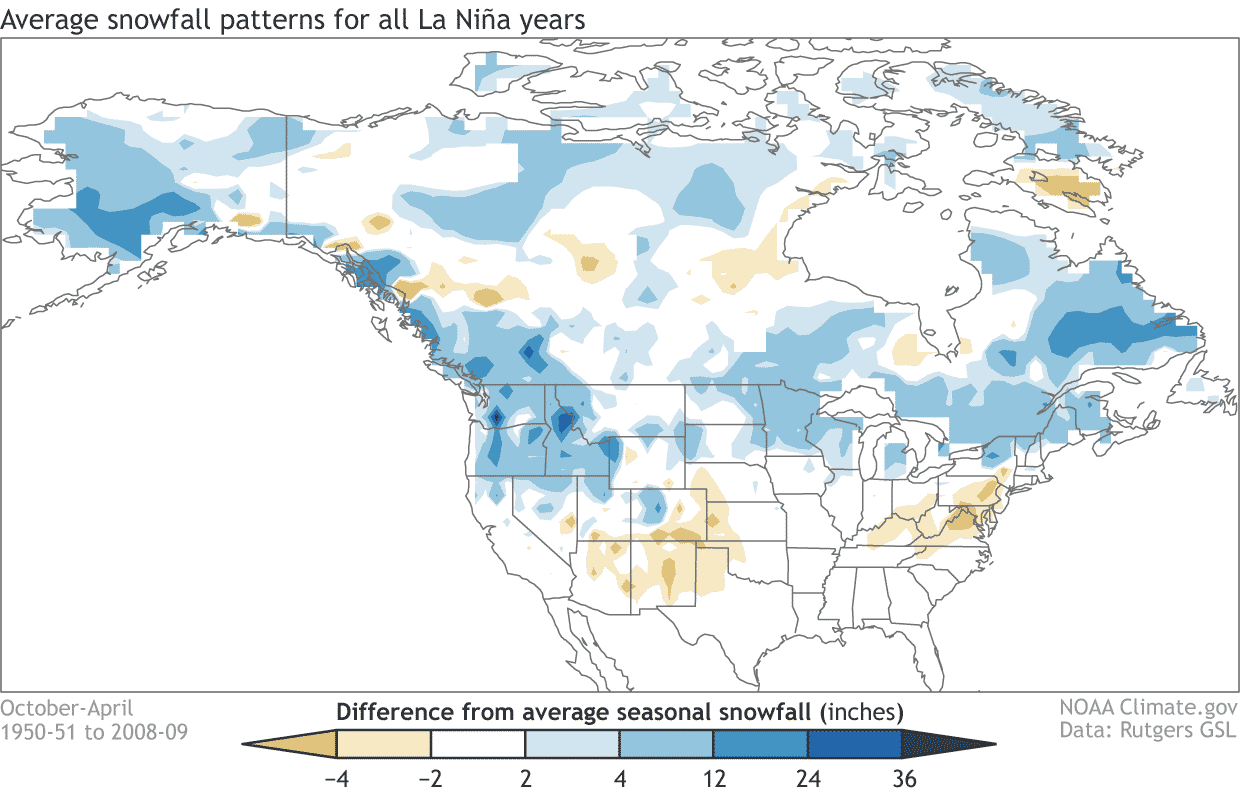
But speaking of winter and the jet stream, what does it do for snowfall? Well, shifting the jet stream also changes the snowfall potential, as the pressure systems take a different path.
The colder air is more easily accessible to the northern United States, which also increases the snowfall potential if moisture is available. Especially areas like Alaska, Canada, and the northern/northwestern United States benefit from more snowfall. The graphic is provided by NOAA-Climate.
After passing Canada and the United States, the jet stream moves out into the North Atlantic. There are different paths it can take from there. A lot depends on the overall circulation patterns and the existing pressure systems in the Atlantic.
This is where La Nina perhaps loses its direct influence over Europe, as regional weather systems in the Atlantic play a role. But it usually still has an important influence, as it changes the position of the entering jet stream from the west.
The outgoing jet stream merges with the systems in the Atlantic, creating a whole new weather pattern for Europe. The problem is that the final outcome is far more unpredictable in this region compared to North America, which is under a more direct weather influence.
DIPOLE MODE INDEX
But ENSO is not the only region that will serve its power over the winter. As we have marked in the intro, another region can be found in the Indian Ocean.
There we have the Indian Ocean Dipole (IOD), also called the Dipole Mode Index. It consists of two poles, hence the name “dipole.” The east part is located around Indonesia, and the west part covers the western Indian Ocean.

The IOD is an imbalance in ocean temperatures between these two regions. Changes in temperatures between the regions occur due to the change in trade wind patterns. Thus, the IOD has two phases, positive and negative.
Below is the latest ocean analysis, which shows a temperature difference between the eastern and western regions of the Indian Ocean. You can see warmer anomalies in the east, but colder anomalies prevail in the west.
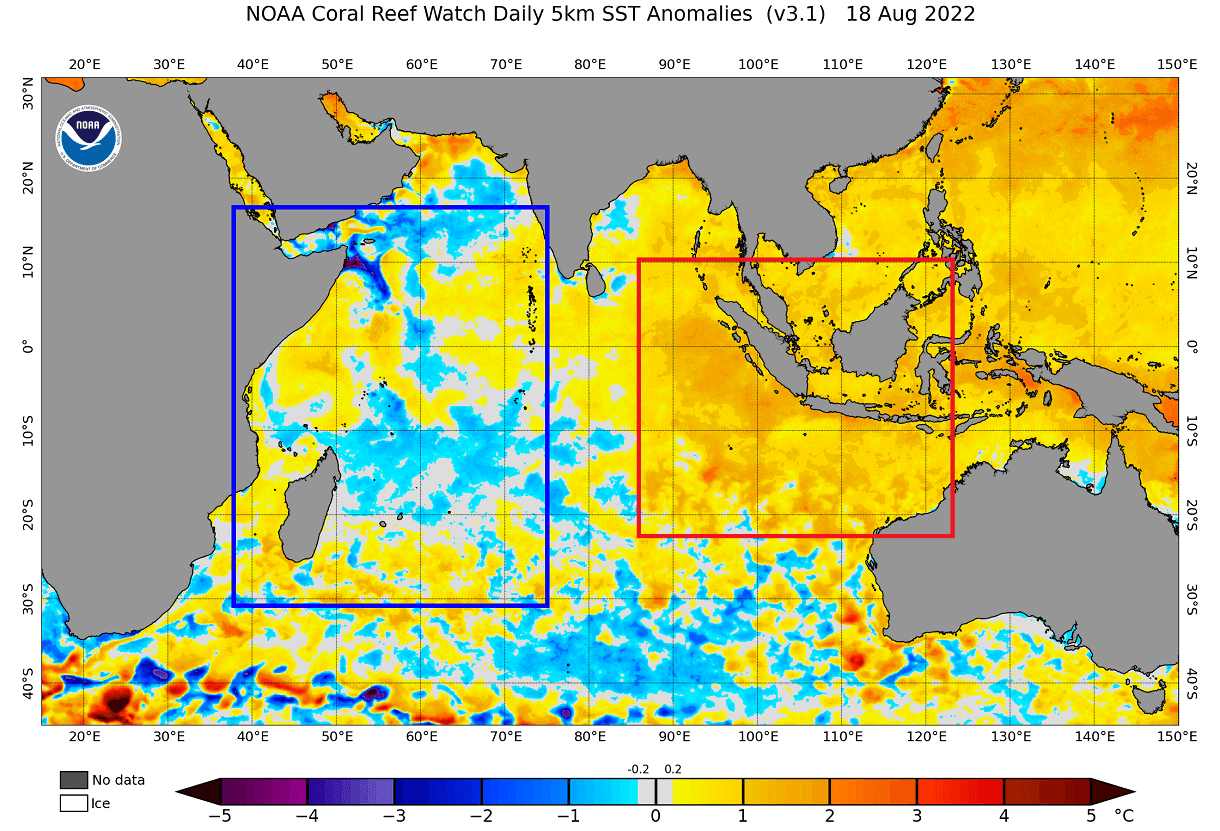
We now know that when the eastern regions are warmer, that signals a negative IOD phase. So more warming in the east and cooling in the west is expected.
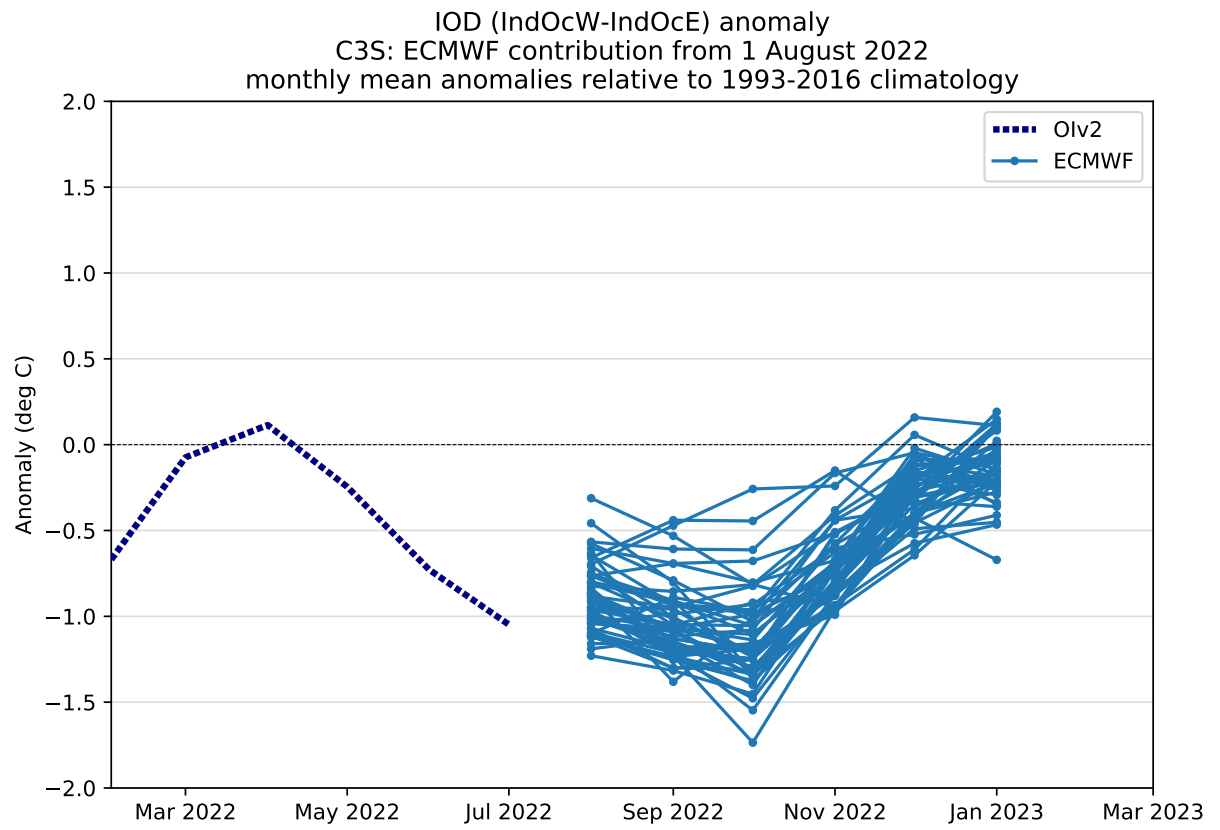
You can see this development in the ECMWF seasonal forecast below. A strong negative IOD phase is expected going into Fall, with the atmospheric interference expected to last over Winter 2022/2023.
Looking also at the North American NMME seasonal forecast, we can see the ocean temperature forecast for late Fall and early Winter. Again, you can see warm anomalies in the east and cold anomalies in the west. This is a strong negative IOD pattern.

IOD WINTER INFLUENCE
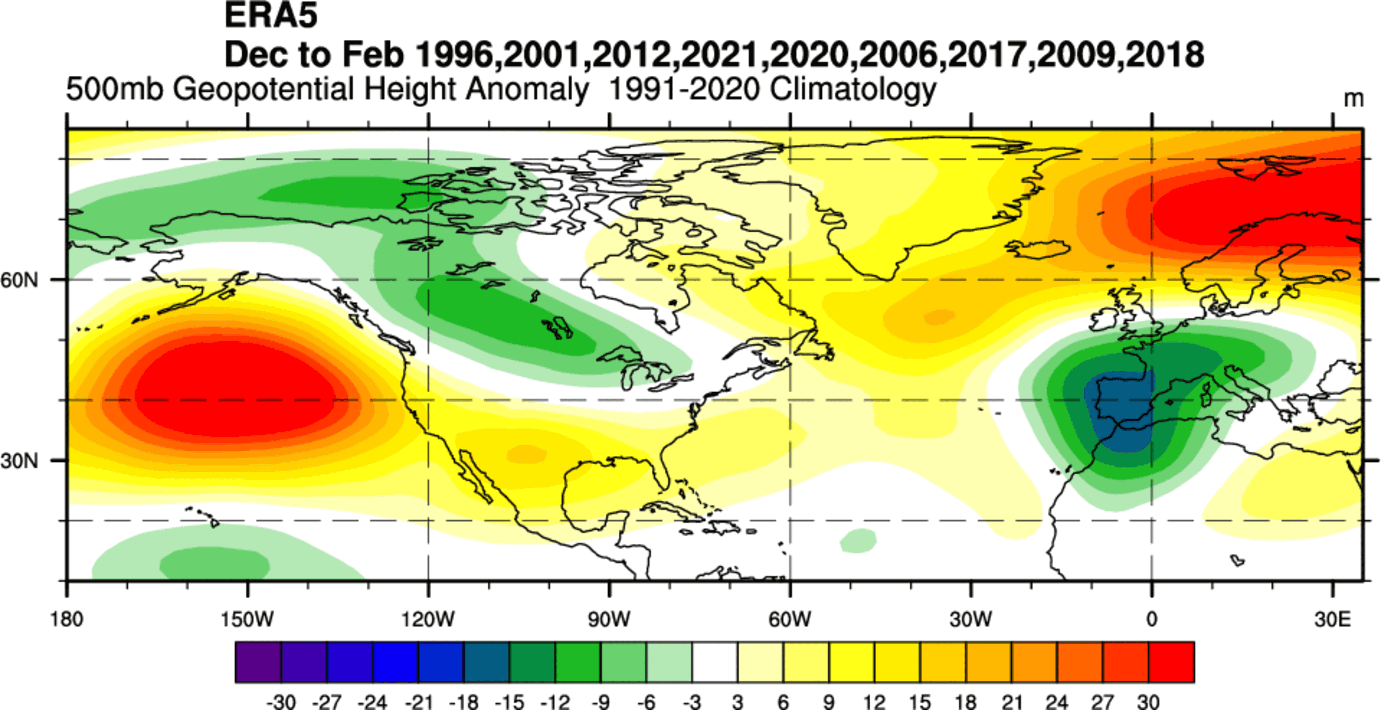
Of course, knowing what a strong negative IOD means for winter is important. Below we have a 40-year correlation between IOD and the 500mb geopotential height pattern in the winter season.
We can see a high-pressure area in the North Pacific and a low-pressure zone over Canada and the northern United States. This corresponds to a cold ENSO pattern, which can often co-occur with negative IOD phases.
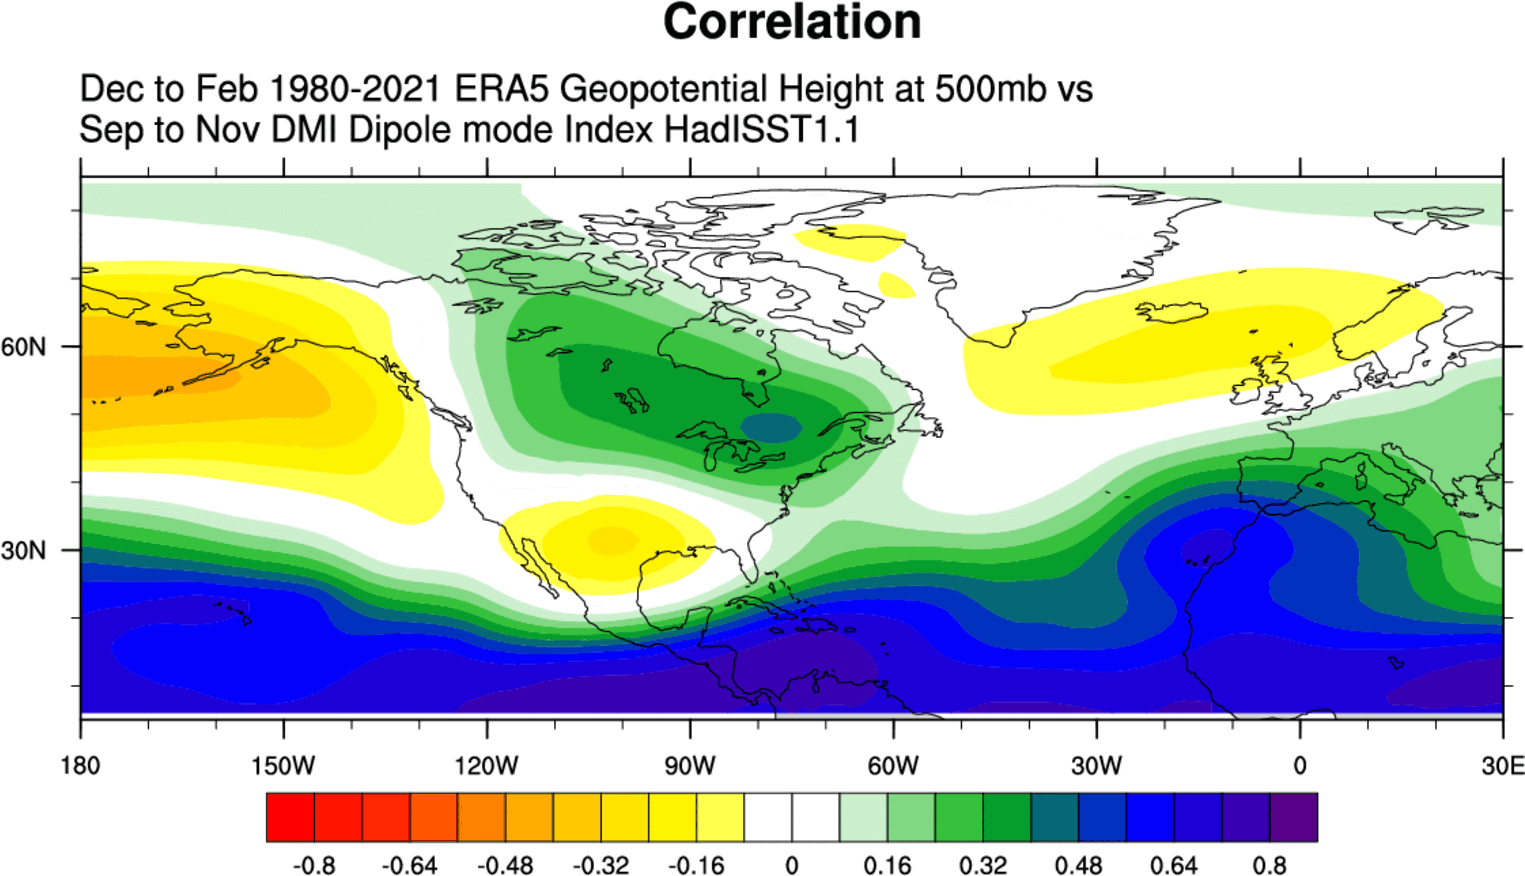
We can also see a high-pressure zone appearing in the North Atlantic, showing a negative NAO index setup. This pattern is close to negative PDO and ENSO (La Nina). Overall they all interfere with each other and impact the cold season climate.
Below is the IOD winter temperature signal. A negative IOD supports colder temperatures over western and southern Canada and northern and eastern United States. We can also see a cold signal over Europe.

The negative IOD usually co-exists with a negative ENSO phase (La Nina). That means their historical pattern can look similar and supports each other in producing a stronger signal.
WINTER SEASON 2022/2023 FIRST LOOK FORECAST
We now know what will influence this upcoming winter and how it can change our jet stream and weather. Now we will look at the global long-range models and their early hints for Winter 2022/2023.
We focused on the 3 seasonal models. The ECMWF from Europe, the CFSv2 from the United States, and CanSIPS from Canada. Graphics are from the Copernicus Climate project, CPC/NCEP, and Tropical Tidbits.
All these forecasts are an average picture over the course of 3 meteorological winter months (December-January-February) and show the general prevailing weather patterns.
Even if the models would be 100% accurate, it does not mean that such weather conditions would last for 3 months straight. It only suggests how the weather patterns might look most of the time.
ECMWF WINTER SEASON FORECAST
The ECMWF model is often referred to as the most reliable model. But no long-range/seasonal forecast can ever be deemed “reliable“, as we are only looking at trends and how the weather patterns might evolve on a large scale over a long time period.
The winter pressure pattern forecast from ECMWF below shows the typical La Nina high-pressure system in the North Pacific, extending to the western United States. A low-pressure system is indicated over eastern Canada and western Greenland.
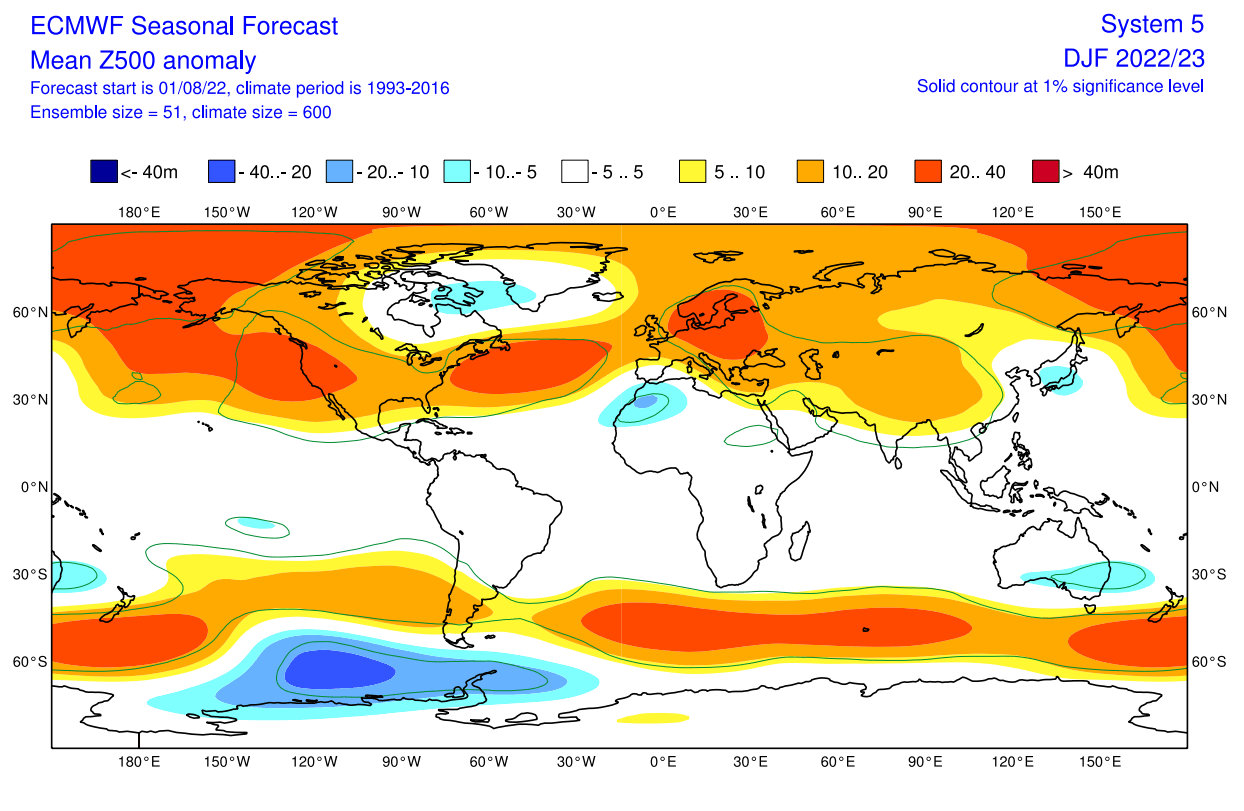
We also see the North Atlantic in a weak westerly positive North Atlantic Oscillation (NAO) mode. It still permits winter situations over Europe if the Atlantic anticyclone can ridge to the north, creating a temporary northerly flow over the continent.
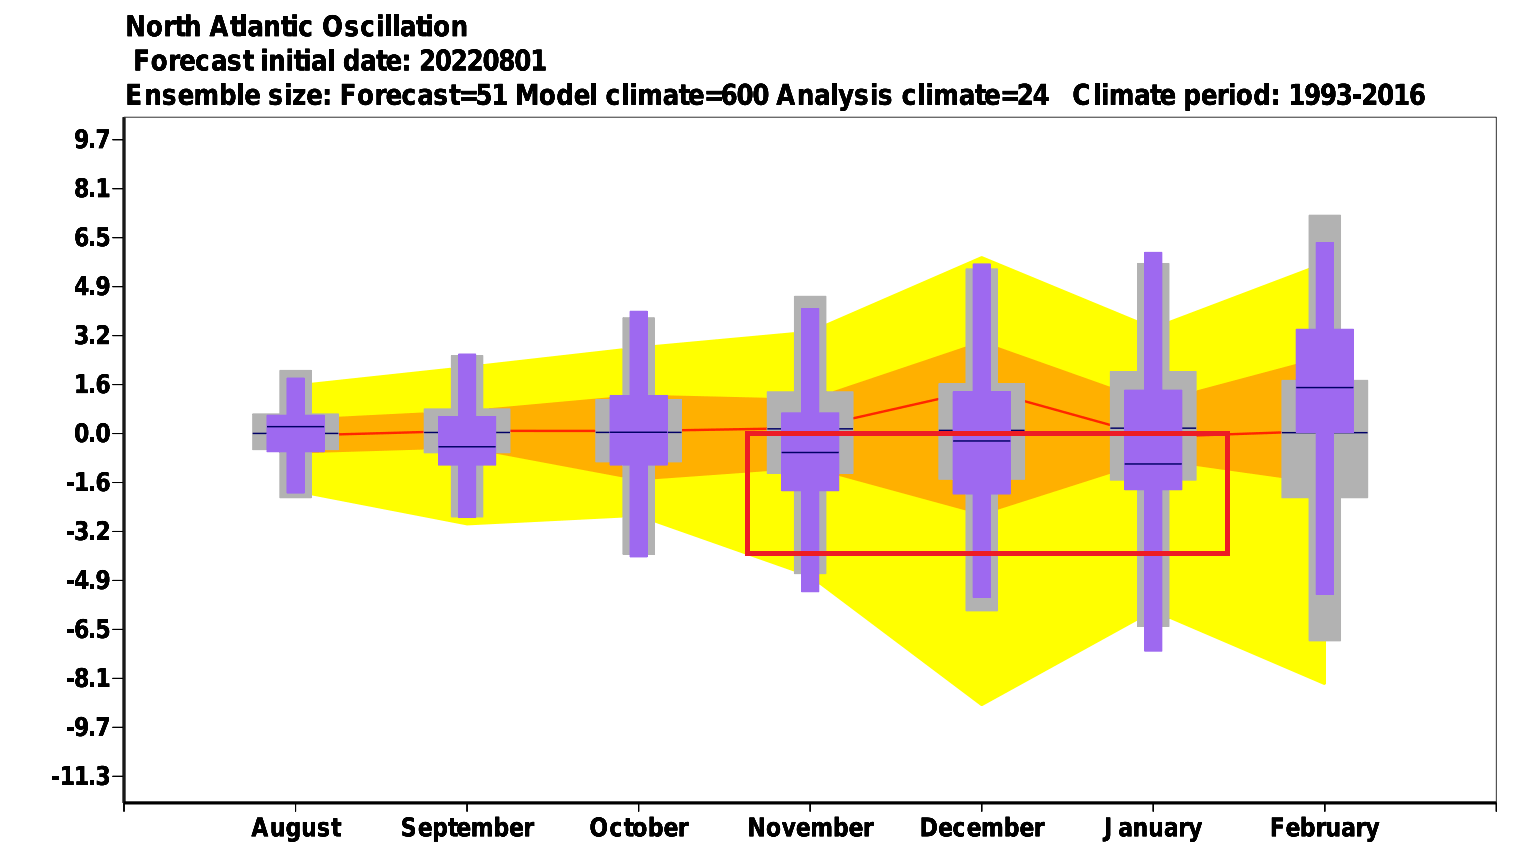
The monthly NAO forecast from ECMWF below actually hints at negative trends in early winter. That would increase the chances of cold events in the eastern United States and parts of Europe.
The global airmass temperature forecast shows an interesting pattern. Most of Canada and parts of the northeastern United States are seen with average temperatures. A “break” can be seen in the eastern United States, where a weaker warm signal hints at a potentially increased number of cold events.
Europe features higher than normal temperatures. A more westerly flow dominant scenario is suggested, but the pressure pattern does allow for a break in the flow. Occasional cold flow from northwest Europe is possible down into the mainland.
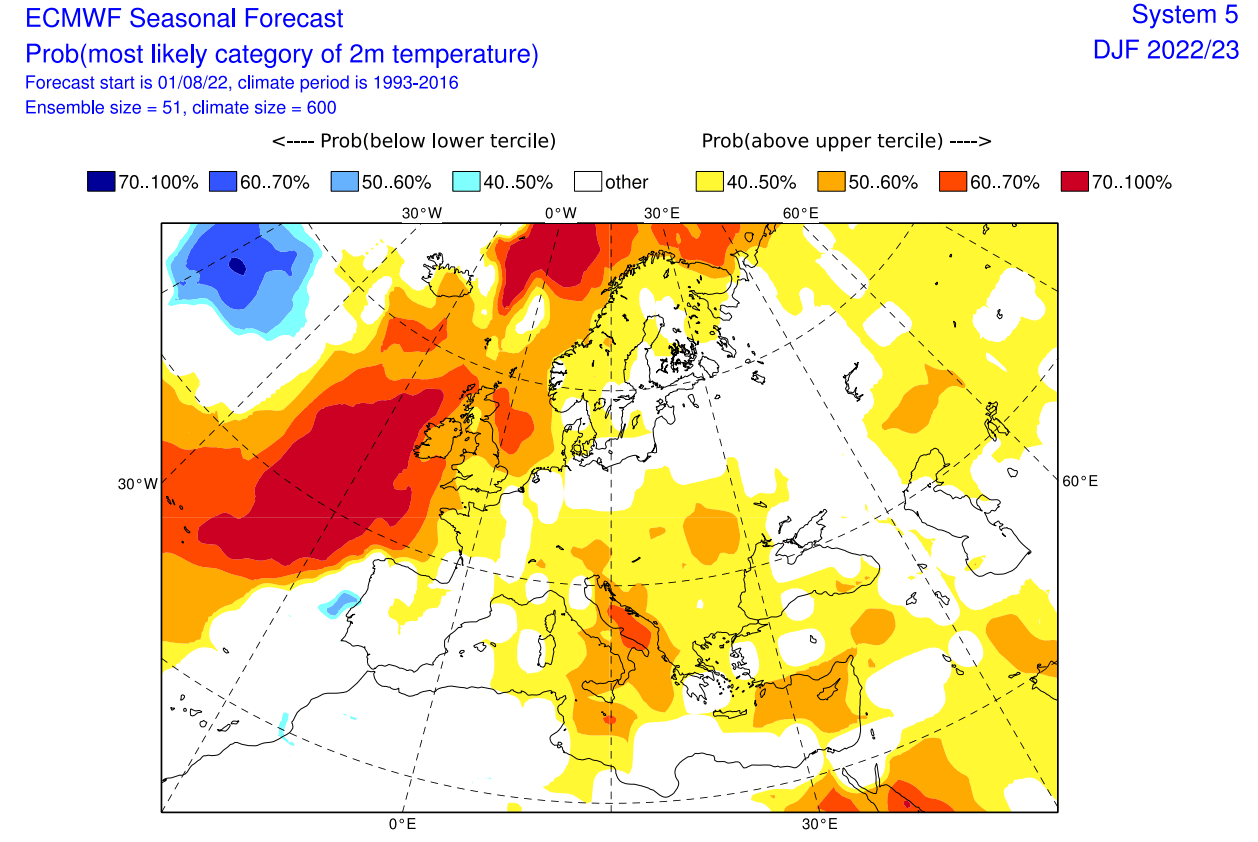
Looking at surface temperatures probabilities over Europe, we see the surface temperatures are mostly above normal in the northwest. But over central regions, we do not see a strong “blowtorch” signal, which could be a result of a more neutral to negative NAO mode in early winter.
Over Noth America, the ECMWF forecast shows average temperatures over most of Canada. Warmer than normal temperatures are forecast over the western United States, while the east has an average to a weak warm area. This is also likely linked to a weakly negative NAO pattern in early winter.
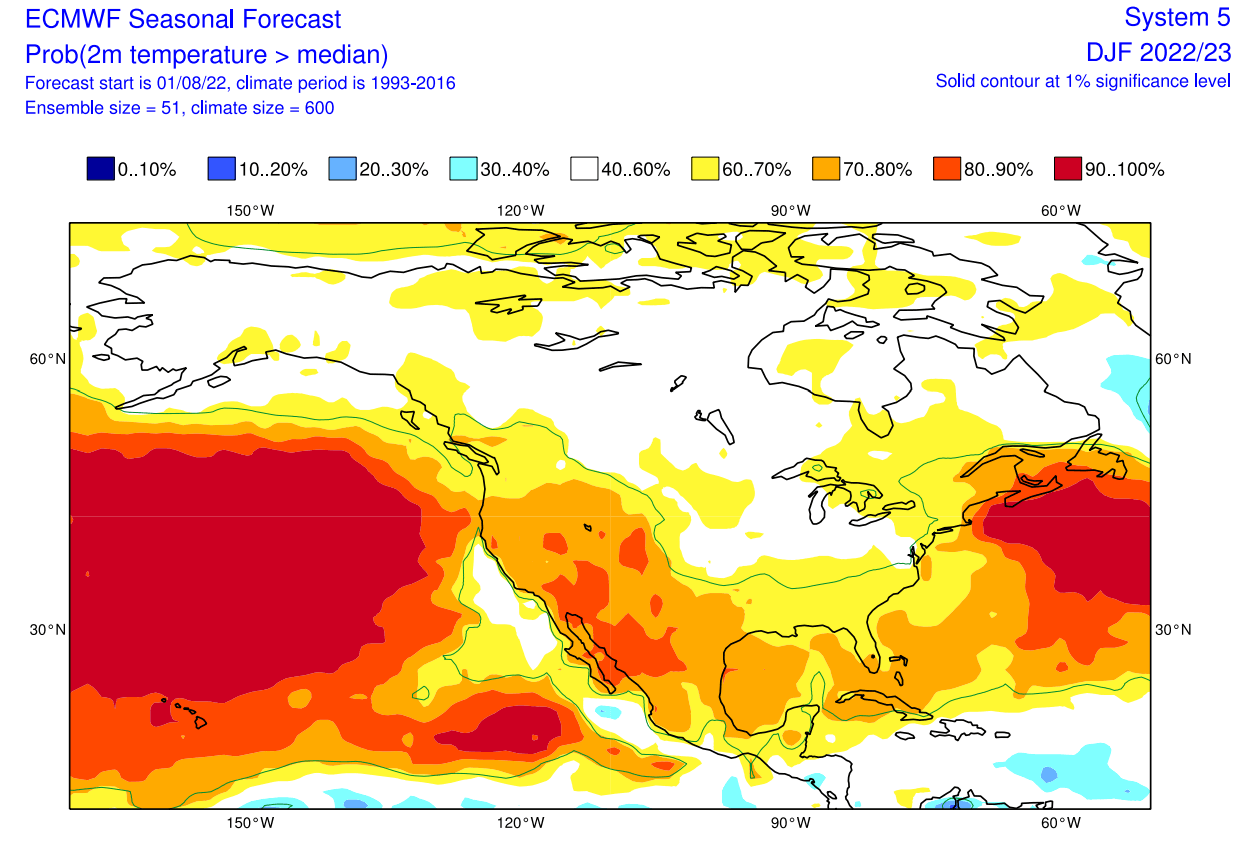
A negative NAO usually means a more northerly flow over the Midwest and the eastern United States. We have seen this development in the past in La Nina winters, and is now also emerging in the early winter forecasts.
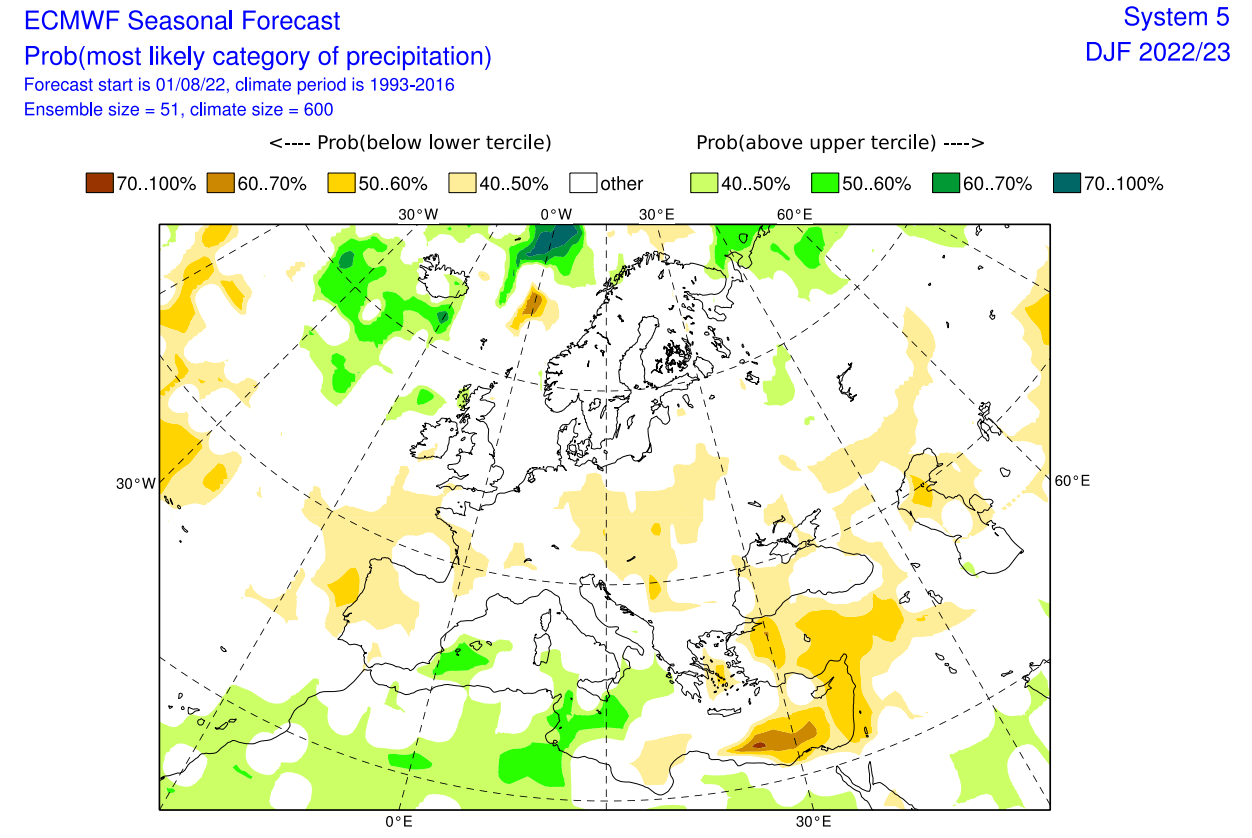
Going to the precipitation forecast, we can see Europe having a mostly drier signal. The exception is the far North Atlantic regions under the low-pressure influence.
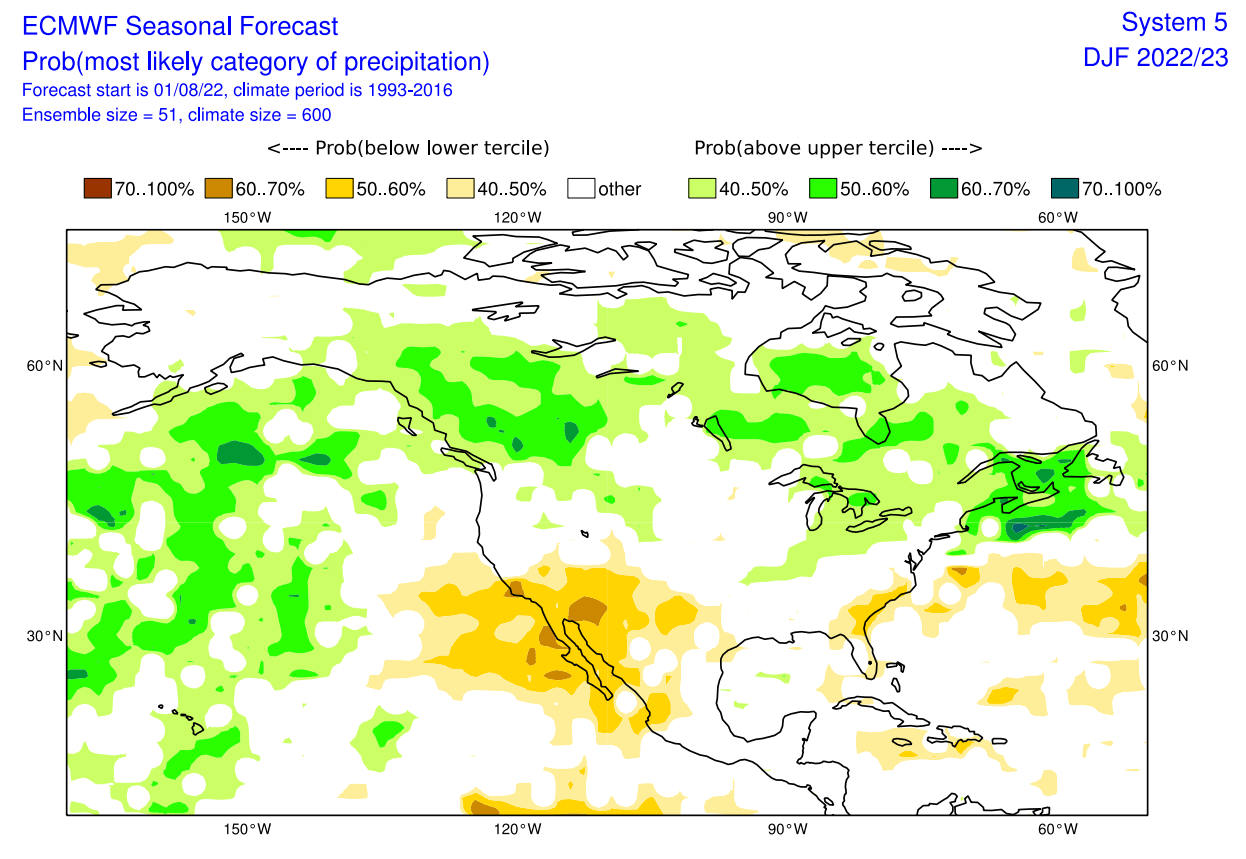
The precipitation anomaly forecast for North America shows a more typical La Nina type pattern over Canada and the United States. We see more precipitation over Canada and over the northwestern and eastern United States. Drier conditions will prevail over the southwestern United States, usually seen in a La Nina pattern.
WINTER 2022/2023 FIRST SNOWFALL FORECAST
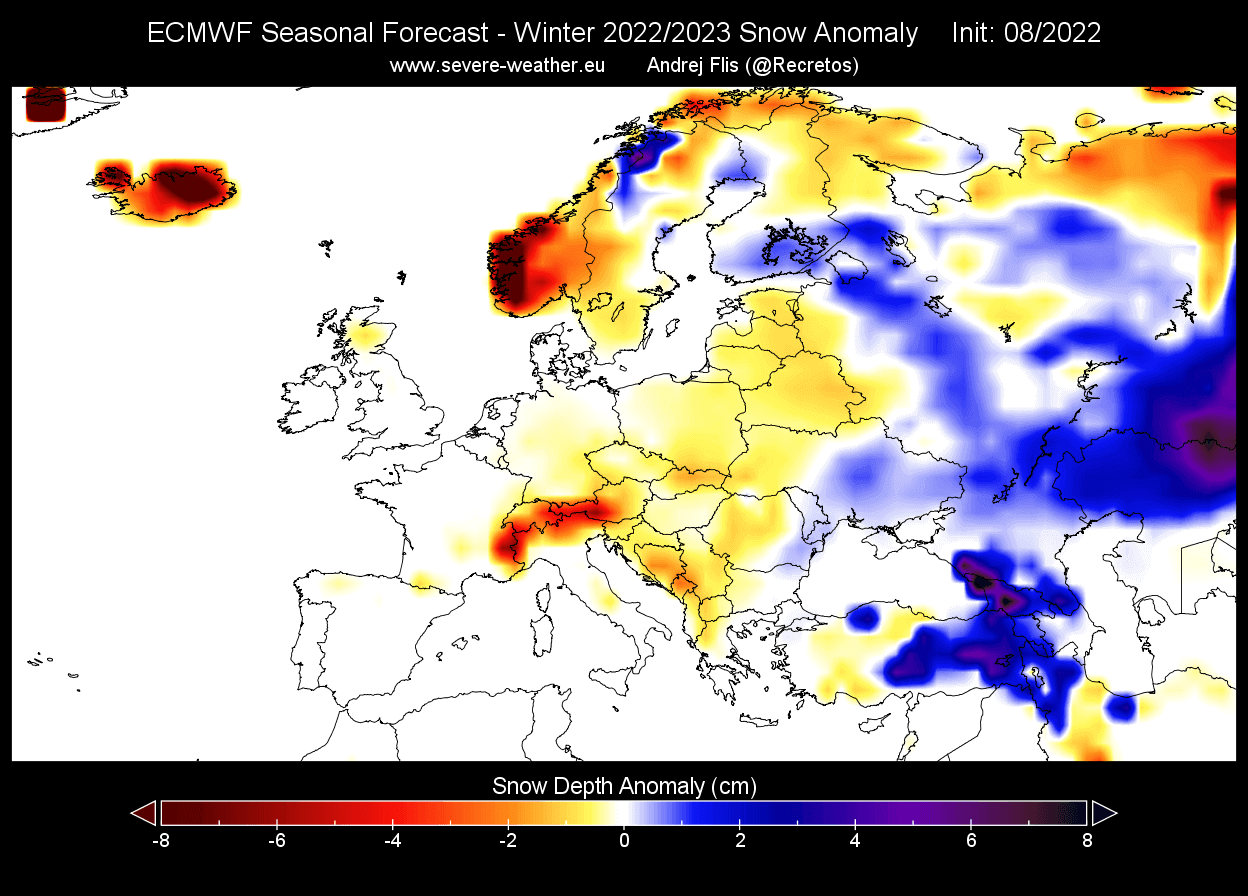
We produced a special snowfall forecast from the ECMWF data provided by the Copernicus-EU project. Over Europe, we see mostly below-average snowfall, except over parts of Scandinavia and further to the east.
Over North America, we see a very interesting snowfall forecast. ECMWF suggests more snowfall than usual in the western and northwestern United States.
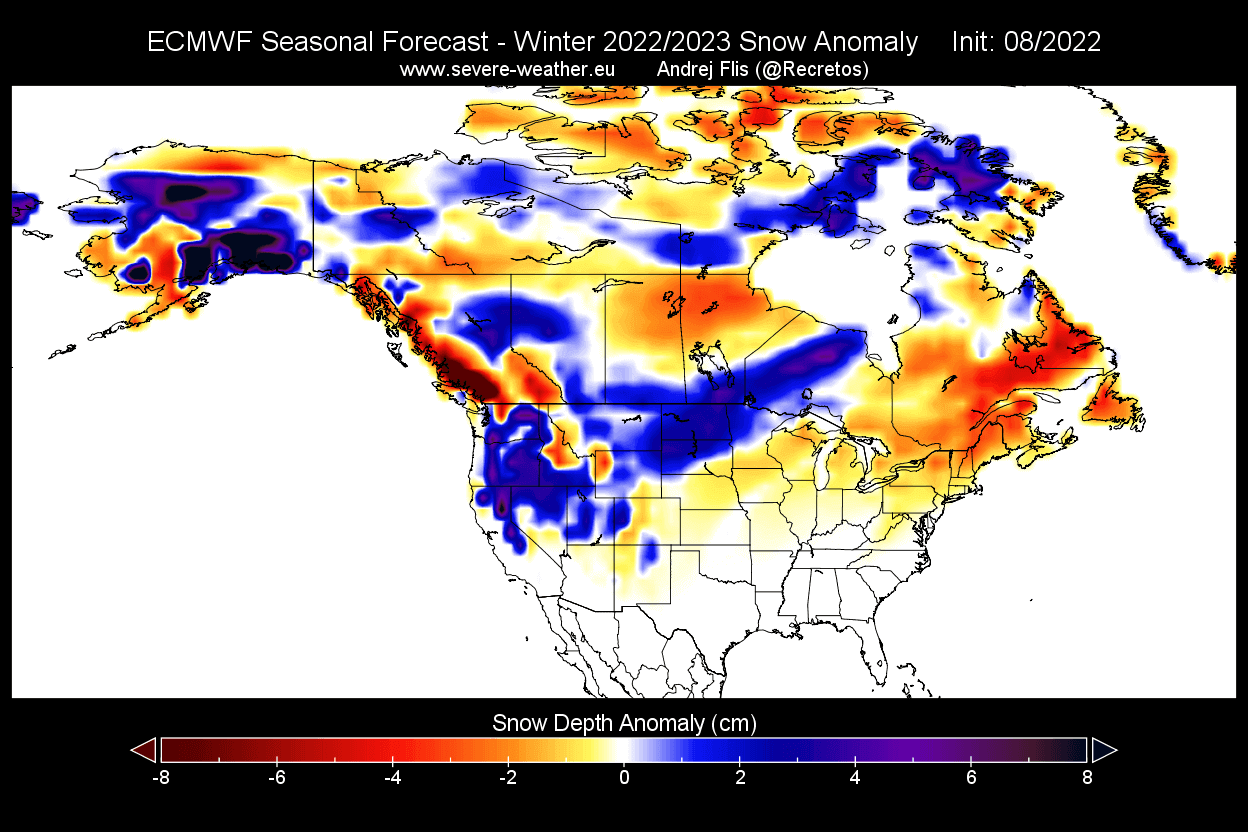
The increased snowfall potential continues over the upper Midwest. The northeastern United States is currently forecast to have less snowfall than normal. But remember that this data shows the snow depth anomaly, which means accumulated snow.
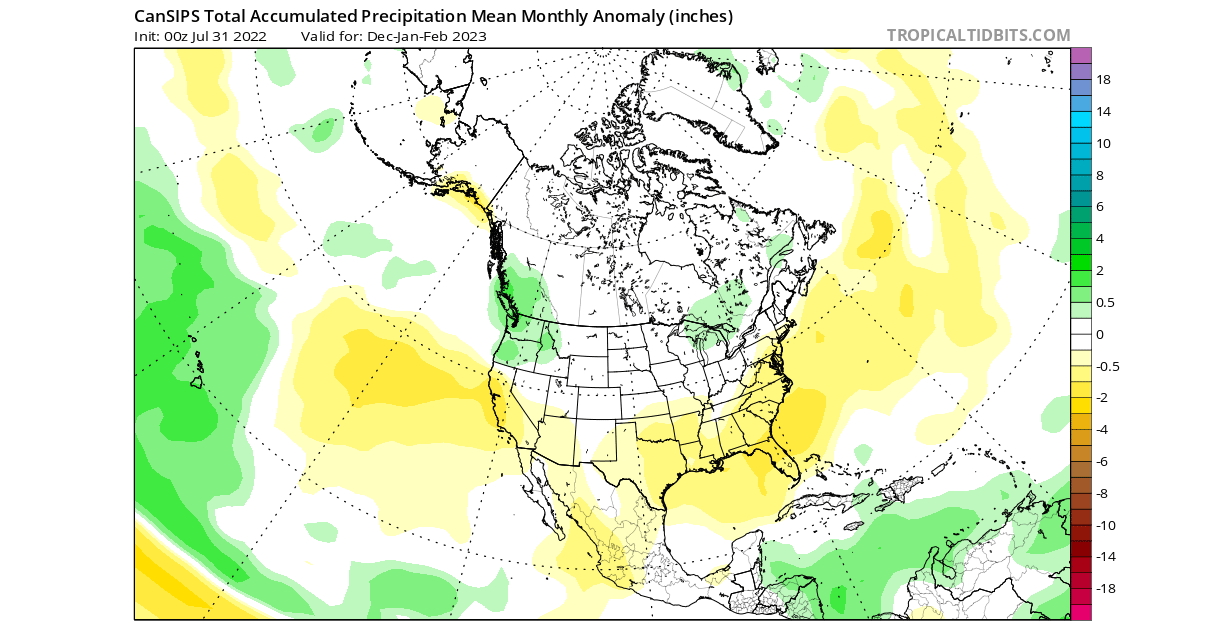
CANSIPS WINTER SEASON FORECAST
Our second model is the CanSIPS model from the Canadian met-office. The name stands for Seasonal and Interannual Prediction System (CanSIPS). It consists of two coupled atmosphere-ocean-land physical climate models.
This model shows a typical La Nina pattern, which we have already seen in the historical analysis. A high-pressure zone sits over the North Pacific with a low-pressure response over North America. Another high-pressure area can be found extending from the Atlantic over northern Europe.
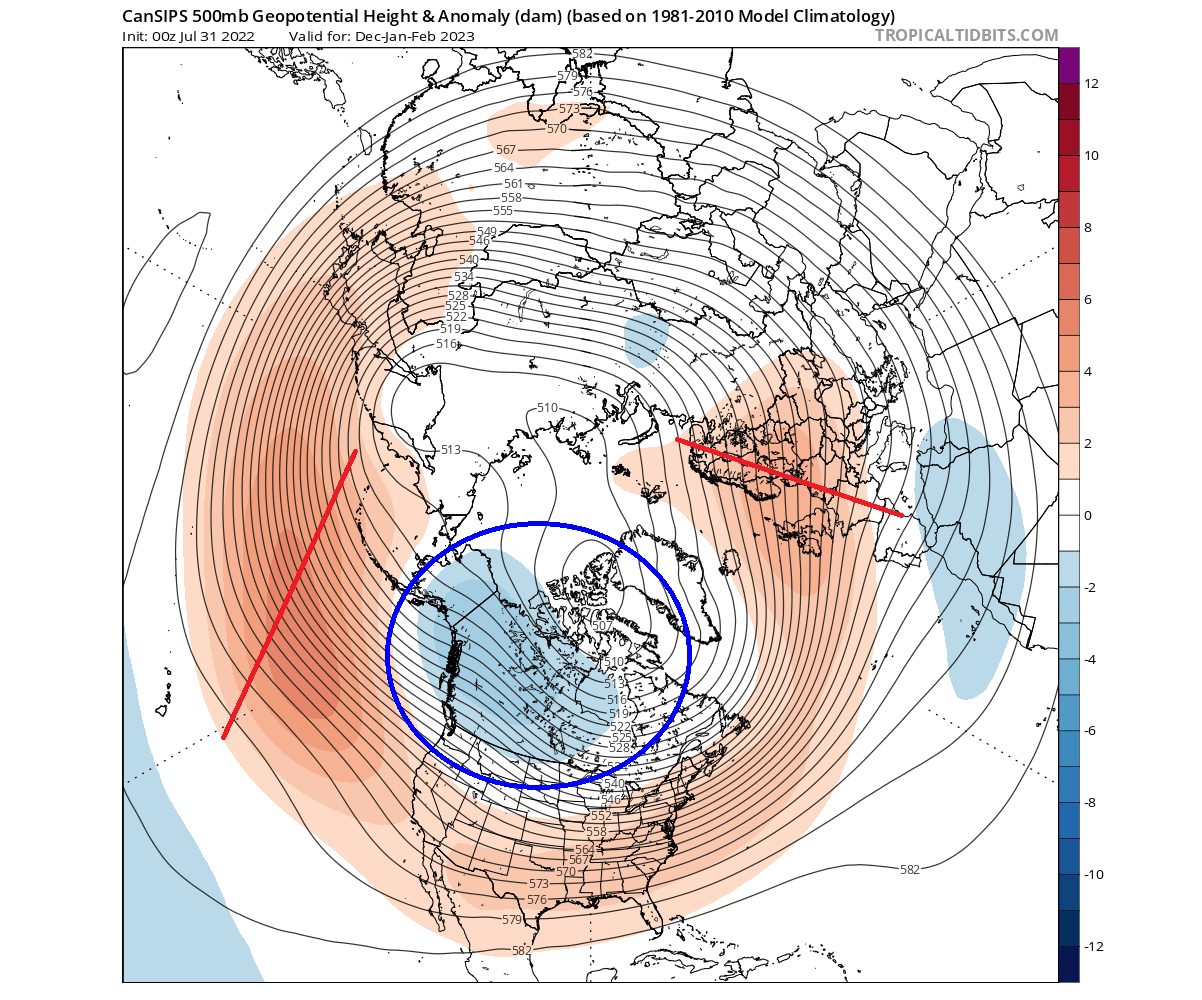
This is a “jet stream bending” pattern over North America, sending the polar jet stream down across the northern United States.
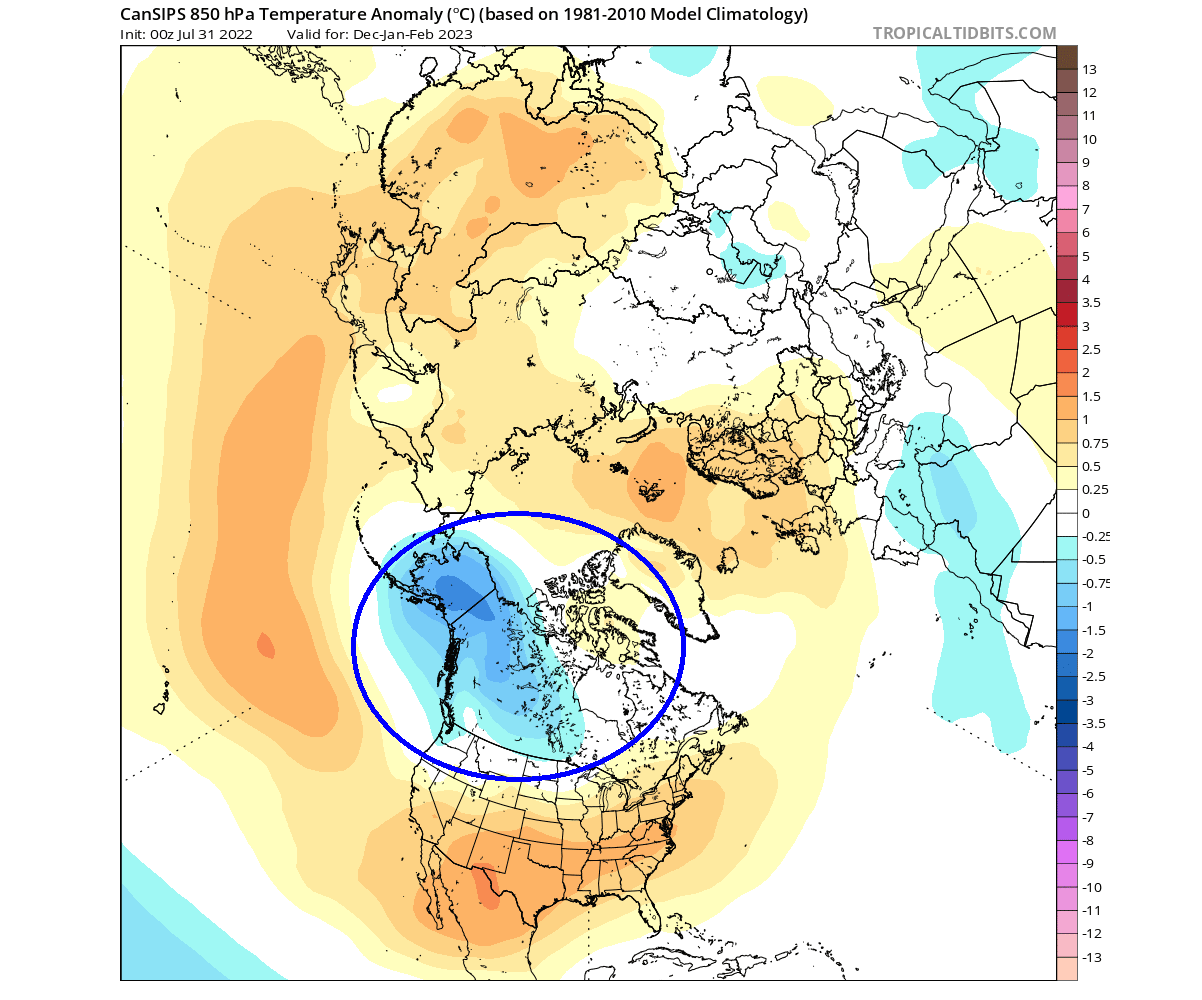
The airmass temperature forecast also looks typical “La Nina-ish”. Over North America, we have the cold pool over western Canada and Alaska, reaching down into the northwestern United States. The southern and eastern United States is forecast to be warmer than normal by the Canadian model.
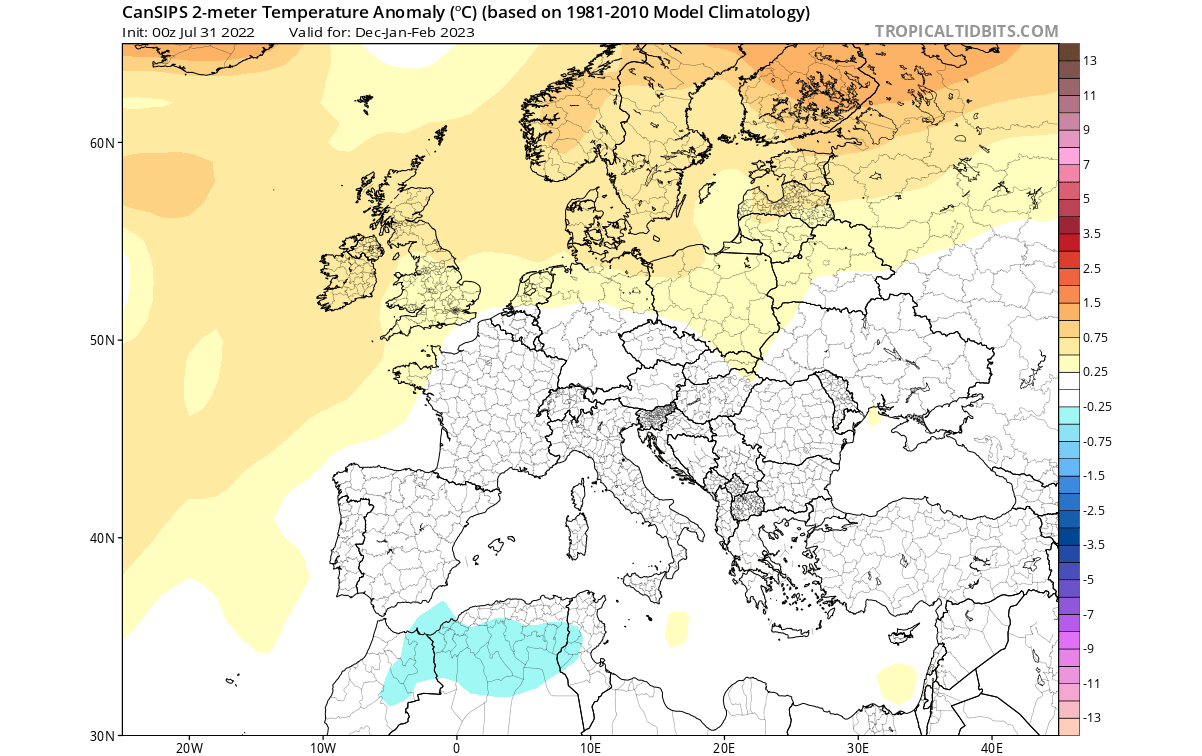
Europe features mostly warmer than normal conditions over northern parts, with a storm track over the southwest.
Looking closer at surface temperatures over Europe, we see the warm anomalies focused over the northern part of the continent. Central and western regions are mostly average in temperatures.
Over North America, we see cold up north in western Canada and Alaska. Warmer than normal winter is forecast down in the United States. The exception is the northwestern United States and the upper Midwest, which show an extension of near-normal temperatures. That is likely the pathway for cold air spills down from Canada.

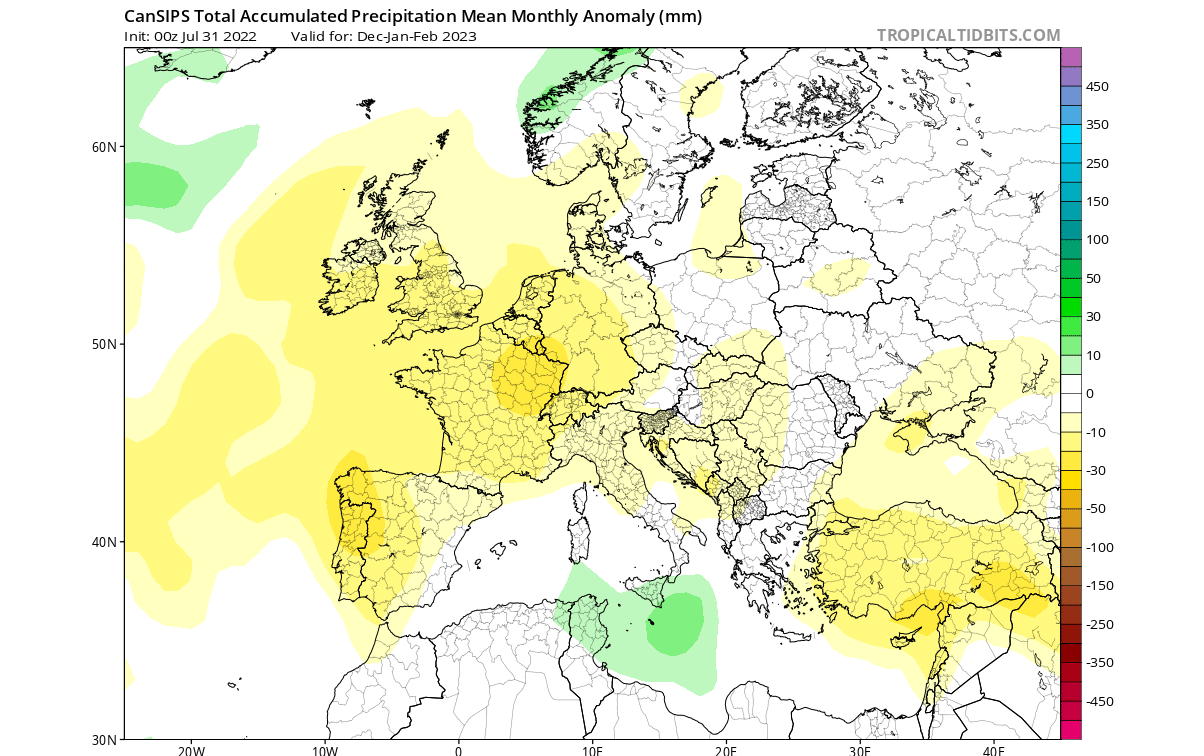
Similar to the ECMWF, the Canadian model shows mostly less precipitation than Europe. Both agree on a high-pressure zone over the continent, but the difference is just the north-south positioning.
We can also see a very similar precipitation pattern over North America. More precipitation over the northwestern United States and parts of the Midwest and the northeast. The Southern United States is mostly drier than normal, as expected for a La Nina winter.
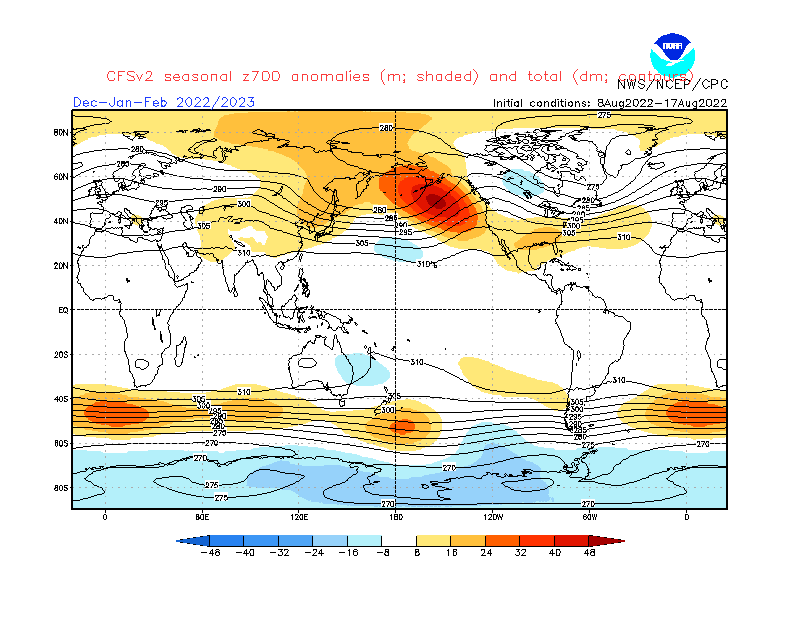
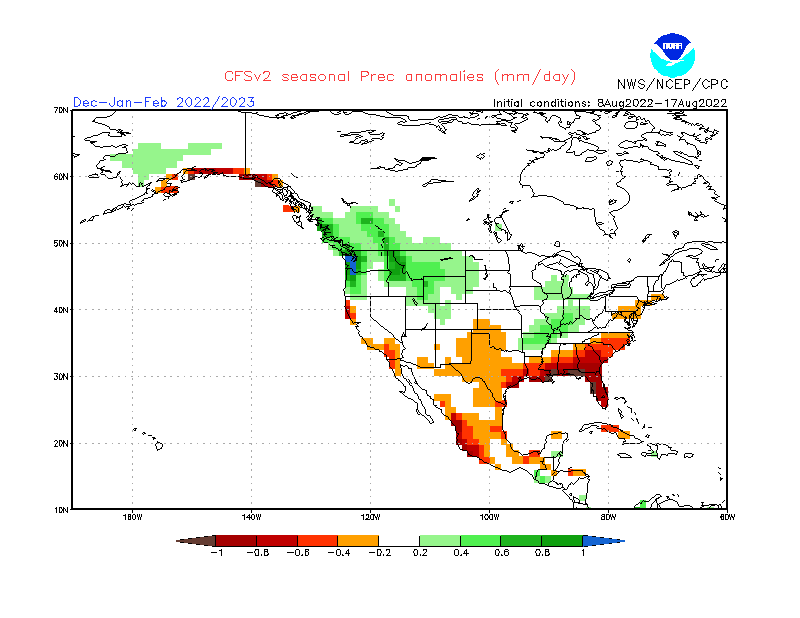
CFSv2 WINTER SEASON FORECAST
We also use a third model to have more variation and to follow the later consolidation and confidence in the overall forecast. For the third choice, we use the United States NOAA/CPC long-range model, the CFS version 2.
For now, the CFS is somewhere between the Candian and ECMWF winter pattern. We have the strong La Nina high-pressure zone in the North Pacific and a low-pressure response over Canada. No clear pattern is seen over Europe in this forecast cycle.
Airmass temperatures are most interesting over North America, with a strong cold air anomaly in Canada and warmer air in the southern United States. The jet stream can usually be found between the two air masses. Europe is seen as warmer than normal, but with no obvious pattern, it is a low-confidence forecast for now.
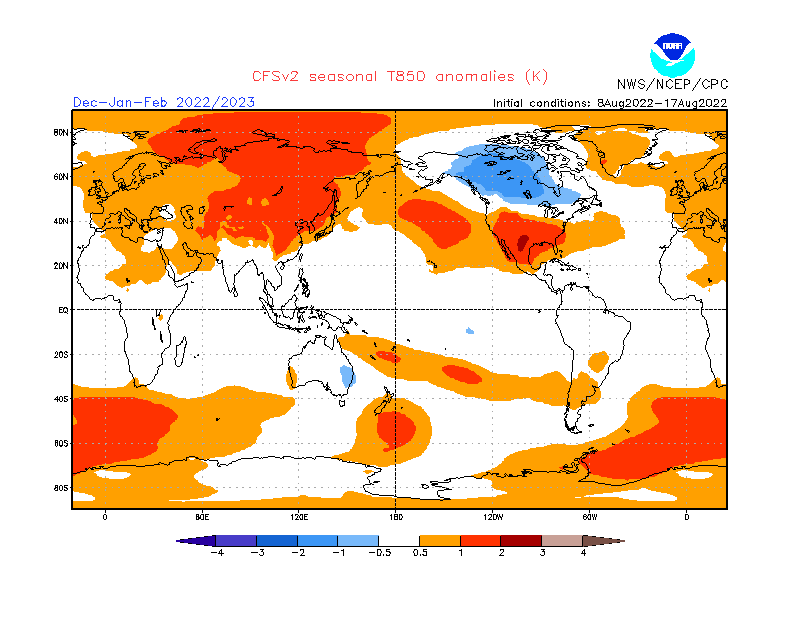
The North American surface forecast, however, shows a really strong dipole pattern. Much colder than normal temperatures over most of western and central Canada and warmth over the southern parts of the United States. The colder anomalies can extend down into the northern United States, especially the Midwest, and partially into the central states.

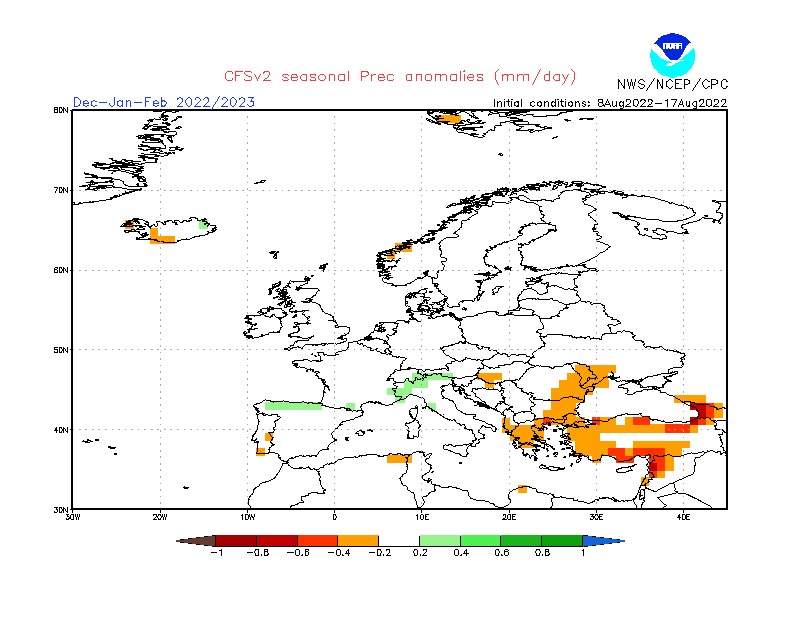
Looking at precipitation, we see a weak anomaly pattern, confirming a large spread in the forecast over Europe. Some hints of more precipitation exist over western and central Europe and drier towards the southeast.
The precipitation anomaly forecast for North America shows the main weather dynamics (with increased precipitation) over the northwestern and eastern parts of the United States. Drier than normal conditions are forecast for the south, especially the Gulf coast states.
We must remember that most of the strong weather dynamics happen between the cold and warm anomalies, including snowfall. CFS has no snow forecast graphic, but this temperature and precipitation pattern would suggest more snowfall over the northwestern United States, upper Midwest, and parts of the eastern United States.
WINTER 2022/2023 FIRST FORECAST SUMMARY
Reading images and descriptions can be somewhat confusing. So to simplify everything, here is what the first Winter season 2022/2023 forecast has to offer:
Europe is expected to have warmer than average temperatures over most of the northern and north-central parts of the continent. A warmer signal is present over the central area but is not particularly strong.
This suggests that there can be periods with more cold fronts and colder days. The neutral to negative NAO forecast from ECMWF in early winter supports this idea. Such a pattern can permit an easier breakdown of the pattern and a northerly flow into central Europe.
The models are not in 100% agreement over the pattern in the North Atlantic. The main key is the positioning and strength of the low-pressure over Iceland/Greenland, relative to the North Amerian pattern.
Precipitation-wise, normal to wetter conditions is expected over northern and northwestern Europe. But mainland Europe is expected to experience drier conditions. The snowfall forecast shows less snowfall over Europe, more likely due to less precipitation.
North America winter forecast looks increasingly likely to be a classical La Nina-type winter. Most of western and central Canada is to expect colder and snowier conditions, along with Alaska.
The United States can expect to see a strong north-south pattern change. The Northern United States is expected to be normal to colder this winter with more precipitation. This increases the chance of snowfall but is more likely towards the western half and in the Midwest, with lower snowfall potential in the northeastern United States.
The Southern United States has a high chance for warmer and mostly drier than normal winter weather. This, however, does not imply that no cold front can reach the southern states. It just implies that in a La Nina pattern, it is much less likely to get frequent cold fronts down to the deep south.
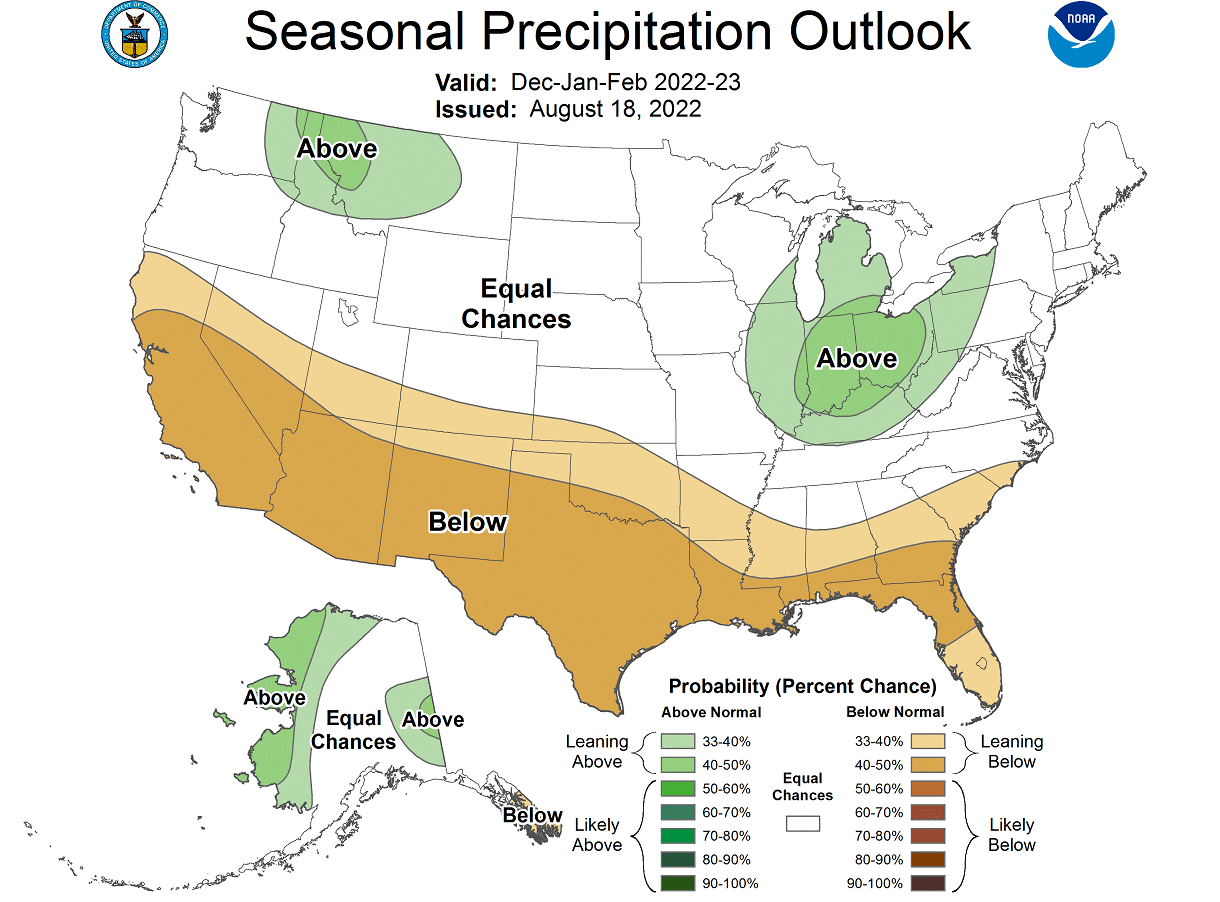
Below is NOAA’s official winter 2022/2023 temperature forecast for the United States. It shows the temperature probability, with colder to equal chances in the northern United States. The southern half of the country and the northeast have a higher probability of warmer than normal weather, as seen in the models above.

But take note of the trough of “average” temperatures probability extending down into the lower Midwest. That can be interpreted as a potential route of winter cold air outbreaks.
The official precipitation forecast is also quite similar to the models above. We see an equal-to-higher probability for more precipitation (and snowfall) over the northern half of the United States. The southern United States is forecast to have a drier than normal winter season.
The problem with precipitation in a La Nina winter is usually the persistence of drought conditions in the south and southwest. Below we have the latest drought graphic from NOAA, which shows the current drought conditions in the United States.
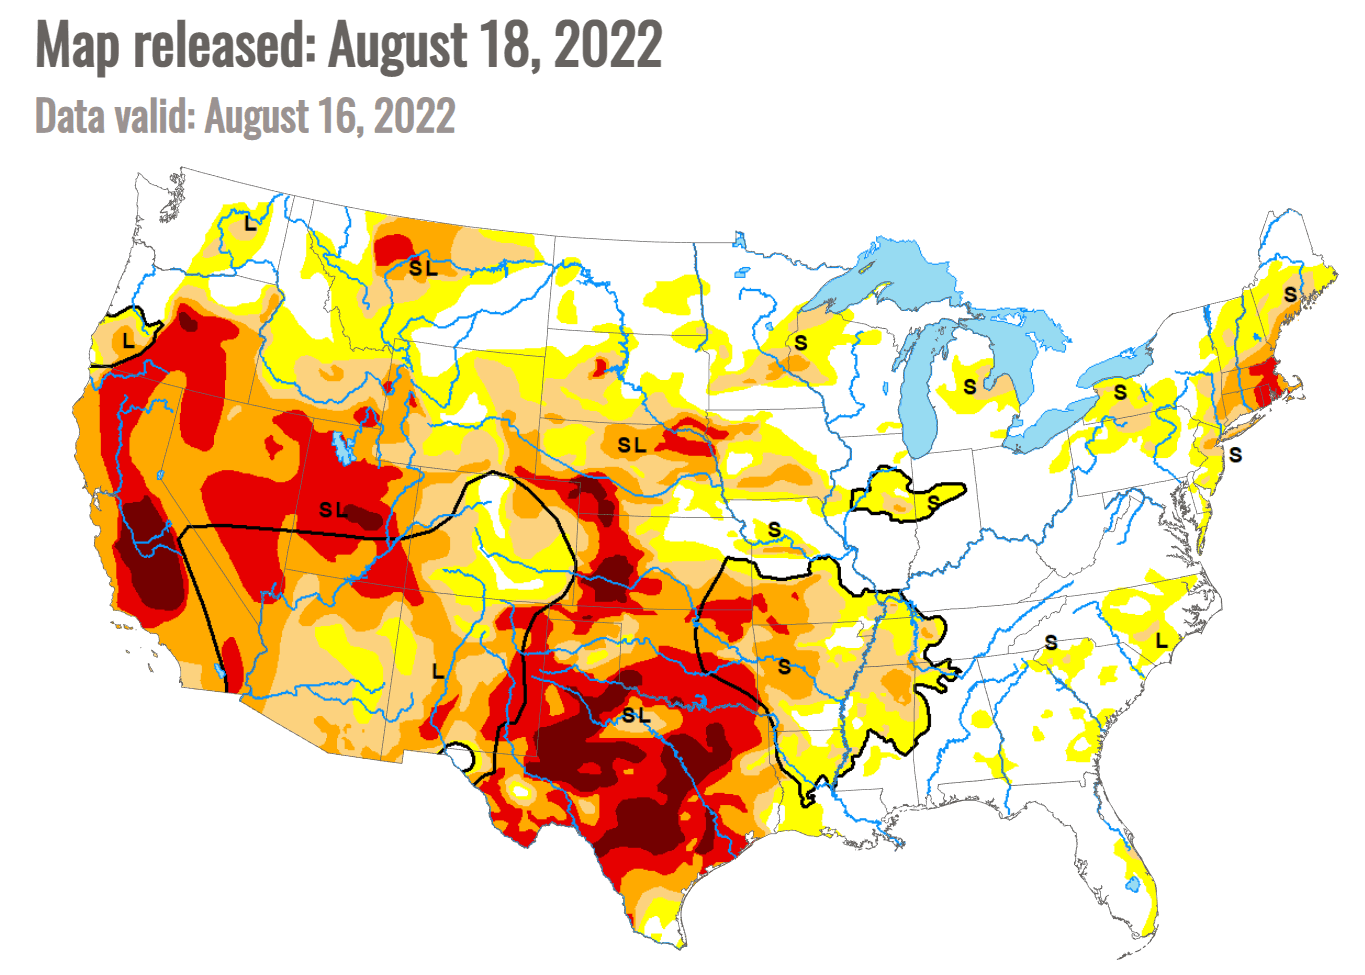
Strong drought conditions prevail over the south-central and western United States. We can see some recovery over the southwest, especially in Arizona. That is thanks to the summer monsoon bringing a decent amount of precipitation.
But the drought conditions in the south are expected to continue and can worsen in a La Nina Winter. The same goes for the southwest and parts of the western United States, like California.
There is no certainty in the winter forecast at this long lead time. But there is also one very important factor that can change the course of winter at any time. That is the Stratospheric Polar Vortex.
STRATOSPHERIC POLAR VORTEX
We cannot talk about winter without also mentioning the Polar Vortex. The Polar Vortex re-emerges every Fall and plays a key role in weather development in late Fall, Winter, and Spring.
The Polar Vortex is a large cyclonic area that is spinning over the entire Northern Hemisphere, from the ground up to the top of the stratosphere, reaching over 50km/31miles in altitude.
We produced a 3-dimensional model of the Polar Vortex, extending from the lower levels up into the stratosphere. The vertical axis is greatly enhanced for better visual purposes. You can see in the image below what the actual structure of the Polar Vortex looks like.
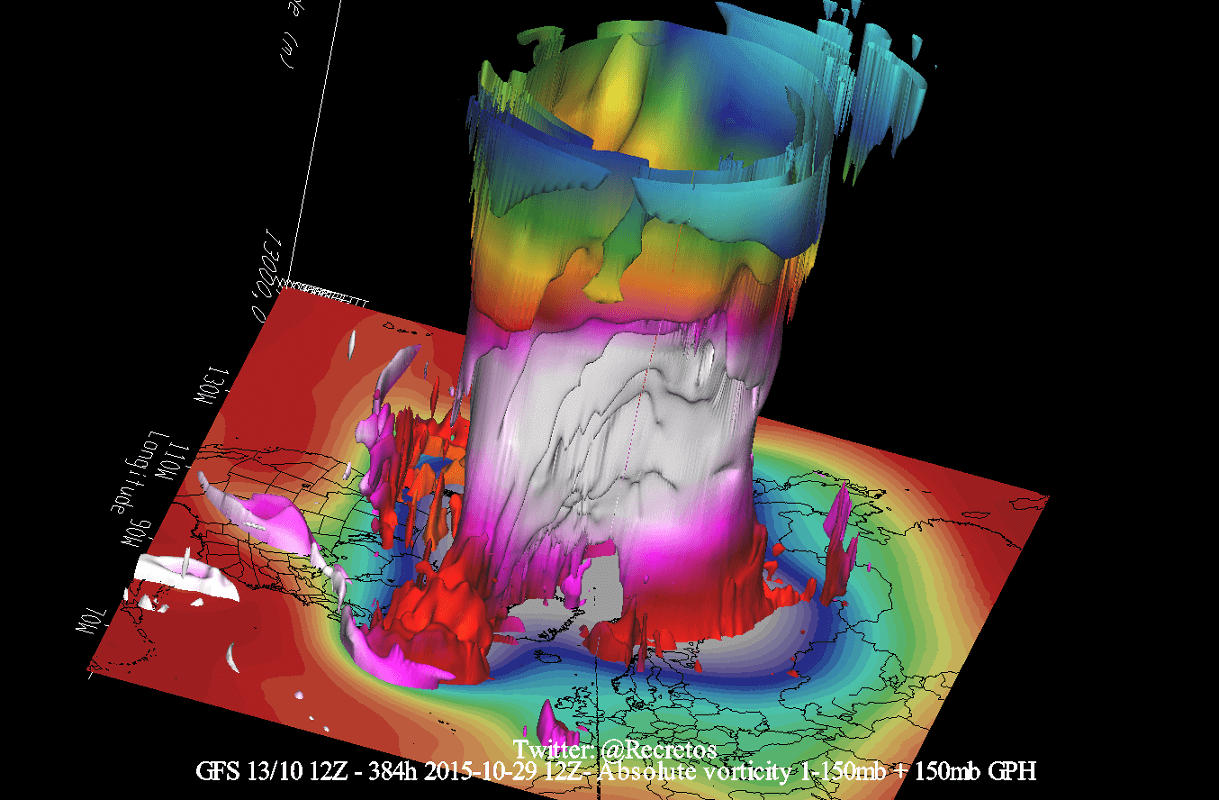
In the example above, the Polar Vortex underwent a temporary warming event. These events can disrupt the Polar Vortex, weakening its circulation and changing the weather patterns below.
That is very important for the winter weather patterns, as it can change the dynamics and circulation for several weeks. But even a strong Polar Vortex plays a role.
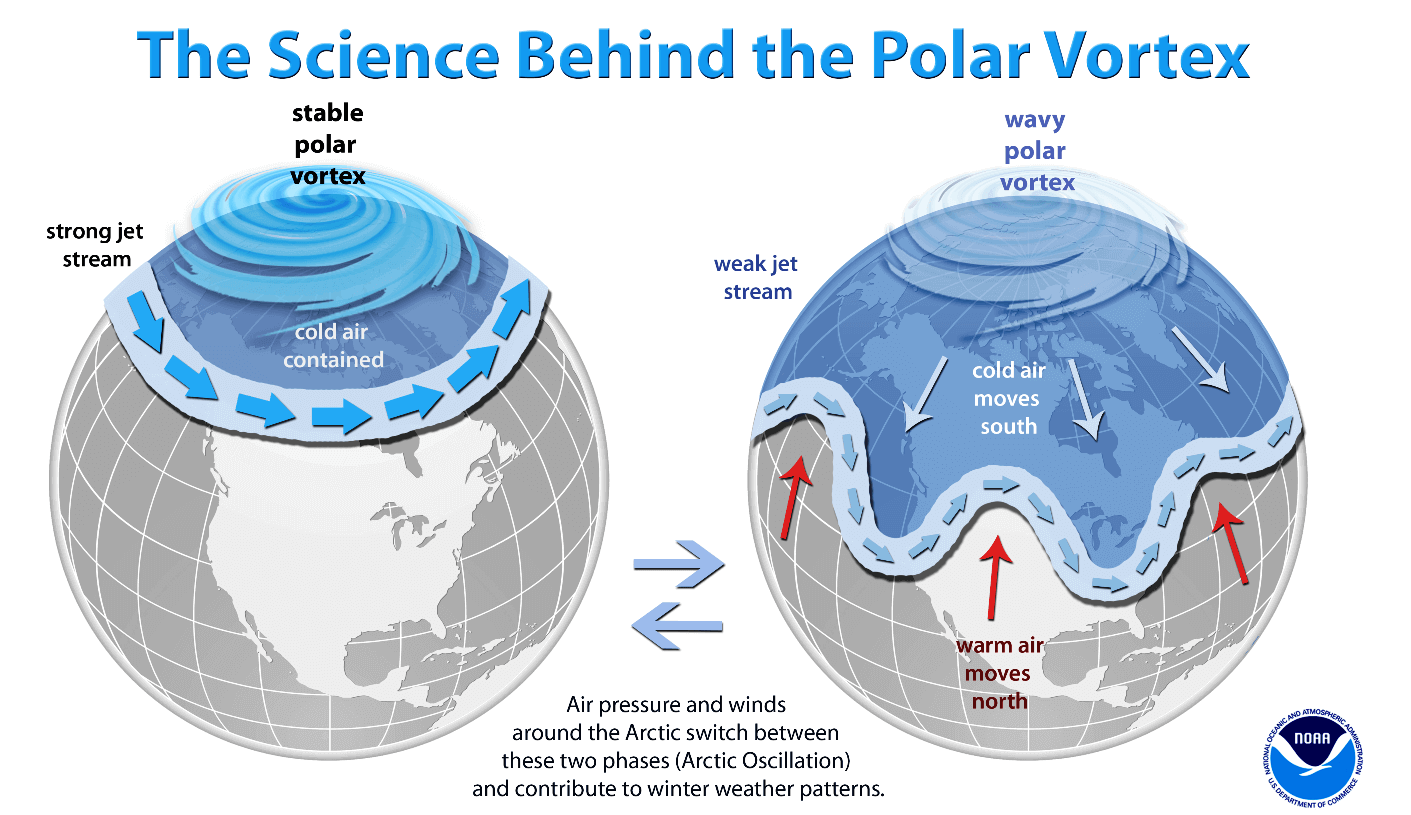
A strong Polar Vortex usually means strong polar circulation. This usually locks the colder air into the Polar regions, resulting in milder seasonal conditions for most of the United States and Europe.
In contrast, a weak Polar Vortex can create a disrupted jet stream pattern. As a result, it has a harder time containing the cold air, which has an easier way of escaping from the polar regions into the United States or Europe.
The most recent stratospheric warming event occurred in late March this spring. It was strong enough to influence the early Spring pressure patterns over the Northern Hemisphere.
A Sudden Stratospheric Warming event (SSW) can significantly impact the circulation and cause major pressure changes in the Northern Hemisphere. So we monitor these processes very closely.
Looking at the temperature profile at the 10mb level (30km/18.5mi), we can see a stratospheric warming wave developing over eastern Siberia in late March. Here we can also see the separation of the Polar Vortex core into two separate entities. That occurred as a stratospheric high-pressure system pushed in from the North Pacific.

The image below shows the vertical pressure anomaly from the surface up into the upper stratosphere over the North Pole. It gives us a better idea of the pressure anomalies changing with time and altitude. The red square marks the polar vortex collapse event.
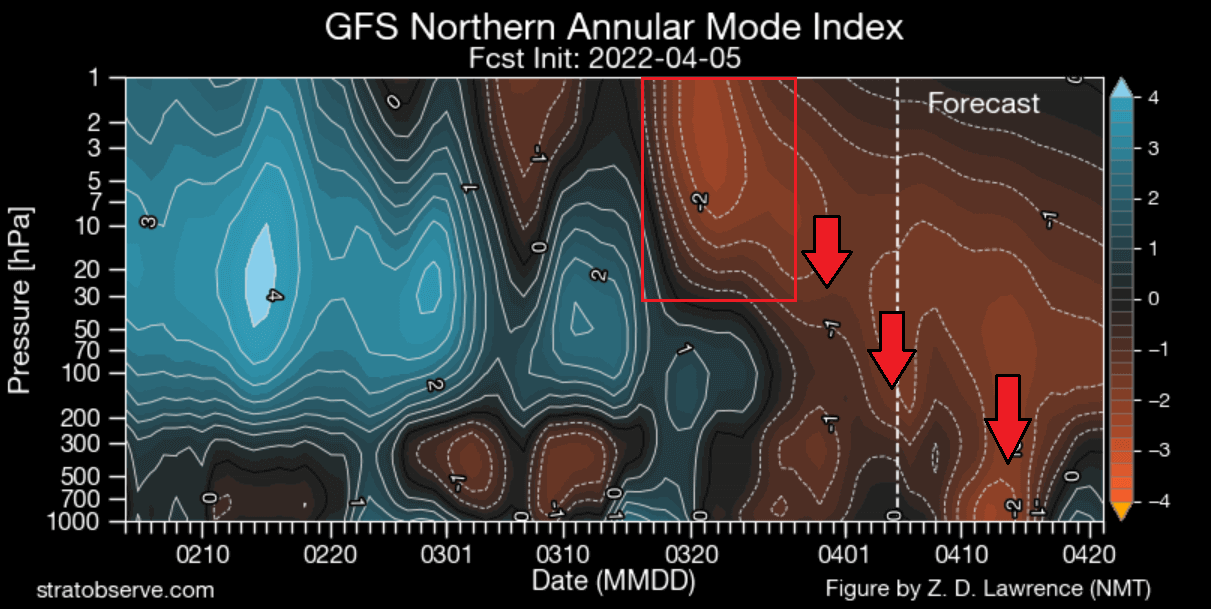
We can see by the arrows that the high-pressure anomaly resulting from the warming event was propagating down. It then connected to weather patterns, most pronounced in late March and early April.
This is how a stratospheric warming event typically operates. It breaks down the upper structure of the Polar Vortex, which then collapses downwards, impacting the weather at the surface.
Below is an image that shows an average temperature pattern 0-30 days after a proper mid-winter stratospheric warming event. High pressure over the Arctic helps to unlock the cold air out of the Arctic regions, sending it down into the mid-latitudes of the United States and Europe.
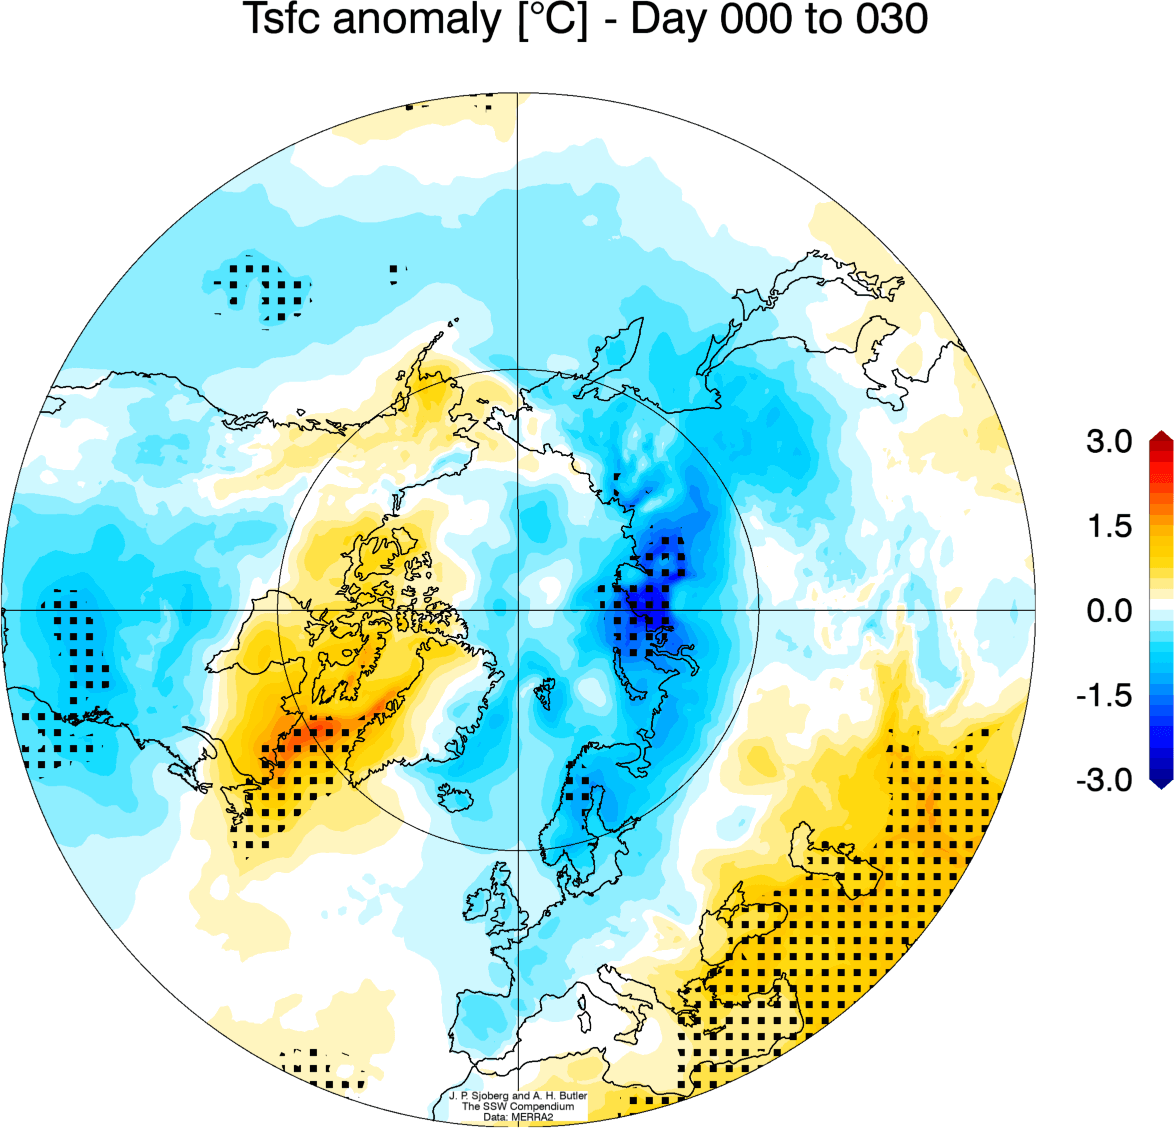
Of course, not every stratospheric warming event produces this pattern, but this is an average image of many events in the past 40 years. A lot depends on the already established weather patterns and the timing of the stratospheric warming event.
There is not much to look at in the forecast for the stratosphere. The ECMWF forecast for the 10mb stratospheric zonal winds shows a reduction of the stratospheric wind speeds in late Fall and early Winter.
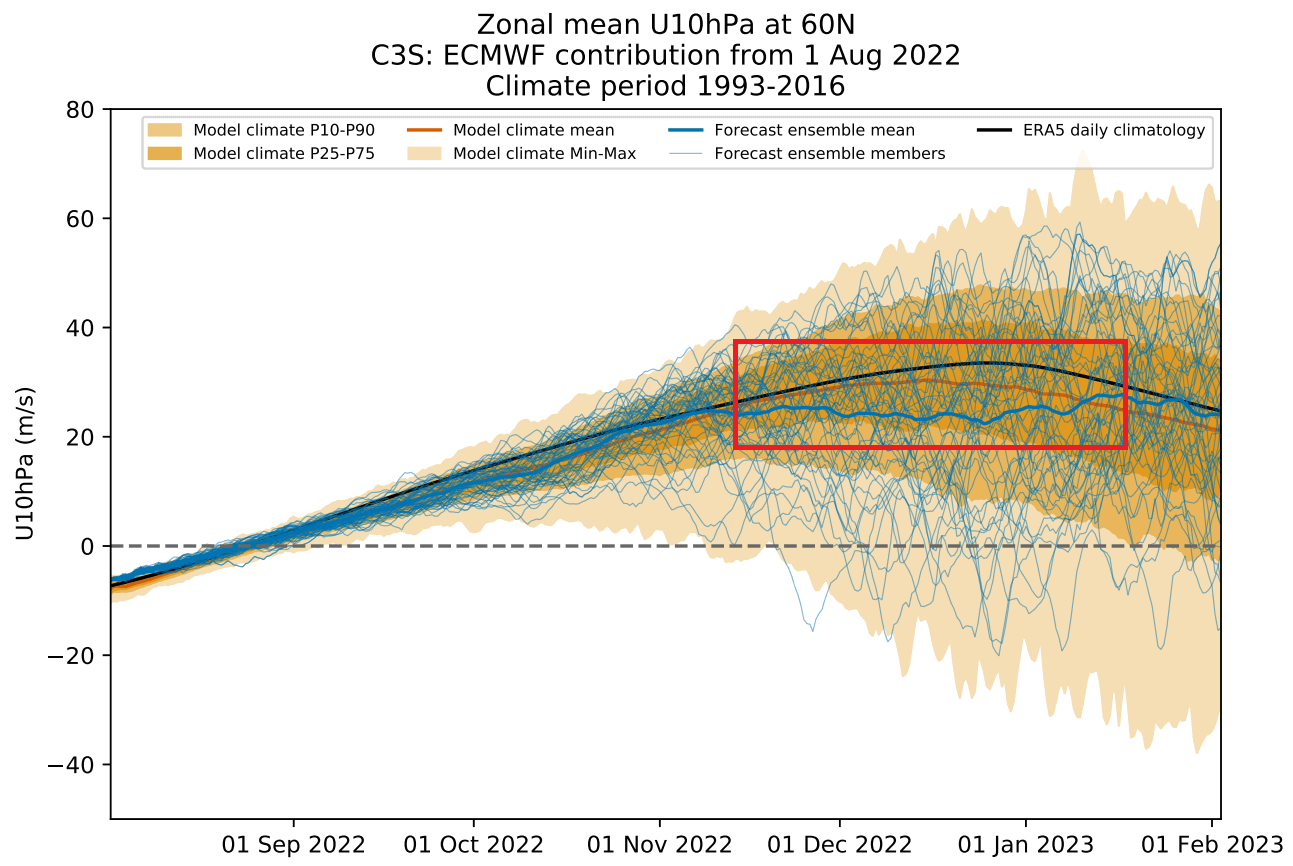
As winds are directly related to the strength of the Polar Vortex, we can see this as a signal for a weakening of the Polar Vortex. This is likely connected to the suggested negative NAO pattern in late fall and early winter, so the model is picking up some dynamics.
It gives us a signal to keep an eye on, as these dynamics can have a large-scale and long-lasting impact on the weather pattern during Winter.
We will keep you updated on the developing weather trends in the coming seasons, so make sure to bookmark our page. Also, if you have seen this article in the Google App (Discover) feed, click the like button (♥) there to see more of our forecasts and our latest articles on weather and nature in general.
Don’t miss: