A strong oceanic heatwave has formed in the North Pacific, following the weather pattern changes. These unusual anomalies can impact the regional weather and marine ecosystem but also have a wider meaning for the upcoming weather seasons.
A heatwave in the ocean is very similar to an atmospheric heatwave, which we all know as hot or very hot weather. The ocean temperatures can also rise above the normal levels due to changes in atmospheric pressure and wind patterns.
We will look at the latest such event developing in the North Pacific, how it forms and what it can tell us about the weather in the upcoming weather seasons.
OCEANIC HEATWAVES
The heatwaves in the ocean are better known as marine heatwaves or MHWs. These marine heatwaves are defined when temperatures are much warmer than normal for an extended period of time. They can have significant impacts on marine ecosystems and the food industry.
The map below shows the typical global areas where these ocean heatwaves occur. We will focus on the North Pacific today, as it is developing a new strong oceanic heatwave.
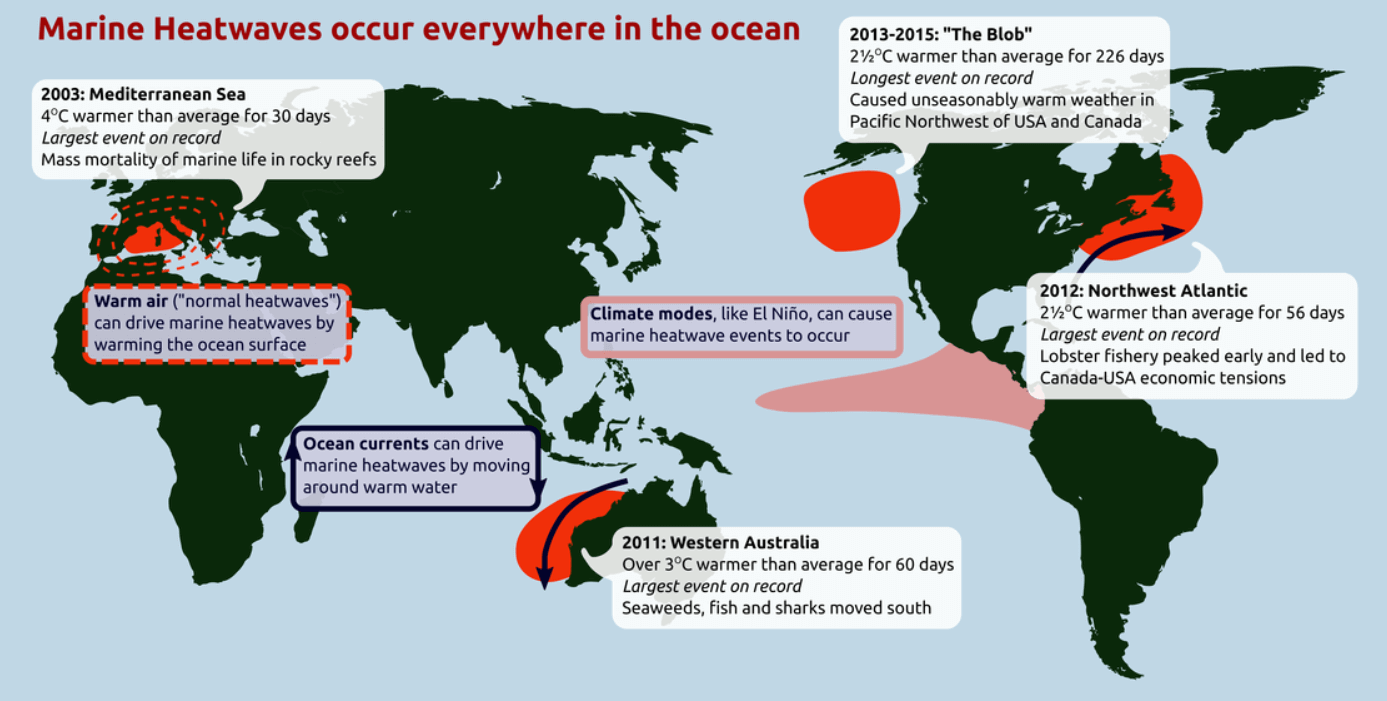
As you can see, the North Pacific “warm blob” of 2013-2015 was the longest such event so far. It also caused unseasonably warm weather in the Pacific Northwest of the United States and Canada.
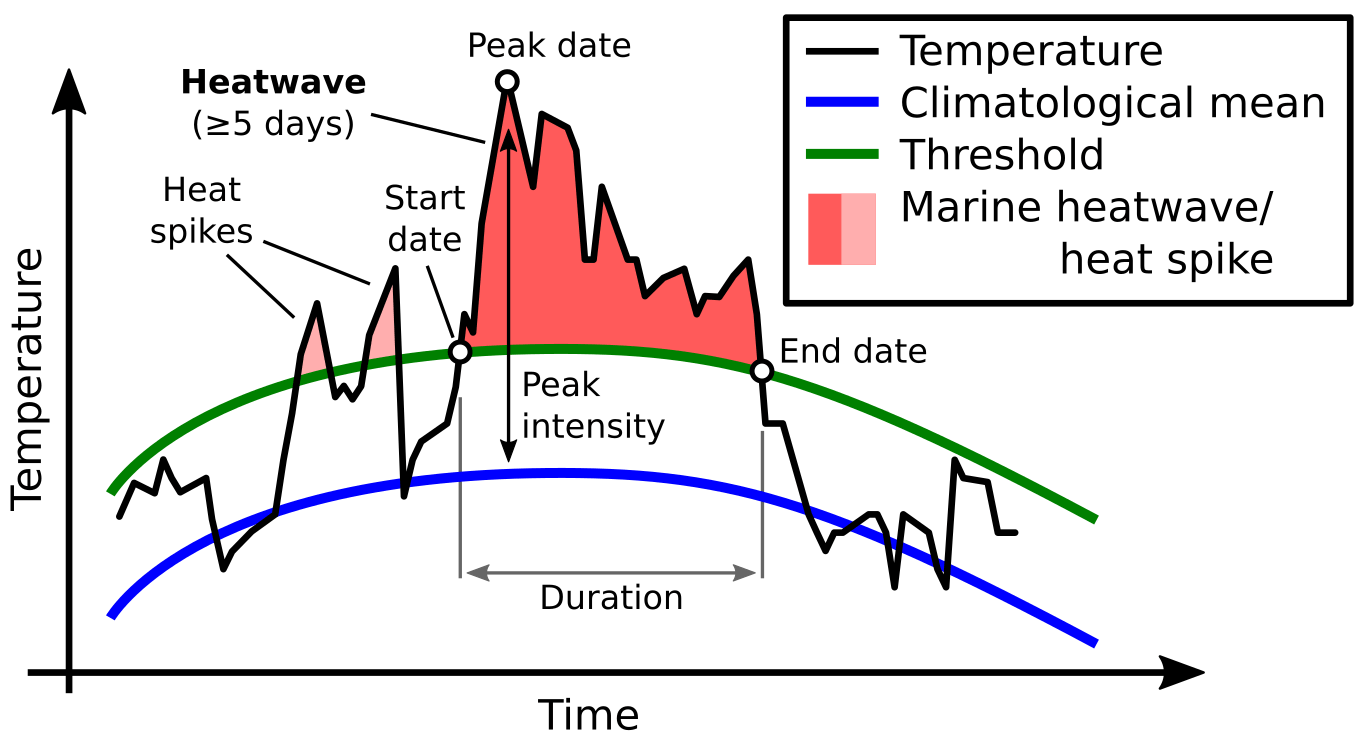
The image below shows the average progress of a marine heatwave event. Usually, an early phase starts with warmer than normal anomaly spike days. It takes consecutive days with abnormal temperatures to define an anomaly as an oceanic heatwave event.
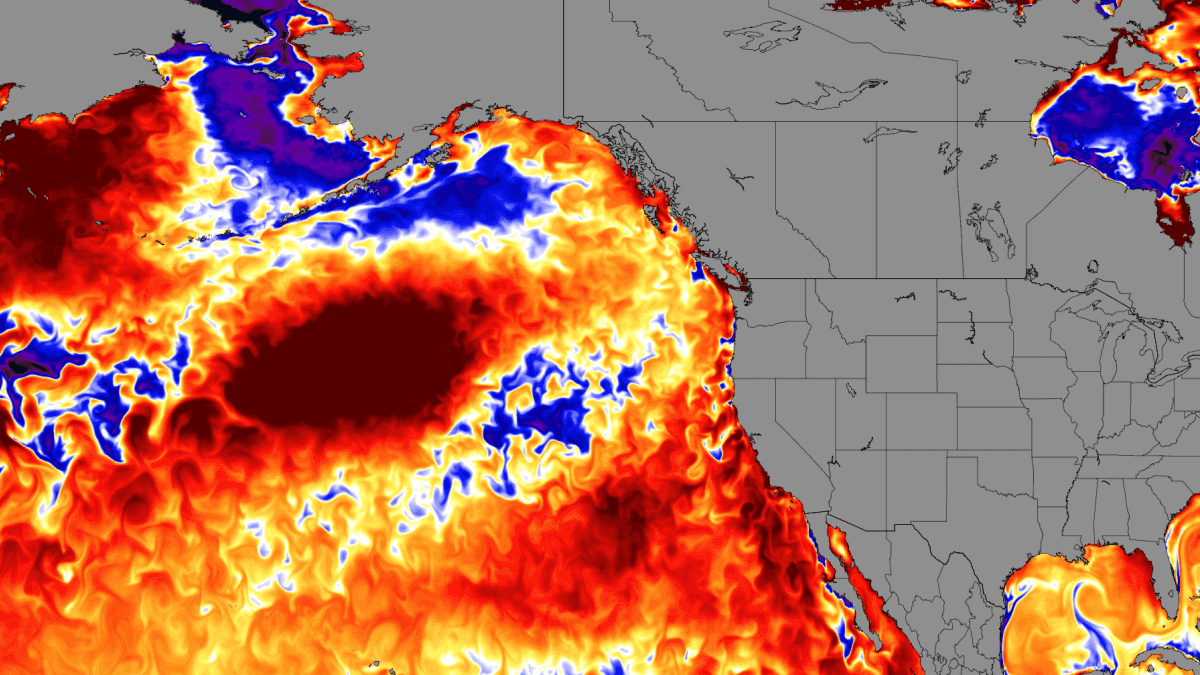
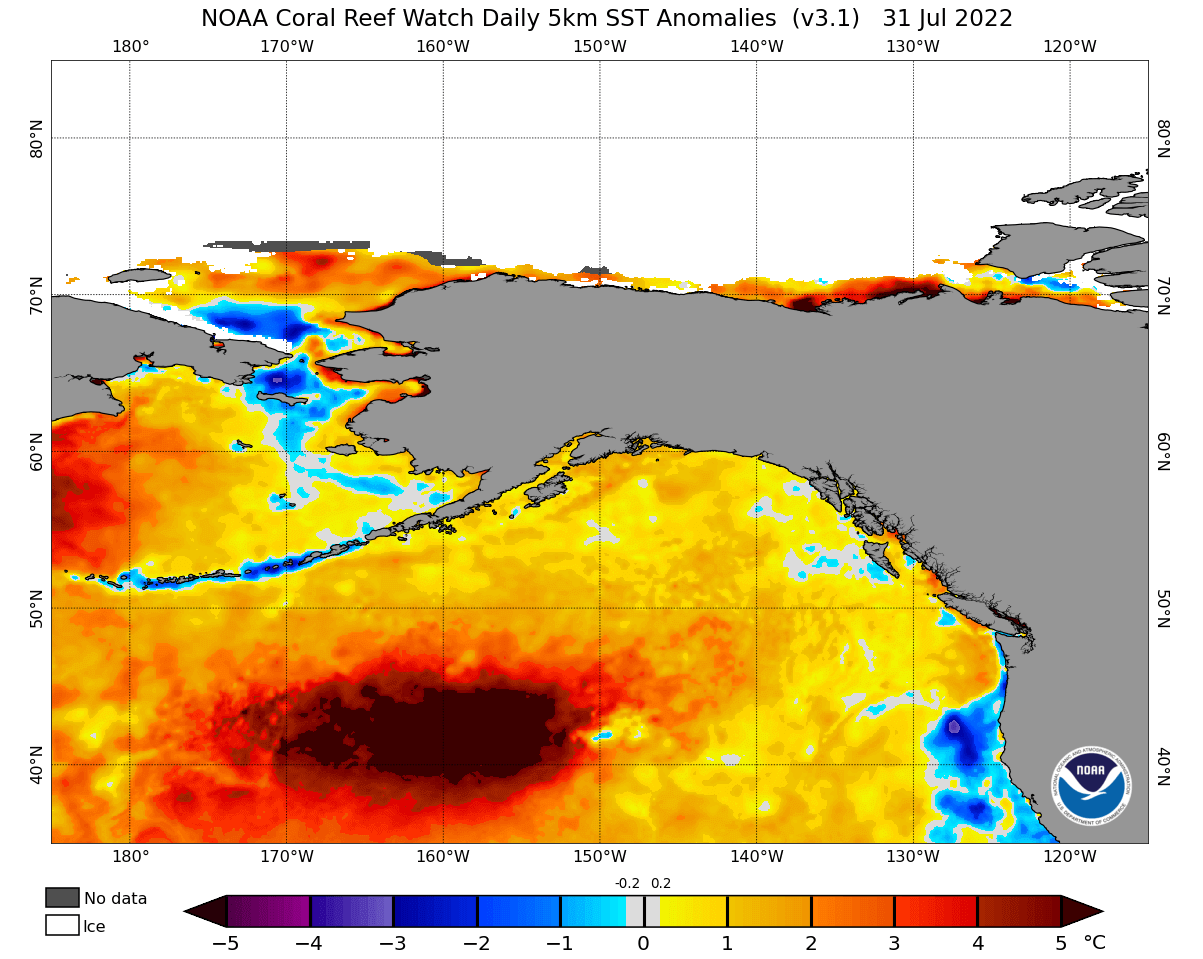
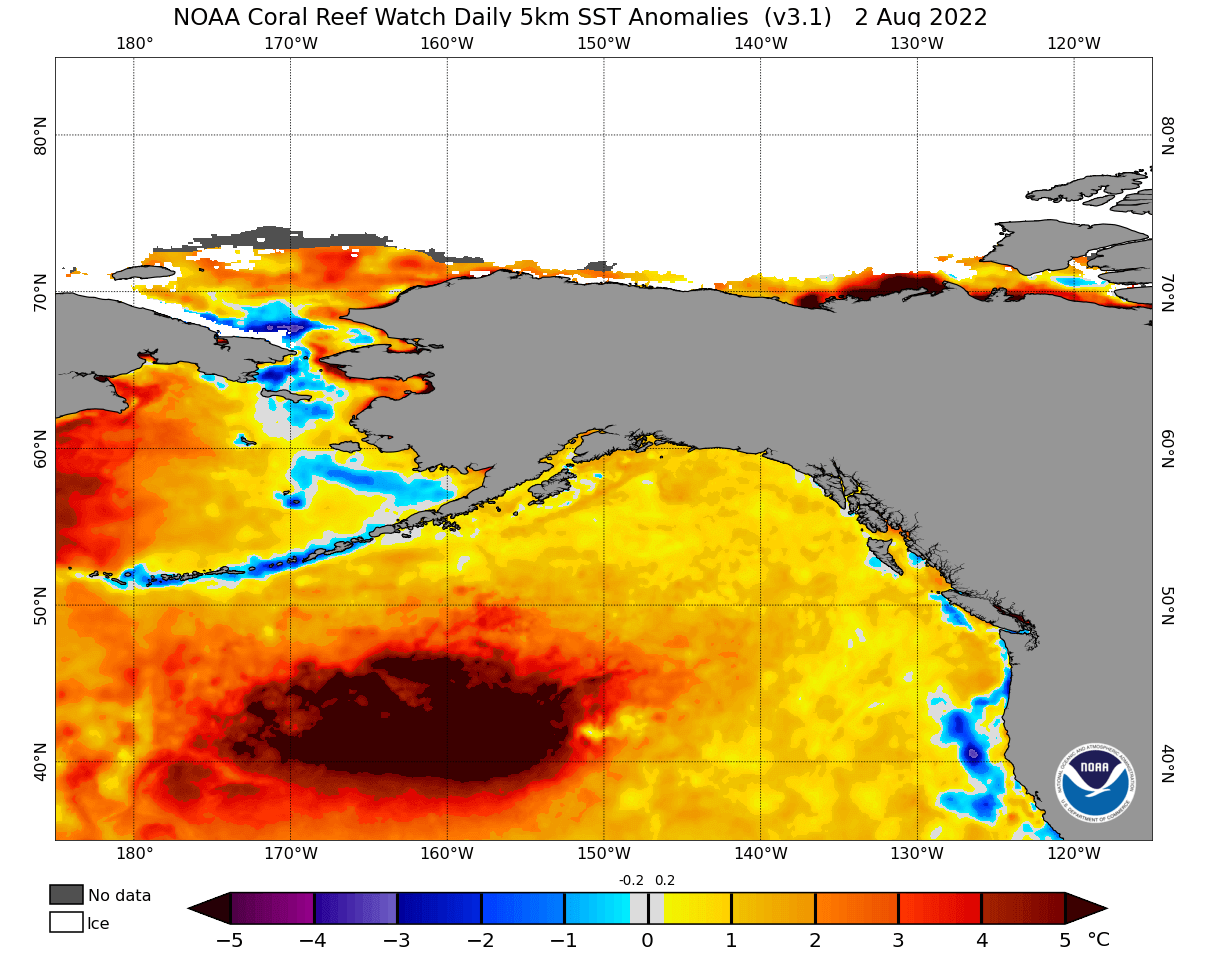
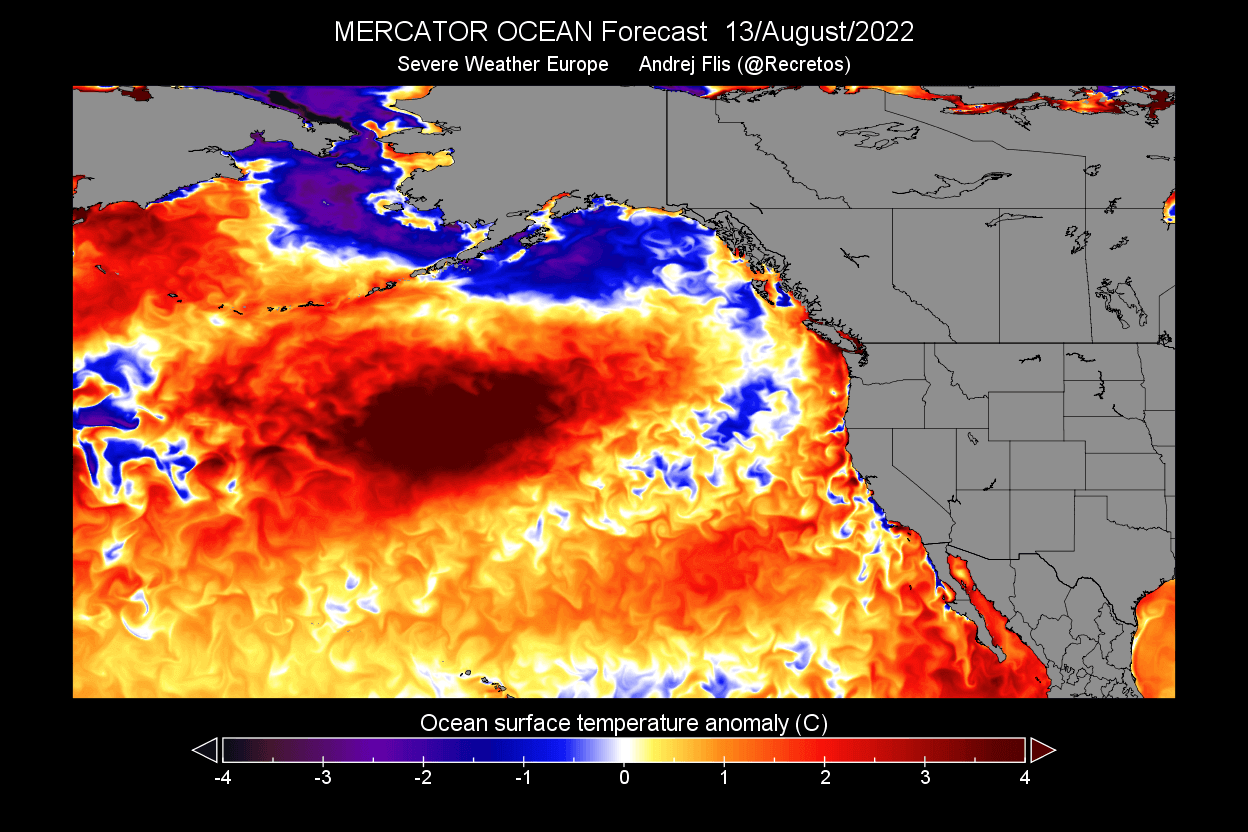
Below is a current global ocean temperature anomaly map showing where the ocean temperatures are warmer/colder than normal. We can see a strong warm anomaly in the North Pacific Ocean. It features temperature anomalies over 5 degrees Celsius.

Looking closer at the Pacific Basin, we can see the nice temperature contrast between the tropics and the North Pacific. There is an actual connection, as usually, the tropical anomalies are reversed in the North Pacific. Here we see the active La Nina in the tropical Pacific.
This is called an “Atmospheric Bridge.” You can see that in the image below, revealing the connection between the tropics and the North Pacific. It is opposite to what we have now, but the principle is the same. Pressure and wind patterns change, affecting the circulation.

The video below shows the temperature anomaly development in the North Pacific since May. You can see the onset of the strong oceanic heatwave in the North Pacific, starting in May, but the strong “warm blob” developed in July.
ATMOSPHERE AND THE OCEAN
As mentioned, the development of this oceanic event began in May. In the mid-month, a high-pressure area was strengthening over the Aleutians. A strong low-pressure area was present over the northwestern United States and Canada.

Looking at the ocean temperature anomalies in the region, we can see ocean surface cooling in the northeastern Pacific from the low-pressure anomaly over the United States and Canada. Persistent warm anomalies are seen in the central North Pacific.

The high-pressure system moved further east in the next month. This temporarily reversed the developing cold anomalies in the far northeast Pacific, making the weather there calmer and lowering the heat exchange from the ocean to the air.

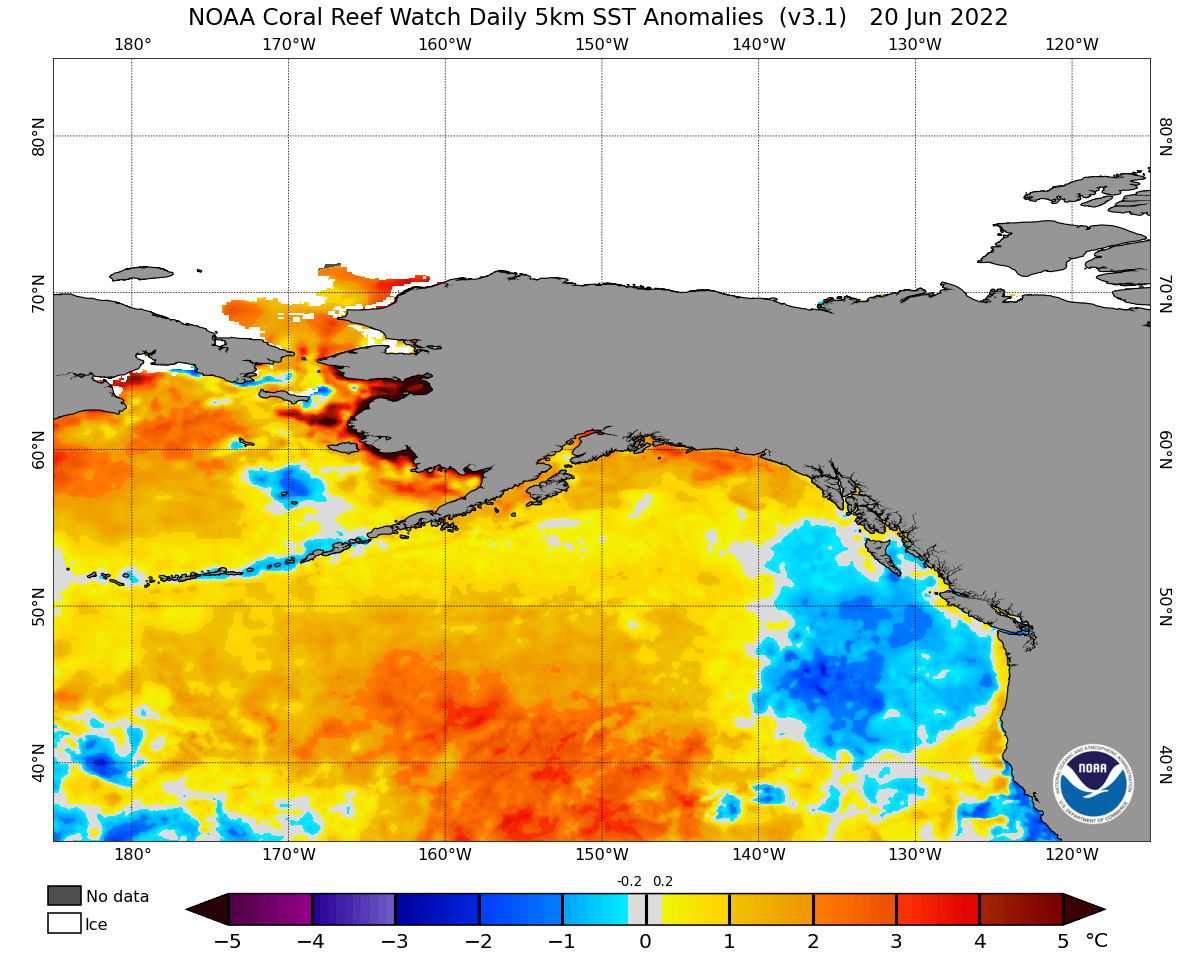
We can see on the mid-June ocean anomaly image below that the cold coastal anomalies have turned into warm anomalies in the far northeast Pacific. That shows the effect a high-pressure system can have on ocean surface anomalies.
A WARM BLOB APPEARS
But, there was a pattern change in the North Pacific going into July. A strong low-pressure system came down from the north and over the Aleutians. As a result, a strong high-pressure system has strengthened over the central North Pacific. That plays a key role in this whole story.

The main effect of the high-pressure system is that it lowers the rate of heat loss from the sea to the atmosphere. That is due to the warmer air above the water surface and the very calm weather. Weak winds mean calmer ocean surface and less mixing of the ocean waters.
The ocean gets colder the deeper you go. So low-pressure systems and strong winds create waves and rough seas, mixing the warm top layers with deeper colder layers, thus cooling the ocean’s surface. There is much less mixing and cooling with calm weather, and sea surface temperatures can rise.
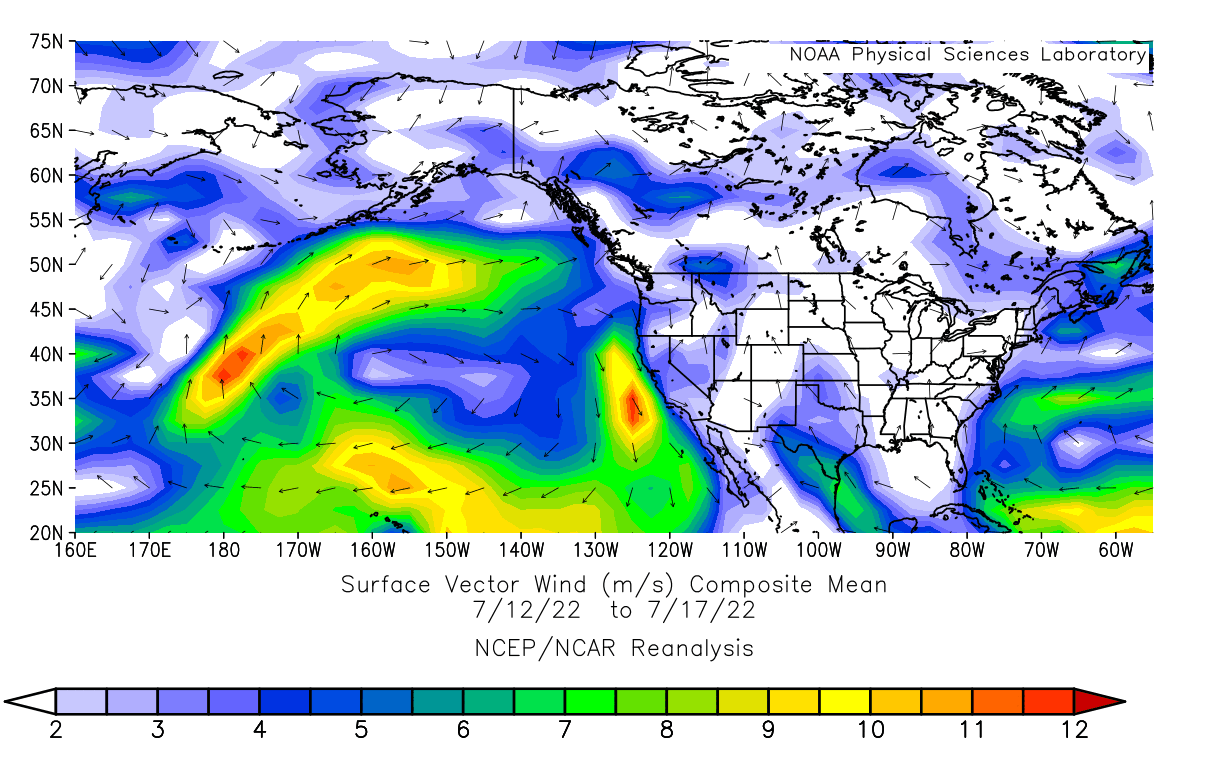
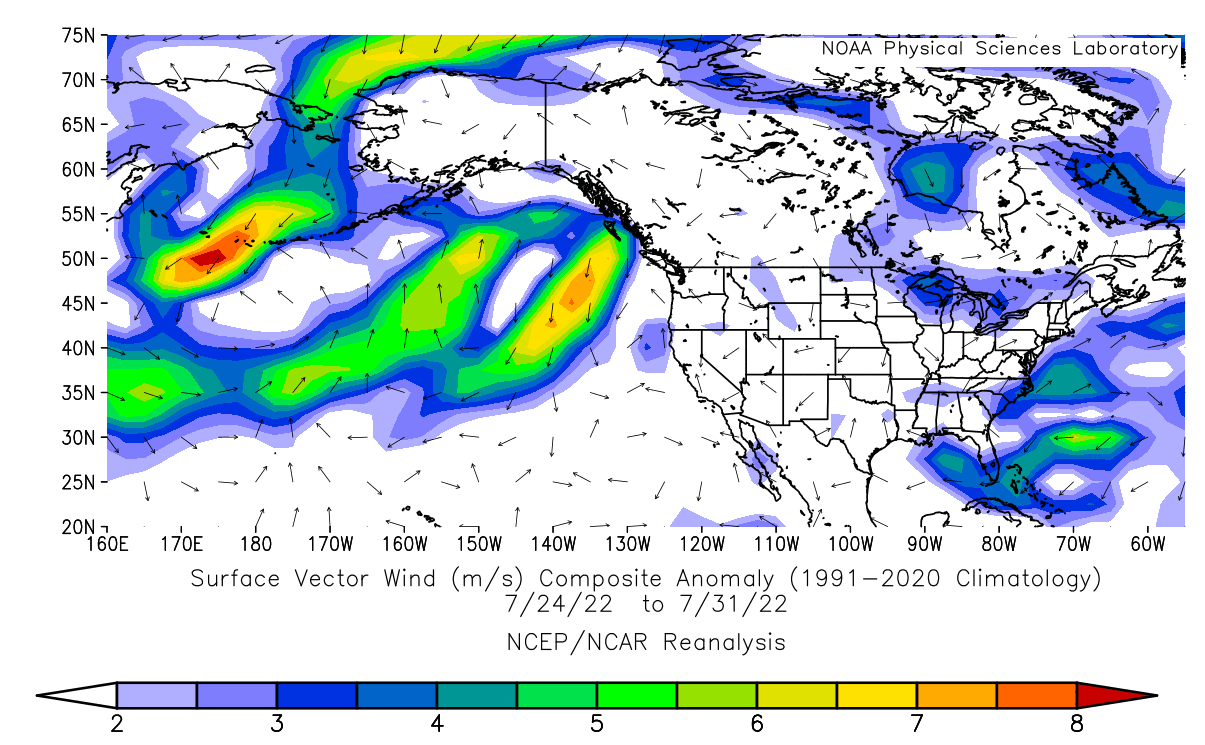
The image below shows the anomalous southerly and westerly winds around the high-pressure system in the far north Pacific Ocean. Westerly and southerly winds promote warming of the ocean surface, while easterly winds promote ocean mixing and upwelling (cooling).

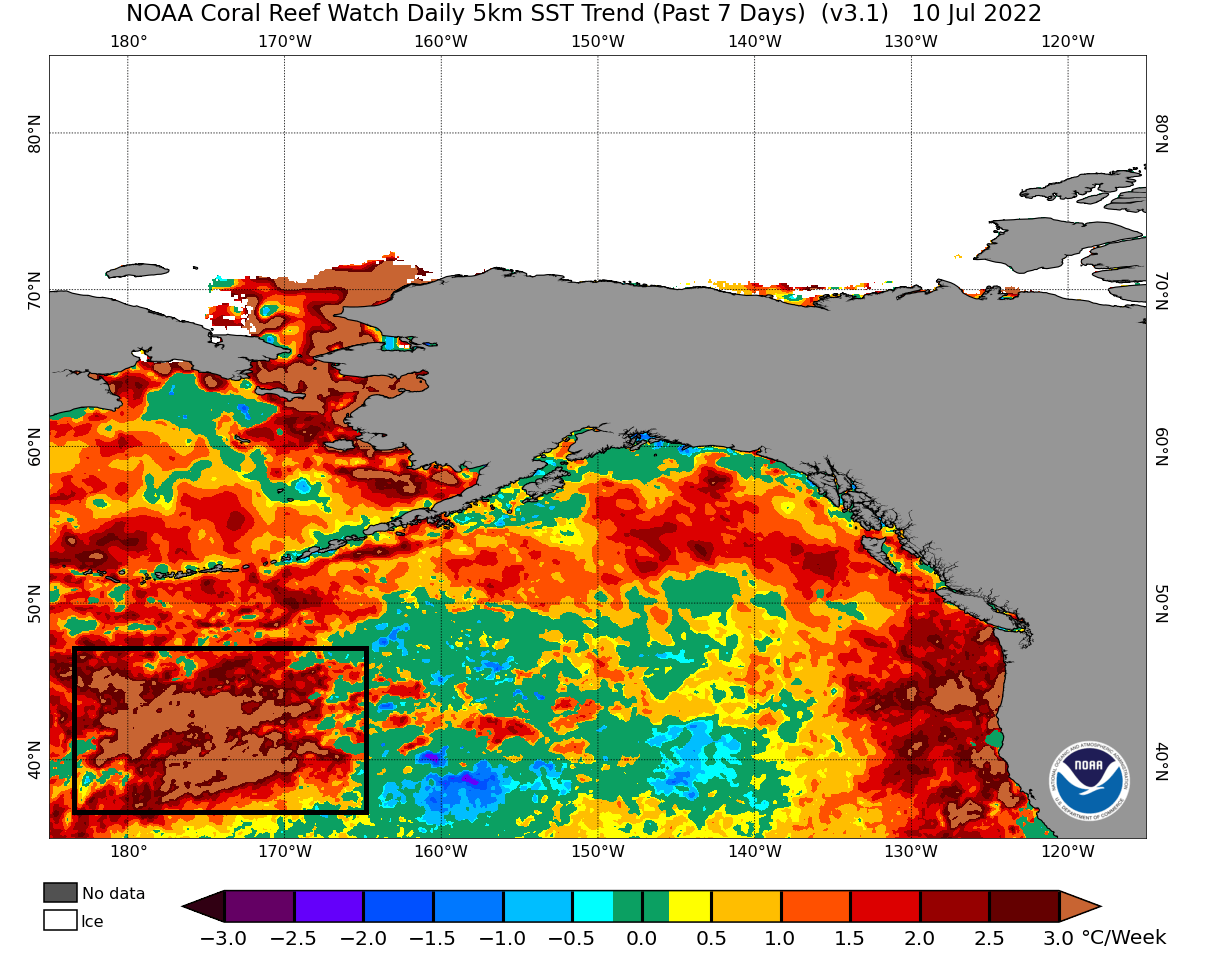
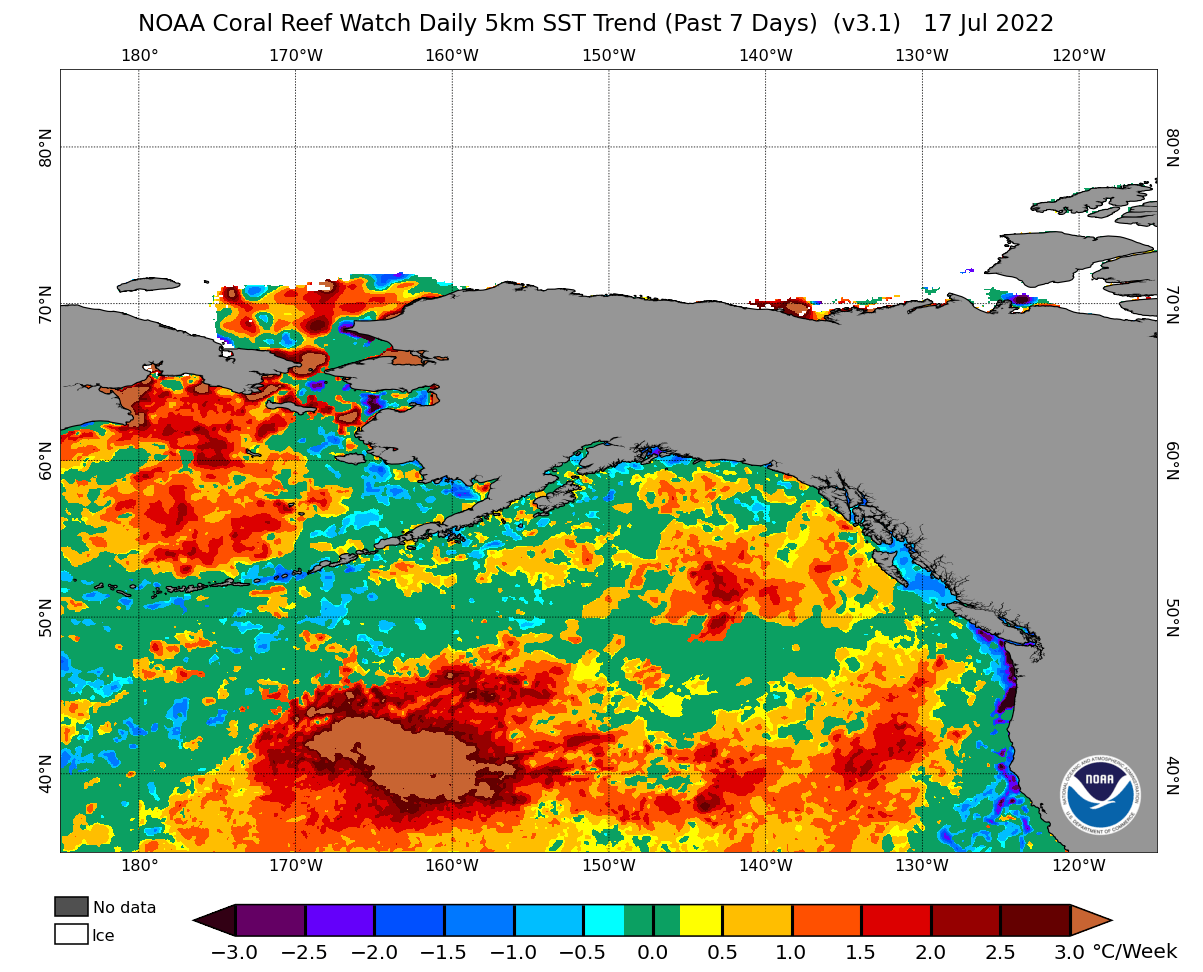
We have a special graphic below from the NOAA Coral Reef Watch project. It shows the 7-day temperature trends on the ocean surface. We can see a strong warming trend developing from the west in the central North Pacific, related to the push of westerly winds.
Combined with the effects of the high-pressure system, this has helped to kickstart a large warm ocean anomaly in the far north Pacific Ocean. Surface temperatures rose 3-4 degrees celsius over a wider area. This is the beginning of the so-called “warm blob” anomaly.
THE ANOMALY GROWS
Going into mid-July, the strong low-pressure area moved from the Aleutians into western Canada. The high-pressure system remains stationary in the North Pacific. A smaller low-pressure area moved in from the west, interacting with the high-pressure in the North Pacific.
The interaction between the pressure systems is best in the wind analysis. We can see a strong push of westerly and southerly winds around the high-pressure system. It is amplified by the pressure difference between the weather systems.
We can see the combined effect of the high-pressure system and wind patterns on the sea surface temperature trends below. In mid-July, the 7-day trend showed an area of strong temperature increase.
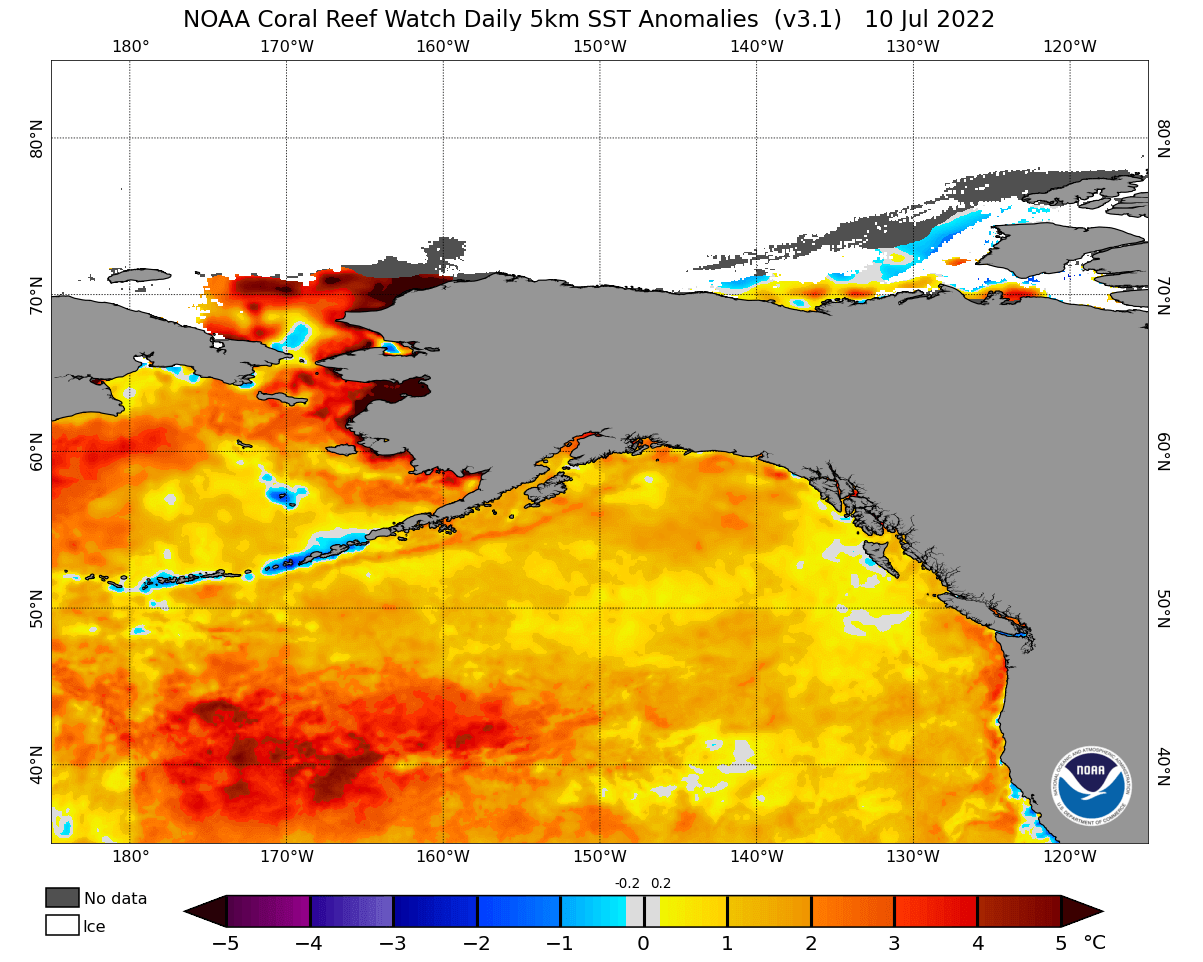
We can see a large area of abnormally warm waters looking at the actual anomalies. That is the final birth of the currently ongoing “warm blob” event or an oceanic heatwave. It is a combined result of pressure and wind patterns.
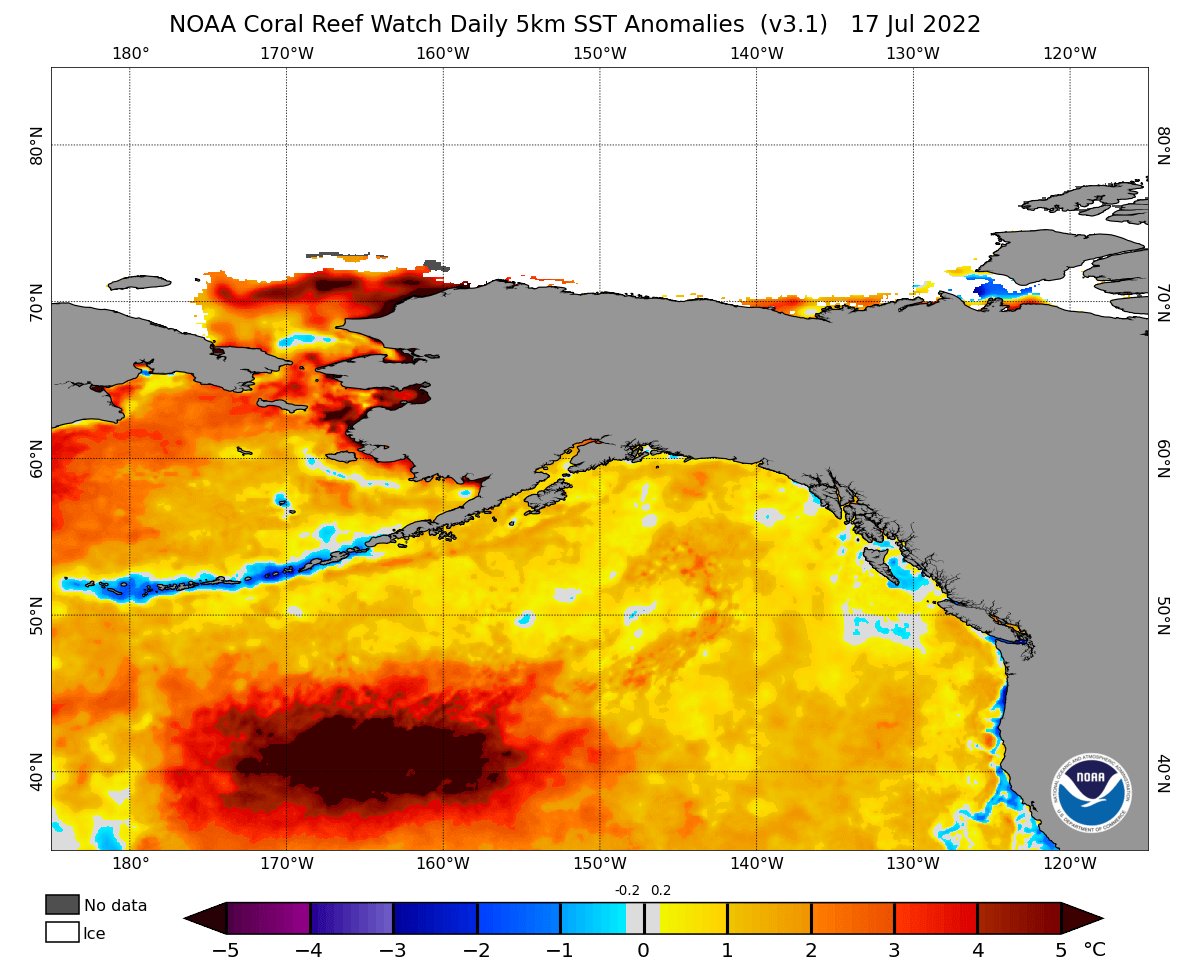
The NOAA Coral Reef Watch project also produces special graphics, revealing oceanic hot spots worldwide. As you can see in the image below, the strong warm anomaly in the North Pacific has lit up the area very quickly.

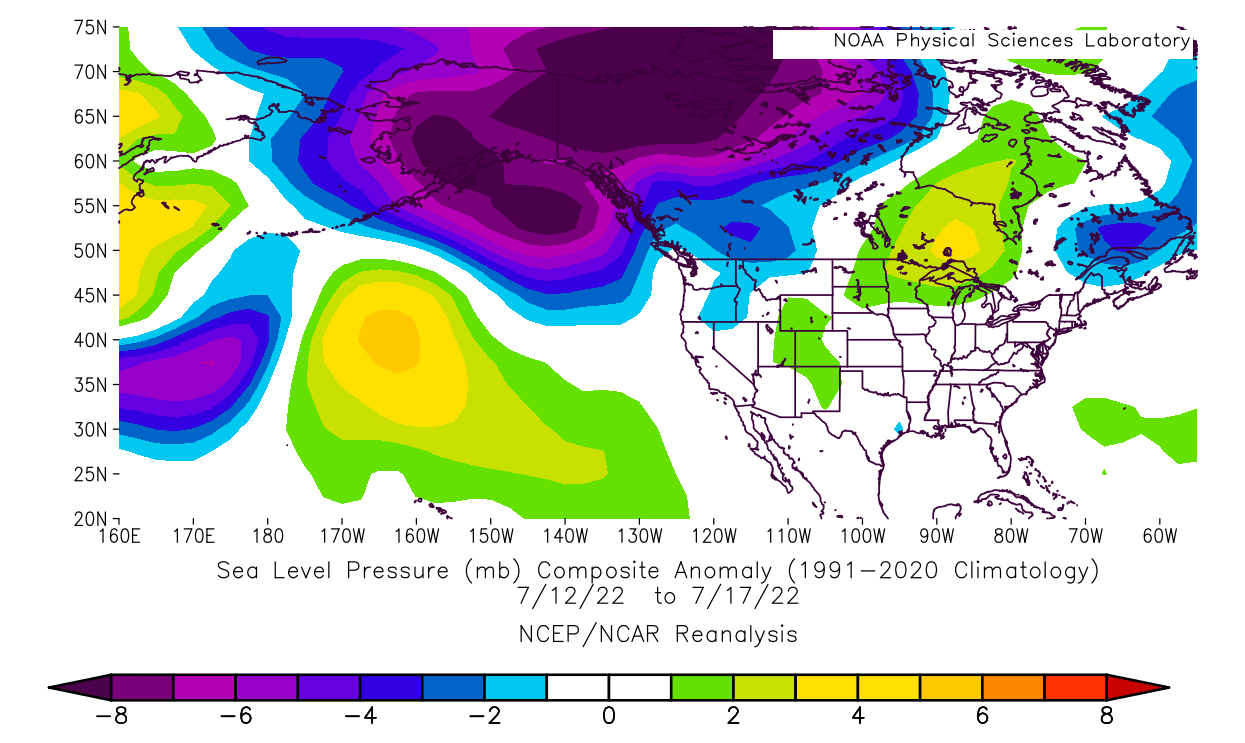
In late July, the low-pressure system in the North Pacific moved further east. The high-pressure area has begun to weaken. A broad southerly and westerly wind field has developed between the pressure systems.
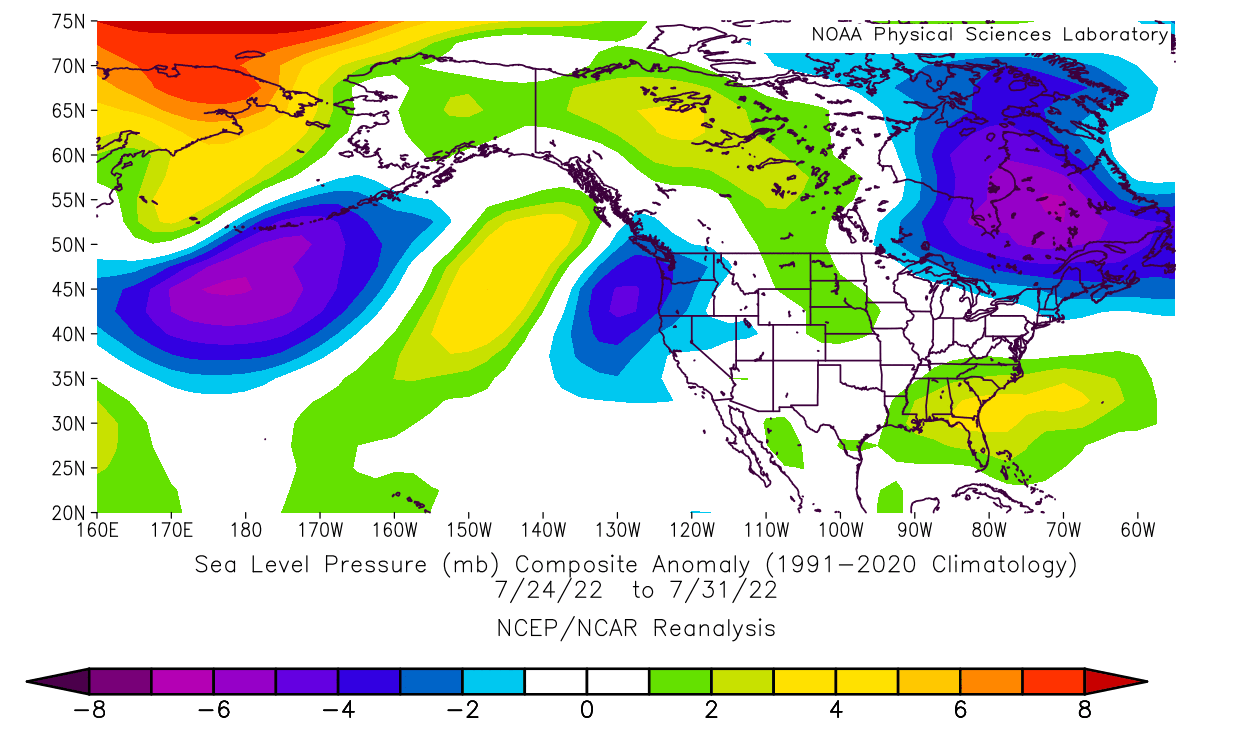
Looking at the wind analysis, we can see anomalous southerly winds developing in-between the two pressure systems. This provided means of sustaining the warm anomaly in the North Pacific Ocean.
Below we can see the oceanic heatwave anomaly in the North Pacific on the last day of July. Compared to a week before, it has extended further to the east.
LATEST OCEAN ANALYSIS
But what is the current status of this warm blob anomaly?
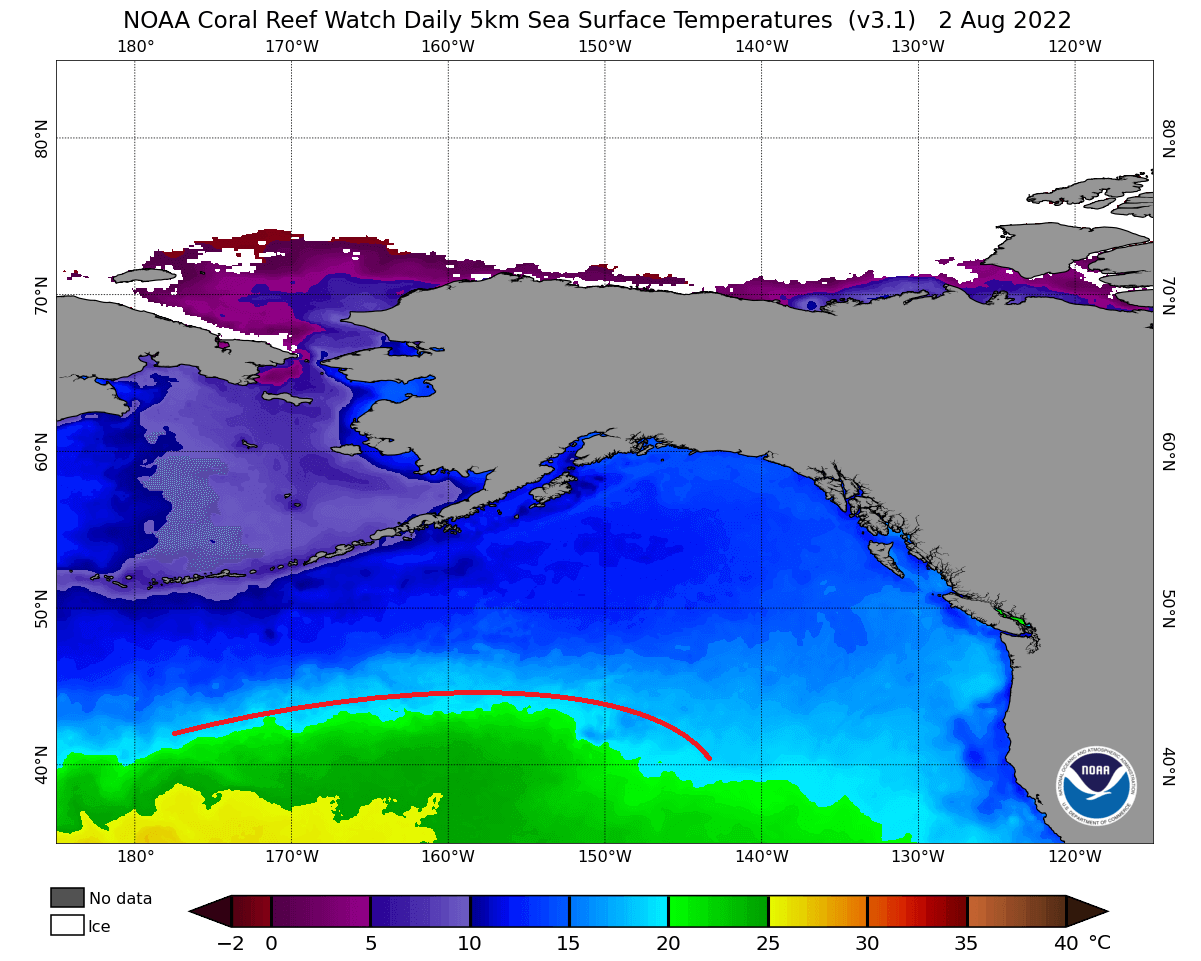
Looking first at the actual ocean surface temperatures, we can see the “ridging” on the ocean surface. This shows that the ocean waters are not necessarily hot or warm, as the anomaly suggests. But higher than normal temperatures reach much further to the north than ordinary.
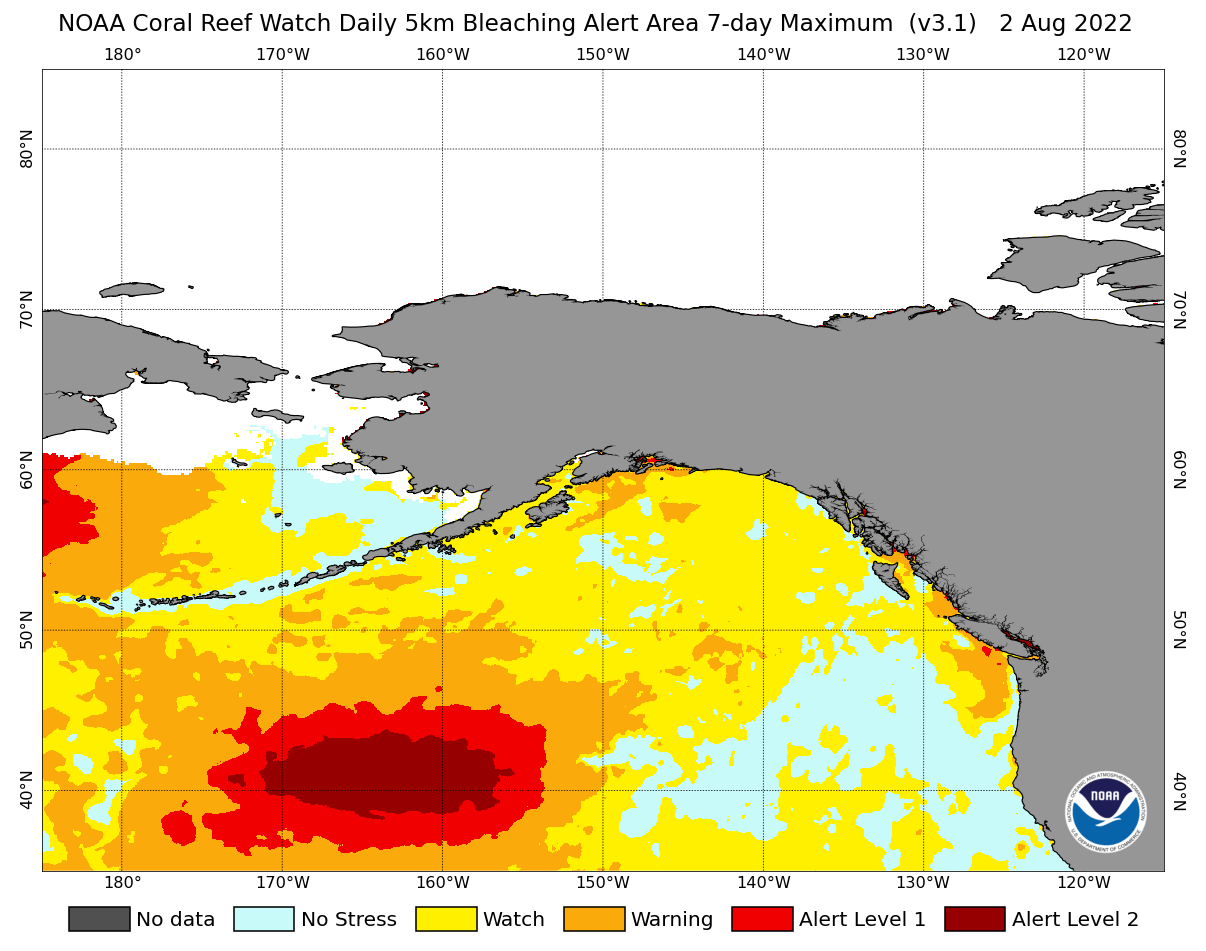
The coral bleaching alert system has also detected this North Pacific heatwave at the warning level for coral bleaching. But this is not a concern as the water there is deep, with no corals at the surface level. But if there were, the temperatures would be hazardous for the corals and their ecosystem over a wide area.
Temperature trends from the NOAA analysis show continued warming of the ocean surface in the North Pacific. The main area of temperature increase is around the hot spot, spreading towards the north and the east.

Temperature anomaly shows this spread towards the east, as the 4-5 degree anomalies are now approaching the 150 degrees westerly longitude. Anomalies have also increased to the north, aided by the southerly winds.
Below is another special product from NOAA Coral Watch, showing the heating weeks. This graphic shows accumulated heat stress during the most recent 12-week period. We can see quite strong values of over 12°C, indicating a strong hot spot developing.

But there is one more way to look at this developing oceanic heatwave. By looking at depth across the anomaly, we can see its extent downwards. The analysis below shows that the strongest anomalies reach no further than 20-40 meters (65-130ft) in depth.
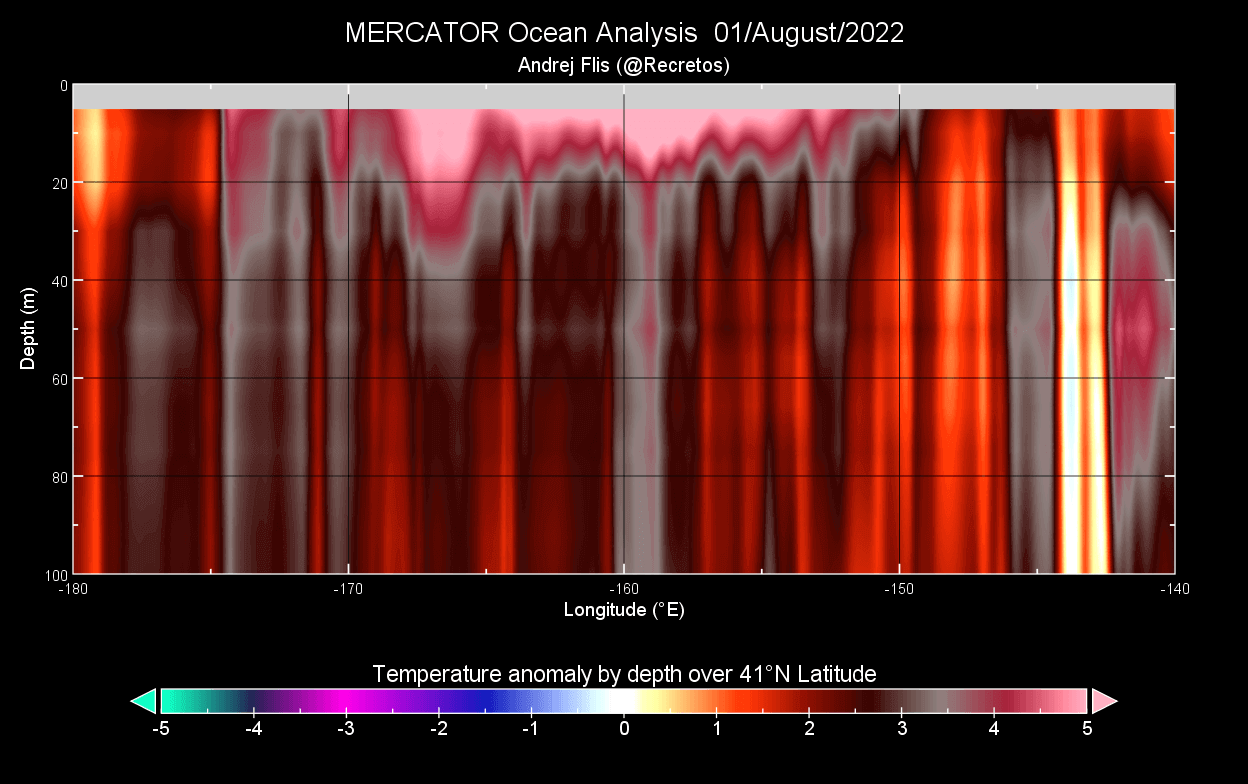
This confirms that the event is linked to the changes in weather patterns over the North Pacific Ocean and North America. Ocean surface changes from weather patterns are normally limited to the upper-most layers of the ocean.
WEATHER FORECAST
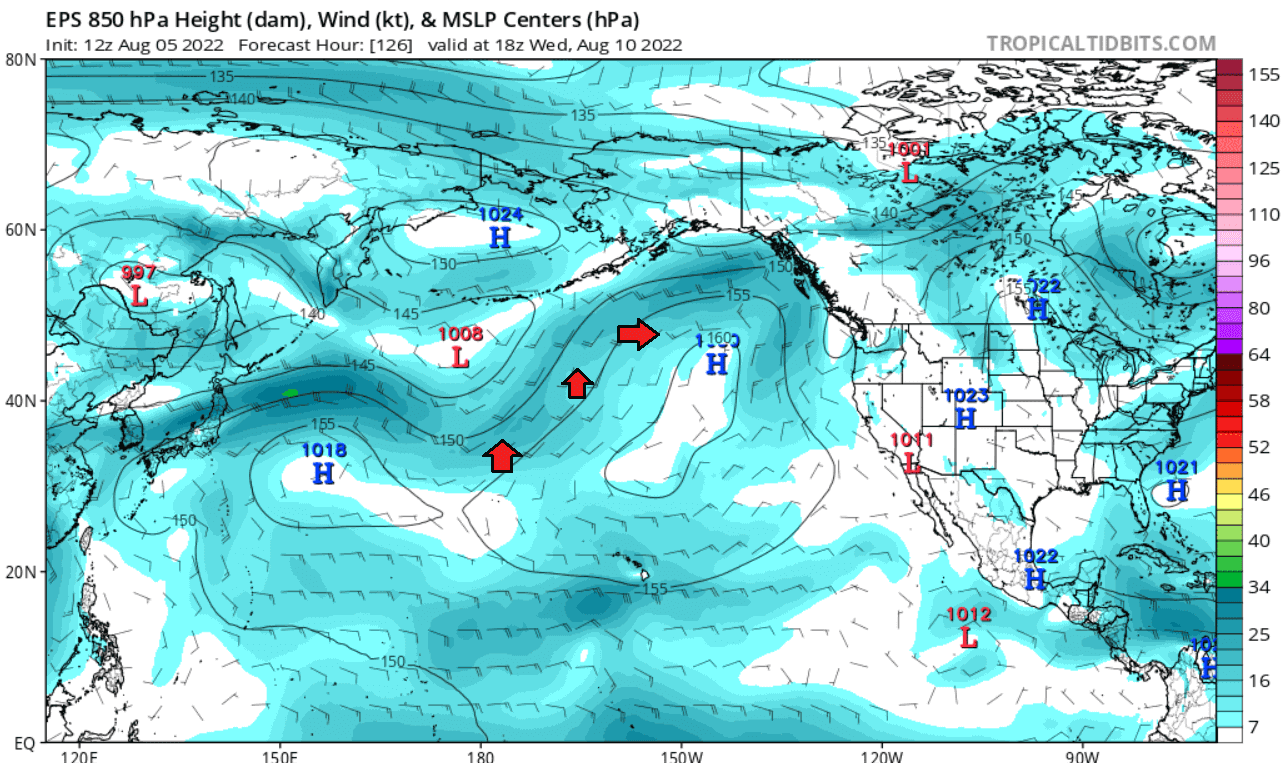
Speaking of weather patterns, the forecast for the next week does show the same high-low pressure system pair in the northeast Pacific. Between these two weather systems, a southerly flow is expected to continue.
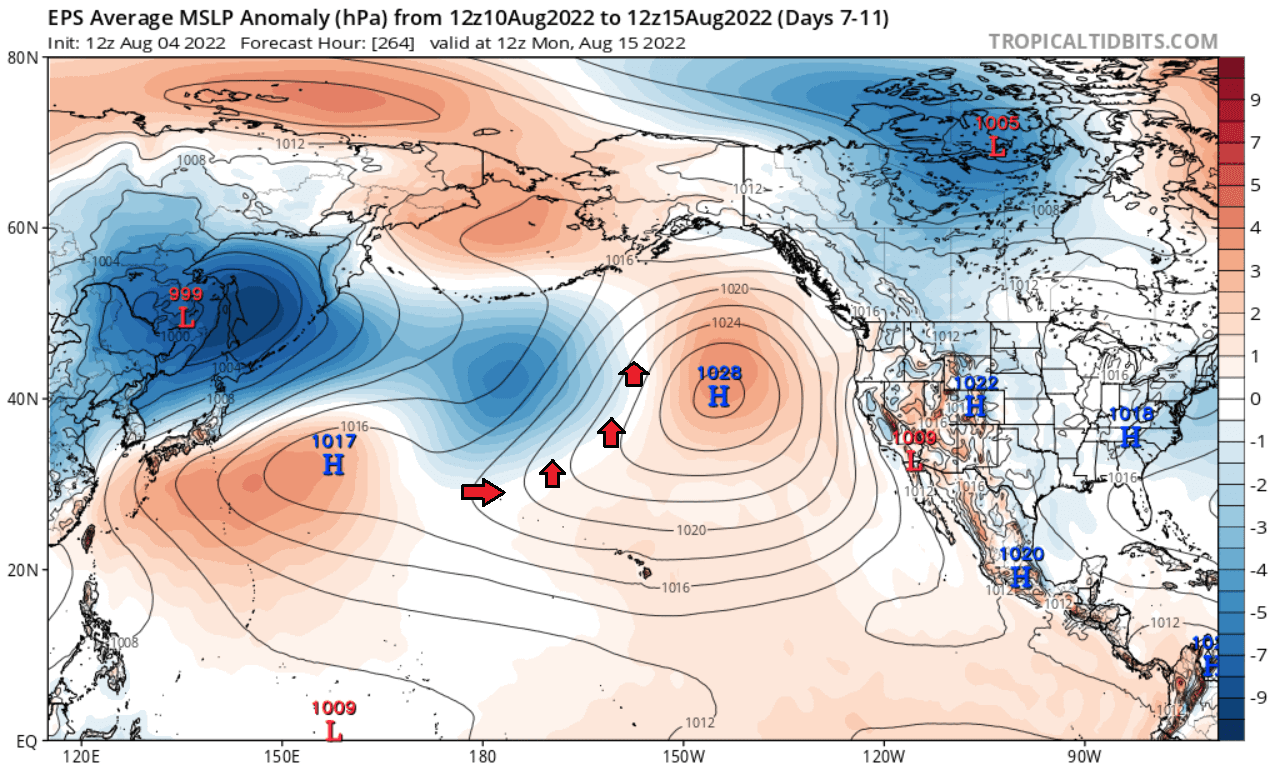
We can see this in the wind forecast from the ECMWF ensemble system. The high and low systems are marked, and we can see the wind flow in-between the pressure anomalies. With the high-pressure moving to the east, it will help expand the hot spot area.
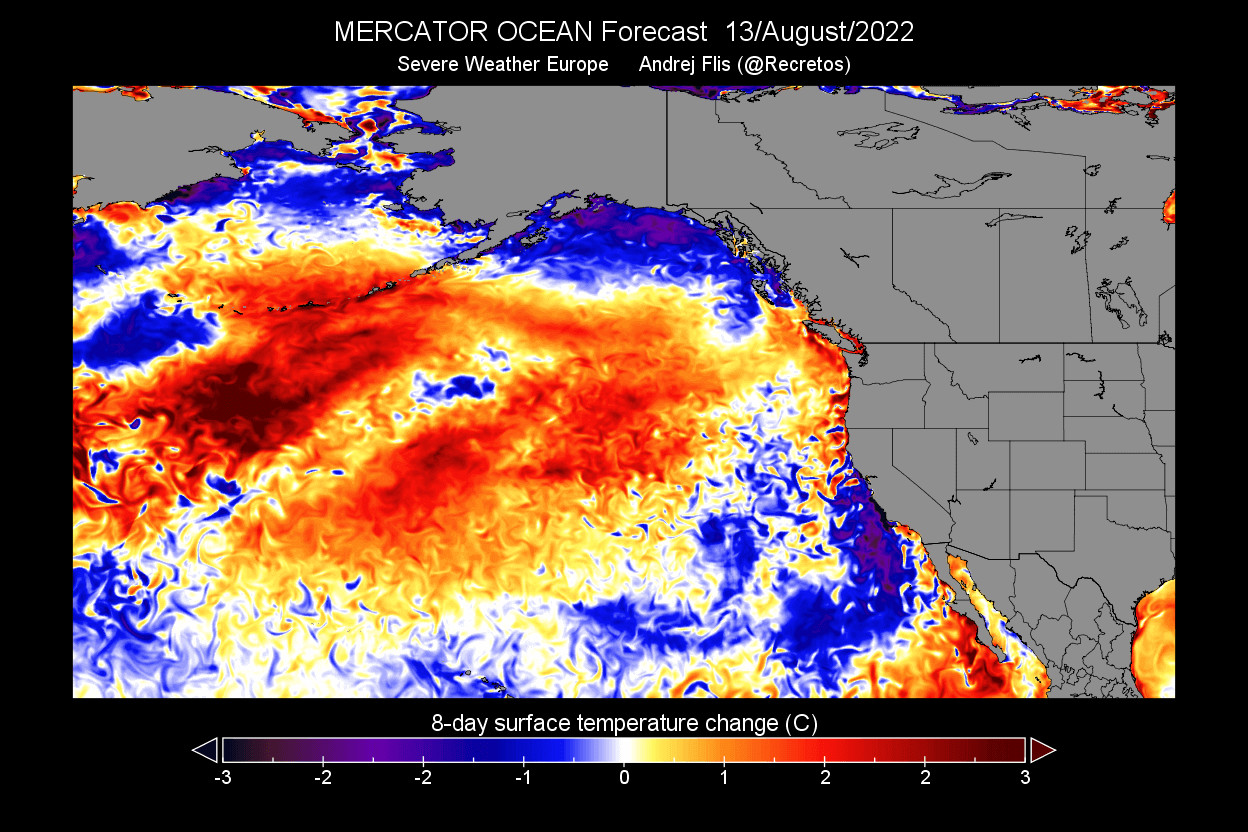
The ocean temperature anomaly forecast shows the continued presence of this hot spot in the North Pacific. It is forecast to extend further to the east. Strong warm anomalies over 4 degrees celsius are sustained over a wide area.
The weekly temperature change forecast shows the spreading of this hotspot to the east. But we can also see another area of temperature increase further over the west, also related to changing weather patterns in the region.
PAST OCEAN EVENTS
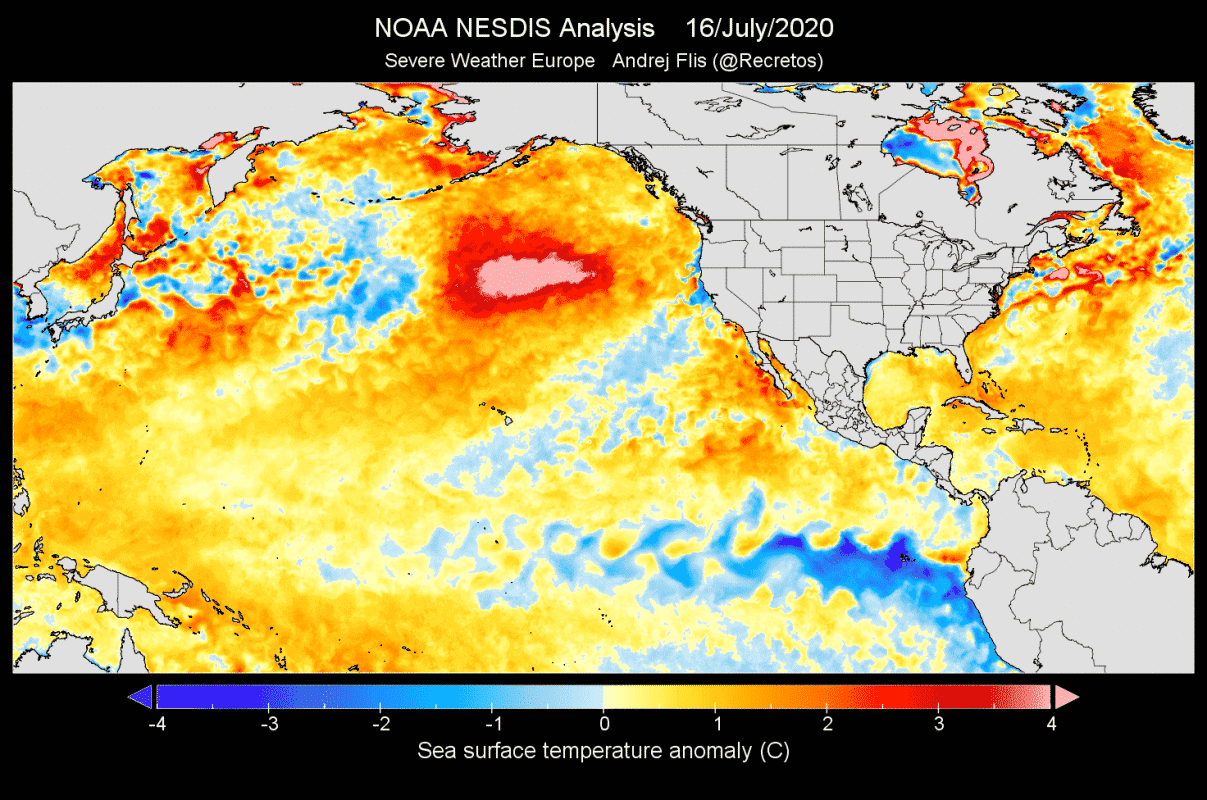
But, this is not the first such ocean heatwave in the North Pacific. There were a few strong events in recent years. Below we have the ocean anomaly analysis for last July, showing a similar but weaker event. This anomaly was closer to the west coast of the United States.

One such event was also last July 2020, with ocean surface temperatures peaking over 6 degrees celsius above normal. The image below shows the ocean temperature anomaly in this event, located in a similar area as the current event.
Another strong event was in 2014. A warm anomaly began developing during the winter of 2013/2014. Yes, ocean heatwaves can happen during the winter. They are not defined by raw temperatures but by the deviation from the normal anomalies.
These events can cause unusually warm ocean temperatures, affecting marine life throughout the year. This was just the beginning, as the Northeast Pacific ocean remained warmer than normal throughout 2014.
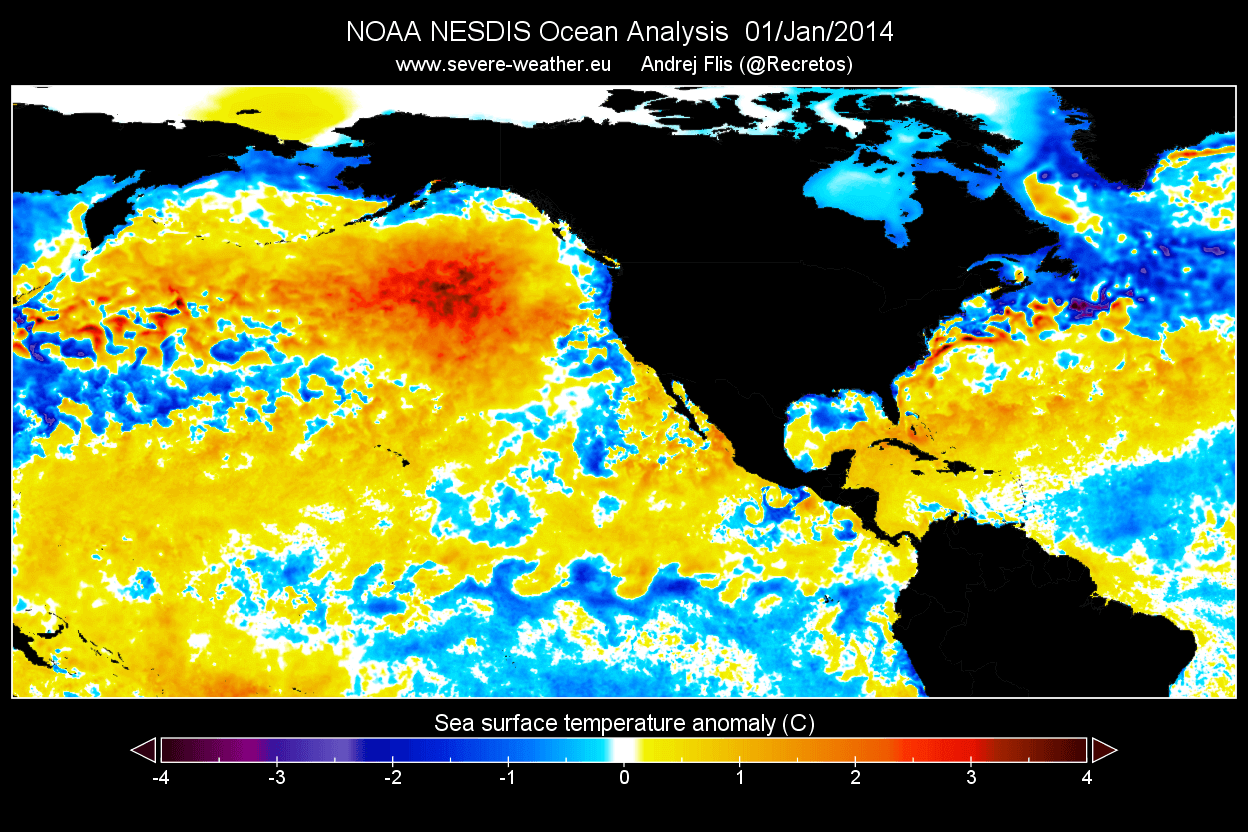
Another warm phase developed later that year in September in a similar location. This whole event lasted throughout 2014 and into 2015. Due to its persistence, this oceanic heatwave was much more robust than the current one, as the strong anomalies reached over 100-meters deep.

But why are these ocean anomalies so frequent in recent years?
Below you can see a graph that we produced and shows the ocean surface temperature anomalies in the central North Pacific ocean. You can see a constant shift occurs between warmer and colder phases.

But in the last ten years, we have detected unusually strong warm phases in the North Pacific, manifested as these strong oceanic heatwaves.
It is important to note that oceanic heatwaves can indicate the developing pressure patterns and the changing background climate state. We can use this as a potential signal, compare it with historical data, and try and use it to predict the upcoming weather seasons.
One reason behind this is the large-scale shift in the Pacific Decadal Oscillation pattern. This oceanic temperature index explains the “atmospheric bridge” event we have shown in the beginning.
PACIFIC DECADAL OSCILLATION
As the name suggests, The Pacific Decadal Oscillation (PDO) is an ocean oscillation in the Pacific. More specifically, it covers the North Pacific Ocean, from the central regions to the west coast of North America.
The Pacific Decadal Oscillation (PDO) is a term used to explain climatic events covering a large area of the Pacific Ocean over several decades. It has two phases, warm (positive) and cold (negative).
You can see in the image below what a typical PDO pattern looks like. A horseshoe anomaly pattern is present along the west coast of North America, which tells us which phase is currently active. Below we have an example of a cold phase PDO pattern.

An opposite anomaly develops in the central North Pacific. So in a cold phase, a warm pool develops over the central North Pacific, and a cold develops in a warm phase.
As we have seen in the anomaly images above, the central North Pacific features a strong warm pool, and cold anomalies are present along the west coast of North America. That signals a negative PDO phase.
Below is an 8-year graph showing the PDO development since early 2014. You can see that the cold phase began powering up in early 2020. The graph also shows the transition process from one phase to another, which takes some time.
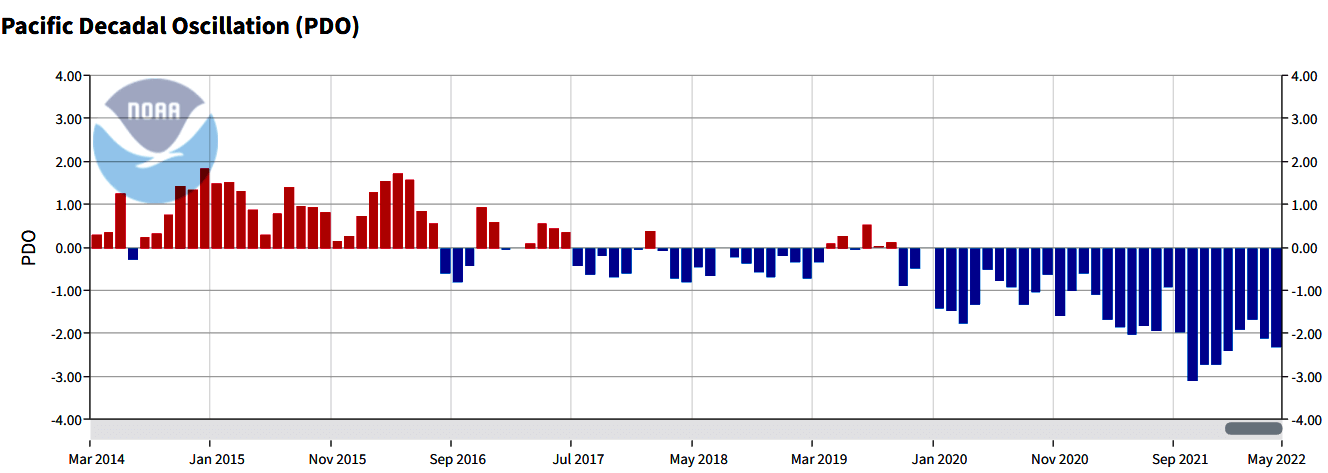
As a negative PDO supports a warm pool developing in the North Pacific, it provides favorable conditions for oceanic heatwaves and hot spots to develop. So we can use this as an early indicator of certain patterns of atmospheric circulation.
PDO NORTH AMERICAN WEATHER
But what is the weather importance of PDO? First, the PDO is significant for the climate and seasonal weather patterns in the North Pacific and North America.
Below you can see the correlation between the pressure patterns and the negative PDO during the late Summer and Fall seasons in the past 40 years.
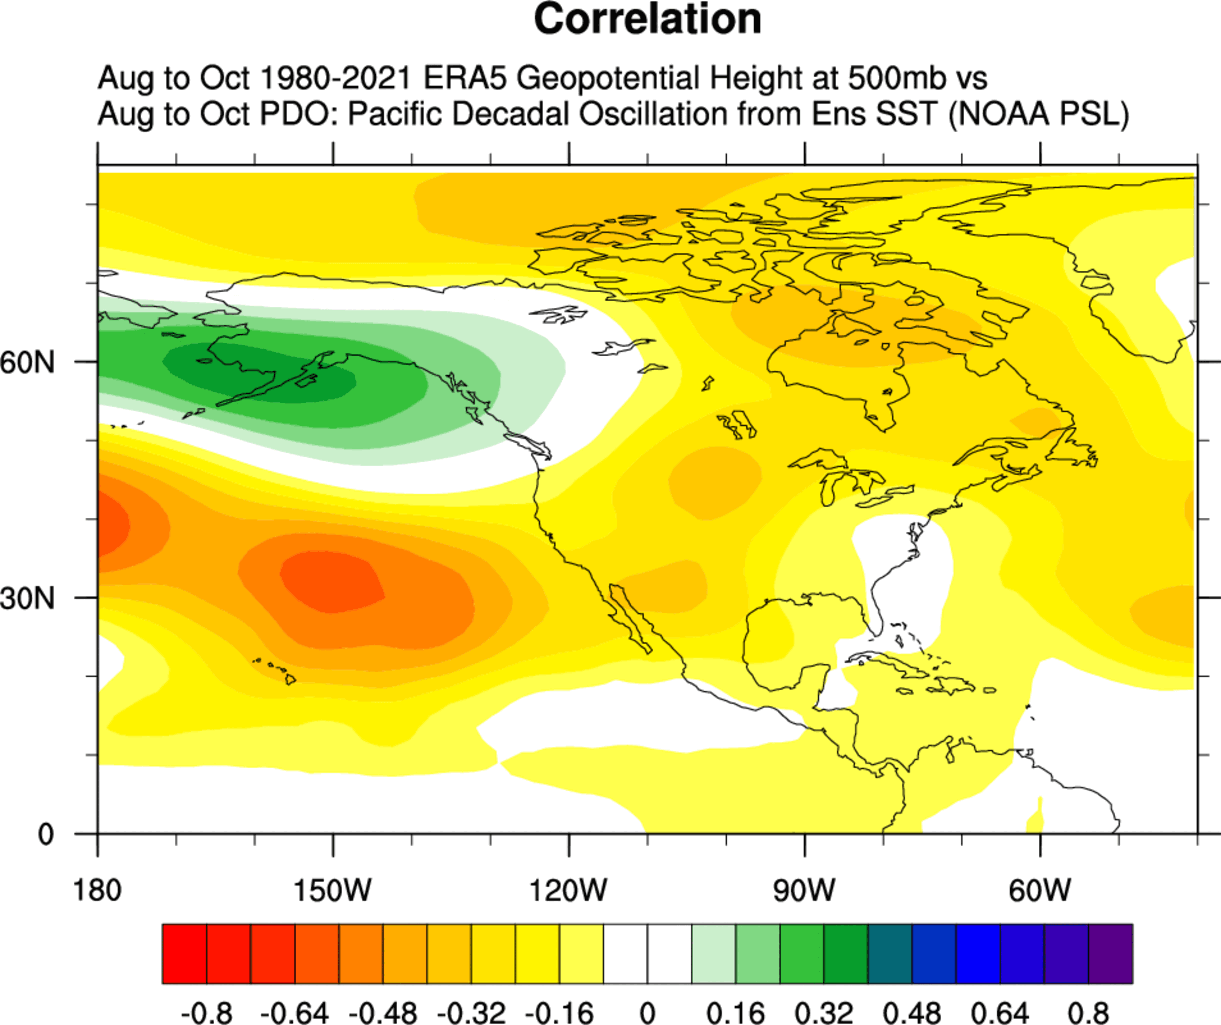
The signal shows that negative PDO supports a high-pressure system in the North Pacific and over the southeastern United States. But also a low-pressure area over western Canada and the northwestern United States.
Looking at the airmass temperature signal, we can see the negative PDO signature in the Pacific Ocean with a warm pool in the central North Pacific. Colder than normal temperatures are likely in the northwestern United States and western Canada. Over the southern United States, the cold PDO favors warmer than average Fall temperatures.

Interestingly, we have a neutral to colder than normal signal over Florida. That is a response to the pressure anomalies over the central and Western United States.
Of course, this is not exactly how every cold PDO Fall looks, as there are many other oceanic and atmospheric factors that shape a particular season. But we see the tendency or a trend that this particular phase might favor.
Perhaps more important than temperatures is the PDO influence on precipitation. In a cold phase, we tend to see less precipitation over the central and western United States. More precipitation is usually expected over the far northwestern and far northeastern United States.

SEASONAL FORECAST
We can compare these patterns with the actual Fall forecast. This way, we can find a potential connection in the ocean and the atmosphere.
The pressure pattern forecast shows the high-pressure system in the North Pacific, with a stronger high over the western United States and in the North Atlantic. This is a very similar pattern to the historical analysis we have done above. It also has a low-pressure zone hinted over Alaska and western Canada.
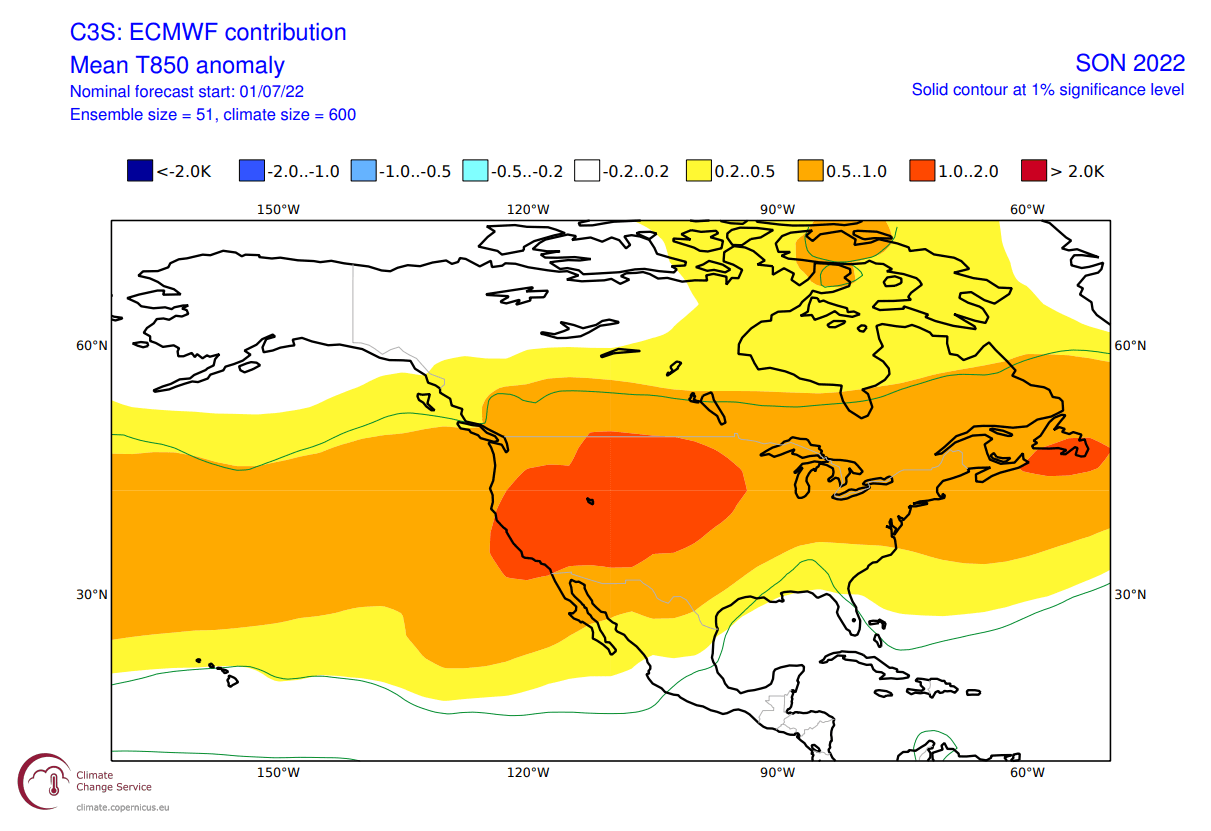
When we look at the global air temperature anomaly distribution, we can see a warmer anomaly belt from the Pacific across the United States and into the Atlantic. Northwestern Canada and Alaska are in a neutral zone, which will likely turn cooler in the future forecast updates.

Weaker warm anomalies are hinted over the southeastern United States, as seen in the historical analysis as well. But, overall, this seems to be quite a typical La Nina pattern, confirming its presence in the circulation.
Over North America, we have wetter conditions over the northwestern United States, expanding into most of Canada. The Midwest and the southern United States show a dry signal, while we also see more precipitation over the southeast.
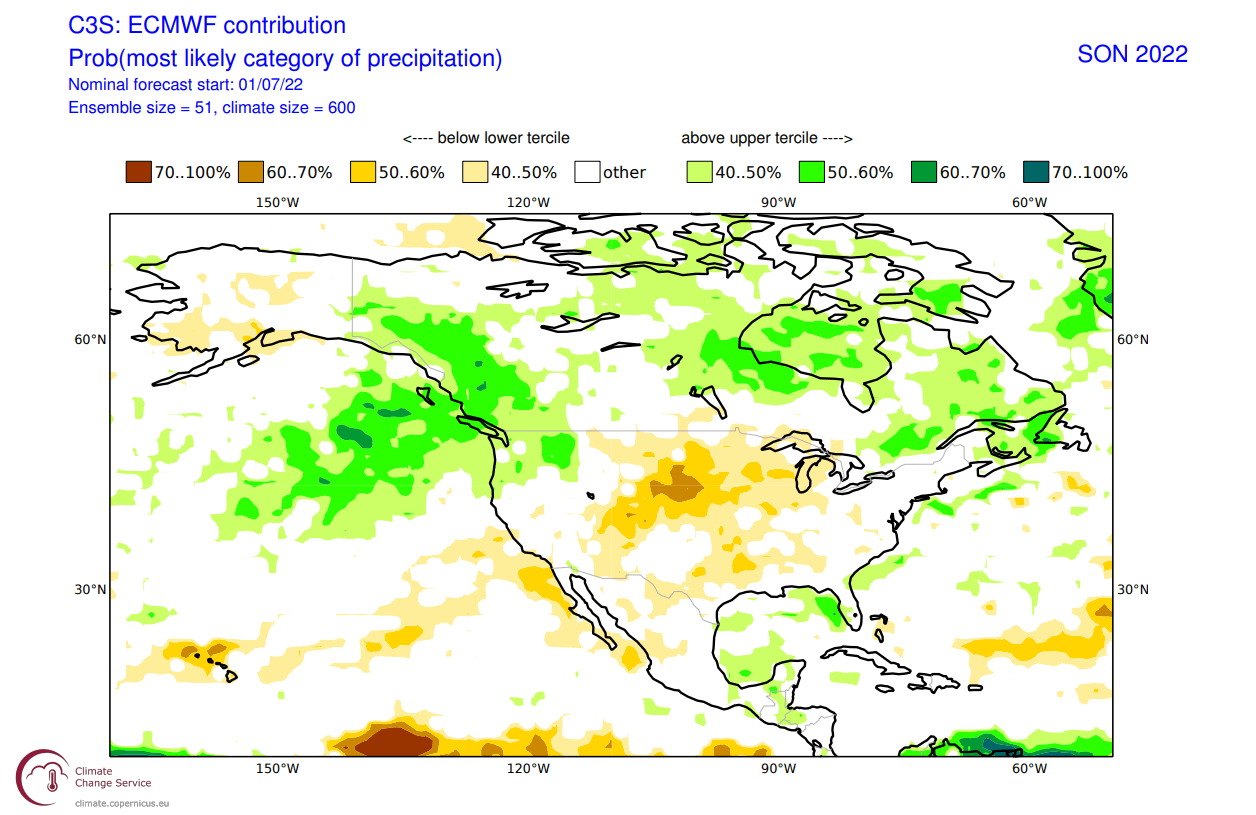
It is interesting to see more precipitation in the Gulf of Mexico and the western Caribbean. This is part of the tropical systems development region. We can understand this as a potential signal for more tropical activity in the later part of the Hurricane season.
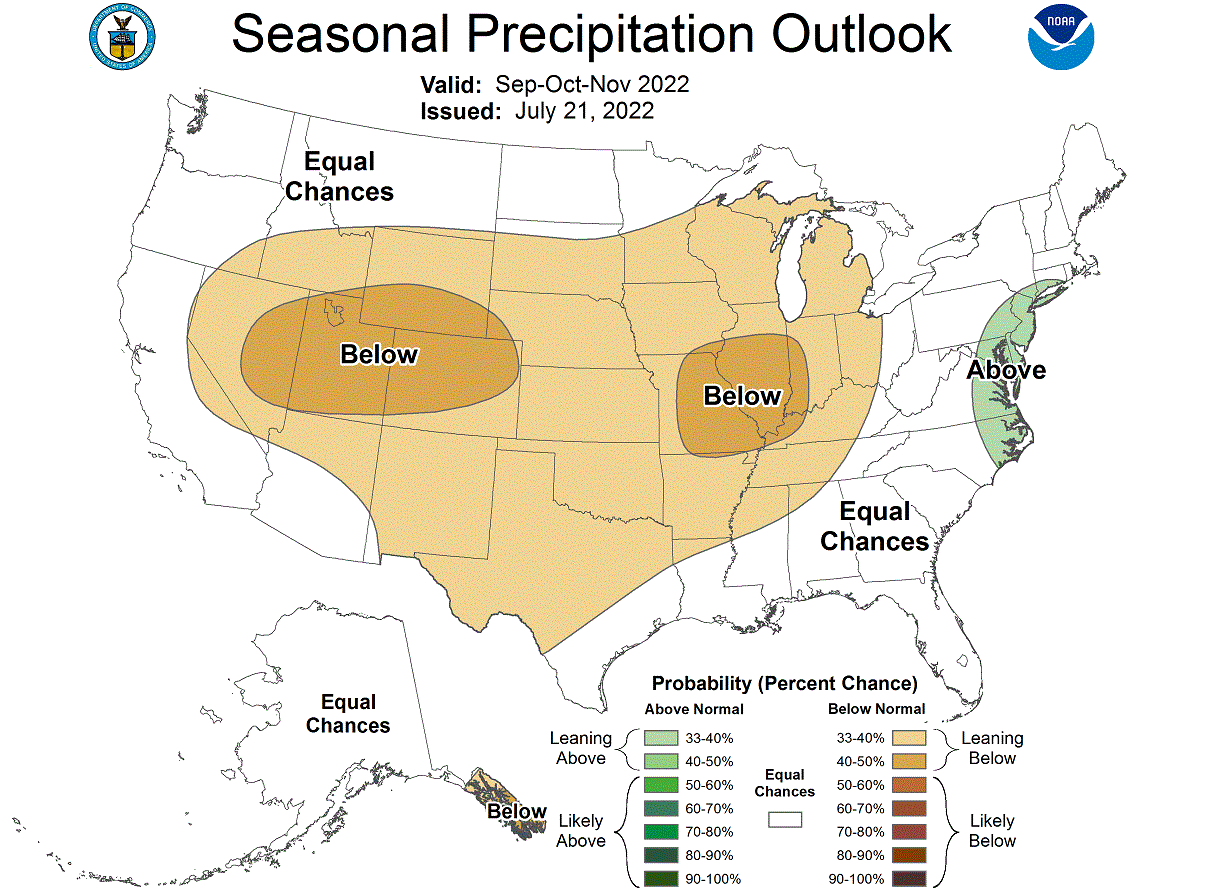
Below is the official Fall 2022 outlook from NOAA/CPC for the United States. Temperature-wise, we see the warm west and far northeast standing out.

We can also see a neutral temperature zone in the Midwest. That does indicate a chance of more cold fronts coming down from the northwestern United States and western Canada towards the central regions. It could mean earlier snowfall than normal over the northern United States.
Precipitation-wise, the NOAA Fall 2022 outlook shows drier conditions in the western and central United States. Wetter conditions are expected mostly on the east coast of the United States.
We will keep you updated on similar nature and weather events worldwide, so make sure to bookmark our page. Also, if you have seen this article in the Google App (Discover) feed, click the like (♥) button to see more of our forecasts and our latest articles on weather and nature in general.
SEE ALSO: