Latest Snowfall Forecast UPDATE 21st September, 2026: Winter 2026/2027 Snowfall Explorer: See the Latest Forecast for Your State and Region
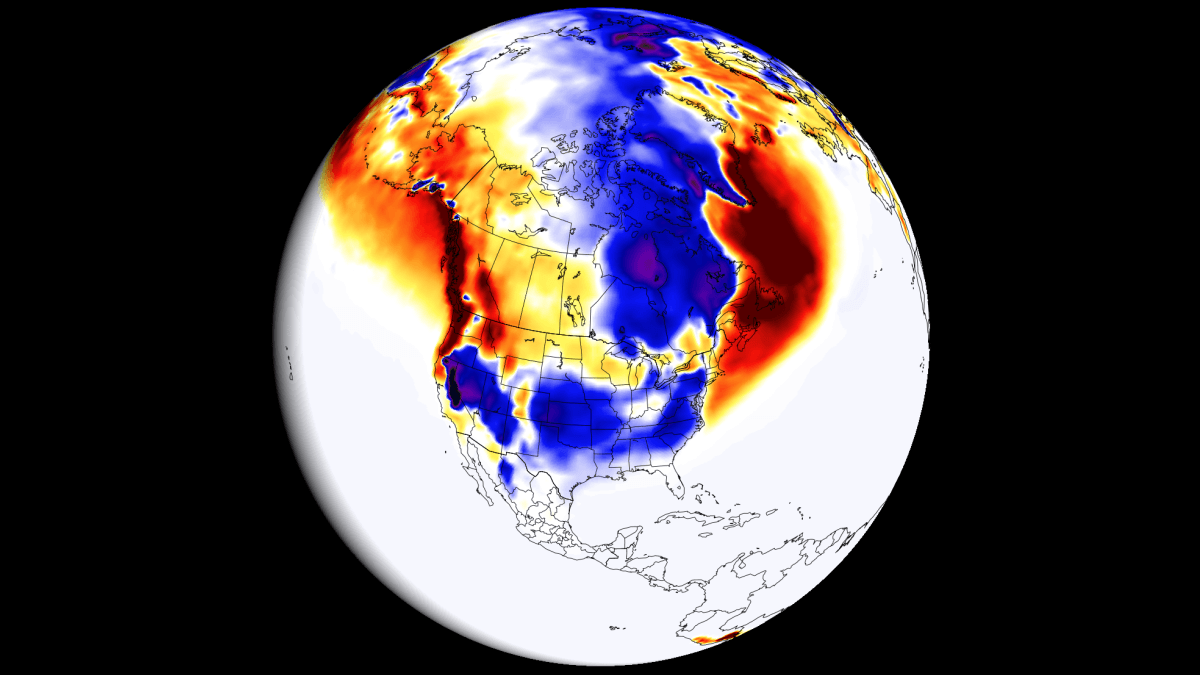
First Winter 2026/2027 snowfall predictions are starting to show a strong Super El Niño impact. Forecast data shows clear snowfall contrasts emerging across the United States, Canada, and Europe.
The developing Super El Niño is reshaping the jet stream and low-pressure system tracks, and past strong events already show where snowfall tends to increase or decrease. The latest long-range forecasts now give us the first look at how the snow pattern could develop through the upcoming Winter season.
In this article, I will quickly look at the latest Super El Niño development. Then, looking at global long-range forecasting systems and historical data analysis, you will see in-depth month-by-month snowfall predictions for the upcoming Winter across the United States, Canada, and Europe.
Super El Niño 2026: The Main Winter Weather Driver
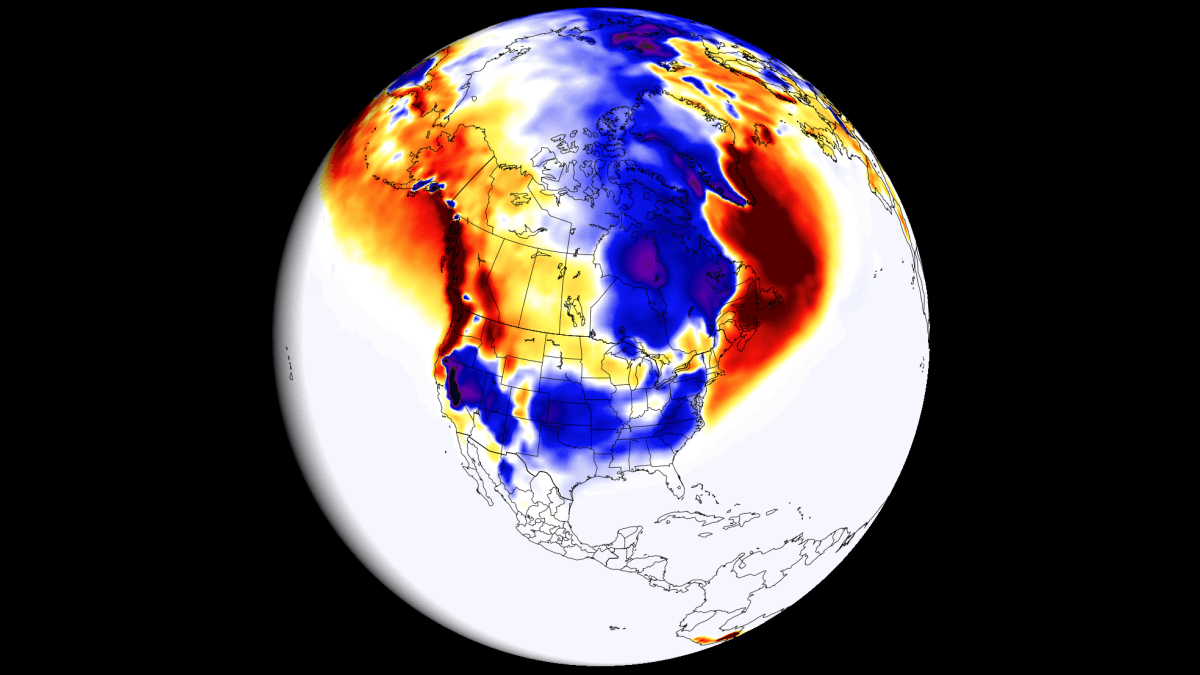
A lot has already been said about the development of a Super El Niño event in 2026, which is already established as a major global weather driver. The term “Super El Niño” might sound a bit extreme, but it is given for a reason, and only to the strongest such events.
The image below shows the typical atmospheric circulation during an El Niño event: Rising air in the central and eastern Pacific increases precipitation and lowers pressure over that region. At the same time, descending air in the western Pacific produces stable weather and high-pressure conditions.
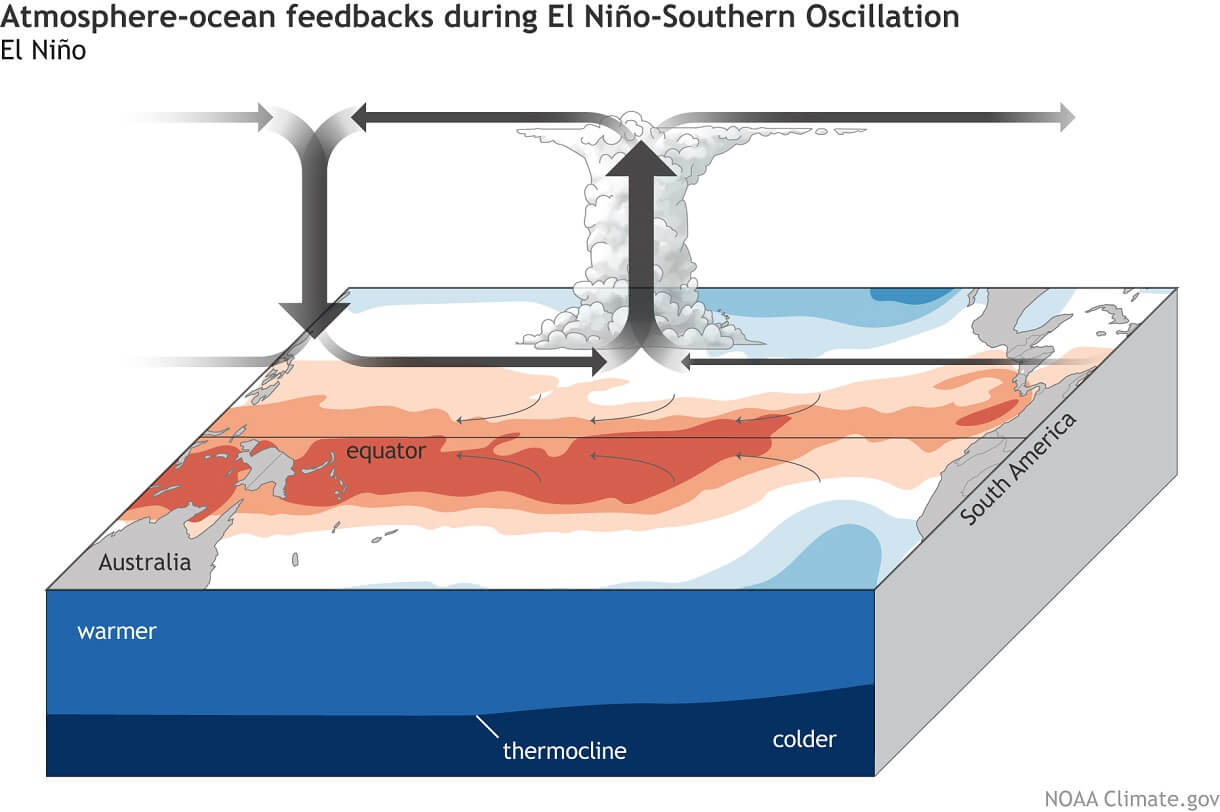
This way, El Niño has a clear and strong impact on tropical rainfall and pressure patterns, affecting the ocean-atmosphere feedback system. Through this ocean-atmosphere system, its influence then spreads to global pressure anomalies and our daily weather.
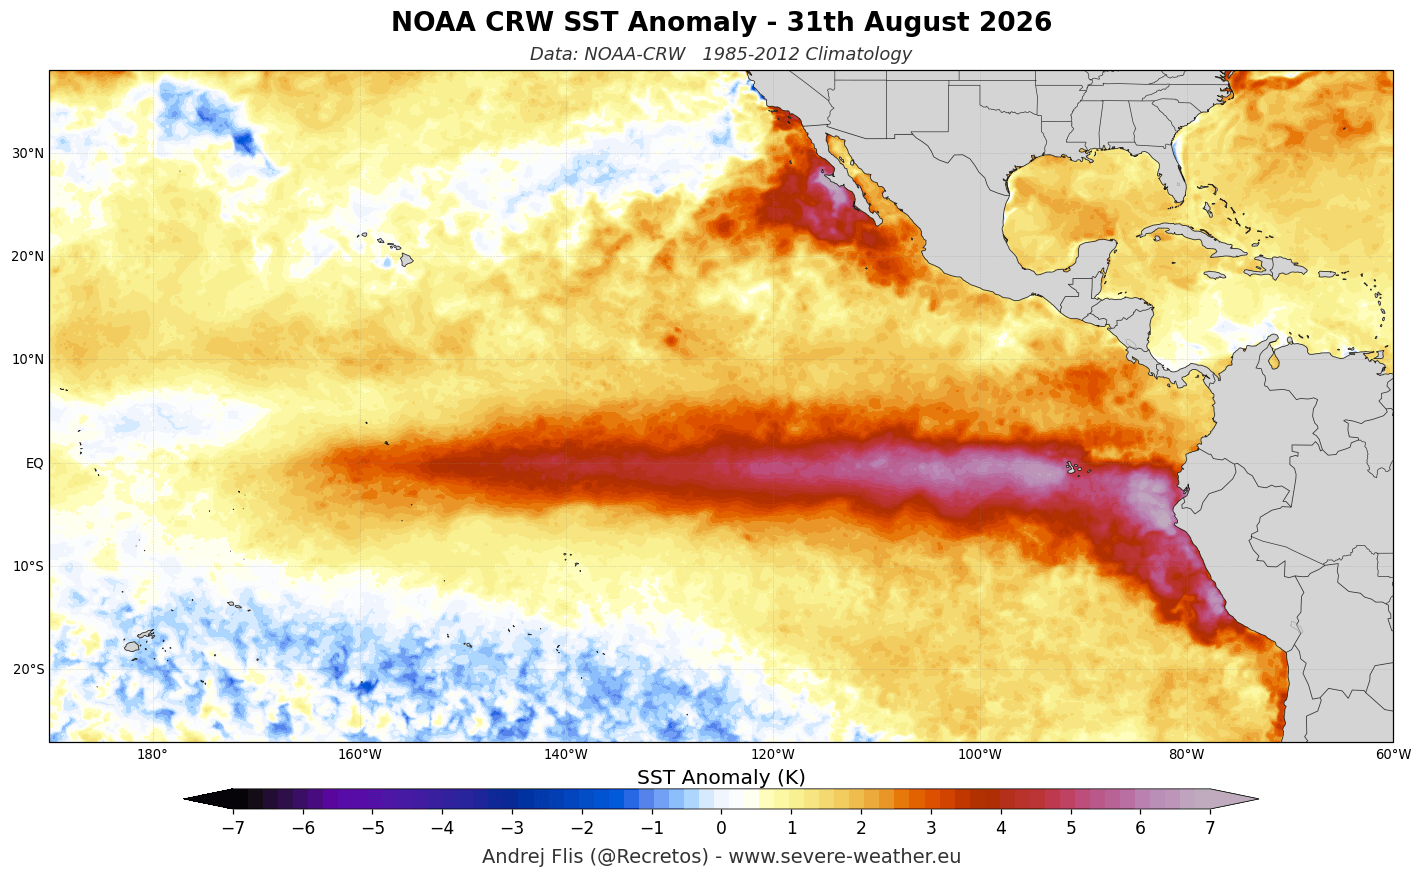
As mentioned, a Super El Niño event is currently developing, forecast to peak as one of the strongest such events in decades. To be recognized as a Super event, sustained seasonal values must exceed +2 degrees, which we have already passed, and must be sustained for a few months.
Below is my latest ocean analysis, based on NOAA-CRW data. You can see significant warm anomalies across the tropical Pacific area, with peak anomalies exceeding 6°C (10.8°F) above normal in the eastern regions. This is already an El Niño event that exceeds most events observed in the past several decades, with more growth still to come.
Below you can see the subsurface heart of the Super El Niño event: a significant temperature anomaly in the top 250 m (800 ft) of the tropical Pacific. This is called a downwelling Kelvin Wave, with peak anomalies over 10 degrees C (18°F) above normal. Note the subsurface anomalies starting to connect to the surface, driving strong surface anomalies in the eastern parts (marked).
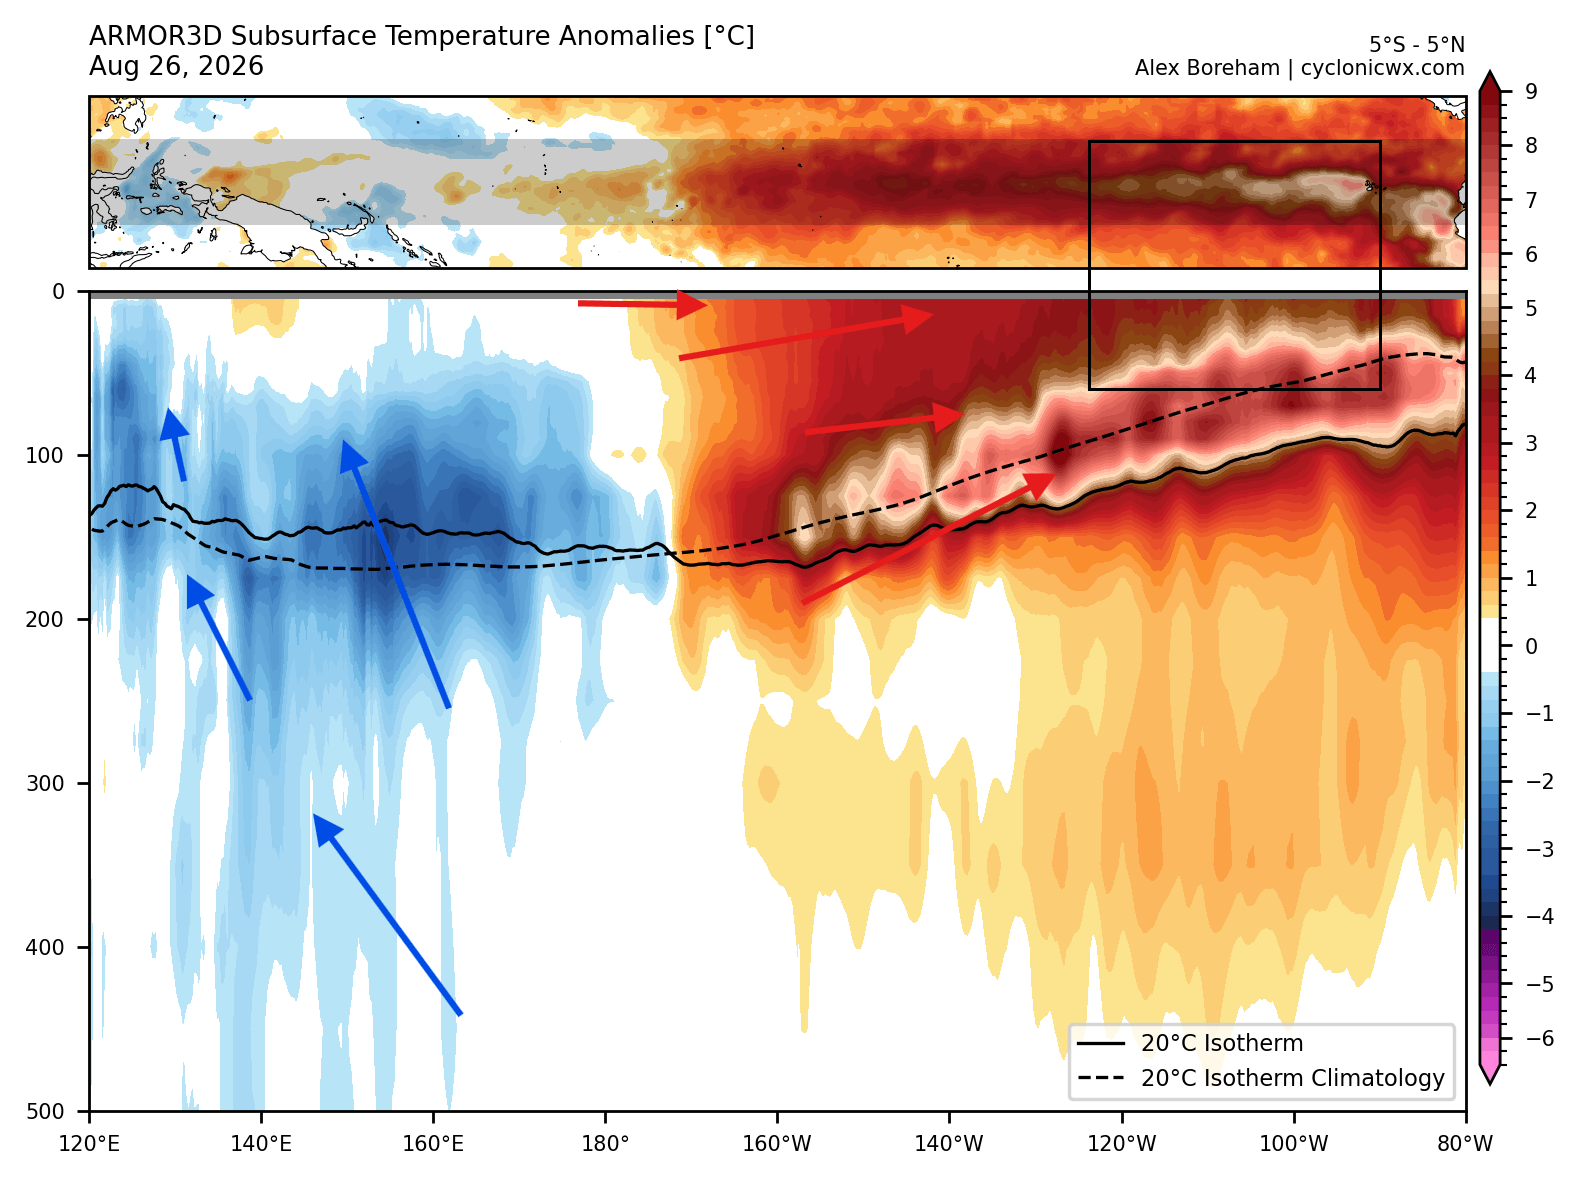
In the western parts, a cold anomaly (blue) is emerging below 50 meters (164 ft). This is part of the classic Pacific thermocline tilting, confirming that a very strong event is unfolding. Strong westerly wind bursts displace warm upper-ocean waters eastward into the Kelvin Wave, pulling colder, deeper water up in the west as the Super El Niño strengthens.
Below is a high-resolution data video, produced from subsurface ocean data. It shows the development of a Kelvin Wave over the past 3 months, with visible eastward movement and rapid growth. You can also see it expanding, rising to the surface as a Super El Niño event.
Such a strong Kelvin wave provides a stable supply of energy to keep the El Niño strong well into the Winter season, also supported by the latest forecasts.
El Niño Forecast: Peak Strength Ahead of Winter 2026/2027
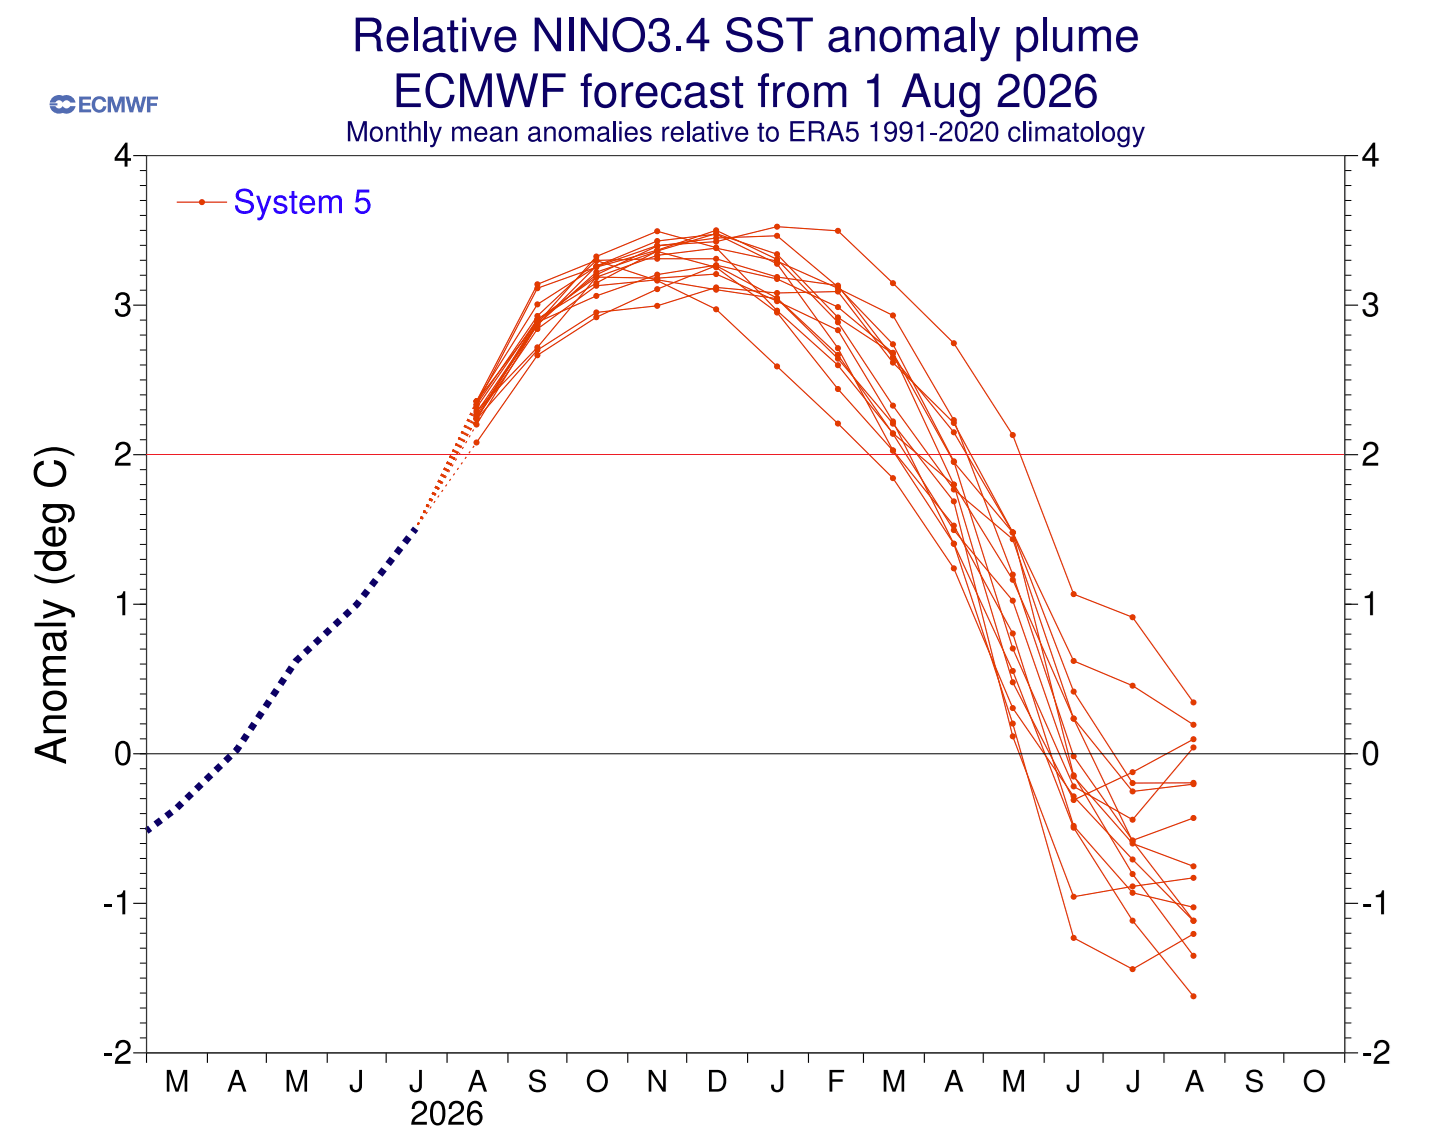
In the image below, we can see the ECMWF extended seasonal model forecast, which shows a significant anomaly at its peak. The El Niño is forecast to reach extreme levels, already surpassing the Super El Niño threshold (+2 degrees), and also exceeding the +3 anomaly at peak. This would be a historic El Niño development and a major influence on Winter 2026/2027.
We can also look at the North American Multi-Model Ensemble (NMME) forecast to get an idea of how this will look in nature in the early winter (December) period. You can see a significant Super El Niño event. If such a forecast verifies, it would put the 2026/2027 event among the strongest on record, if not the strongest.
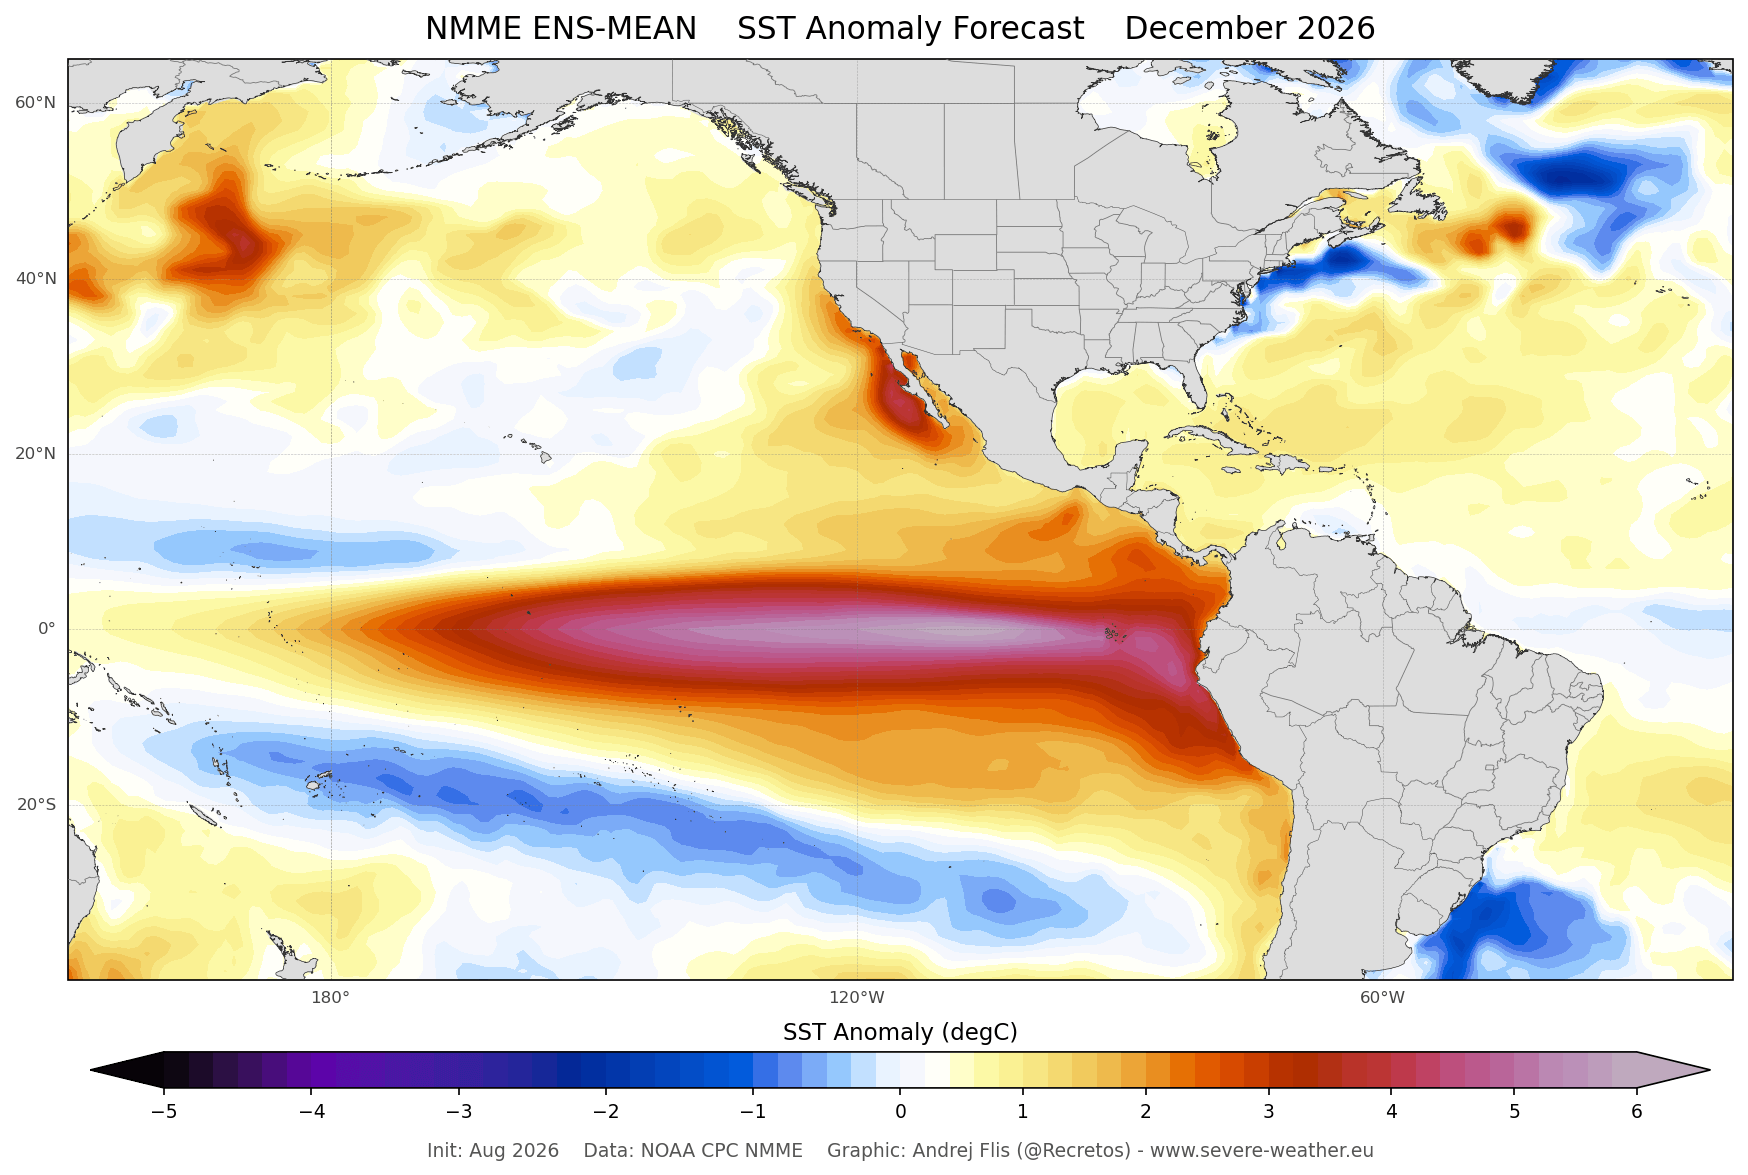
El Niño events usually peak in late Fall or early Winter, with the latest forecasts trending toward a max anomaly around December, as seen above. This is a large oceanic event, developing on the doorstep of North America, bringing strong Winter and snowfall pattern anomalies into the United States and Canada.
We can look at past Super El Niño Winters to get an idea of the snowfall impacts typically seen during such powerful events.
Snowfall Patterns in Past Super El Niño Winters
Typically, the first influence of these ocean anomalies is seen in the changes to the jet stream. The jet stream is like a large river of air at around 8-11 km (5-7 miles) altitude. It brings moisture and precipitation, so it has a significant effect on snowfall patterns.
The most typical pressure effect of an El Niño is the low-pressure area in the North Pacific. That usually weakens the polar jet stream but strengthens the subtropical jet stream over the southern United States.
In the image below from NOAA Climate, you can see the average position of the jet stream during El Niño winters and the resulting weather patterns over the United States and Canada. What stands out is the stronger Pacific jet stream across the southern United States.
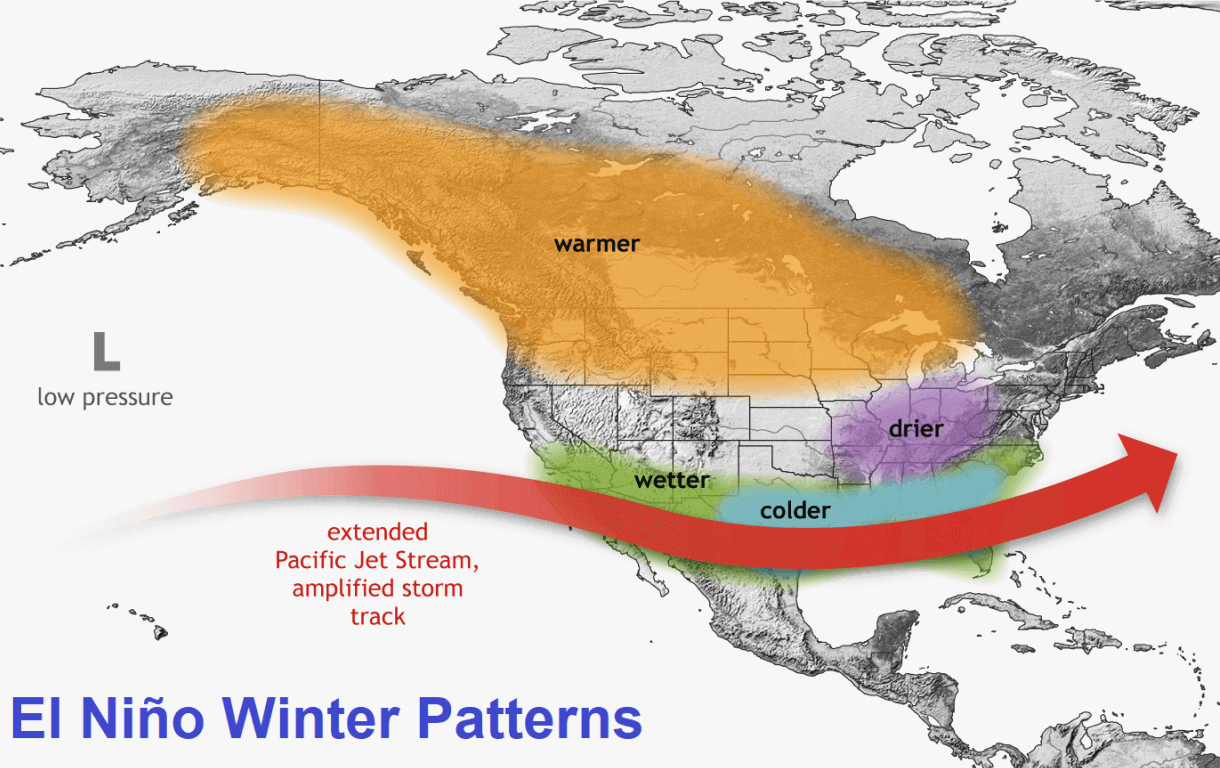
An extended Pacific jet stream brings along lower pressure, cooler temperatures, and more moisture. This combination can really increase the snowfall potential across the central and eastern United States, if enough cold air is available.
The latest pressure forecast below for Winter 2026/2027 is very telling, and it shows a typical strong El Niño forcing: a deep low-pressure zone in the North Pacific and a blocking high-pressure area over Canada. We can’t miss an amplified low-pressure pattern across the southern and eastern United States, driven by the strong El Niño Pacific jet stream.
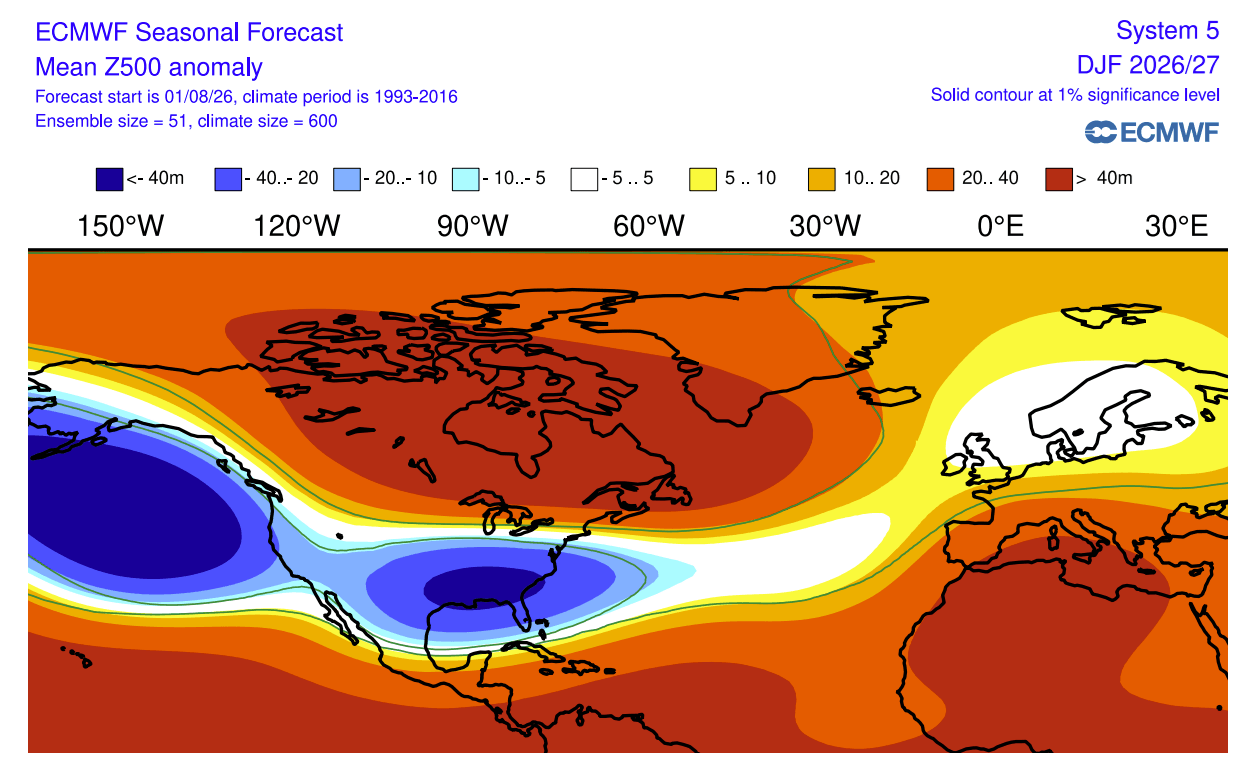
You can also see the downstream pattern toward Europe, with a low-pressure system in the north and a strong expanding southern high-pressure ridge. This pressure difference between the north and south drives a major mild westerly flow into the continent.
Pressure, temperature, and moisture changes also shape the snowfall pattern. Below is a composite I produced from ERA5 data, showing average winter snowfall anomalies in the past 4 Super El Niño events. Above-normal snowfall (blue) was recorded across the Sierra Nevada, the Four Corners, the Southern Rockies, and over parts of the Central Plains and into the upper Midwest.
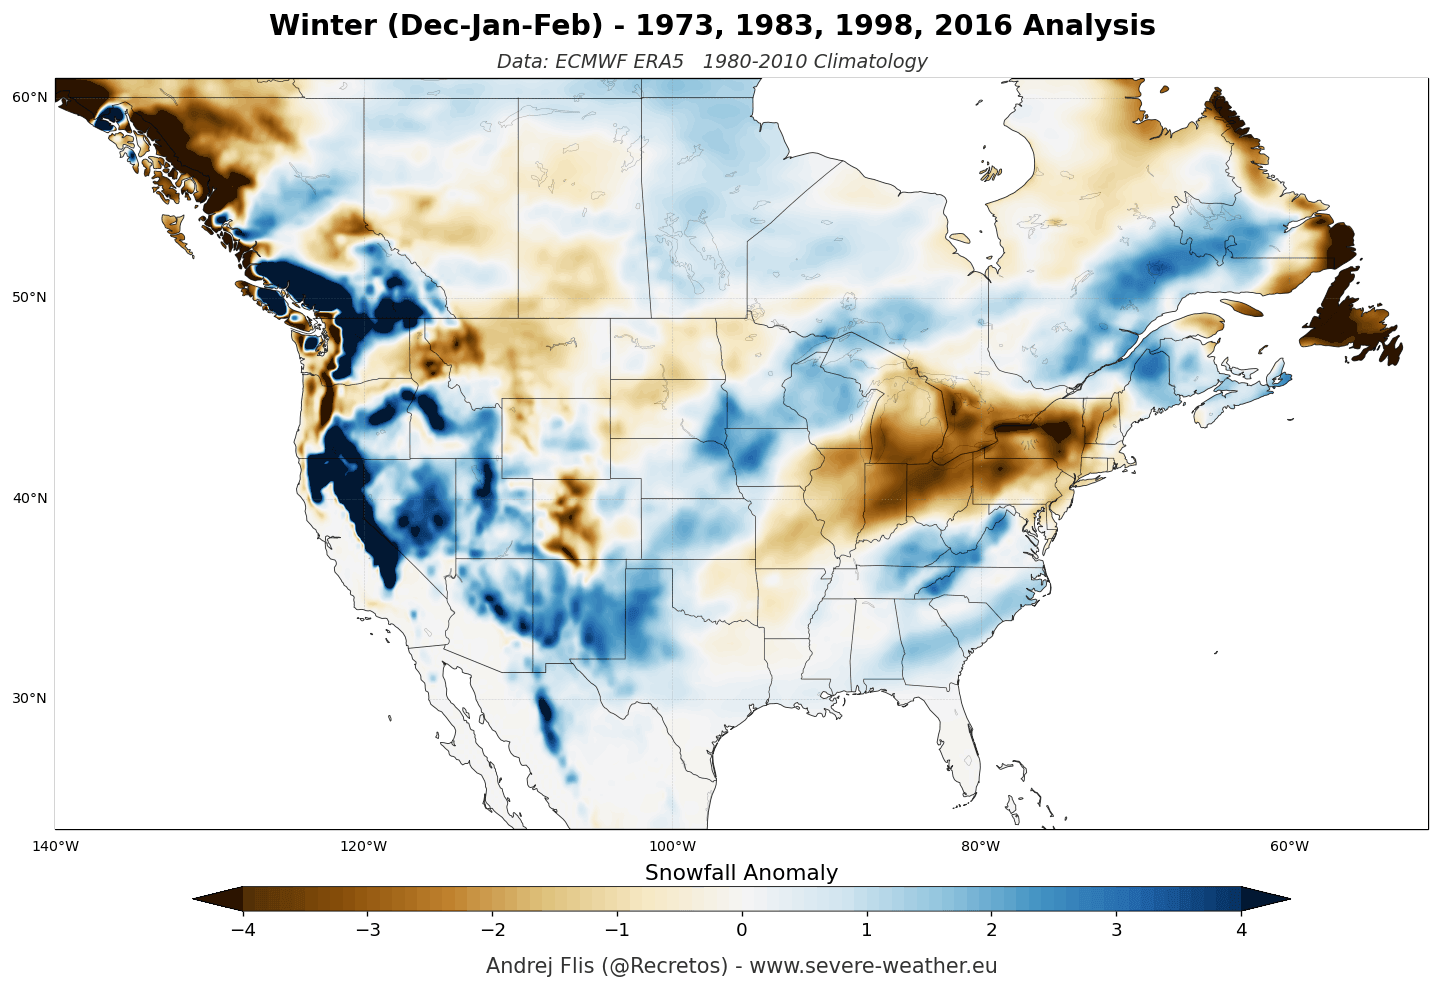
Large snowfall deficits (brown) were recorded over the Pacific Northwest, the Great Lakes, the Ohio Valley, and the Northeast. This shows that despite a good jet stream position, the warm Canadian ridge limits cold air intrusions and can suppress sustained northern storm tracks.
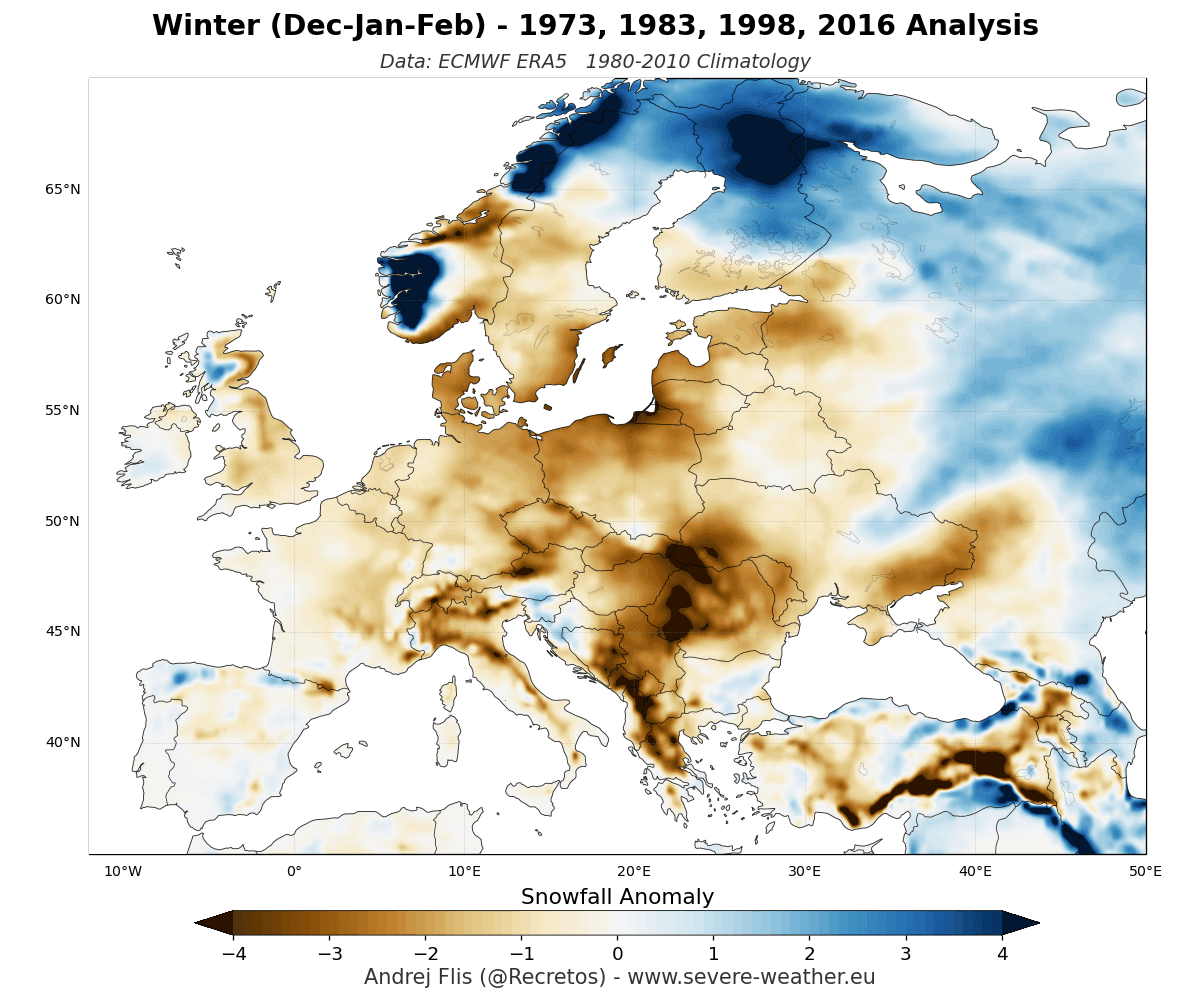
A Super El Niño also tends to bring widespread snowfall deficits over Europe, specifically over the northwest, southern, and north-central regions. The main reason is, as shown above, a mild westerly flow from the Atlantic and a rising southerly ridge, keeping temperatures too high to support widespread snow cover apart from elevations.
These are just examples of an average Super El Niño season, especially over the United States and Canada, which are more directly affected. Each year can have its own variations of the winter pattern, so the final winter never develops exactly as some multi-year average.
But this still serves as a great tool that shows us which areas are more (or less) likely to see above-normal snowfall this Winter. And we will now also look at the latest snowfall predictions to see what the actual long-range trends show for 2026/2027.
Winter 2026/2027 First Snowfall Predictions
We will look at the latest snowfall predictions using two well-established long-range weather forecasting systems: ECMWF and the UKMO. I produced custom forecast images from their data, with a focus on clear visual presentation of snowfall anomaly areas.
You will first see the average snowfall pattern for the forecast period, and then I will do a monthly breakdown. Keep in mind that these are not fixed scenarios, but the latest snowfall trends for Winter 2026/2027.
First, we have the seasonal average image for Europe. Overall, we can see a very weak snowfall forecast. Most of the continent is predicted to have less snowfall than normal, except for elevations like the Alps and areas with lower temperatures to the north and northeast.
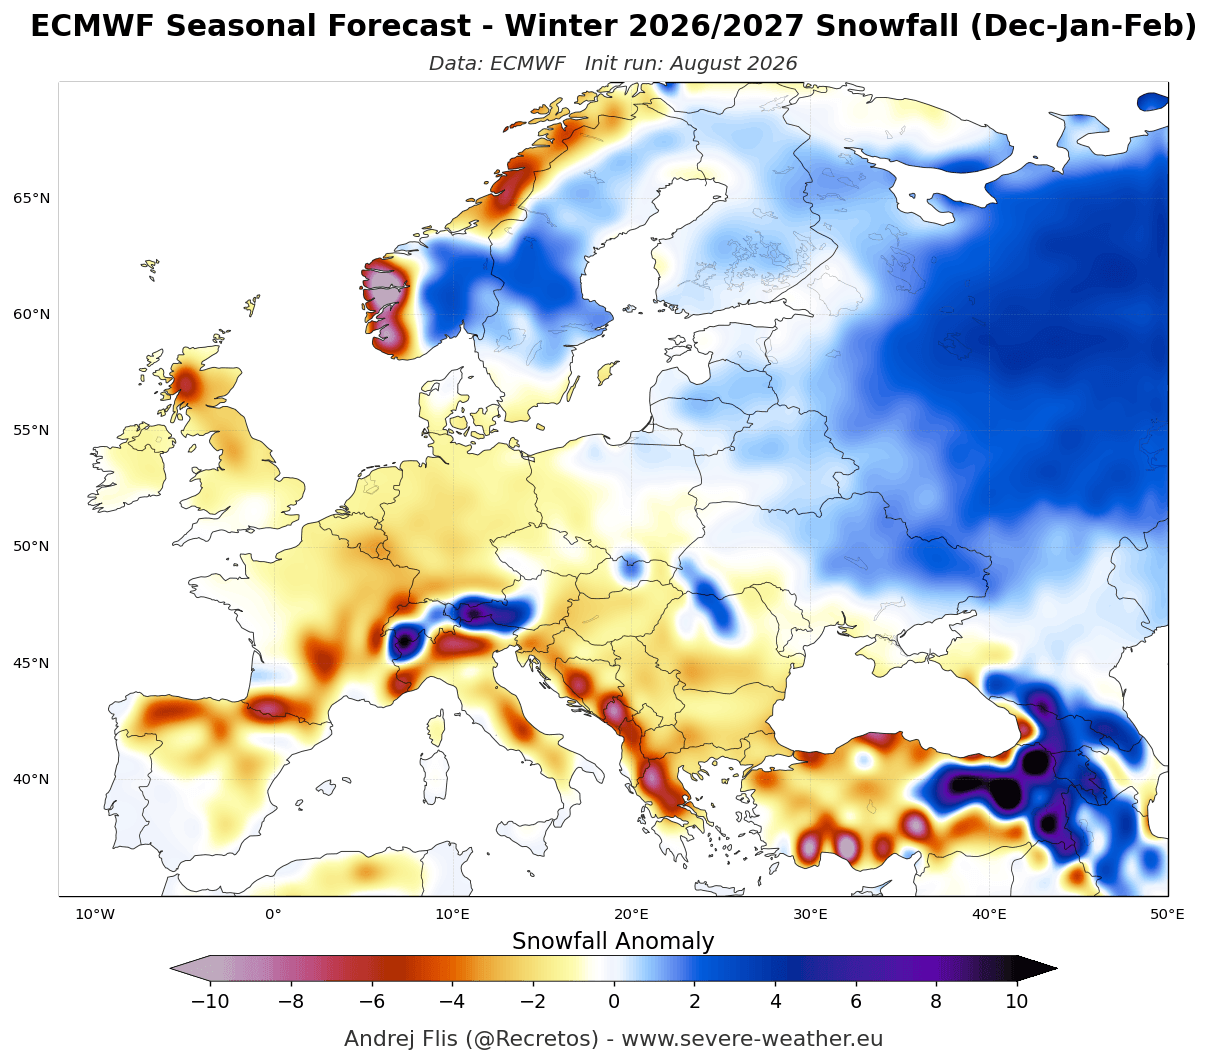
For skiers, the upcoming season here will be defined by elevation and latitude. A dominant mild Atlantic flow is driving widespread snowfall deficits across the lowlands and mid-elevations, except for the northern parts. Areas above 1800-2000 m elevation in the Alps also look favorable for good natural snowpack.
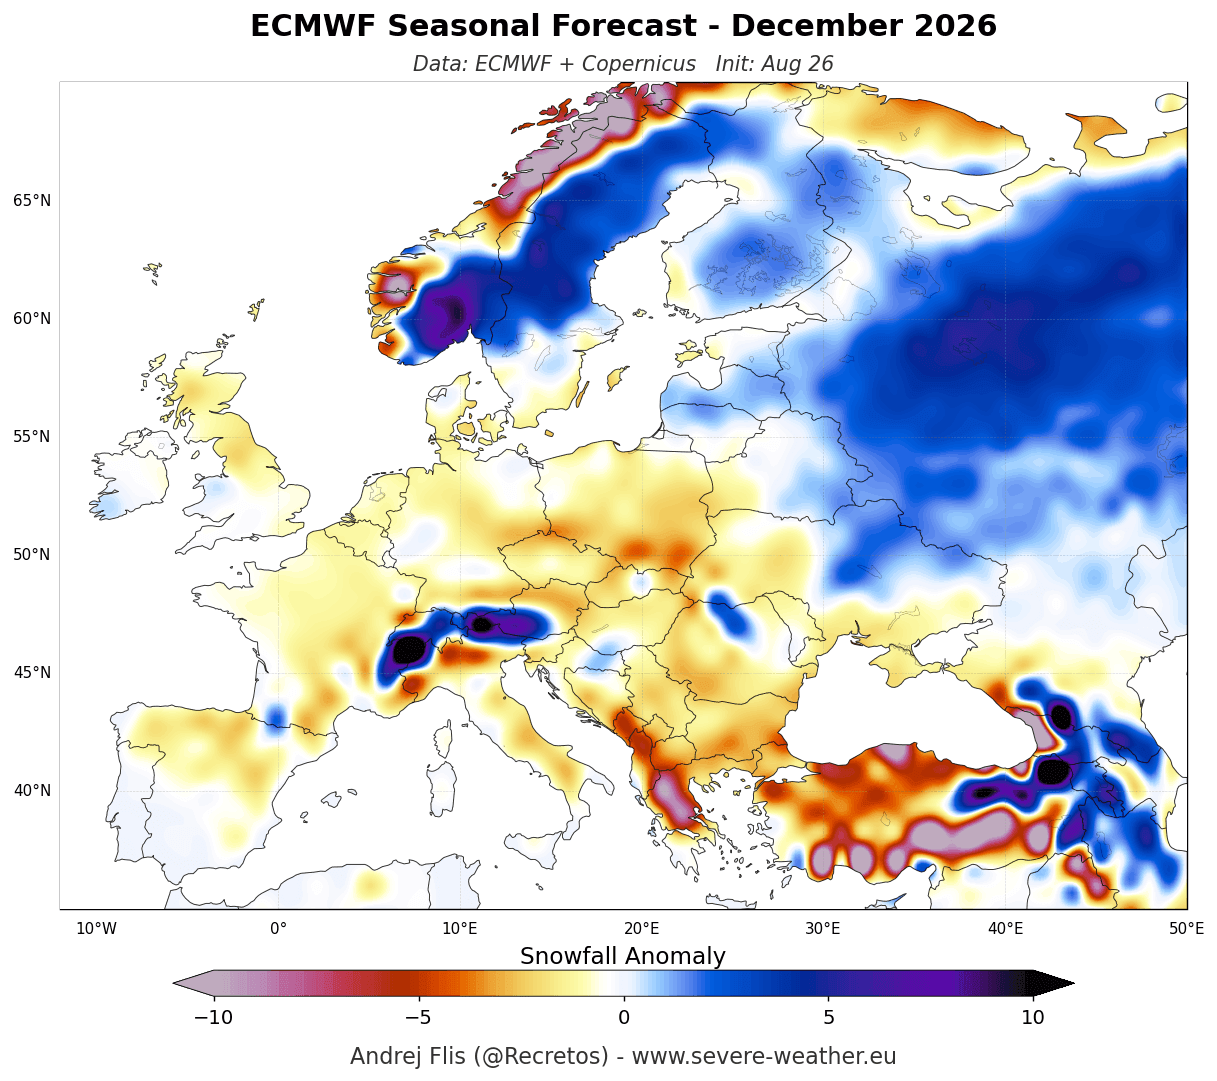
The December snowfall forecast shows most of the lowlands with below-normal snowfall, apart from the far north. This is due to a more westerly to southwesterly flow over most of Europe, which is rich in precipitation but also warmer. That is also confirmed by the heavy snowfall anomaly shown in the Alps and toward the north.
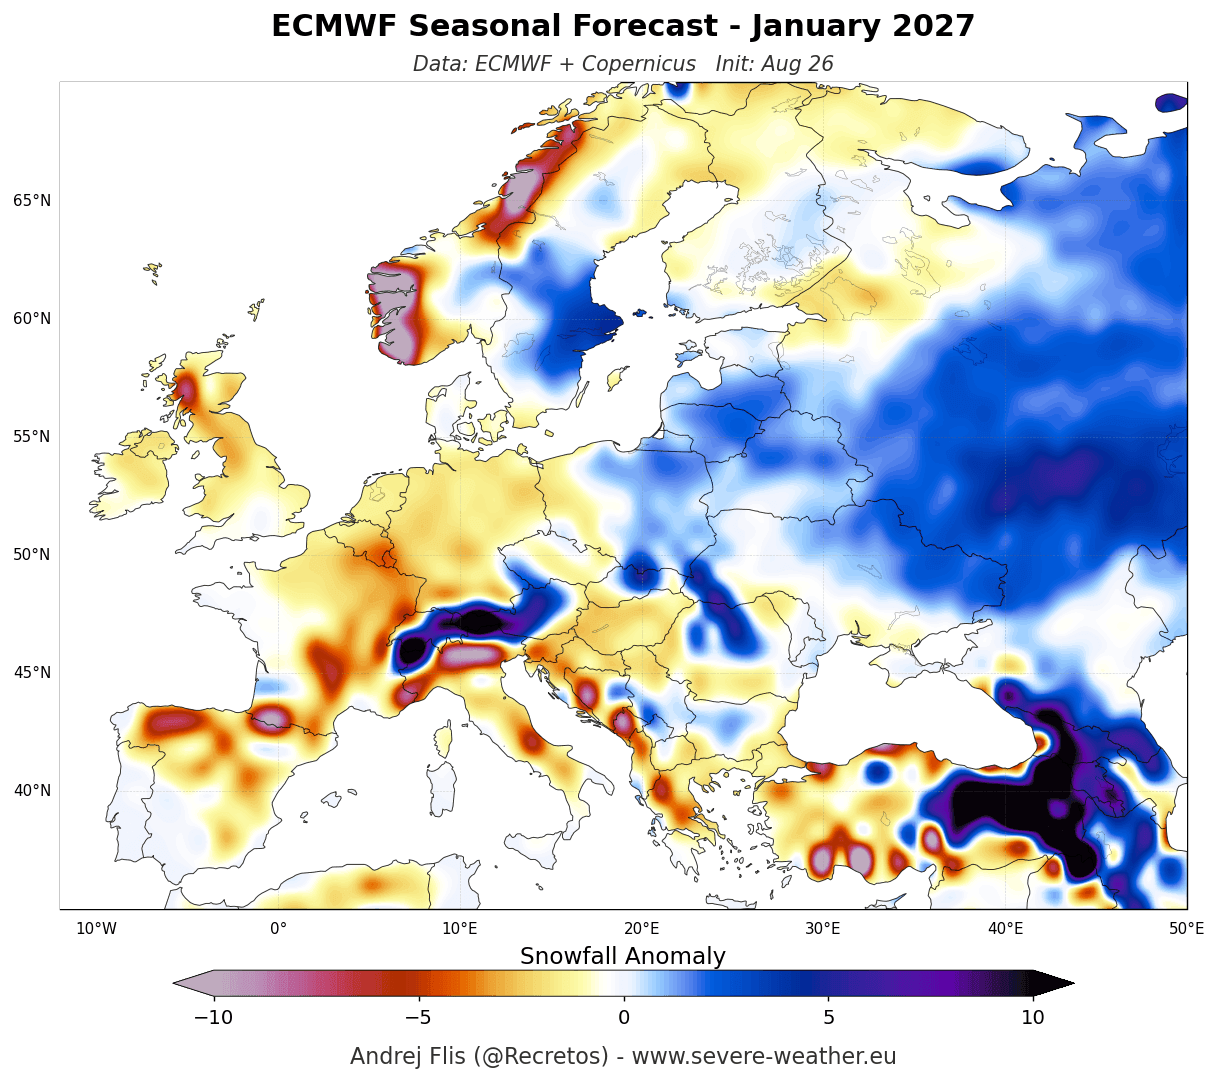
In the January forecast, the pattern does not improve much, as the southern high-pressure ridge persists and the westerly flow continues. But we can see some above-normal areas appearing outside of just the elevations in east-central parts.
February is usually a snowier month across Europe, so a persistent high-pressure ridge will create the strongest snowfall deficit. The forecast below shows below-normal snowfall across most of central, western, northwestern, and southern parts. More snowfall remains to the northeast and north, like in the rest of winter.
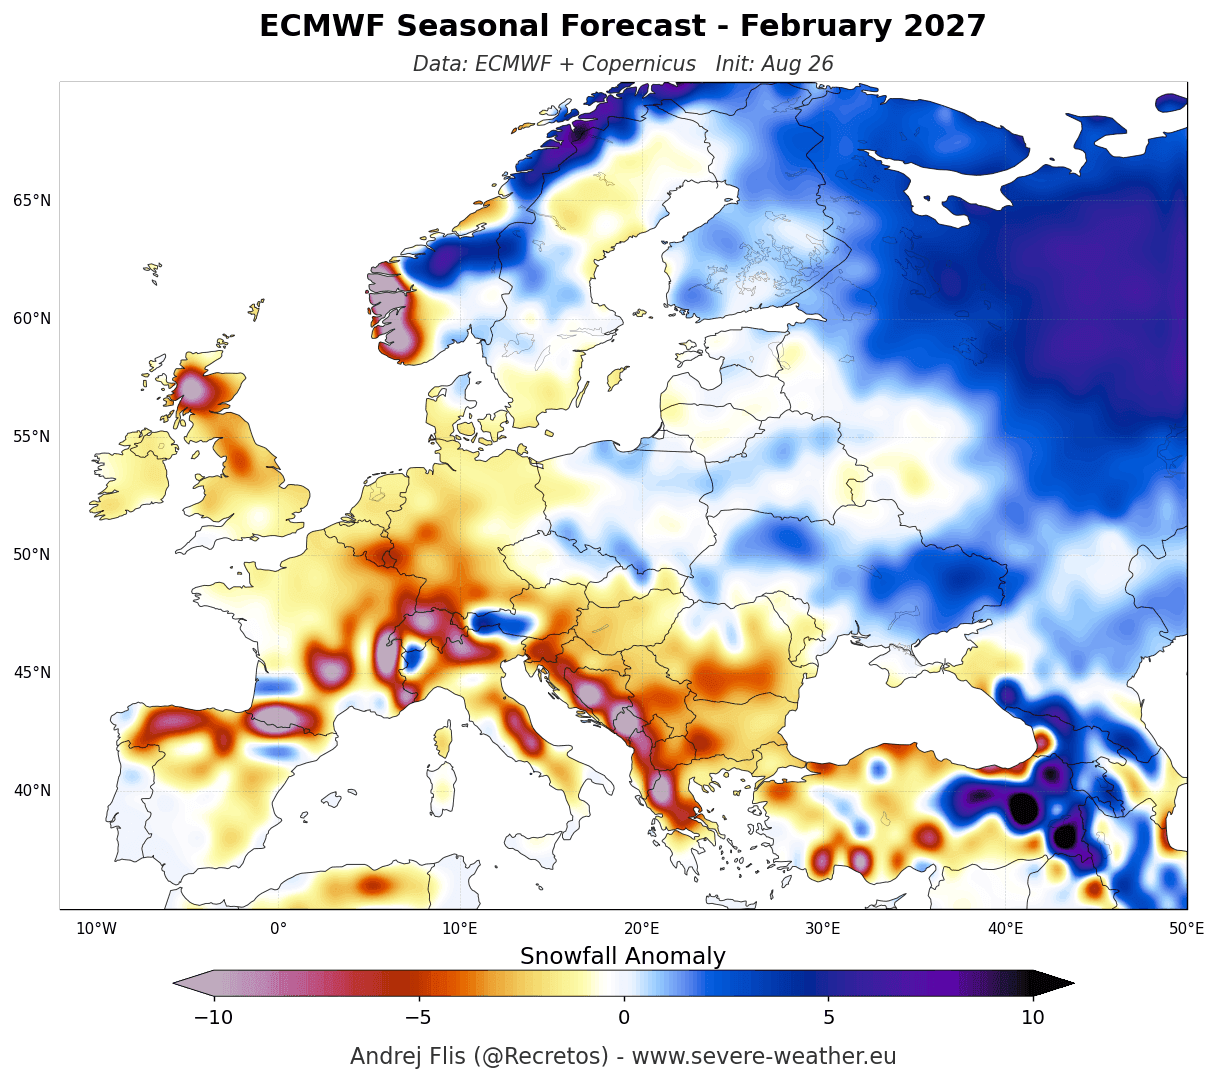
Below-normal snowfall does not mean no snowfall at all. It just means less snow than the long-term average. So, an area with 1 meter (40 in) of total snowfall over the winter, on average, might see just 25 cm (10 in) of snow instead.
Things get more varied and complicated over North America, where the direct Super El Niño impact causes stronger month-to-month dynamics.
United States and Canada Winter 2026/2027 Snowfall Forecast
Over North America, the first model shows a different snowfall forecast. In the winter seasonal average below, you can see reduced snowfall across the Northern United States and southern and Atlantic Canada. But we can see above-normal snowfall potential across the Central and Eastern United States and eastern Canada.
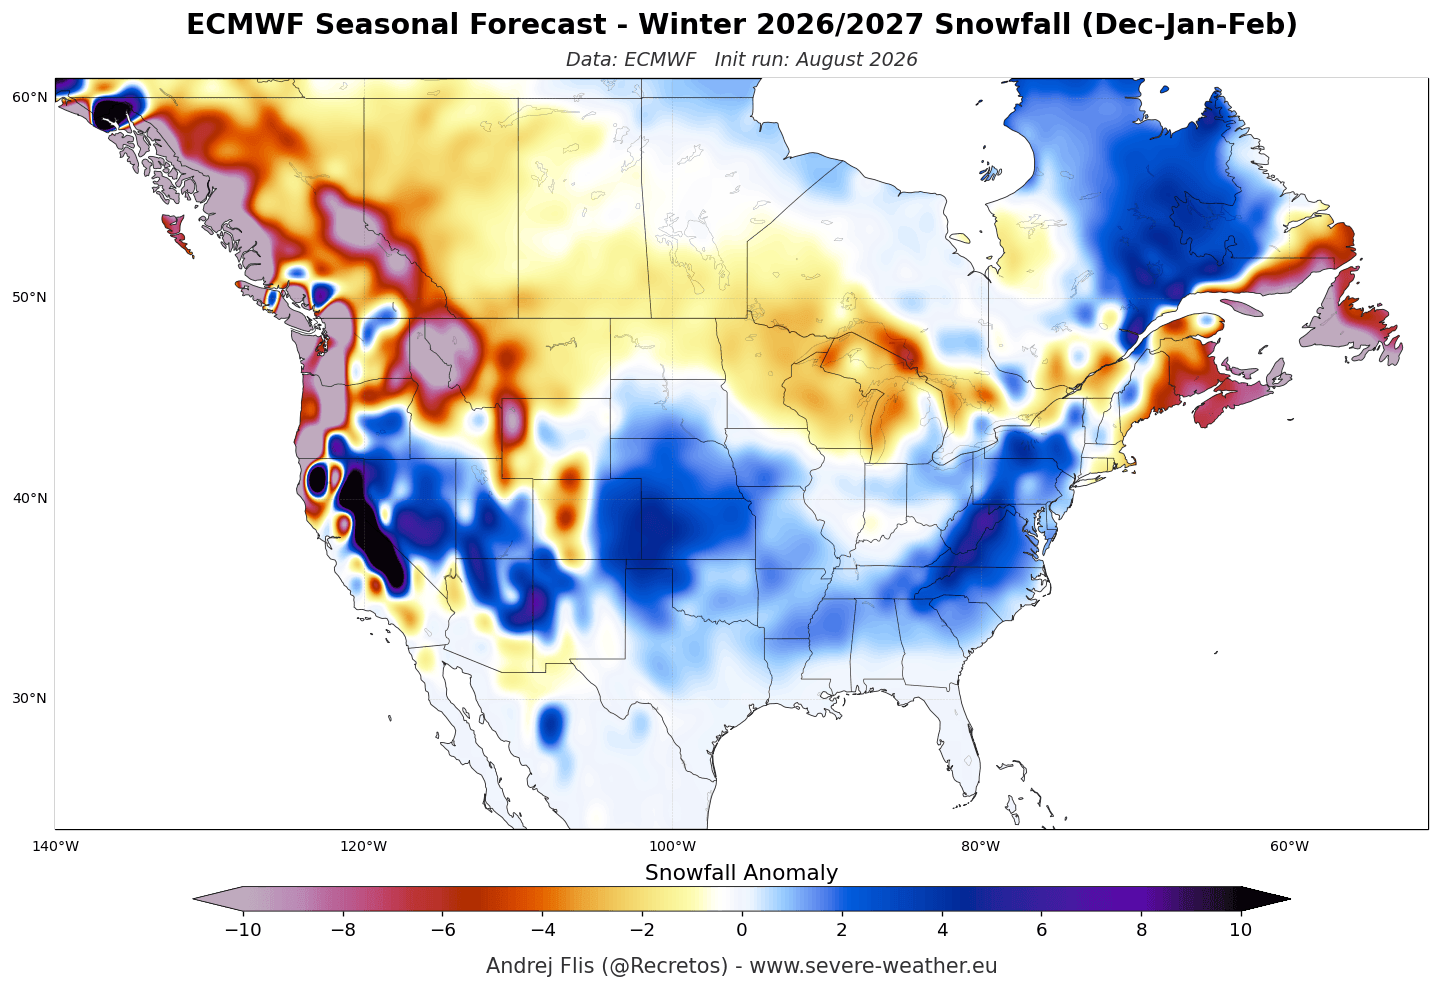
Above-normal snowfall potential is indicated across the Southwestern and Southeastern U.S., the Central Plains, parts of the Midwest, East, and into the Mid-Atlantic. This is not too far from a Super El Niño analog above, and perhaps looking a bit better for snowfall overall across the United States.
For skiers, the highest snow potential is focused across California’s Sierra Nevada, Utah, and the Central to Southern Rockies (Colorado, Arizona, and New Mexico).
But the start of the snow season is rather slow. In the December snowfall forecast below, you can see an increased snowfall potential across the central Plains and over the east toward the northeastern U.S. and Canada. But most other parts are forecast to receive less snowfall than normal, especially the Great Lakes area and the northwestern United States.
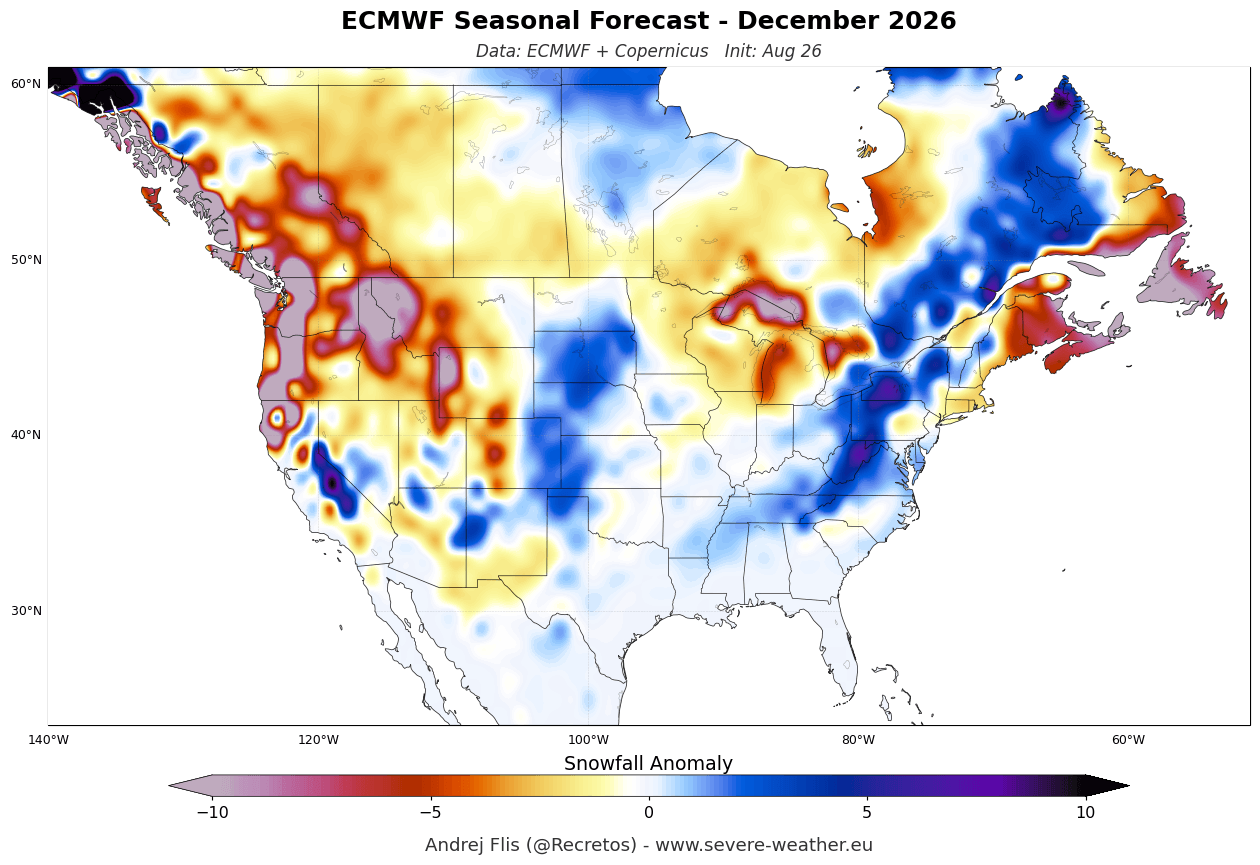
Southern and southeastern Canada generally show below-normal snowfall, the result of an El Niño high-pressure zone over the region.
The January snowfall forecast shows a shift in the weather patterns and much improved snowfall amounts. An increased snowfall potential is forecast over the central and southern Plains, expanding across the Midwest and eastward into the Ohio Valley and Mid-Atlantic. Significant above-average snowfall anomalies can be seen in the Sierra Nevada, the Great Basin, and the central Rockies of the western U.S.
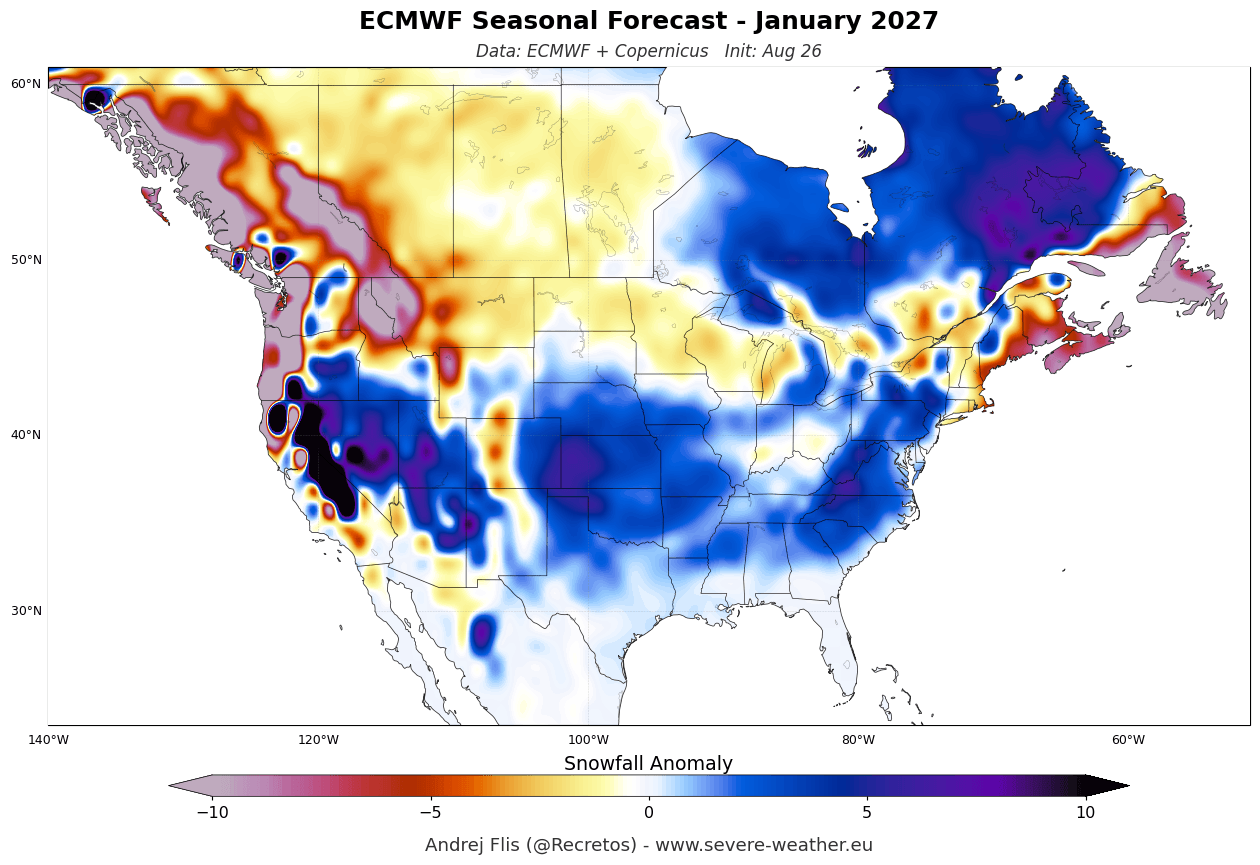
Below-normal snowfall anomalies persist over the Pacific Northwest, the northern Plains, and much of western Canada under the high-pressure system. Further north and east, increased snowfall potential is seen across eastern Canada, including Quebec and Labrador.
The February snowfall forecast continues the active southern Pacific jet pattern, typical of a strong El Niño. Above-average snowfall is forecast across a wide area of the southern half of the United States, from the Sierra Nevada and south-central Rockies into the Plains, before stretching east across the Ohio Valley and into the Mid-Atlantic.
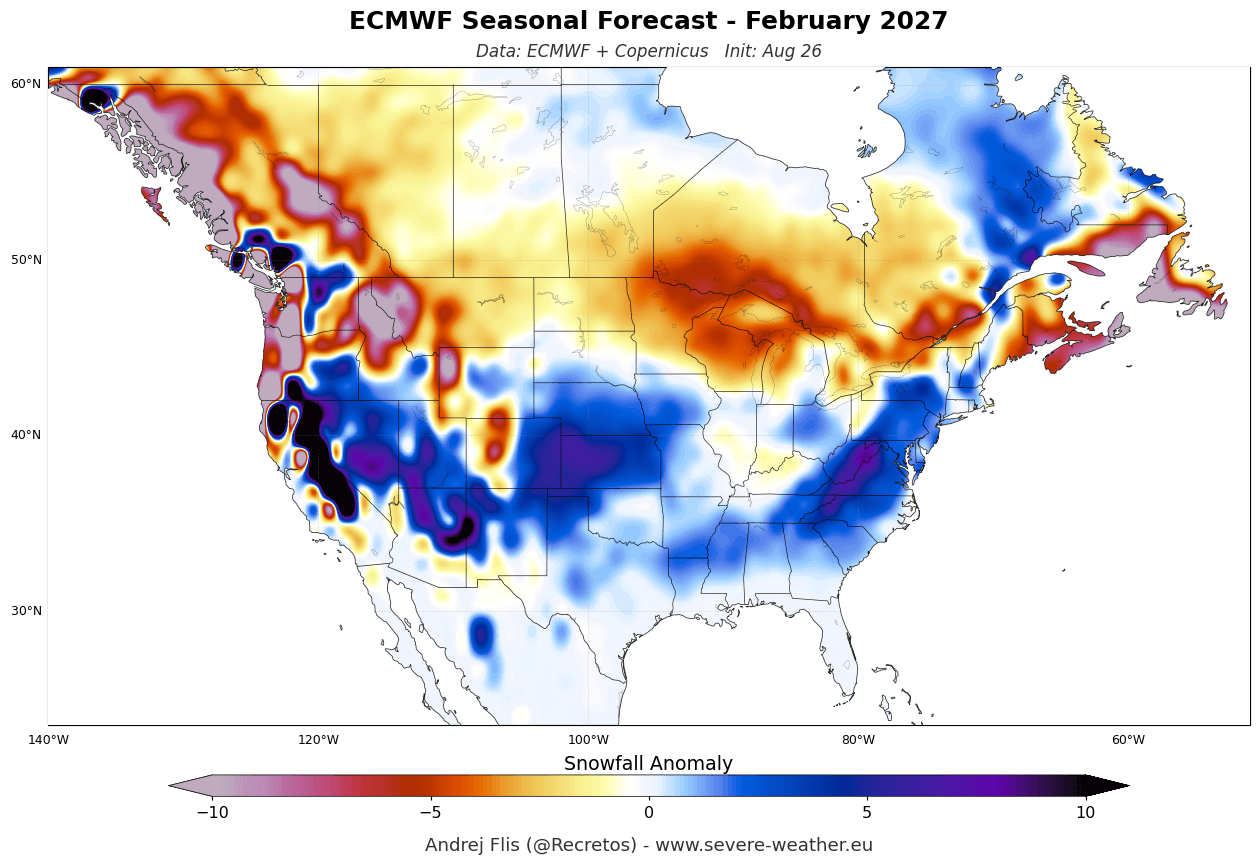
A significant snowfall deficit continues in the northern United States and southern Canada. Below-normal February snowfall extends from the Pacific Northwest across the northern Plains, the Great Lakes, and into New England. Negative snow anomalies cover almost all of southern Canada as low-pressure systems remain suppressed to the south.
But anomalies can only tell us so much. Below is the latest seasonal total snowfall forecast. It shows the total seasonal snowfall amount over the next six months and indicates an impressive snowfall amount and coverage for the coming season.
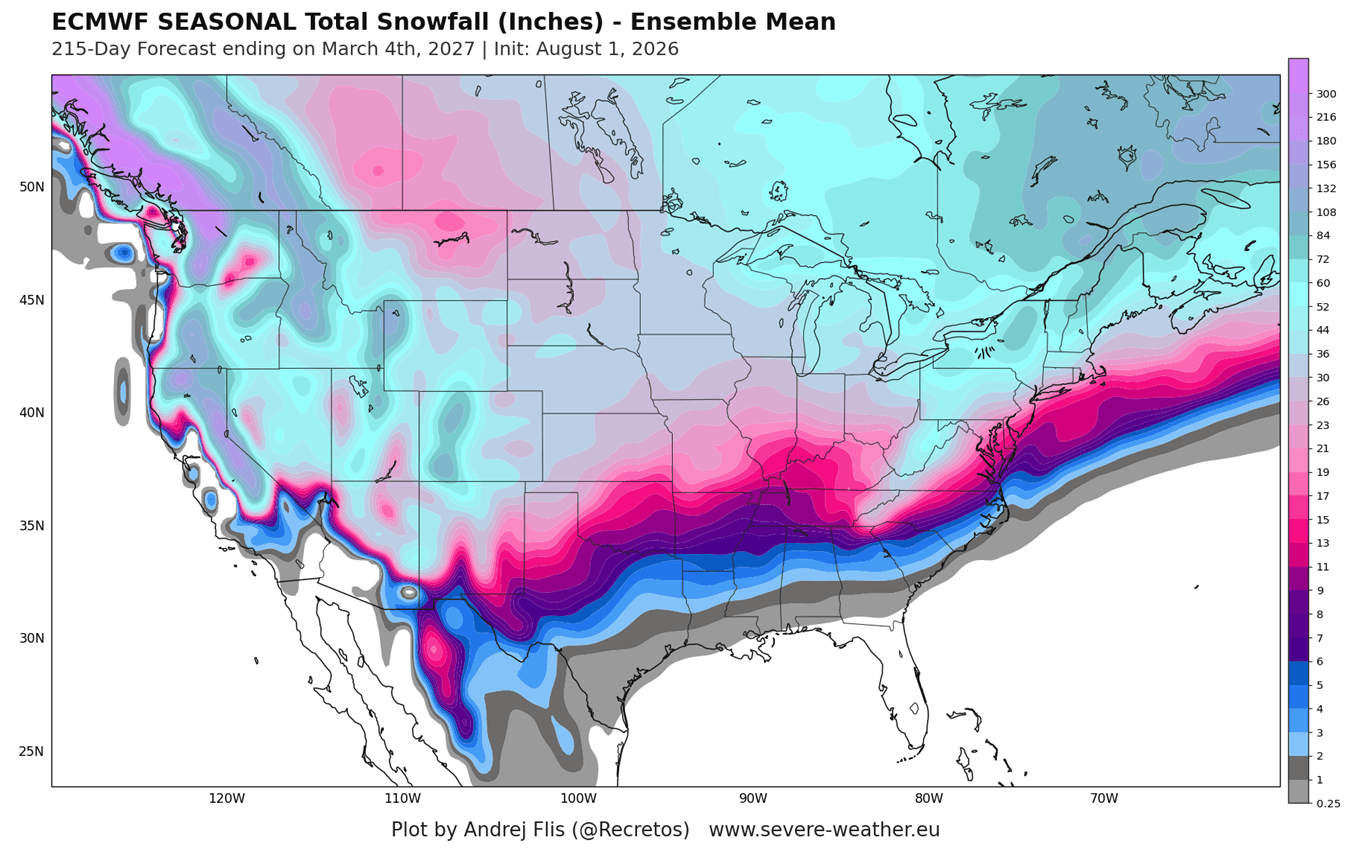
This is perhaps not a useful plot on its own, except that it clearly shows that while some areas are forecast with below-normal snowfall, that does not mean no snowfall at all. It just means those areas are expected to see less snowfall than usual, while still seeing some snow on the ground during the season.
It’s perhaps more useful to compare this data to the exact same period forecast from last year. What this reveals below is that the current snowfall forecast shows much more snowfall than the same forecast last year, except for the northern United States and southern Canada.
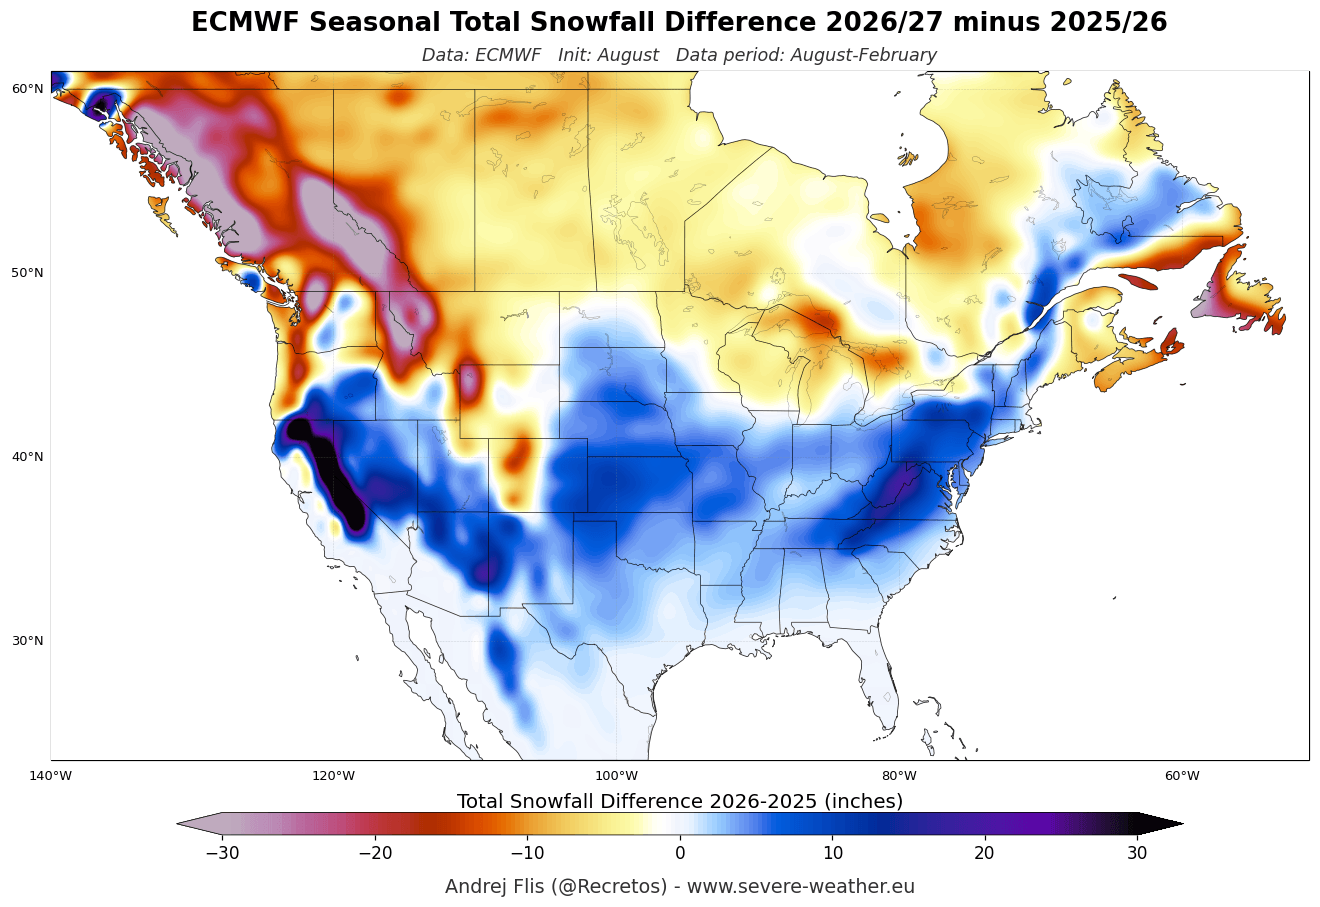
So the 2026/2027 total snowfall forecast shows generally higher snowfall across much of the United States, except in the northwest and the upper Midwest, and over southern Canada. But those areas tend to get some snowfall by default due to their latitude. Overall, we see a positive snowfall trend for the rest of the United States compared to last year.
As an example, I produced a special plot below showing the ECMWF seasonal snowfall accumulation forecast for the state of Texas. In long-range forecasting, images like this are not meant to predict exact snowfall accumulation numbers, but rather to reveal trends in above-normal or below-normal snowfall relative to the 30-year average.
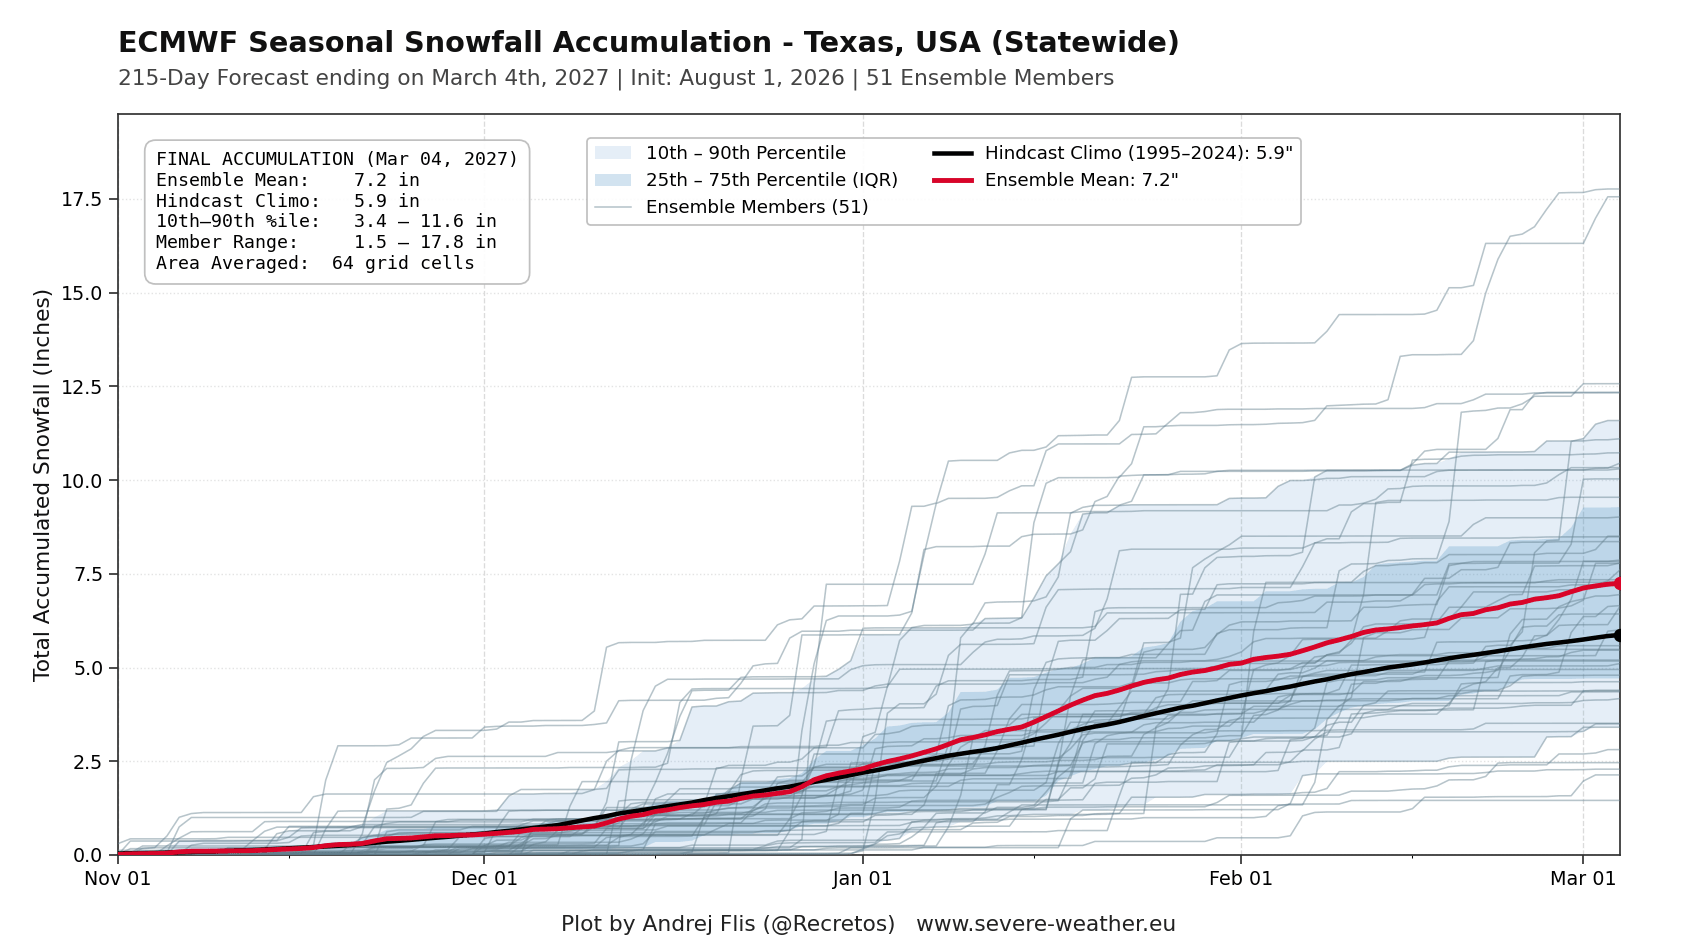
This Texas forecast example shows snowfall tracking near normal through December, then rising to above-normal levels in January and February. This mid-to-late winter upward trend directly reflects the growing influence of an amplified southern U.S. storm track, delivering more frequent precipitation across the southern and eastern United States.
The numbers here are generally low, as this is a more southern state. But it tells us a lot about the snowfall potential, and changes in the pressure and jet stream patterns over the Winter season.
UKMO Winter 2026/2027 First Snowfall Predictions
In long-range weather forecasting, we look at trends and probabilities, and using multiple data sources is key. The more forecast data you can look at, the better idea you can get of what the most likely scenario is.
For that reason, we also use the UKMO long-range forecasting system alongside ECMWF. Its latest run currently covers the November to January period, but it’s enough to give us a real glimpse at the early-mid Winter period.
First, looking at the seasonal average for Europe, we can see overall less snowfall than normal. Unlike the ECMWF, we don’t even see some higher elevations across central parts with increased snowfall. This is the November-January mean, which means that the average is lower due to usually a slower snow season start in November.
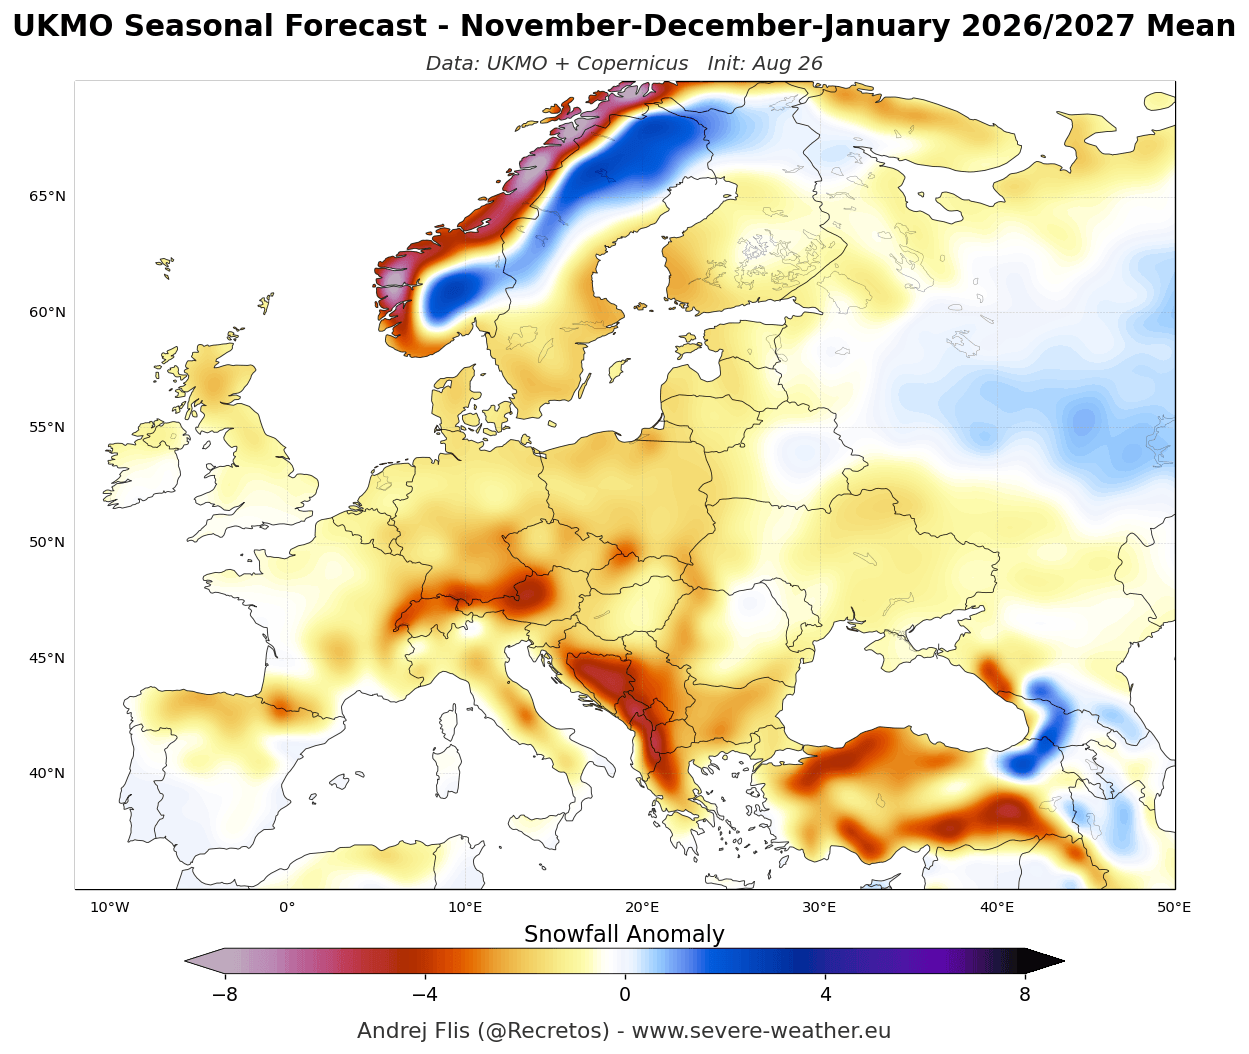
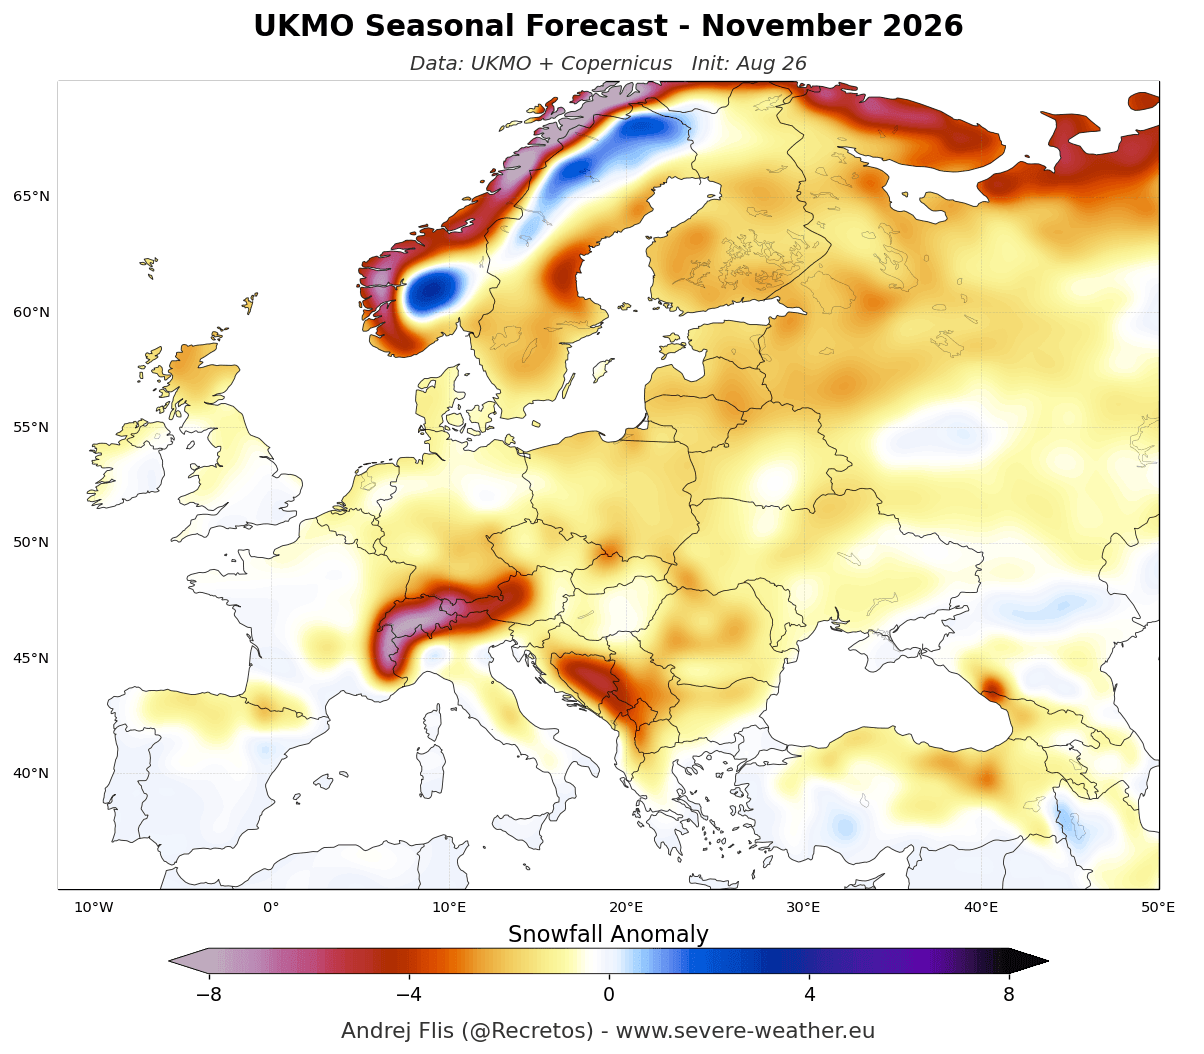
We can see this in the single-month forecast for November. Most areas have below-normal snowfall, indicating a very delayed snow season start, even across the elevations, due to the high-pressure ridge bringing warmer temperatures and less precipitation.
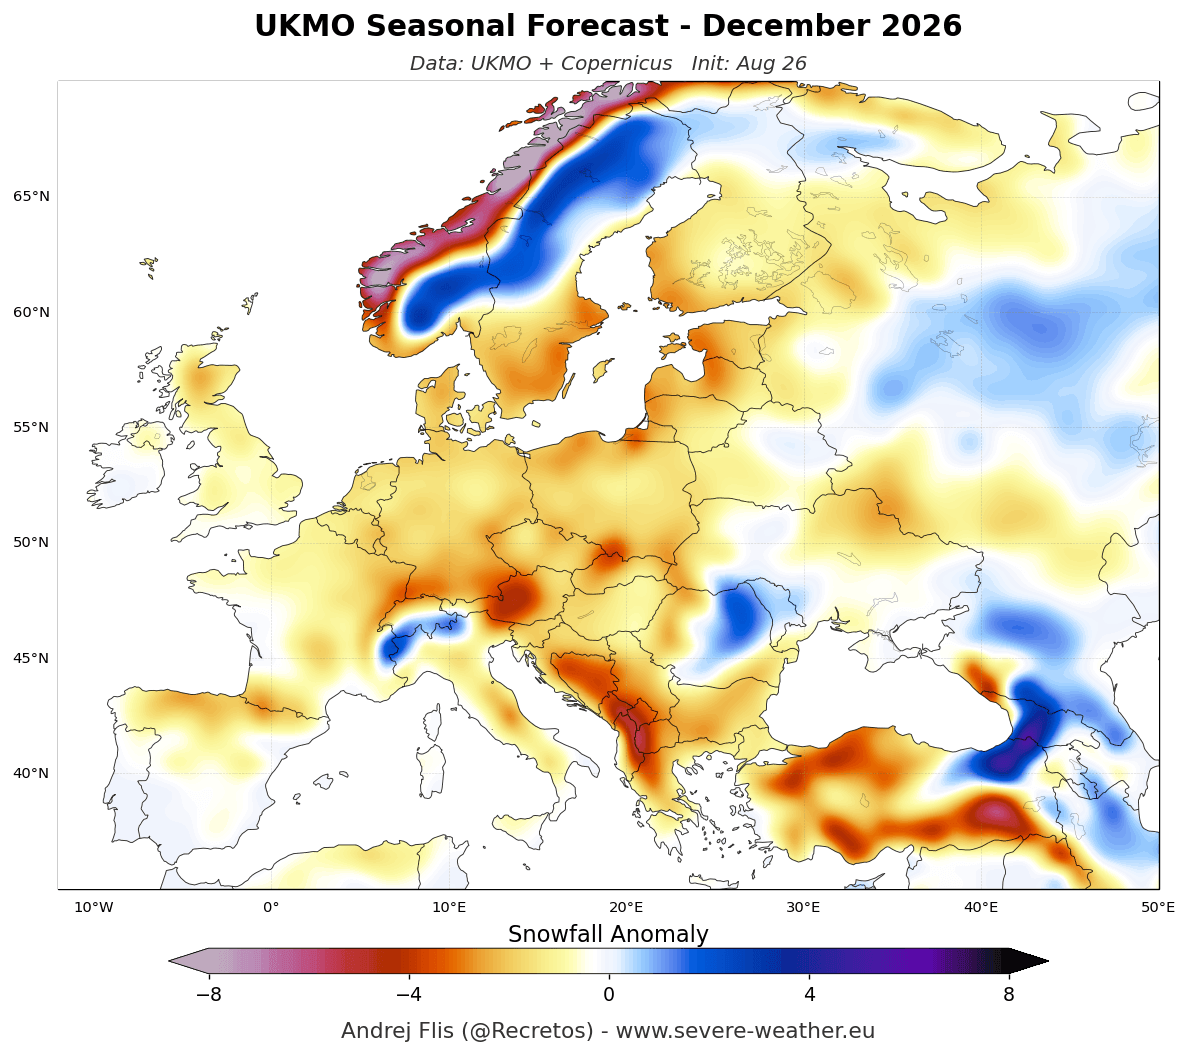
The December snowfall forecast shows a very weak snow outlook, with most of the continent under below-normal snowfall. We do see some above-normal snowfall areas appear at higher elevations, but less than in the ECMWF forecast.
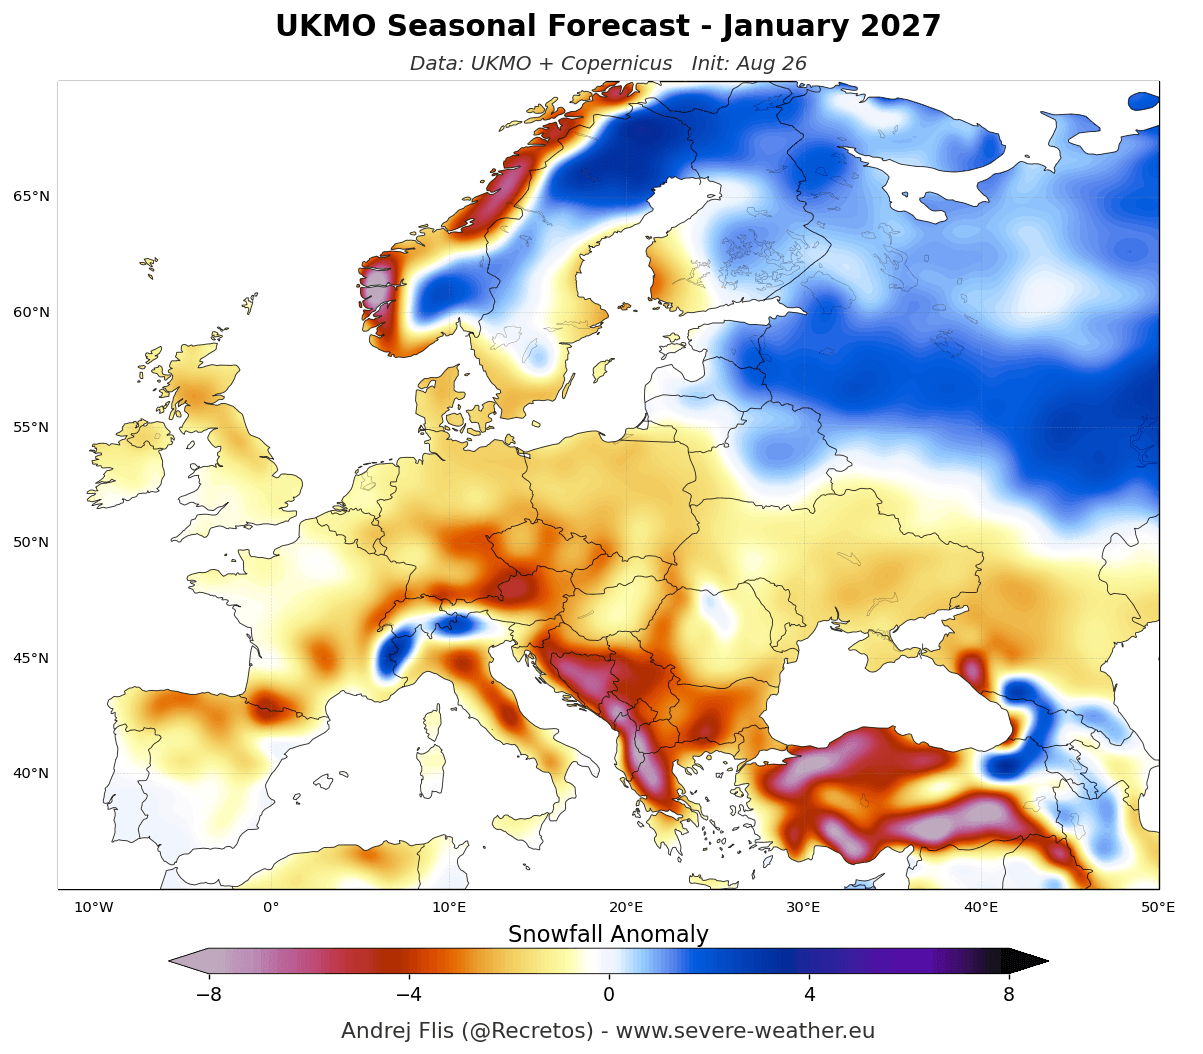
Looking at the January snowfall forecast, there is no real improvement over higher parts of central Europe, with an even larger deficit in the lower elevations. We see above-normal snowfall to the north and northeast, similar to the ECMWF forecast.
Overall, both models agree on a well below-normal snow season across Europe, dominated by a high-pressure ridge and a North Atlantic low-pressure zone, driving a milder westerly flow into the continent.
UKMO United States and Canada Snowfall Forecast for Winter 2026/2027
The UKMO seasonal snowfall forecast for the November-January period shows a clear El Niño snowfall pattern, just like ECMWF, confirming this development trend. Above-average snowfall anomalies are concentrated across the western and central United States, extending southward and eastward into parts of the Ohio Valley.
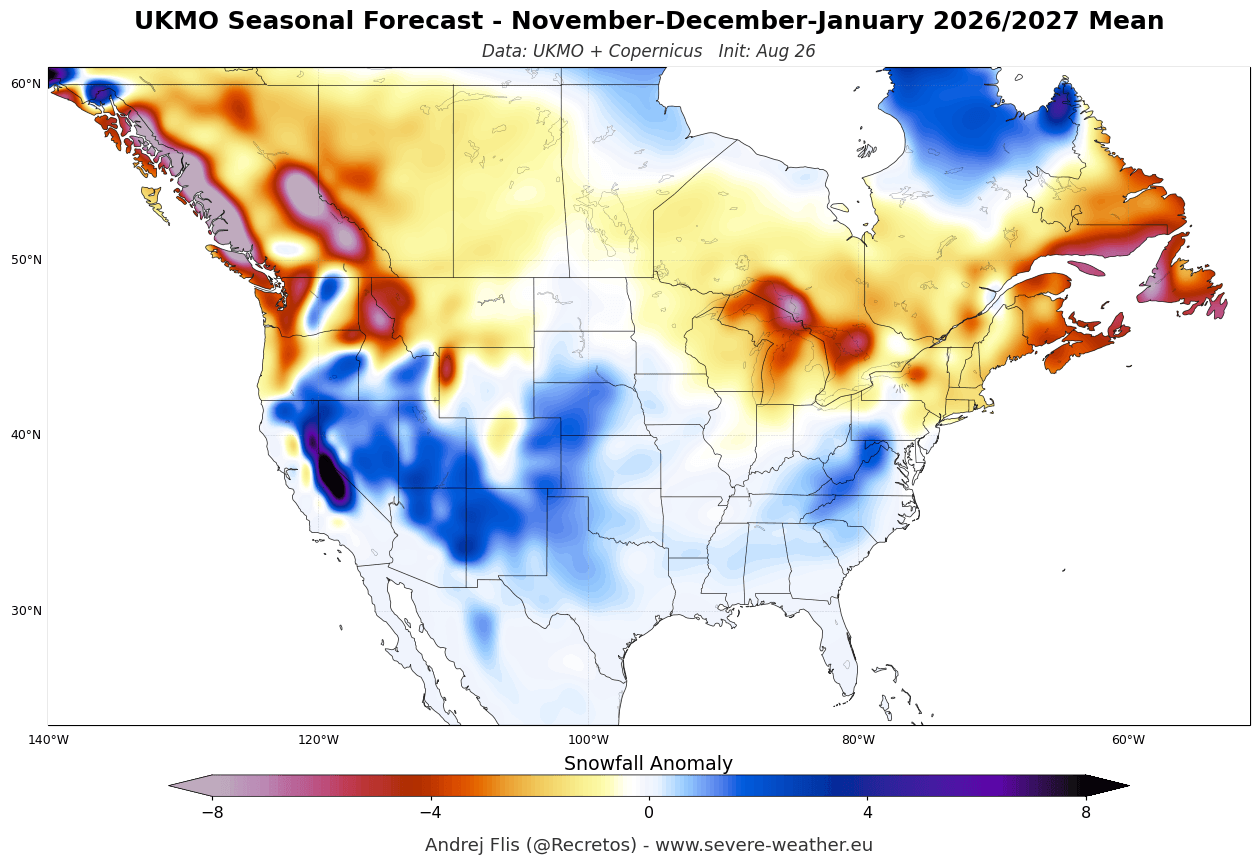
A broad snowfall deficit spans the northern United States and most of southern Canada. Below-normal snowfall is forecast from the Pacific Northwest and northern Rockies, over the Upper Midwest, the Great Lakes, and into New England. This is because the main storm track remains pushed south, allowing a milder air mass to limit snow potential across northern latitudes.
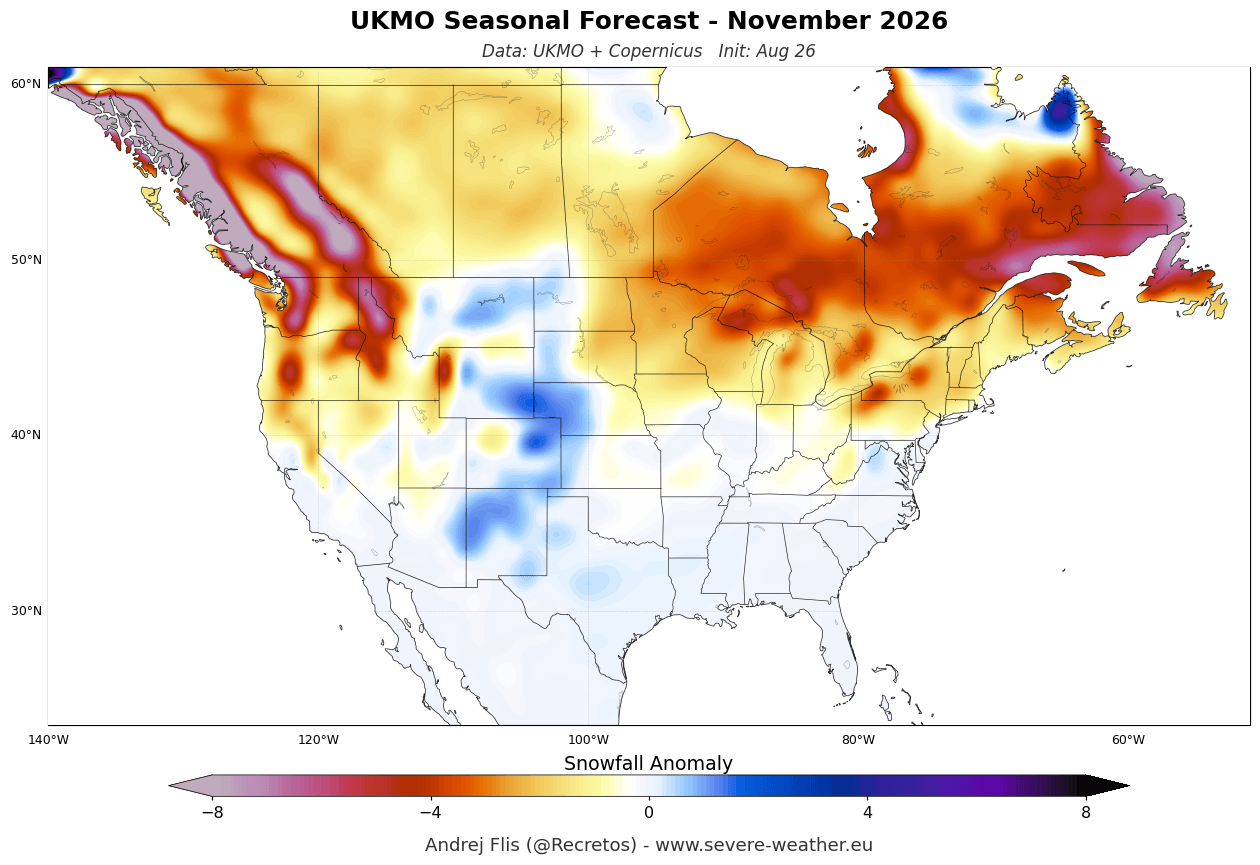
The November snowfall forecast shows a rather slow start to the snow season. It has above-normal snowfall limited to higher elevations, but also shows snowfall areas across the central and northern Plains. Otherwise, we see below-normal snowfall across much of the rest of the United States and Southern Canada.
The December snowfall forecast shows above-average areas expanding across the western and central United States, and toward the east. Just like in the ECMWF forecast, we also see below-normal snowfall across the Pacific Northwest, the Great Lakes, and the Northeast as main low-pressure systems track farther south.
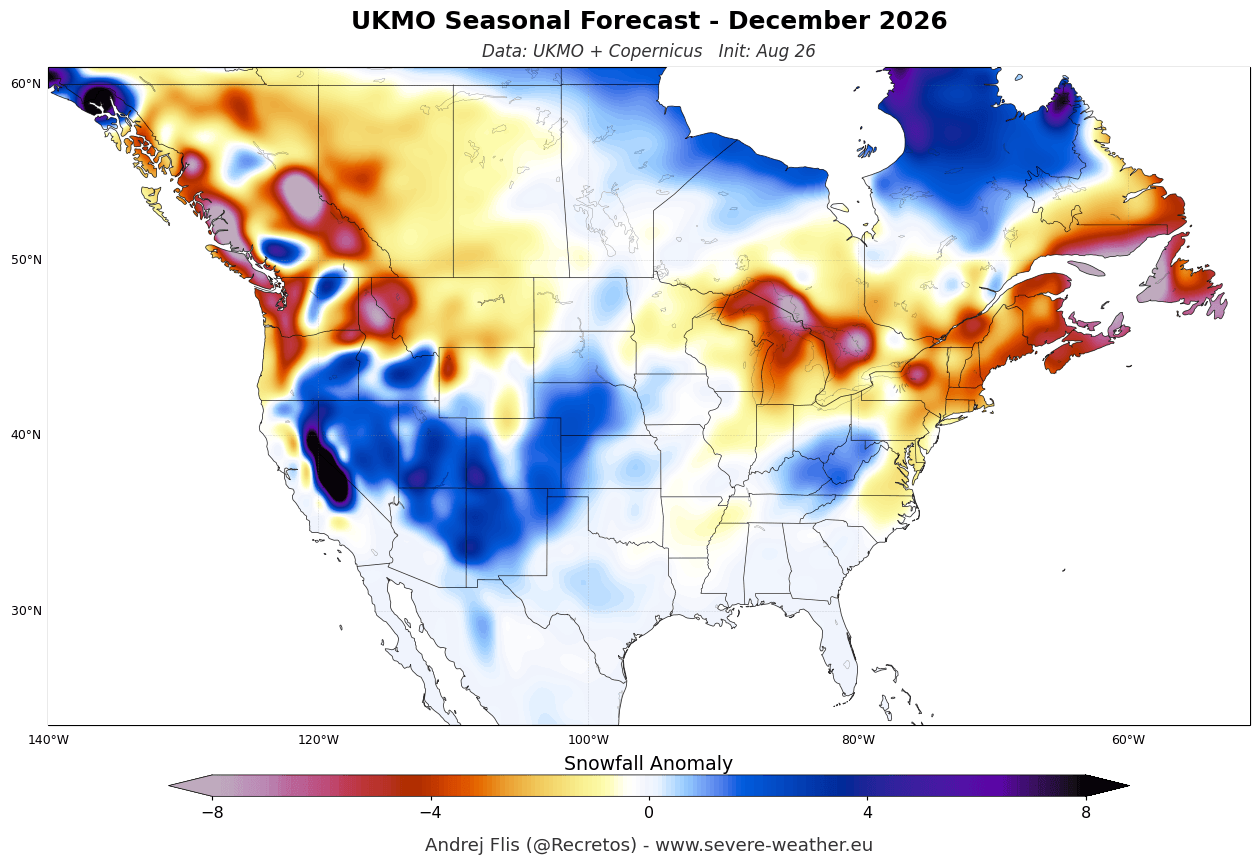
Across Canada, the forecast shows below-average snowfall across much of the southern half, especially in the far southeast and in the southwest.
The January forecast shows a significant expansion of above-average snowfall across the western, central, and eastern United States. Strong positive anomalies cover the Sierra Nevada, the Great Basin, and south-central Rockies, extending eastward across the Plains, the Ohio Valley, and into the Mid-Atlantic.
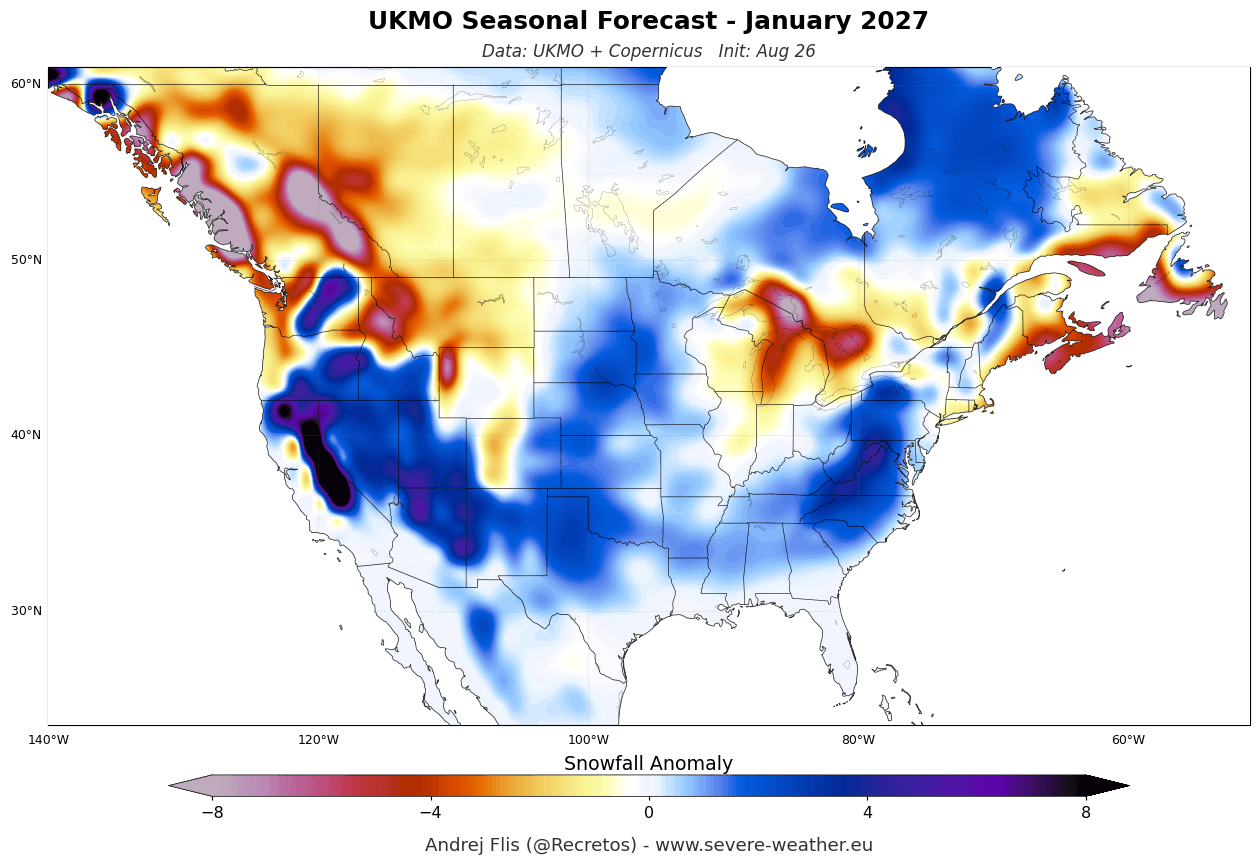
Below-normal snowfall continues over the Pacific Northwest, parts of the northern Plains, the Great Lakes, and interior New England. Across Canada, below-average snowfall still covers southwestern parts, while some above-average snowfall areas are emerging across southern and parts of southeastern Canada.
The January snowfall forecast shows a pattern consistent with historical strong El Niño winters, as shown earlier above. Research by Kunkel and Angel (1999) found that strong El Niño events reduced snowfall across much of the northern United States but increased snowfall across the Southwest, linked to a southward shift in winter cyclone activity.
The ECMWF and UKMO January forecasts show an unusual agreement for this, both showing above-normal snowfall into the Western and Eastern United States, the Plains, and the Mid-Atlantic while keeping the Northwest, the Great Lakes, and southwestern Canada in a snow deficit.
The increased snowfall potential farther east, particularly around the Appalachians and Mid-Atlantic, is also interesting. A 2011 study (linked below) found that during El Niño years, East Coast winter storms tend to produce above-average precipitation and snowfall across areas of the Northeast and northern New England.
If you like this article and would like to see more of our weather and nature coverage, you can quickly and easily add us as a Preferred Source on Google Search.
Make us your Preferred Weather & Nature Source on Google
Scientific Studies Used in this Article
- East Coast Winter Storm Snowfall: An East Coast Winter Storm Precipitation Climatology – Frankoski and DeGaetano (2011).
- Strong El Niño Snowfall Patterns: Relationship of ENSO to Snowfall and Related Cyclone Activity in the Contiguous United States – Kunkel and Angel (1999).
Forecast and analysis images in this article are mostly my own, with others sourced from ECMWF, CyclonicWX, and NOAA-Climate.
Fall 2026 Final Forecast: Fall 2026 Forecast Update: Super El Niño Builds a Split-Flow Pattern Ahead of Winter 2026/2027
Full Winter 2026/2027 Forecast: Winter 2026/2027 First Forecast Shows a Major Super El Niño Pattern
We will keep you updated on the global weather pattern development, so bookmark our page. Also, if you have seen this article in the Google App (Discover) feed, click the like or the star button there to see more of our forecasts and our latest articles on weather and nature in general.