UPDATE June 26th, 2026: Super El Niño Is Now Breaking Into the Atmosphere as July Forecasts Show a Pattern Shift for the U.S. and Canada
The 2026 North American summer season is entering a critical transition phase. Latest data confirms that a strong El Niño event is not only developing but is already showing early signs of its presence in the global atmospheric circulation. We are now witnessing the first detectable changes in pressure and temperature patterns across the United States and Canada.
In this article, we will look at the latest analysis and forecasts to reveal the specific El Niño signal currently emerging in the atmosphere. Compared to historical data from past Super El Niño events, you will see the specific pressure and temperature anomalies already manifesting, along with what to expect in the coming weeks and months.
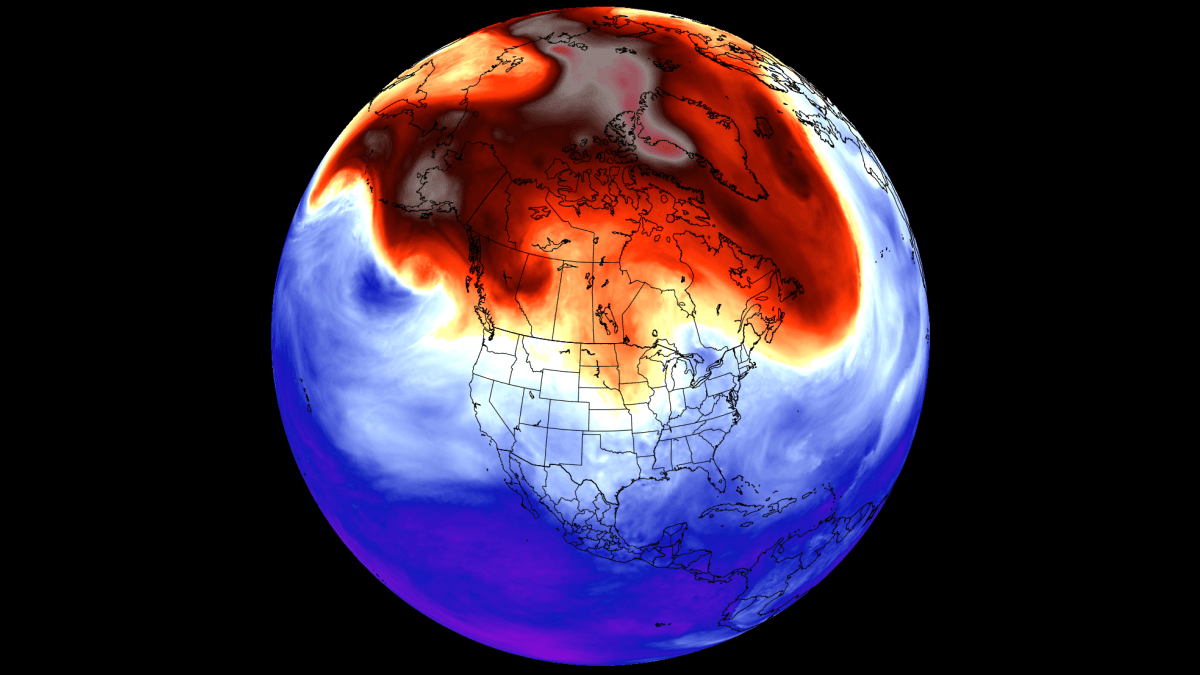
The Pacific Waking Up: El Niño 2026 Gaining Strength
Over the past few weeks, we have seen increasingly strong indications that an El Niño event will be a major global weather driver in 2026/2027. This is a warm phase of the ENSO region in the equatorial Pacific Ocean that alternates between warm and cold phases every few years.
In this cycle, we are entering a strong El Niño, so we can look at the usual changes it brings to the atmospheric circulation. The upward and downward atmospheric motion in the tropical regions is called a Walker Cell, and is especially sensitive to strong ENSO events.
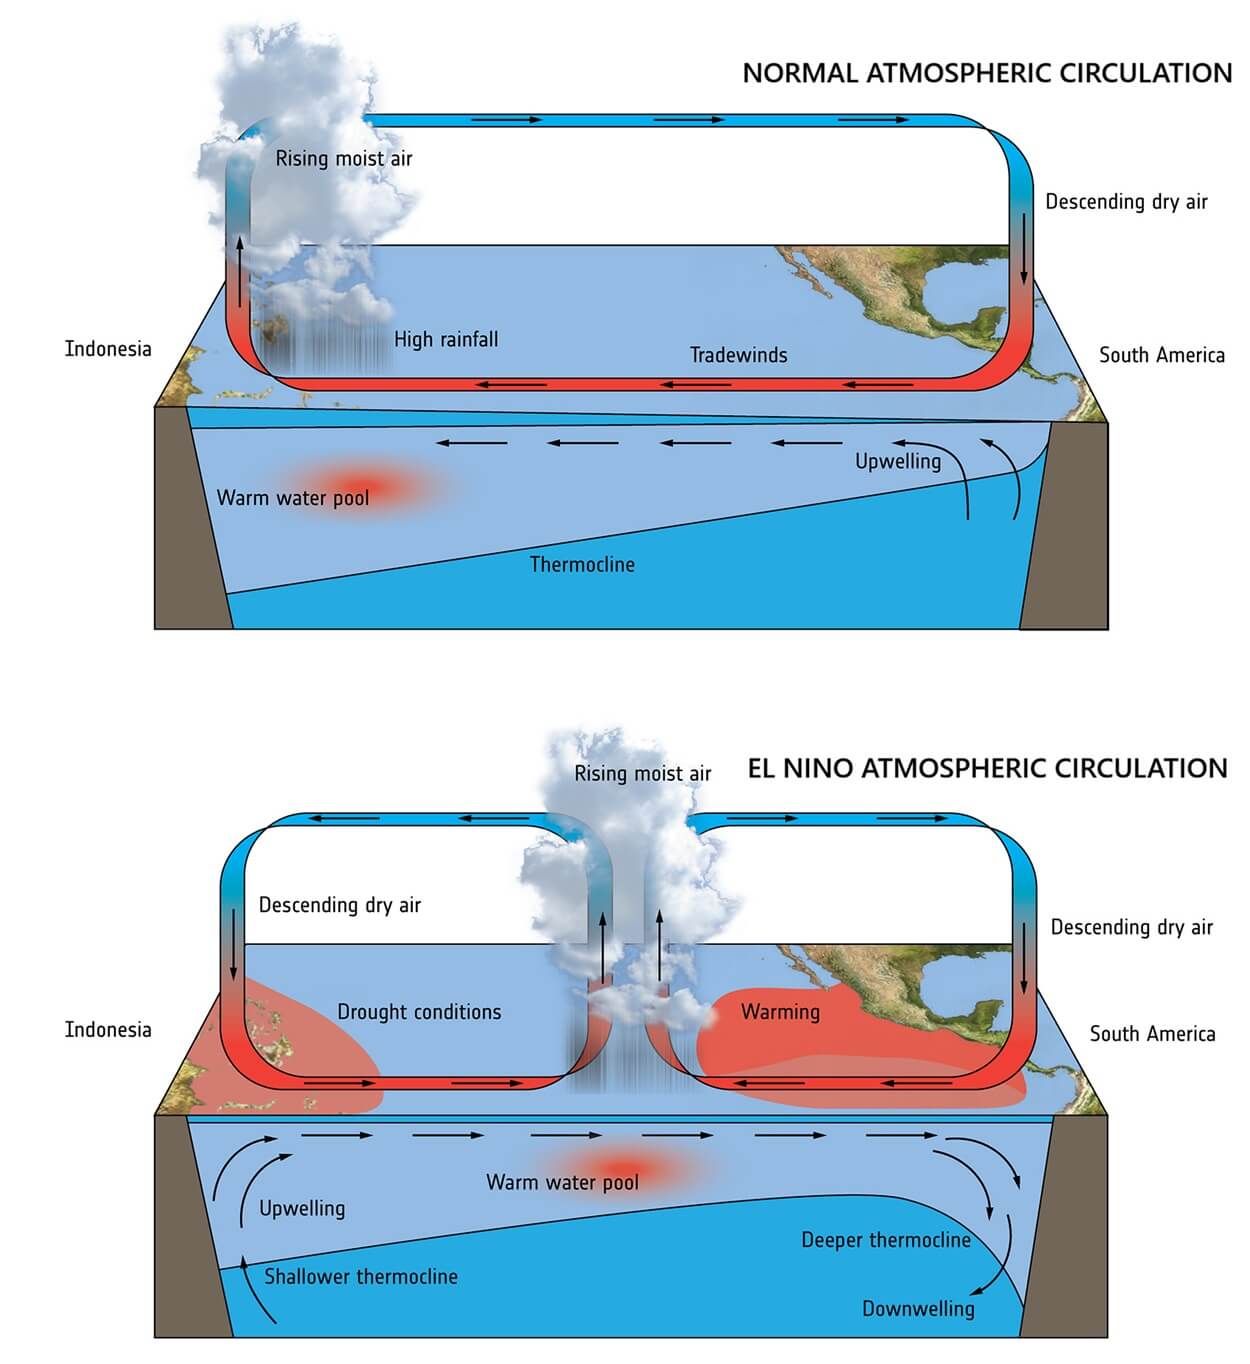
The schematic above, by ESA, shows the changes in this atmospheric motion cell during a normal atmosphere (ENSO neutral) versus an El Niño event, altering the global atmosphere with a so-called atmospheric bridge.
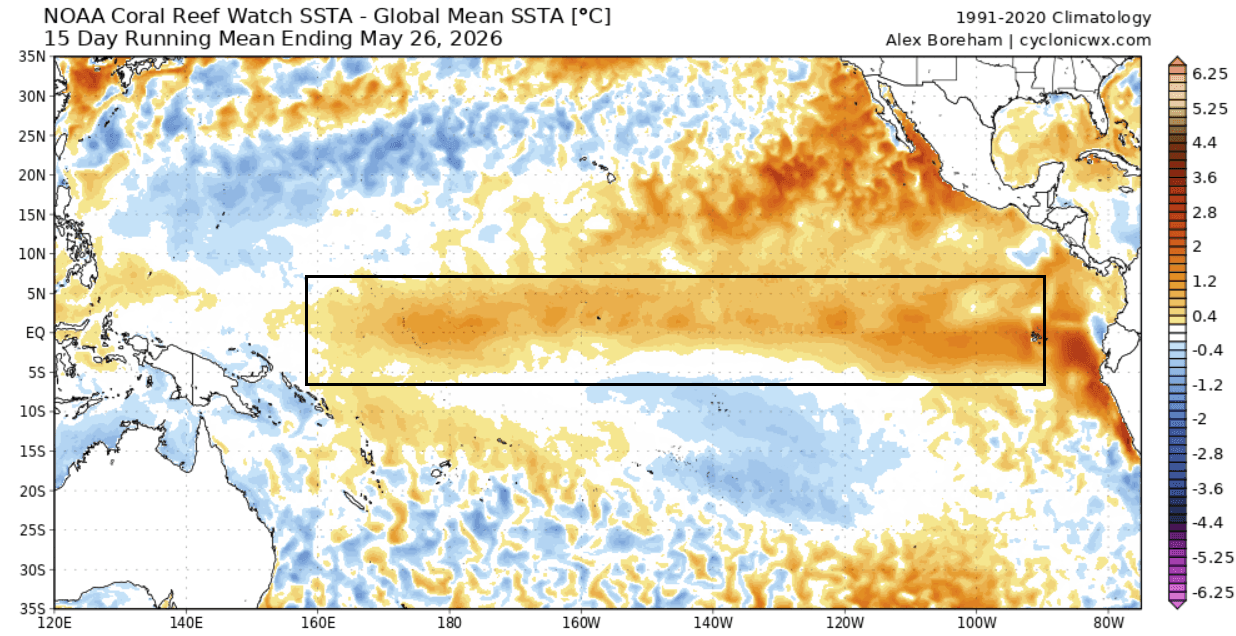
The latest ocean analysis below shows the main ENSO region being covered in warm anomalies. This analysis has the global average anomaly removed, so it shows the pure warm signal of the new El Niño, starting to make a really obvious presence with a broad warm signature.
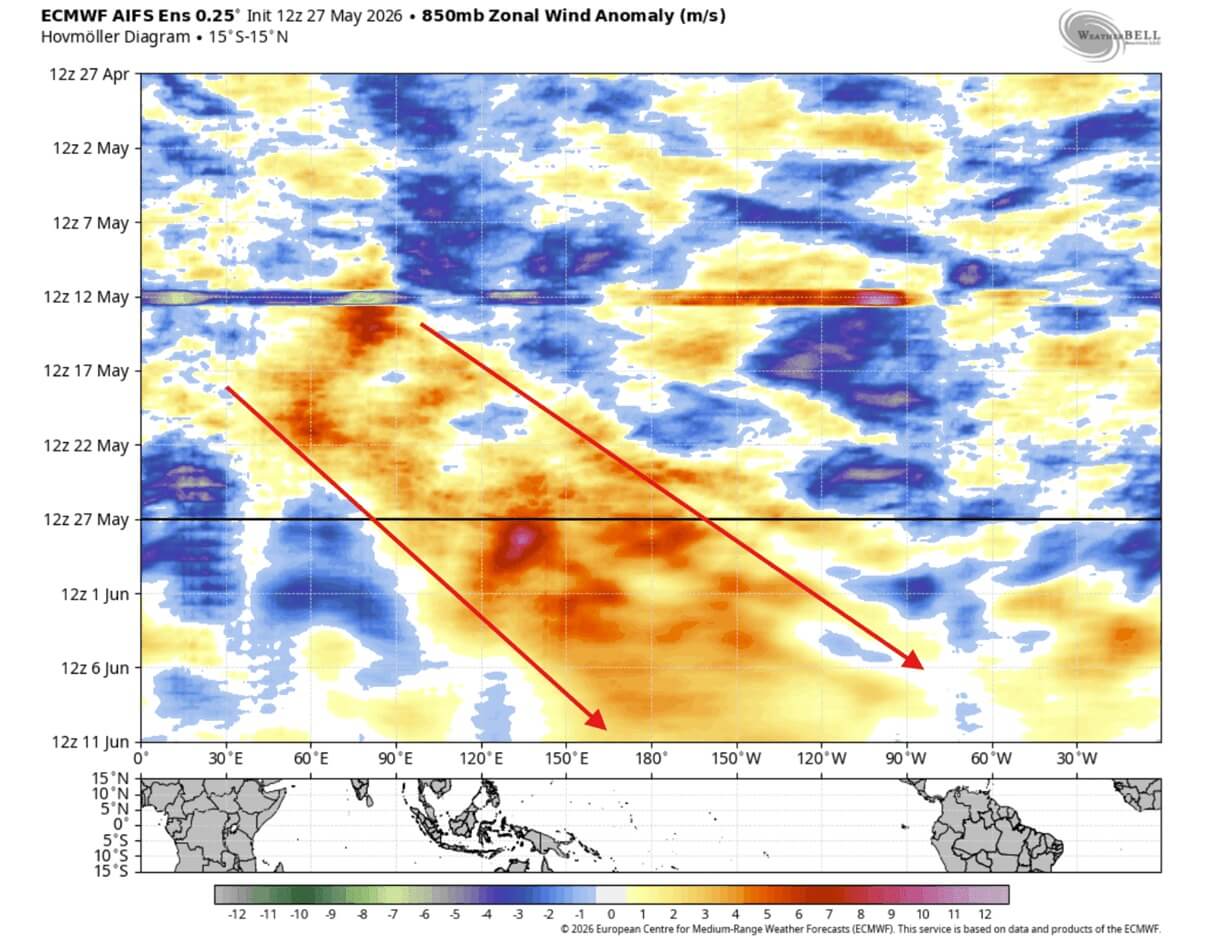
This warming is driven by westerly wind bursts or weaker trade winds, which push the warmer subsurface ocean waters to the east, where they rise to the surface. This is a practical example of how the atmosphere can drive changes in the ocean. The forecast below shows a new powerful round of westerly wind anomalies progressing across the tropical Pacific, further supporting warming in the tropical Pacific.
The expanding westerly wind anomaly has helped develop a massive underwater warm anomaly, called a Kelvin Wave, rise from below, now manifesting as a warm anomaly on the ocean surface. We produced a video below that shows the past weeks of subsurface temperature anomalies in the region, showing clear movement of this unusually strong Kelvin Wave and its eventual rise to the surface from depths.
This is reflected in the latest ENSO forecast from the NCEP CFSv2 model. It shows a very strong El Niño developing, exceeding a Super El Niño threshold (+2 anomaly), and making a rapid impact. The development shows a similar signature to the previous strongest events, which we are likely to match or exceed this year.
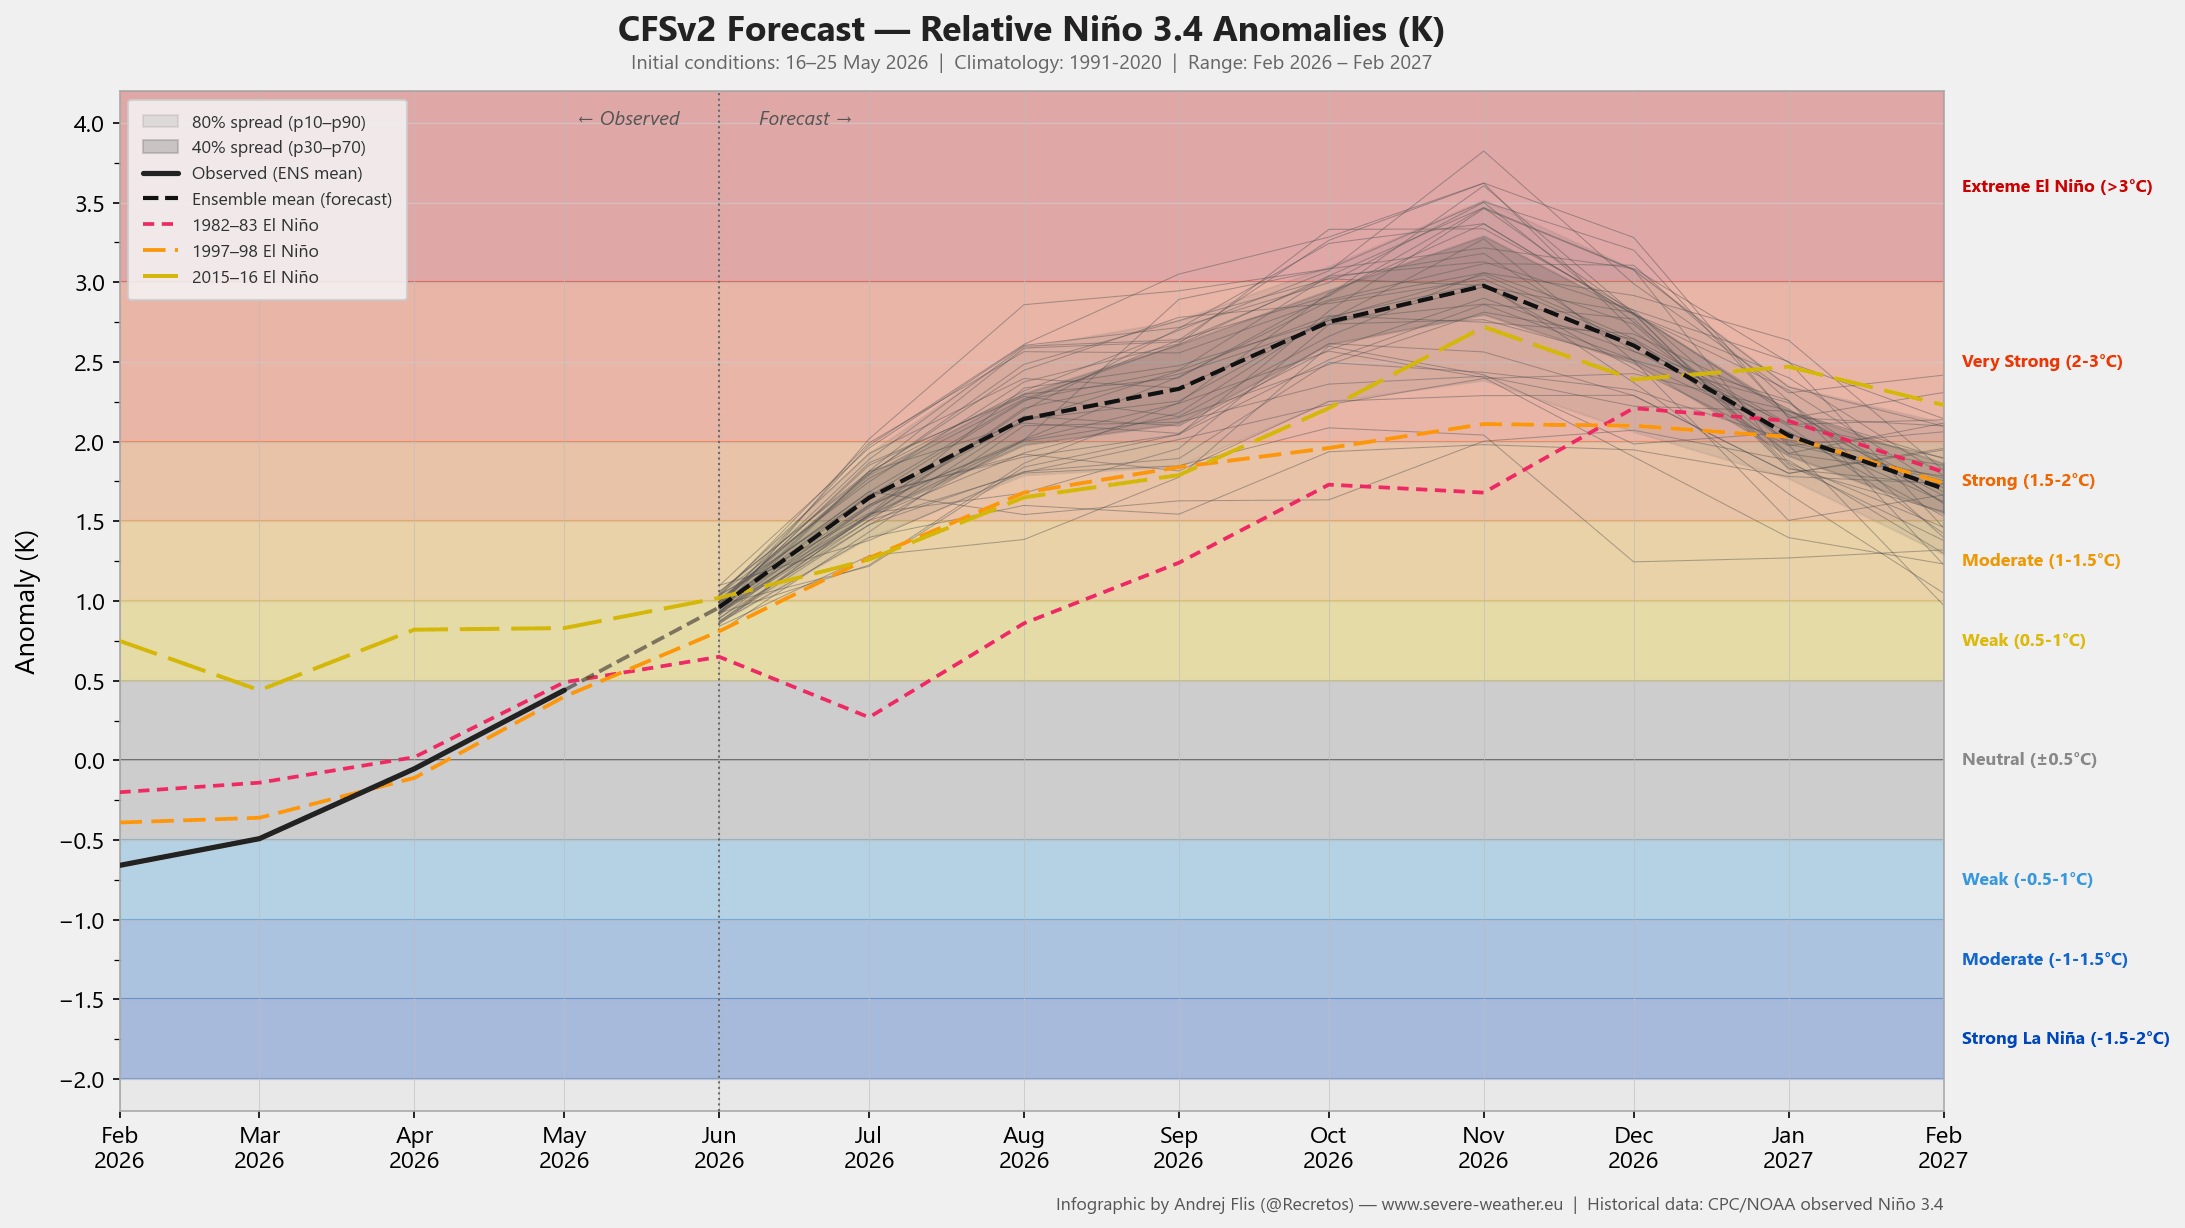
A Super El Niño event can lead to more extreme weather shifts, turning normal seasonal changes into high-impact events such as massive flooding, severe droughts, severe storms, and significantly altered pressure system tracks that can affect the entire planet.
El Niño events tend to reach peak anomaly later in the year. The latest forecasts now extend into Fall, revealing ocean temperature anomalies through November 2026. You can see this forecast below, with anomalies peaking over +4.5 in the eastern regions. If it were to verify to this extent, this could rival a historically record-strong El Niño event.
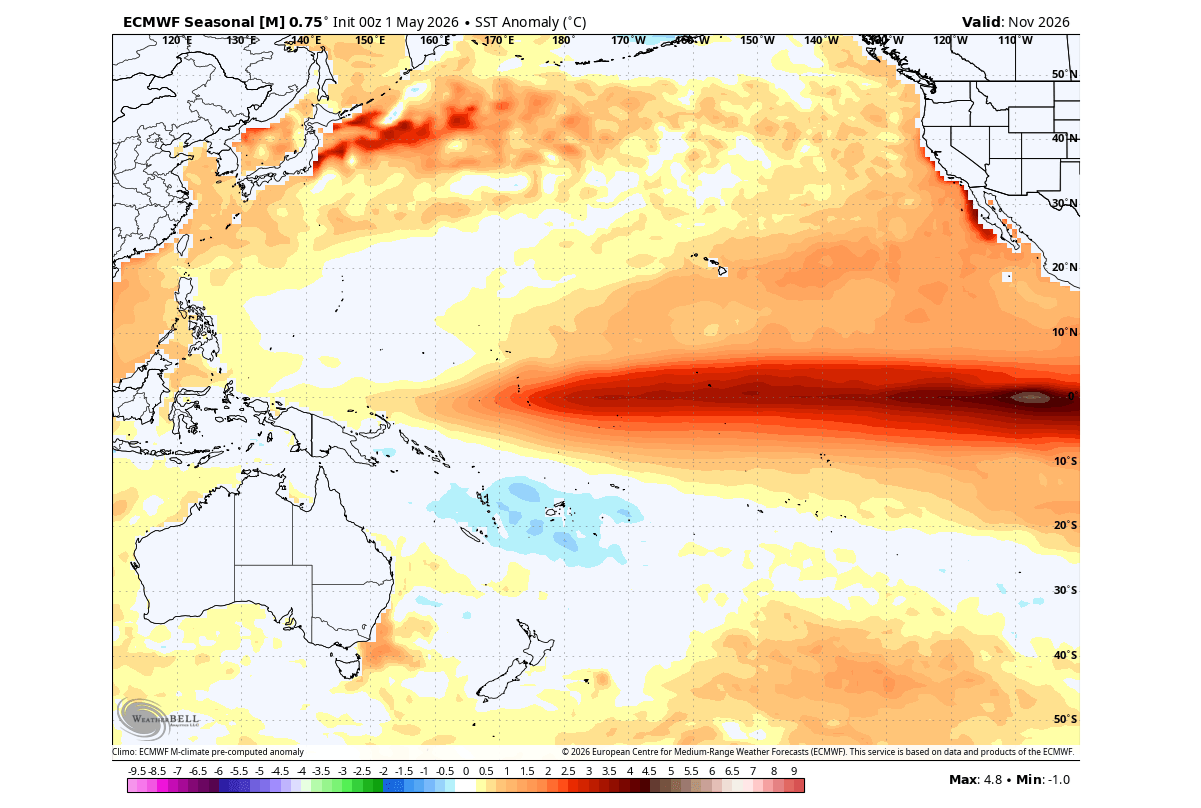
But before we get that far, we need to pass Summer first. And despite the expected peak strength in Fall, we can see the first atmospheric impacts already.
The Ocean Signal Breaks Into the Atmosphere
The first clear atmospheric impacts of the new El Niño can be detected by using the Velocity Potential forecast. This shows us areas of rising and sinking air, revealing the broad atmospheric circulation.
The latest June ECMWF forecast already shows a substantial anomaly of rising air over the Pacific and sinking air over the Indian Ocean, revealing a clear El Niño atmospheric circulation. This means that June will already be the first month with weather patterns shifting into El Niño mode.
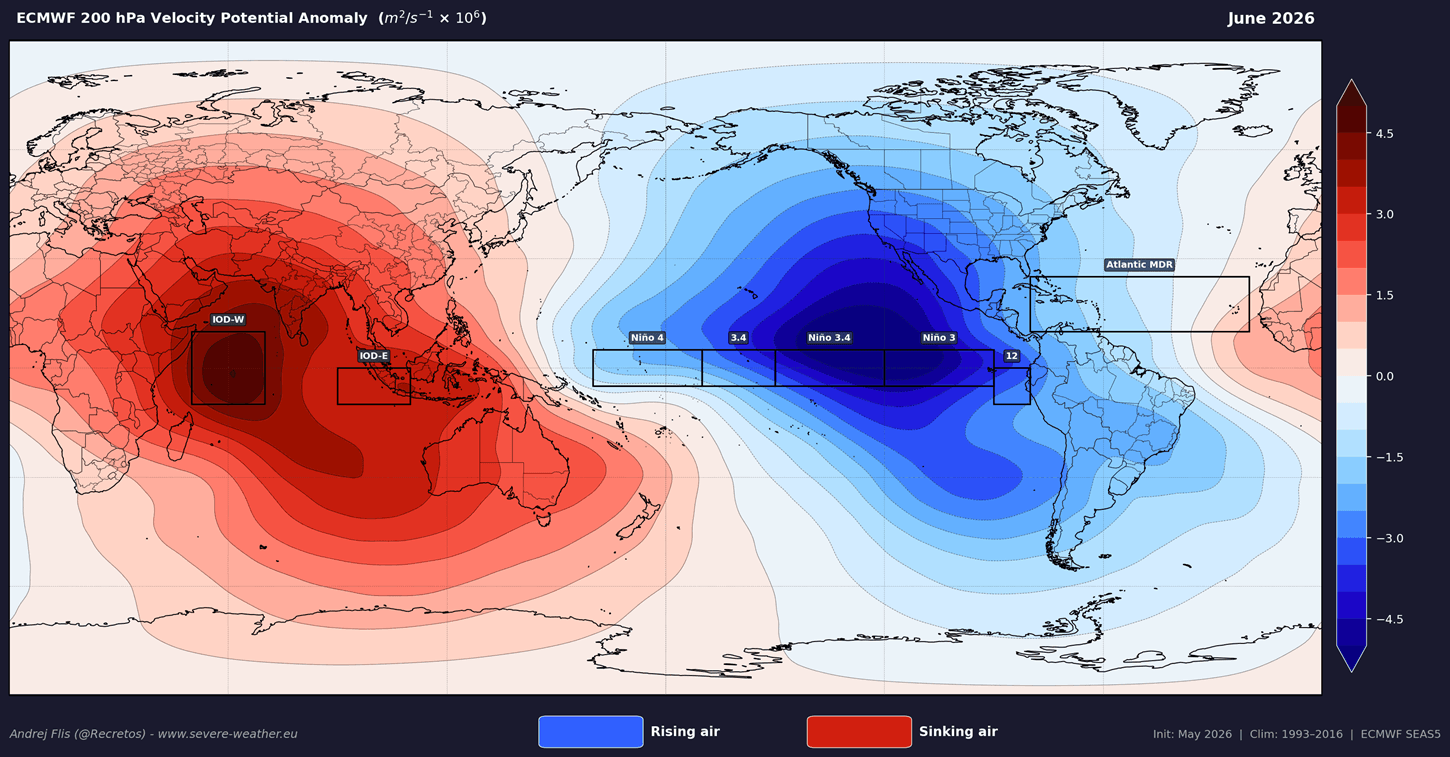
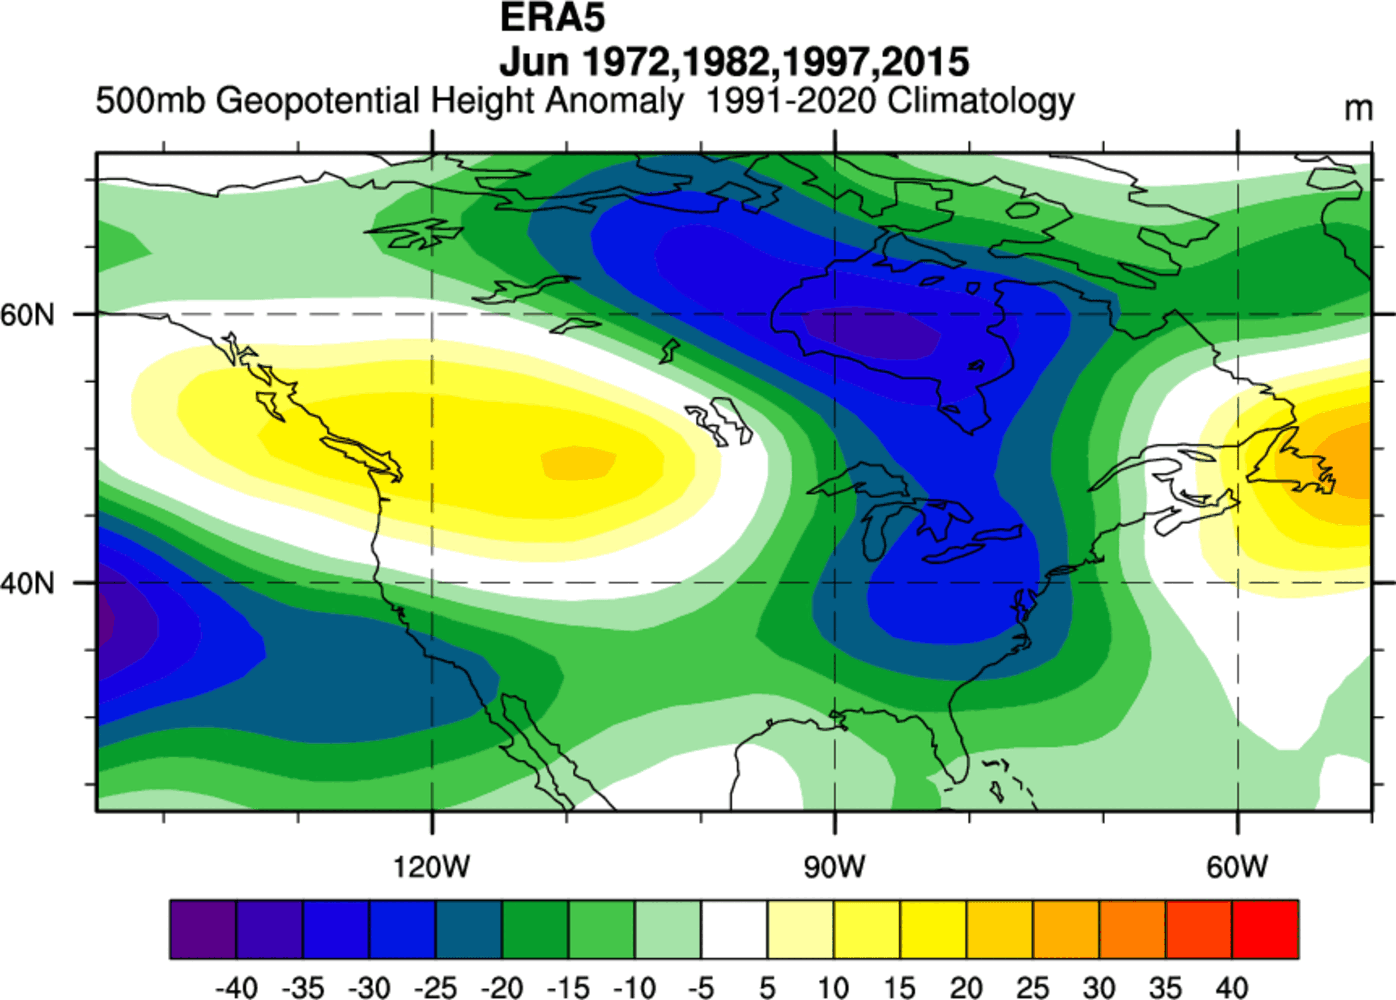
Overall, we can see that this year is well on par with some past Super El Niño events at this stage of development. For that reason, we produced two graphics that look at June weather patterns in the last 4 Super El Niño events.
First, we have the pressure pattern, and it reveals a low-pressure tendency over eastern Canada or the eastern United States, and also over the southern parts of the United States, as the Pacific jet stream starts to amplify during an El Niño. A high-pressure (heat dome) was detected over the northern United States and the Pacific Northwest, with another high-pressure region over Atlantic Canada.
The temperature anomaly for the same period/events shows a cooler tendency over the eastern and southern United States, with the warm focus on the north and northwest. But here we have to add an important caveat: These years span multiple decades, each with a different climate baseline, so the data is more prone to showing a cooler trend during a modern norm period.
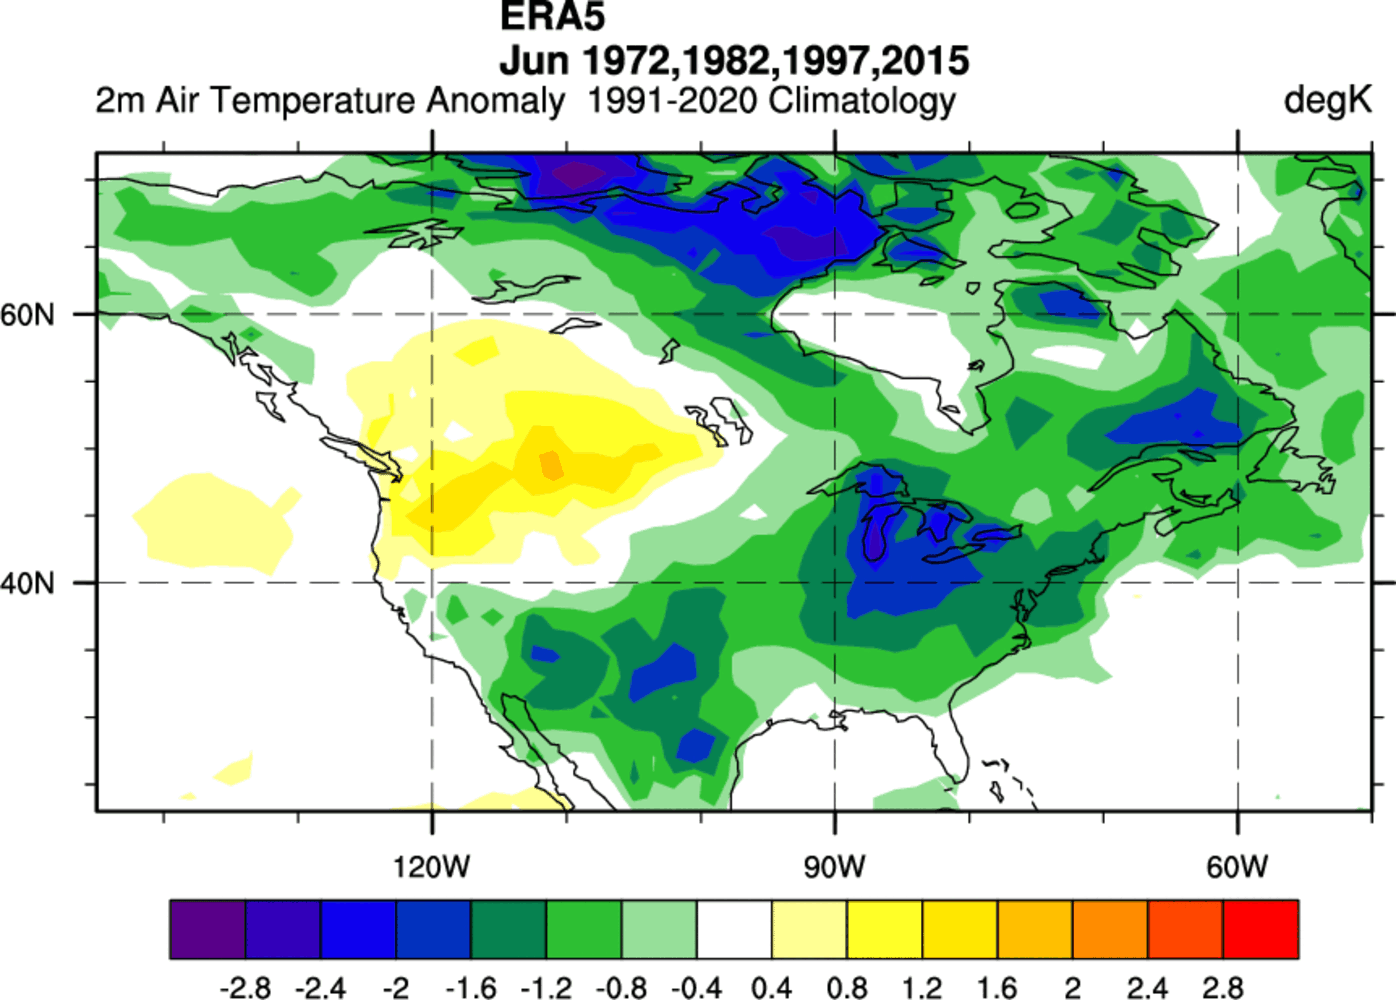
But the main idea still holds: normal or below-normal temperatures over eastern Canada and the eastern United States, due to the low-pressure anomaly and a more northwesterly flow. And above normal temperatures over the west-central United States and southwestern Canada.
We can also look at the temperature analysis for the past 90 and 30 days, which reveals a very interesting picture. On the left is the 90-day temperature anomaly, dominated by a warm anomaly over the United States and a cold anomaly over Canada, under an unusually persistent Polar Vortex core.
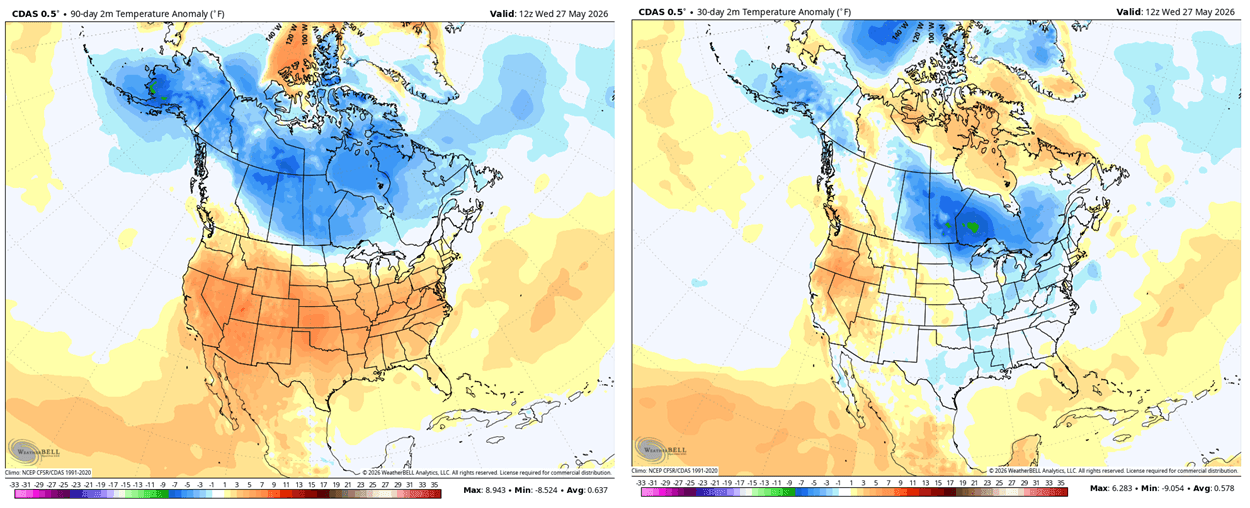
But looking at the 30-day anomaly on the right, you can see a very similar pattern to the historical analysis above. We see an area of normal to below-normal temperatures spanning southern and eastern Canada, expanding into the Midwest and the eastern United States, and also reaching the southern states.
This is a very surprising similarity to past Super El Niño data above, and it does help confirm that the developing El Niño is making a visible presence in the atmosphere.
June Forecast: First El Niño Impacts Detected in the Atmosphere
Looking ahead into the near future, you can see the pressure pattern forecast below, for the first third of June. It reveals a pattern very similar to the Super El Niño analysis above. A high-pressure area will sit over the northern United States, and a low-pressure area covers eastern Canada and the east coast of the United States.
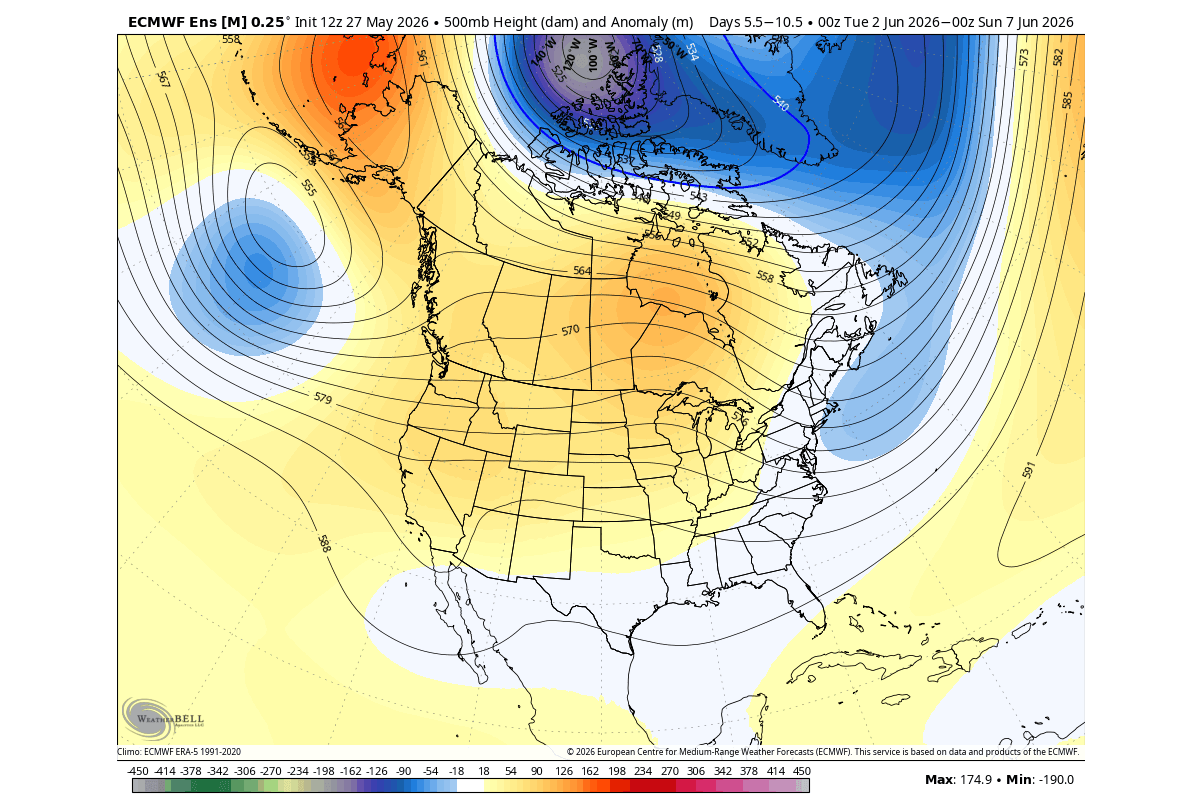
This anomaly does look close to the expected June pattern development in a strong El Niño. But of course, each event has its own nuance, not to mention that we are looking at a part of the month, while the analysis for past Super El Niño events above is a full monthly anomaly.
The temperature anomaly for the same period also looks surprisingly similar to the pattern above in the reanalysis. We can see mostly normal to below-normal temperatures over the East Coast, eastern United States, and all the way into eastern Canada, and below, down to the south. The main warmth will be under the west-central United States and southern Canada.
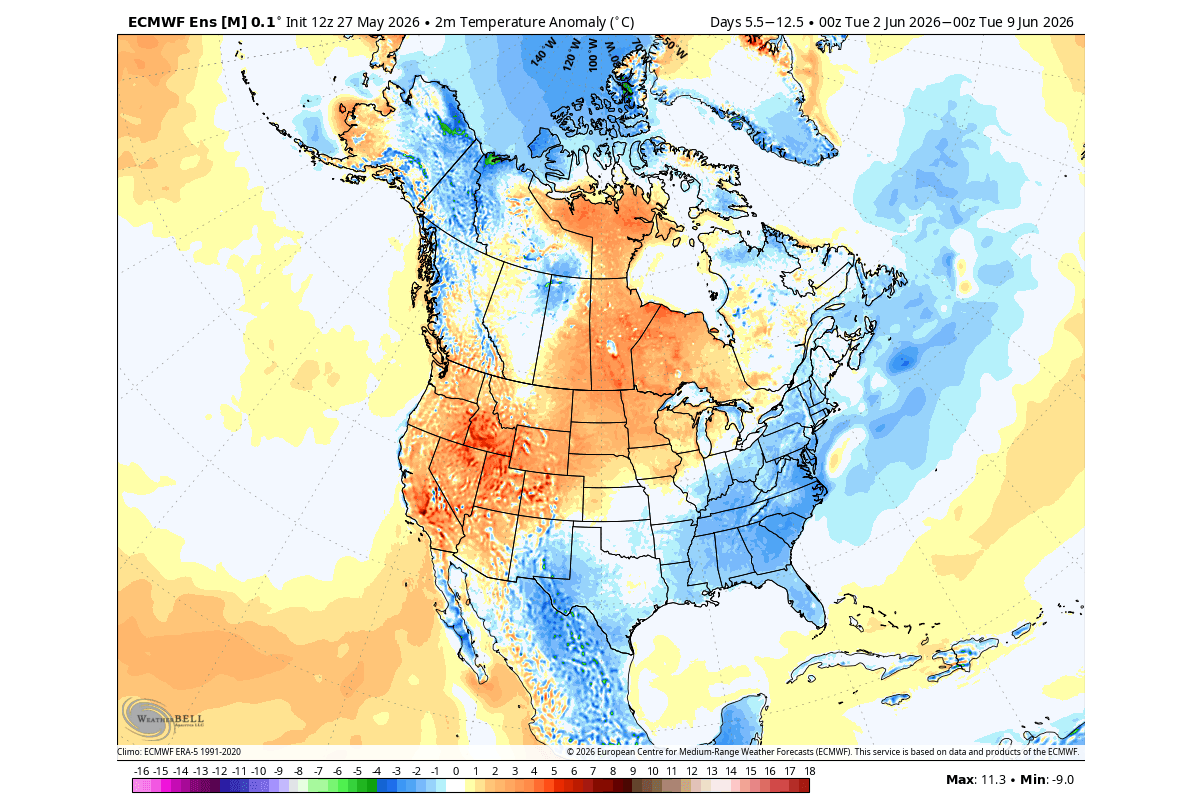
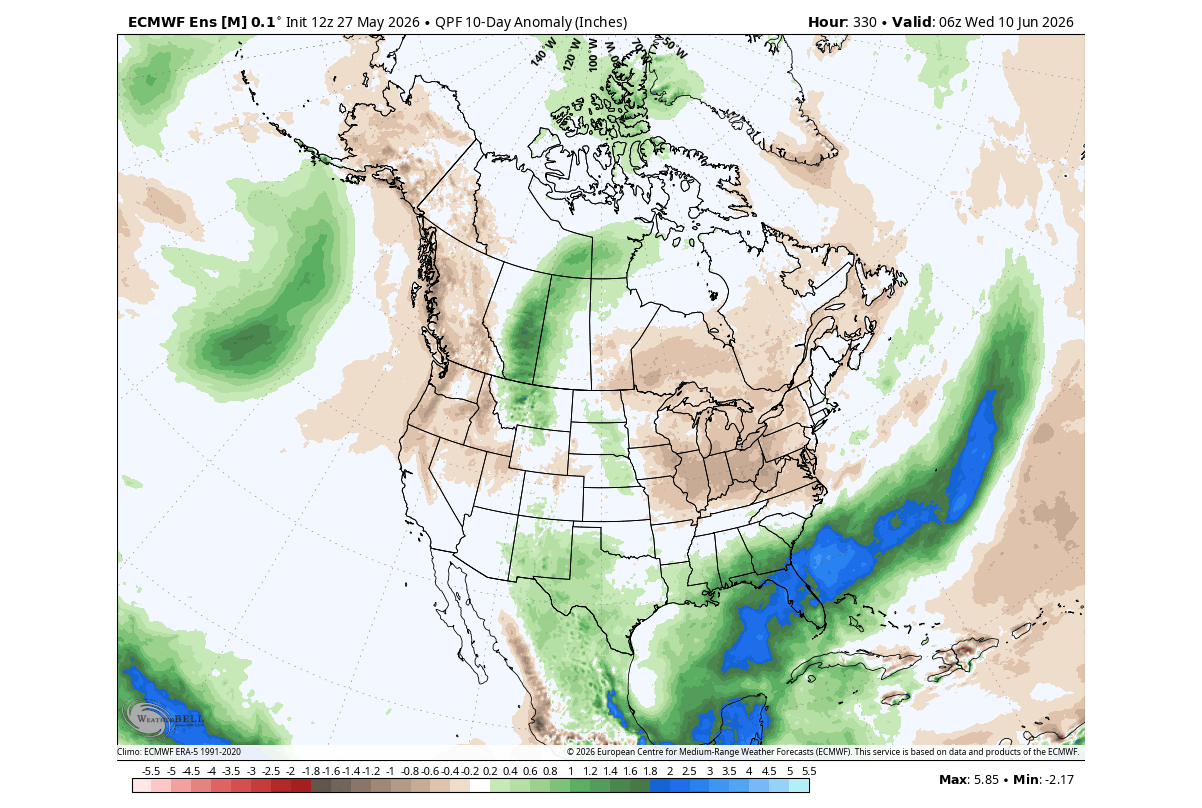
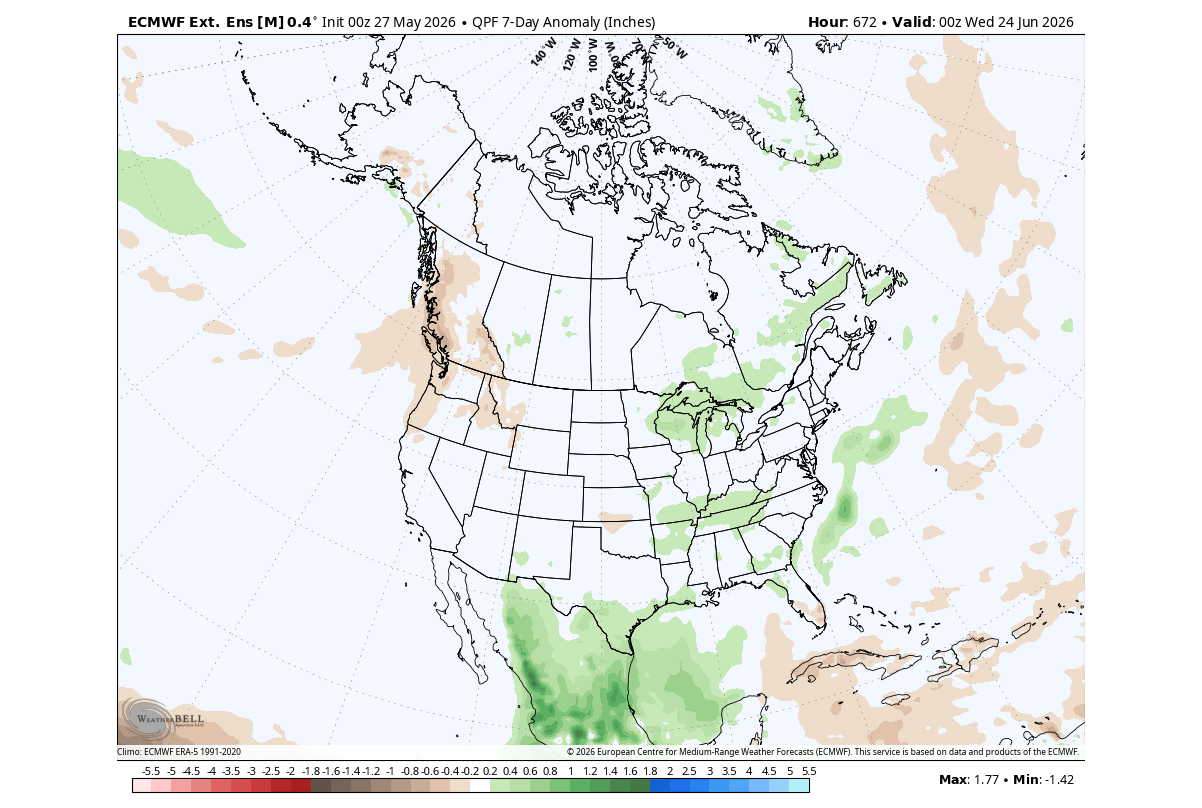
A more northerly flow and an expanding high-pressure area will really limit the precipitation over the Midwest and southeastern Canada, as you can see in the precipitation forecast below. But with the Pacific jet stream getting stronger during an El Niño, we can see more rainfall across the southern parts of the United States, especially Florida.
The ensemble forecast for around mid-June also shows a large area of rising air over the central and eastern Pacific, with a sinking anomaly over the Indian Ocean. This is the so-called “smoking gun” that we look for when tracking El Niño presence in the atmosphere.
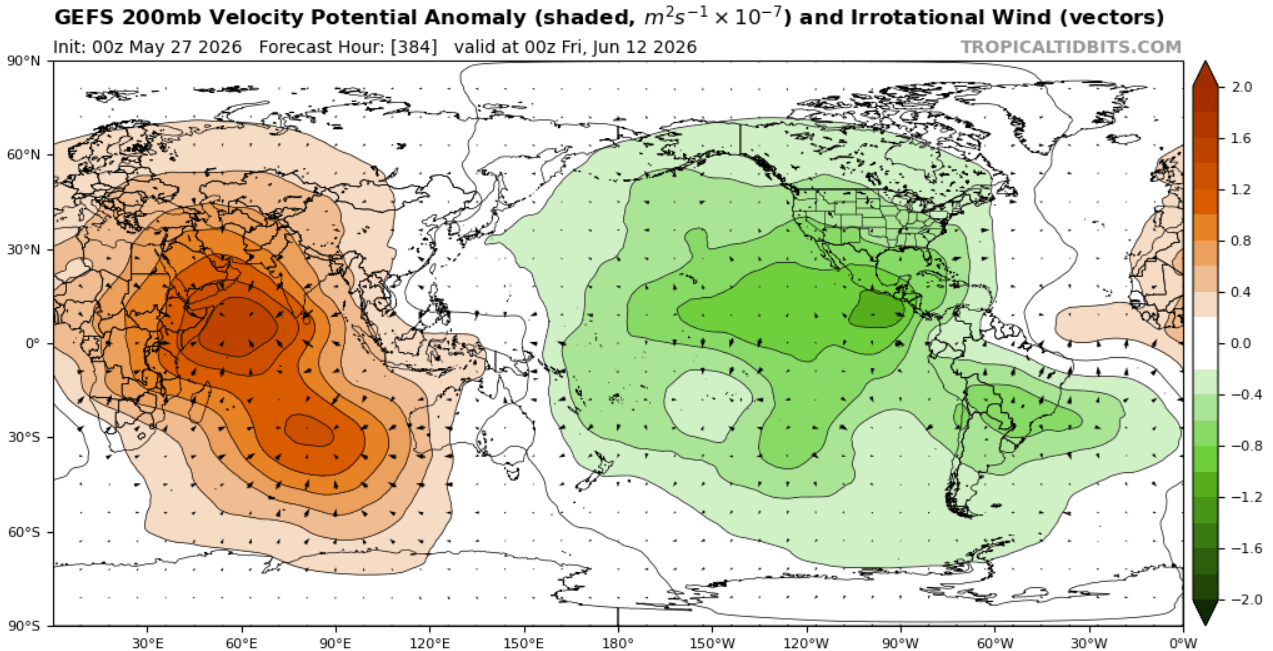
And this is just another indication that the deeper we go into Summer, the more we can expect the El Niño to influence the atmospheric patterns.
Mid-to-Late Month Outlook: Pattern Evolution and El Niño Signal
Below is also the latest extended ECMWF forecast trend for mid and late June. It again shows a very similar pattern to that seen in the historical analysis above for June. A low-pressure tendency continues over eastern Canada, potentially extending into the northeastern United States.
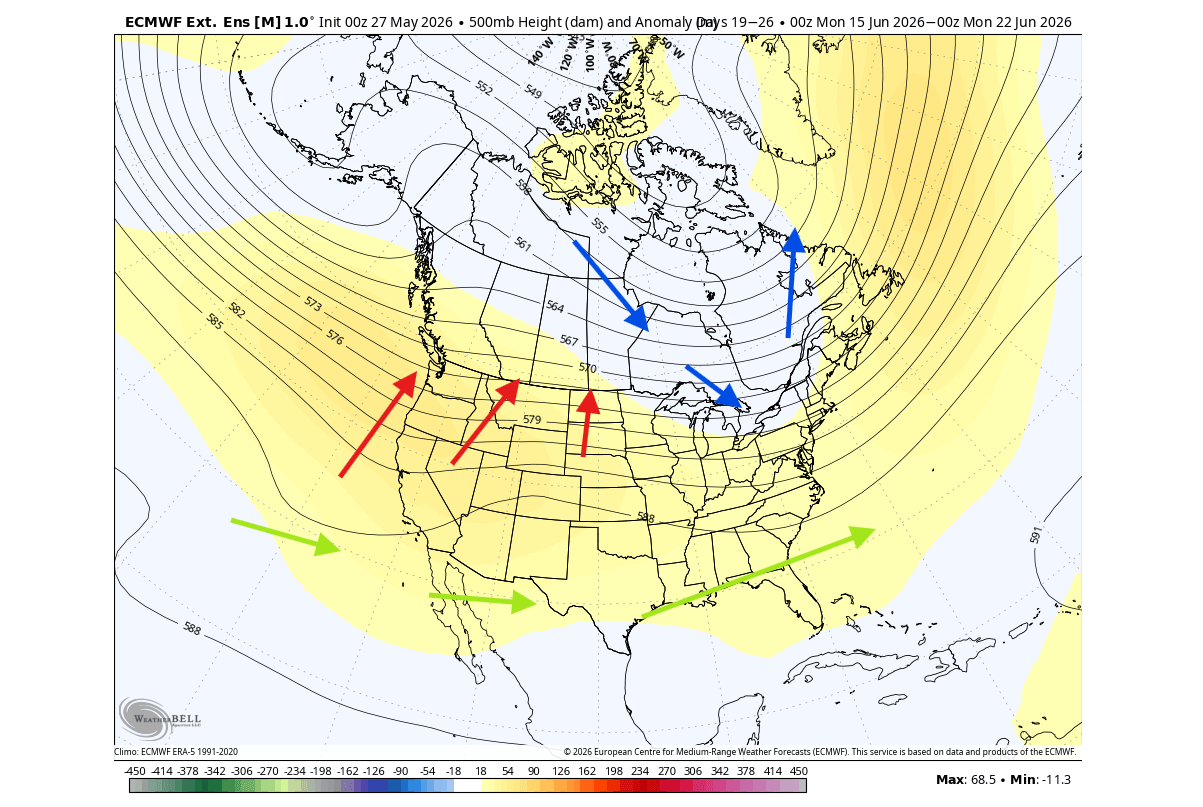
At the same time, the high-pressure dominance is forecast over the west-central United States, and a Pacific jet stream extension under both systems.
The temperature trends for mid and late June (left and right, respectively) also show a pattern similar to that of the historical June analysis above. A normal or below normal temperature area over eastern Canada, also expanding into parts of the eastern half of the United States.
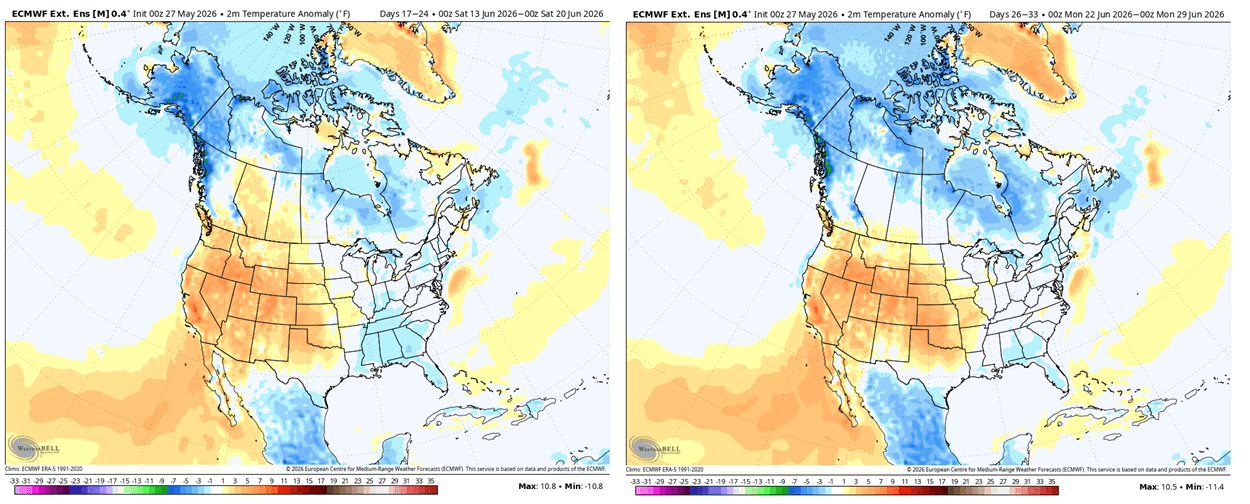
An area of above-normal temperatures is forecast over the western and central United States, which in practice means a faster start to summer heatwaves, likely coupled with below-normal precipitation.
And if we look at the rainfall forecast for mid-to-late month, we can start to see indications of a normal-to-below-normal rainfall trend across the central and western United States. But the above-normal rainfall trend is shown under the Pacific jet in the southern states and over the Midwest.
Overall, combining the latest forecast data and historical analysis, we can safely say that the 2026 El Niño is set to take over the whole Summer atmosphere.
The 2026 Summer Pattern: Latest Atmospheric Trends for North America
Below is the analysis of the Summer pressure anomaly during the start of the Super El Niño. This data shows the typical low-pressure area signal around the eastern United States or eastern Canada, along the west coast of Europe, and in the North Atlantic. A high-pressure area sits over the northwestern U.S. and western Canada, as well as north-central Europe.
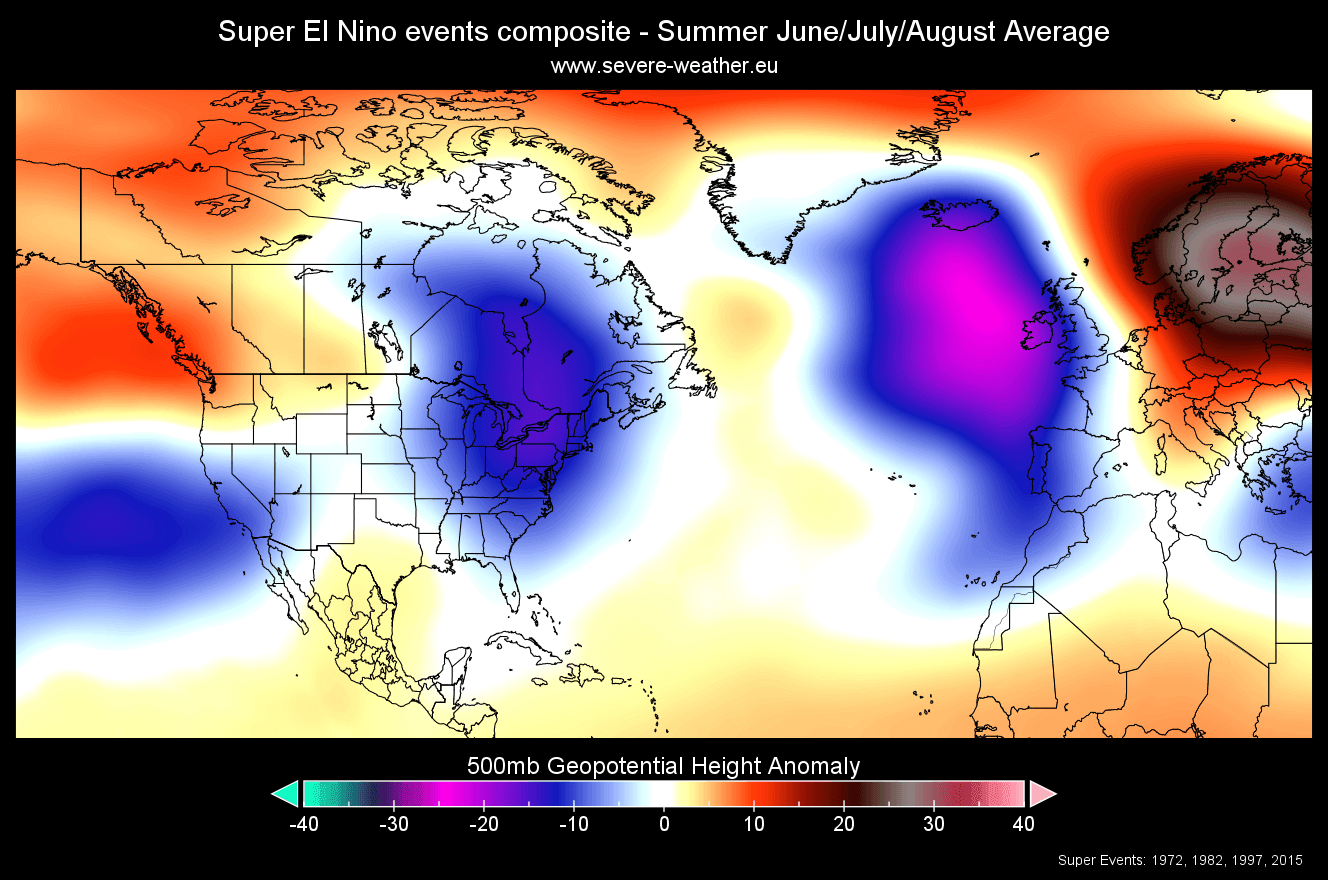
This reveals the Summer pressure pattern during the last 4 Super El Niño events, which we can compare to the latest Summer forecast data to see any similarity.
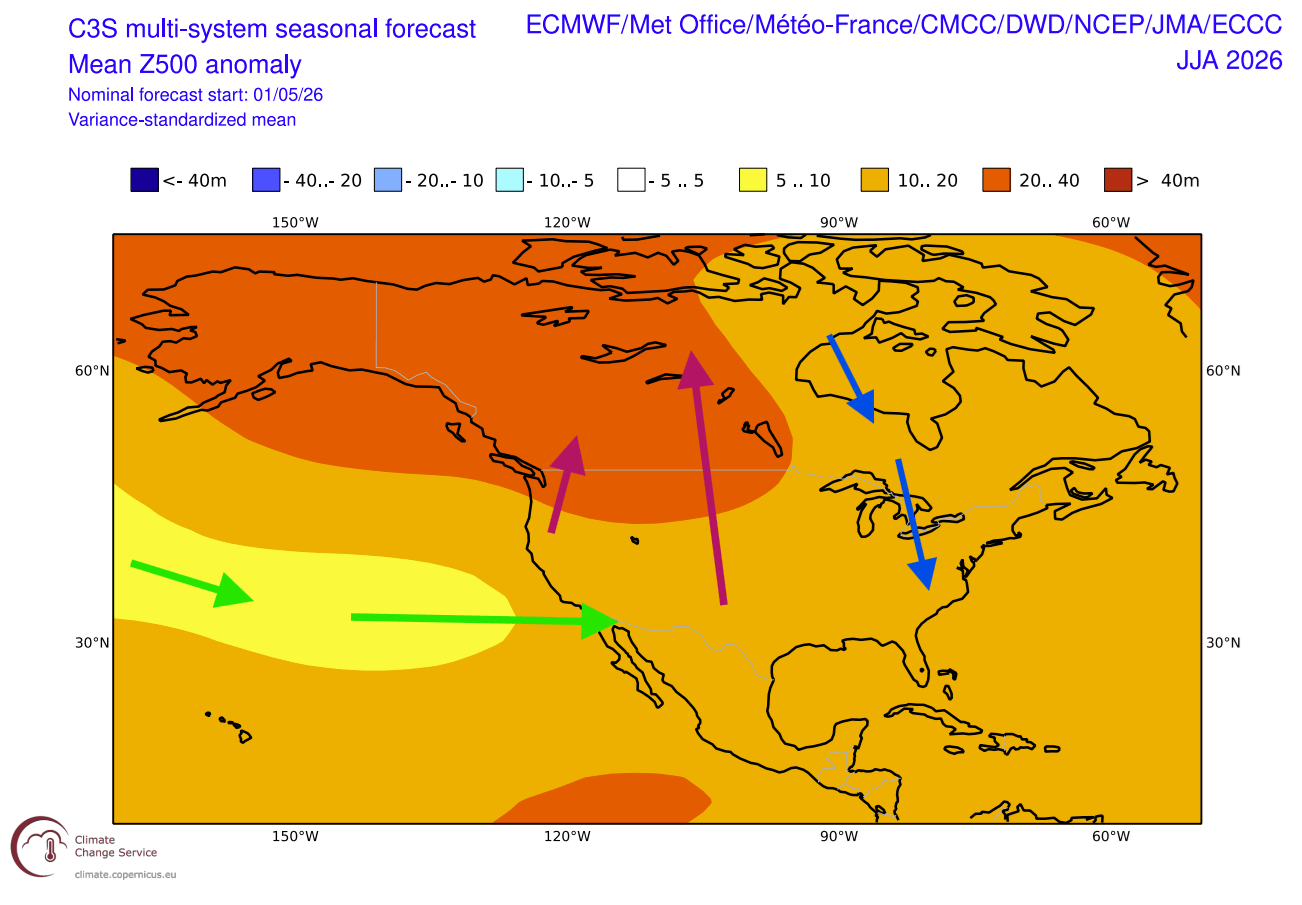
And as expected, the forecast shows an incredibly similar pattern across North America, which is more directly influenced by El Niño. You can see the same high-pressure anomaly over the northwestern U.S. and western Canada, a tendency for lower pressure over the east, and an extended Pacific jet stream.
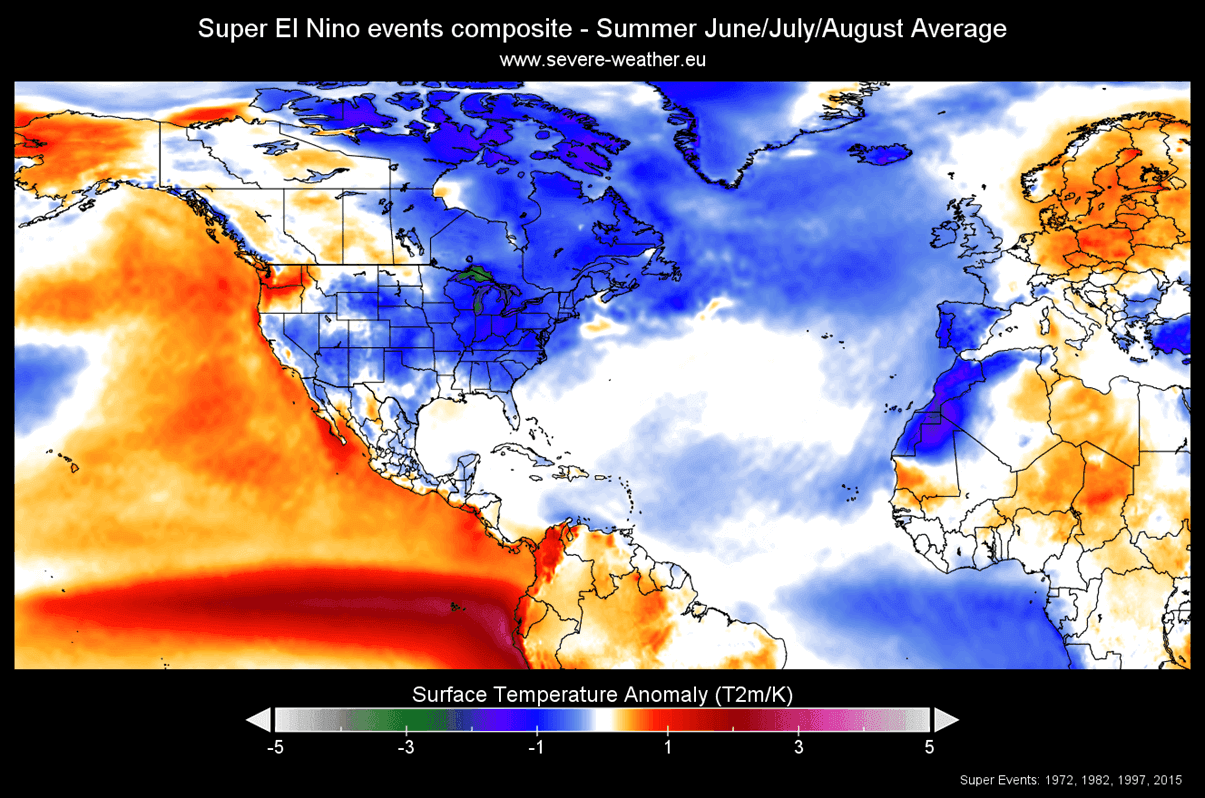
The past temperature analysis for the whole Summer shows the same climatology issue as we mentioned above, as the past decades make the data look colder. But the main trend remains, with below-normal temperatures over the northern, central, and eastern U.S. and eastern Canada. Warmer temperatures are found over the Pacific Northwest and over a large part of central and northern Europe.
We can see this pattern reflected in the latest Summer forecast: a low-pressure area over the eastern U.S. or eastern Canada supports a more northerly flow, bringing normal summer temperatures across eastern Canada, the Midwest, the northeastern United States, and the East Coast. Above-normal temperatures are forecast for the central and western U.S. and western Canada.
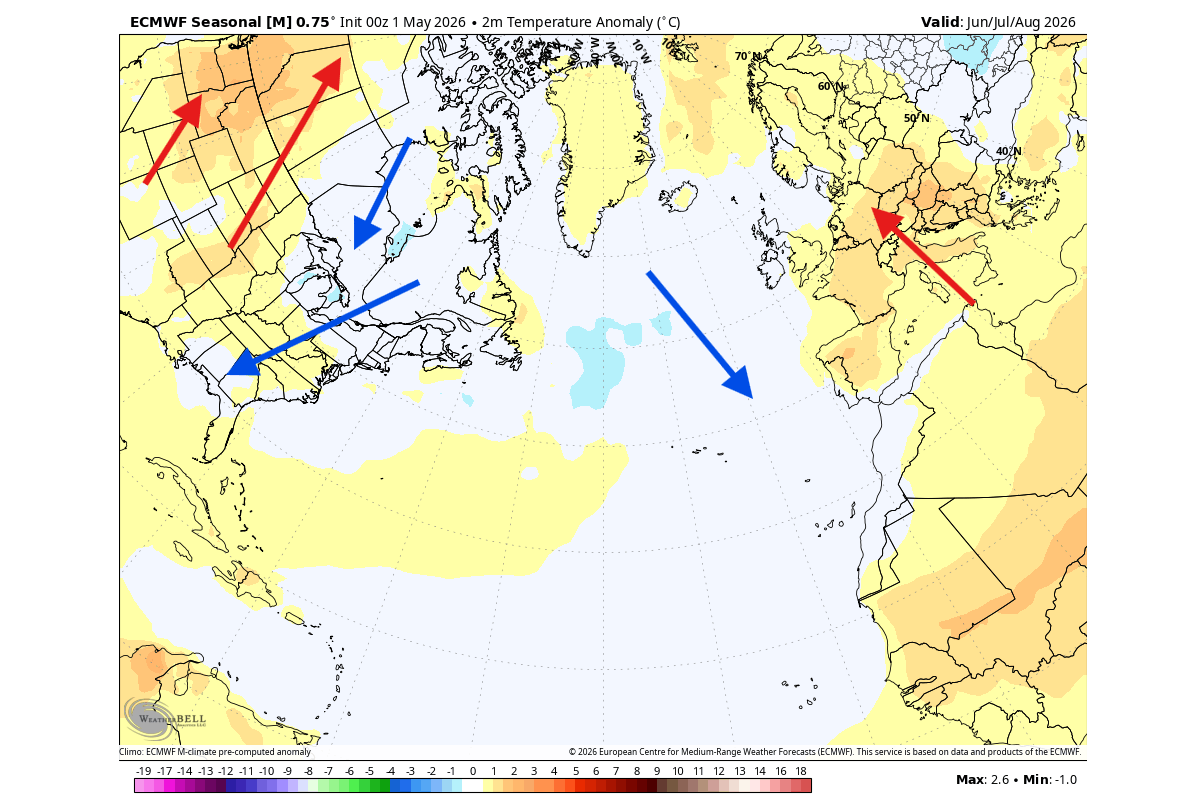
This shows a clear confirmation that the forecast (expected) Summer pattern shows a very similar atmospheric signature to past Super El Niño events. And when the past and present align, we usually have a sign for a significant event in the works.
Forecast and analysis images in this article are from cyclonicwx.com, tropicaltidbits.com, Copernicus EU, and WeatherBell, using a commercial license.
We will keep you updated on global weather development and long-range outlooks, so bookmark our page. Also, if you have seen this article in the Google App (Discover) feed, click the like button to see more of our forecasts and our latest articles on weather and nature in general.
Don’t miss:
Latest Data Shows a Significant El Niño Impact on the 2026 Hurricane Season and U.S. Landfalls