The Accumulated Cyclone Energy (ACE index) is a metric used to express the energy a tropical cyclone uses during its lifetime. The calculation multiplies a tropical cyclone’s maximum sustained winds every six hours to generate the values.
The total sum of these values is calculated to get the total for a storm. It can be divided by 10,000 to make them more manageable or added to other totals to work out a total for a particular group of storms.
How is the ACE index calculated?
The calculation was created by William Gray and his associates at Colorado State University (CSU) as the Hurricane Destruction Potential Index. It multiplied each hurricane’s maximum sustained winds above 65 knots (120 km/h = 75 mph) by itself every six hours.
The NOAA subsequently tweaked the ACE index in 2000 to include all tropical cyclones with winds above 35 knots (65 km/h = 40 mph) and renamed it Accumulated Cyclone Energy (ACE).
NOAA uses the ACE index, combined with the number of named storms, hurricanes, and major hurricanes, to categorize North Atlantic hurricane seasons as above, near, or below normal. Within the Atlantic Ocean, NOAA classifies hurricane seasons into four categories.
- Extremely active – ACE above 152.5
- Above-average – ACE above 111
- Near-average – ACE between 66 and 111
- Below-normal – ACE below 66
And it doesn’t need to have very powerful hurricanes to get into the ‘extremely active’ category. An above-average seasonal ACE index can come even if the season has more named storms than average. Or indeed by having an average number of storms, but several of them being stronger and long-duration hurricanes.
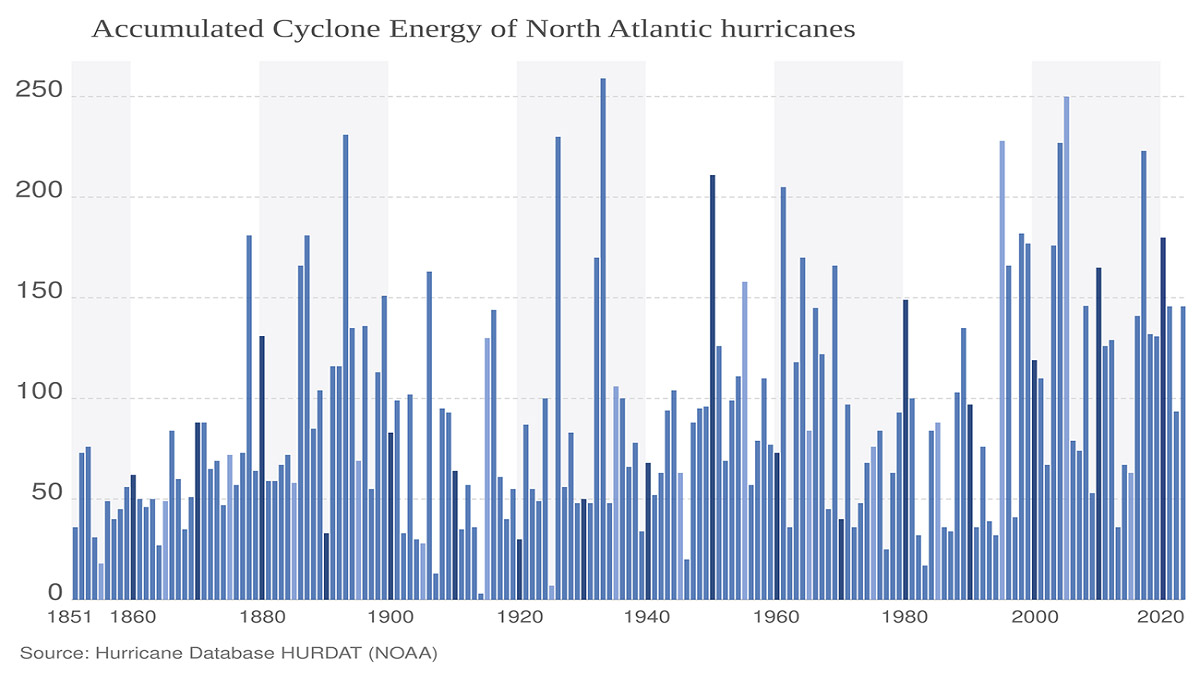
ACE index in the North Atlantic Basin
For example, the 2020 Atlantic hurricane season ended at 185.8 ACE, well above the ‘extremely active’ category threshold. Based on the Accumulated Cyclone Energy index, this placed 2020 into the Top-10 Atlantic hurricane seasons.
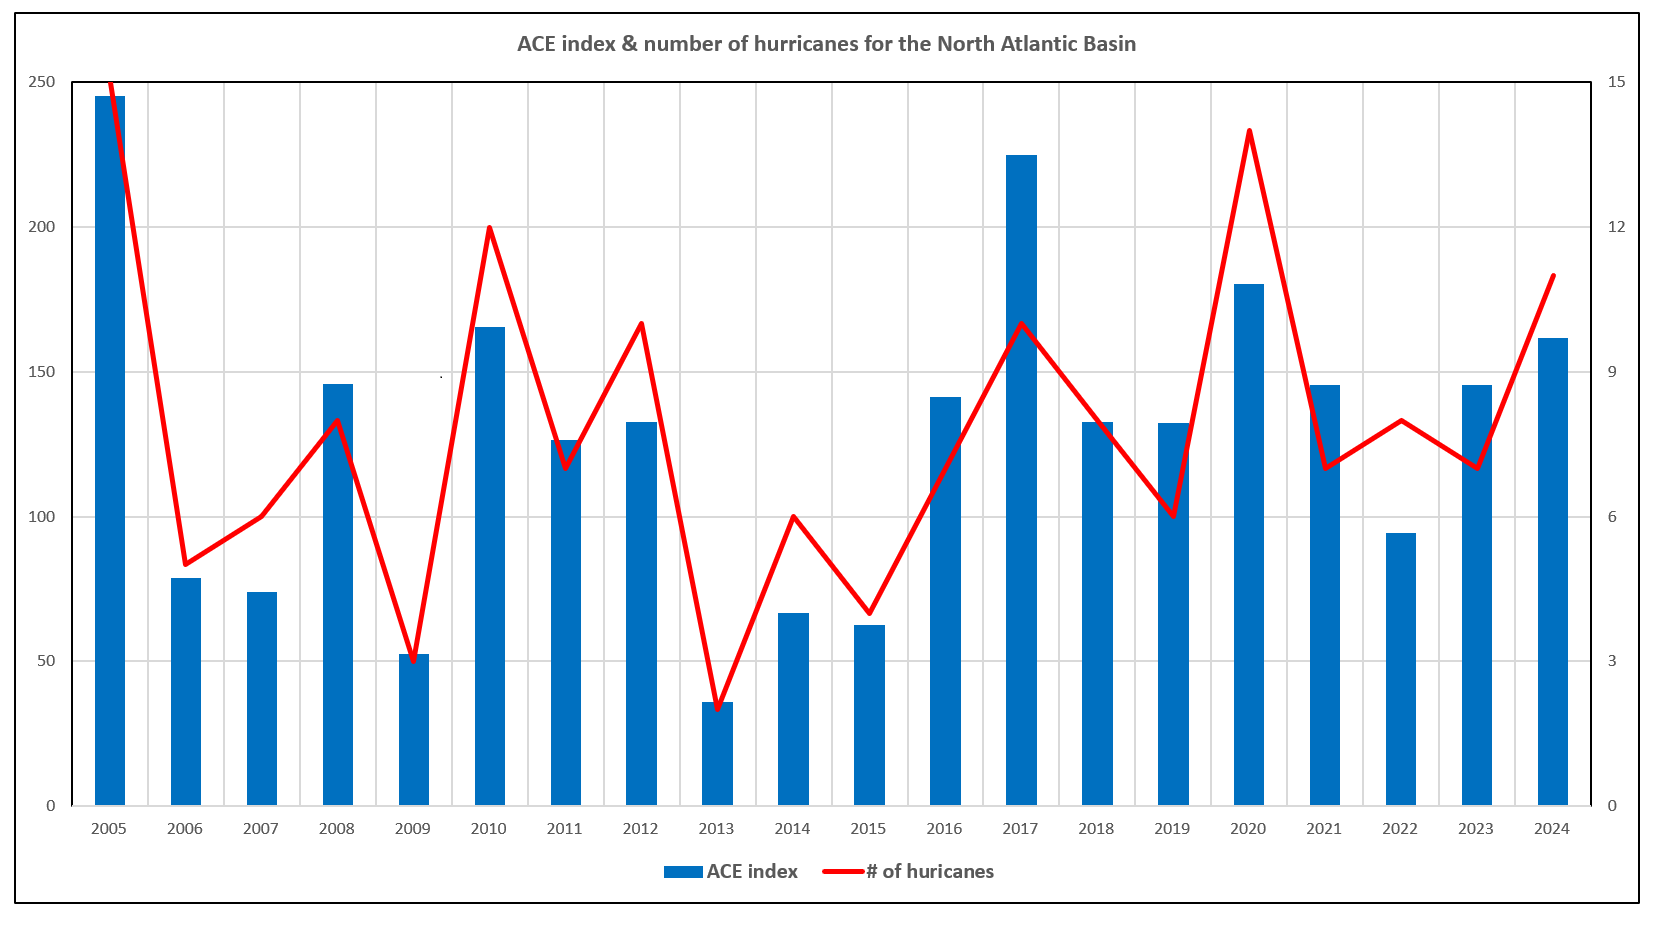
Below are the recent 15 hurricane season ACE records and the related number of hurricanes in that particular year.
The record-holder hurricane season is still 1933, with an ACE of over 258. The 2005 hurricane season, with the second-most named storms after 2020, also ended up extremely high—ACE of 250.
The highest ever ACE index estimated for a single storm in the Atlantic basin is a remarkable 73.6 for the San Ciriaco hurricane in 1899. Such a high number of ACE was likely generated as the hurricane had been a Category 4 strength for a long time. This storm was maintaining such intensity for four weeks.
As we can see above, although the 2020 hurricane season was so active and had a record-breaking number of tropical cyclone formations and hurricanes, it doesn’t necessarily mean the Accumulated Cyclone Energy would also be off the charts. The closest hurricane season fitting into an ‘extremely active’ category in recent years was 2017.
The highest-ever ACE index calculated for a single storm in the North Atlantic Basin was Hurricane Ivan in 2004, with a generated ACE of 70.4. The subsequent two closest North Atlantic tropical storms were Hurricane Irma in 2017, with an ACE of 64.9, and Hurricane Isabel in 2003, with an ACE of 63.3.

Many of those well-above-average years happened during the La Nina years. Looking back over the last twenty years, 2020, 2017, 2010, 2008, 2005, etc., were all during La Nina or Neutral ENSO years.
Note: ENSO is the abbreviation for El Niño–Southern Oscillation. A periodic variation in winds and sea surface temperatures over the tropical eastern Pacific Ocean affects the climate of many tropical and subtropical regions worldwide.
The ACE index is one of the most comprehensive data compared to a tropical cyclone season (hurricane or typhoon) with a previous season.
ACE in the Eastern/Central Pacific Basin
A bit different from the Atlantic basin, the Eastern Pacific Ocean uses the ACE index of a hurricane season to classify the season into three categories. These three categories are above-normal, near-normal, and below-normal. They are worked out using an approximate tercile partitioning of seasons based on the ACE index, with the number of tropical storms, hurricanes, and major hurricanes over 30 years.
- Above-normal – ACE index above 115
- Near-normal – ACE index between 80 and 115
- Below-normal – ACE index below 80
The record holder for the Eastern Pacific Ocean hurricane season is 2018, with an ACE of an astonishing 318. The second-highest ACE of 295 was recorded in 1992, while the 3rd place is held by the 2015 Eastern/Central Pacific season, with an ACE of 287. See the chart below with the highest ACE index recorded in the last 15 years (between 2008 and 2023).
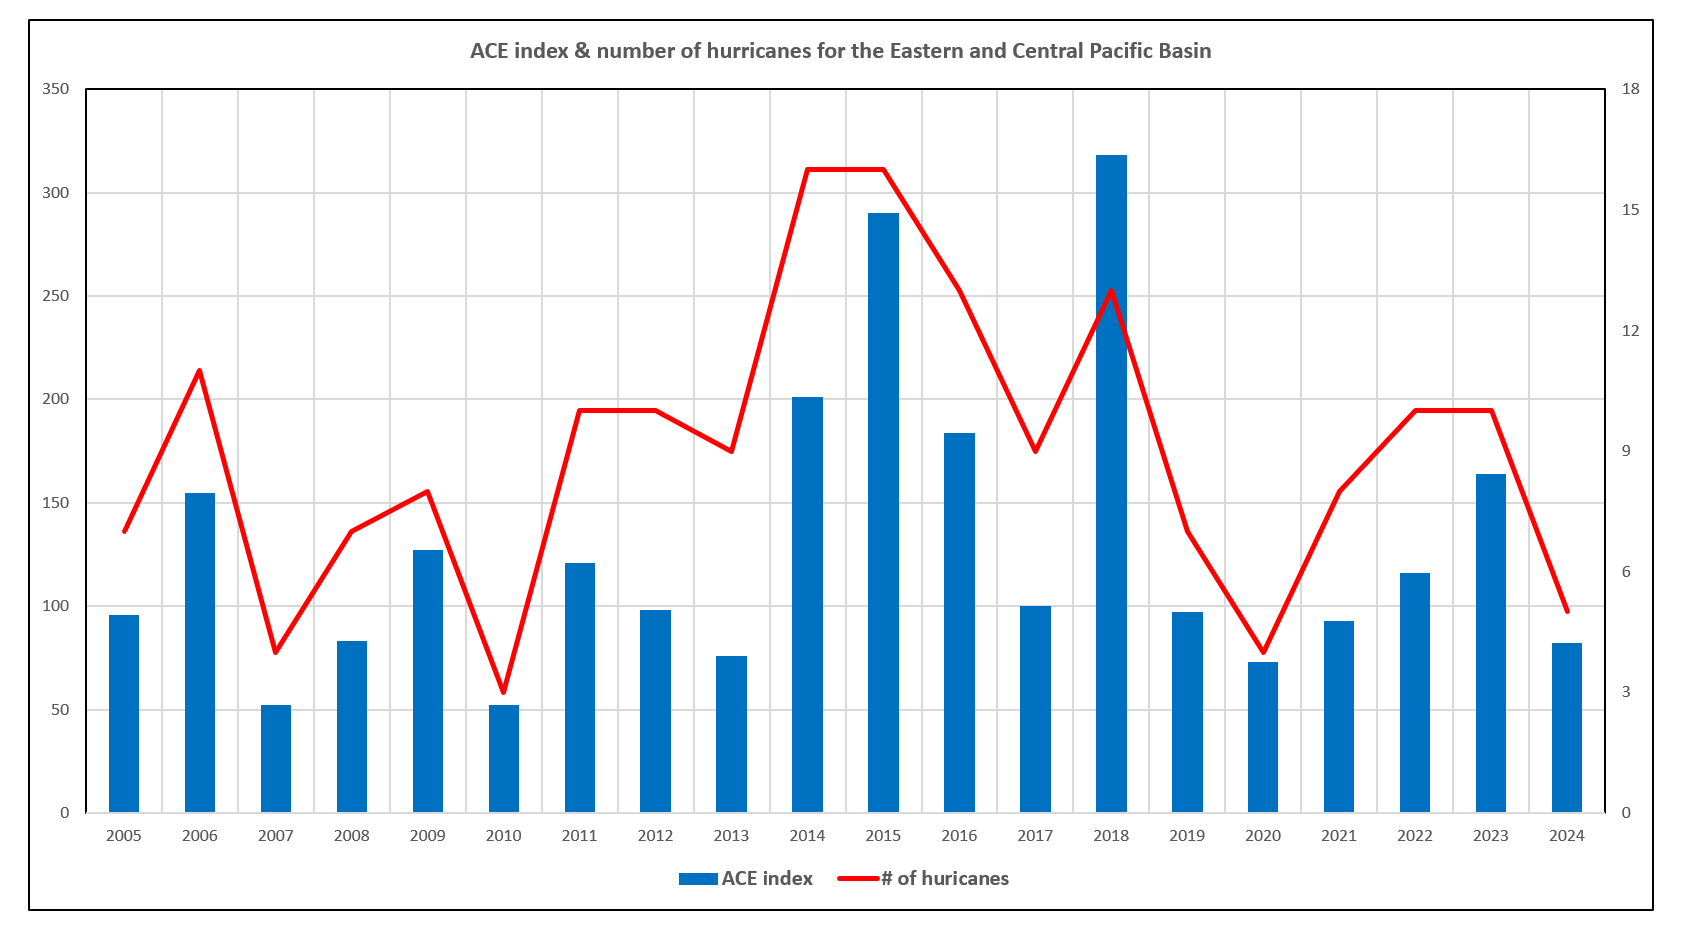
The average ACE index (as of the period between 1981 and 2010) is 113.3.
The highest-ever ACE estimated for a single storm in the Eastern or Central Pacific was Hurricane Fico in 1978, which generated an ACE of 62.8. The subsequent two closest Eastern Pacific tropical storms were Hurricane John in 1994, with an ACE of 54.0, and Hurricane Kevin in 1991, with an ACE of 52.1.
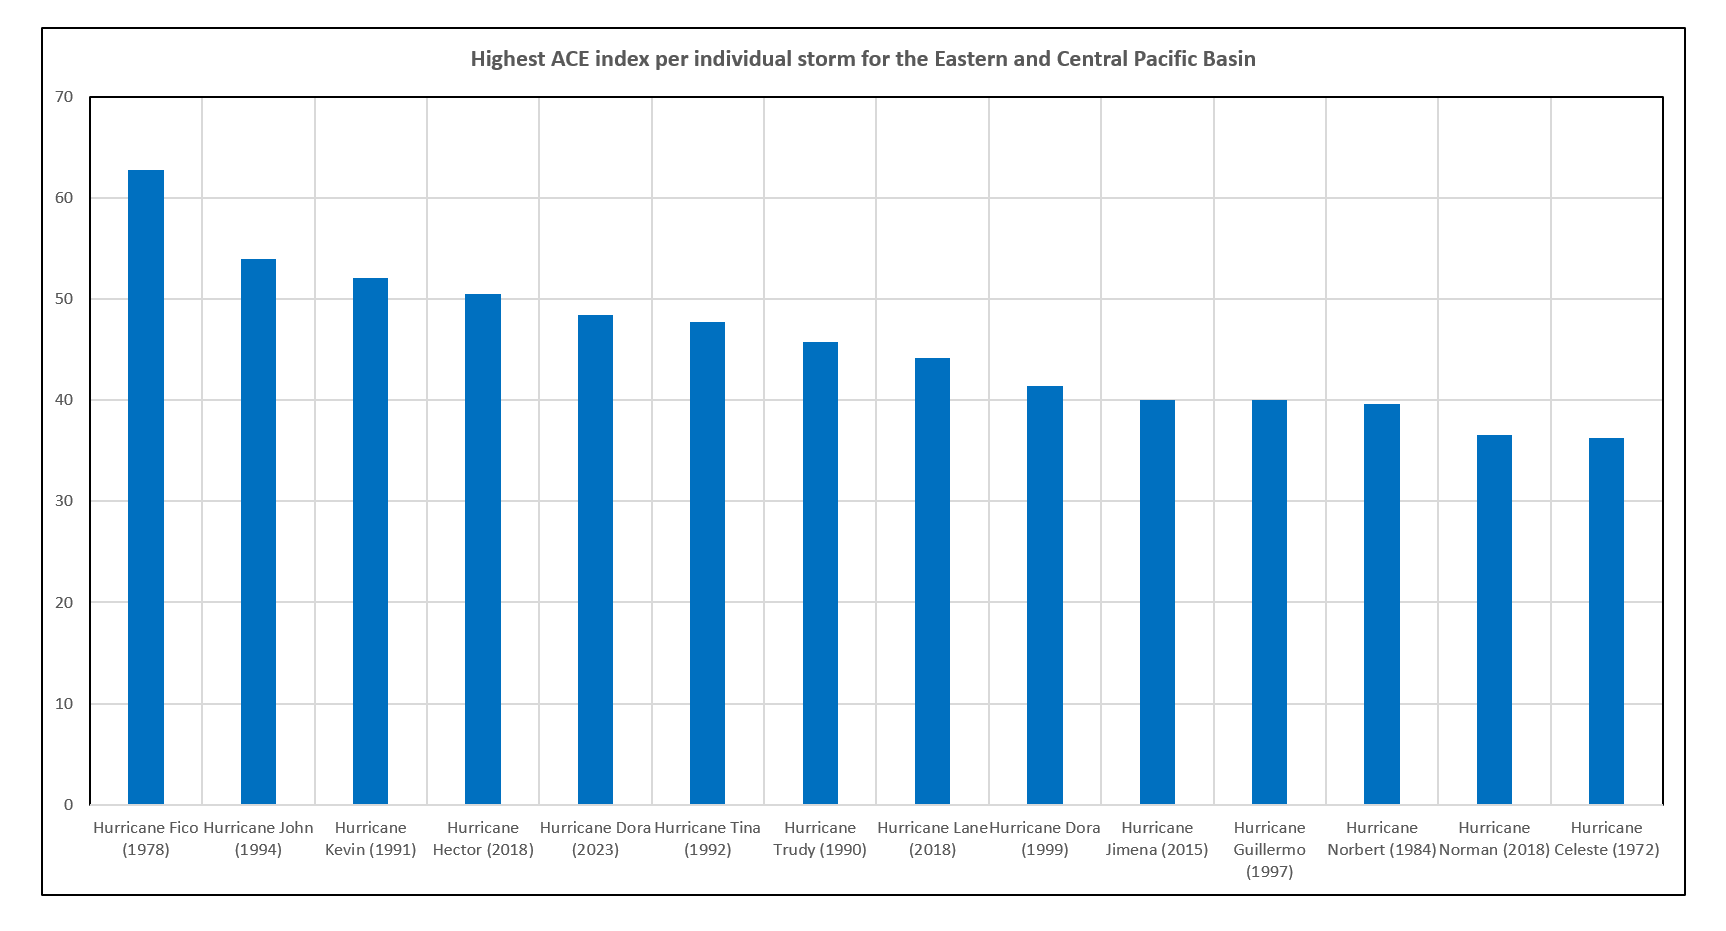
The storm names marked with a symbol * indicate that the storm formed in the Eastern/Central Pacific but crossed 180 ° West at least once. Therefore, only the ACE and number of days spent in the Eastern/Central Pacific are included.
ACE in the Western Pacific Basin
The Western Pacific Basin is by far the most active tropical region in the world, where more tropical cyclones occur and are also more intense. Thus, ACE values are much higher than those of the other two central tropical regions, the North Atlantic Basin and the East-Central Pacific Basin.
- Above-normal – ACE index above 328
- Near-normal – ACE index between 259 and 328
- Below-normal – ACE index below 259
The record holder for the Western Pacific Ocean typhoon season is 1997, with an ACE of an astonishing 570.4. The second-highest ACE of 480.6 was recorded in 2004, while the 3rd place is held by the 1992 Western Pacific season, with an ACE of 470.1. See the chart below with the highest ACE index recorded in the last 15 years (between 2008 and 2023).

The average ACE index (as of the period between 1991 and 2010) is 301.
The most intense cyclones in the Western Pacific Basin are known as Super Typhoons. The strongest and the most intense typhoon ever recorded was Typhoon Top in 1979, followed by Typhoon Doksuri in 2023, the costliest typhoon on record (estimated damage of USD 28.5 billion).
Other notable violent typhoons were Rita in July 1972, Haiyan in November 2013, Meranti in September 2016, Typhoon Goni in November 2020, and Super Typhoon Surigae in April 2021.
You can follow the live ACE index for all the tropical regions around the world here: Historical tropical cyclone data (by CSU).
More tropical activity content will be available here: Tropical Weather Theory.