Stratosphere/Polar Vortex Update July 7th, 2026: Polar Vortex Warning Signs Emerge for Winter 2026/2027 as Super El Niño Builds
Latest data shows an atmospheric transition in the tropical stratosphere, expected to align with the upcoming El Niño towards Fall and Winter 2026/2027. Real-time observations confirm a rapidly intensifying El Niño in the tropical Pacific, and at the same time, a major wind reversal is now descending through the stratosphere.
Together with the Polar Vortex, these systems establish a powerful “global trinity” that together controls the seasonal jet stream of the Northern Hemisphere. These 3 main global drivers combine to directly influence the strength of the global jet stream and the paths of weather systems, essentially deciding who will get the core winter cold and snow, even before the season starts.
In this article, we will look at the latest data to see how this new wind shift is developing alongside a trending Super El Niño. By looking back at similar years and also at the latest long-range predictions, we will break down exactly what this unique setup means for temperatures, weather patterns, and snowfall across the United States, Canada, and Europe in the upcoming 2026/2027 cold weather season.
Stratospheric Dynamics: Tracking the New Westerly Wind Shift and the Atmospheric Heartbeat
Just like the ENSO region, there is also a part of the atmosphere that alternates between a positive and a negative phase. But instead of temperatures, we are observing wind direction. This is called the Quasi-Biennial Oscillation, or simply QBO.
The QBO is a regular variation of the winds high above, in the tropical Stratosphere, shifting between easterly (QBO East) and westerly (QBO West) winds. Strong winds in the stratosphere travel in a belt around the planet at the equator. And every 17 months or so, these winds completely change direction.
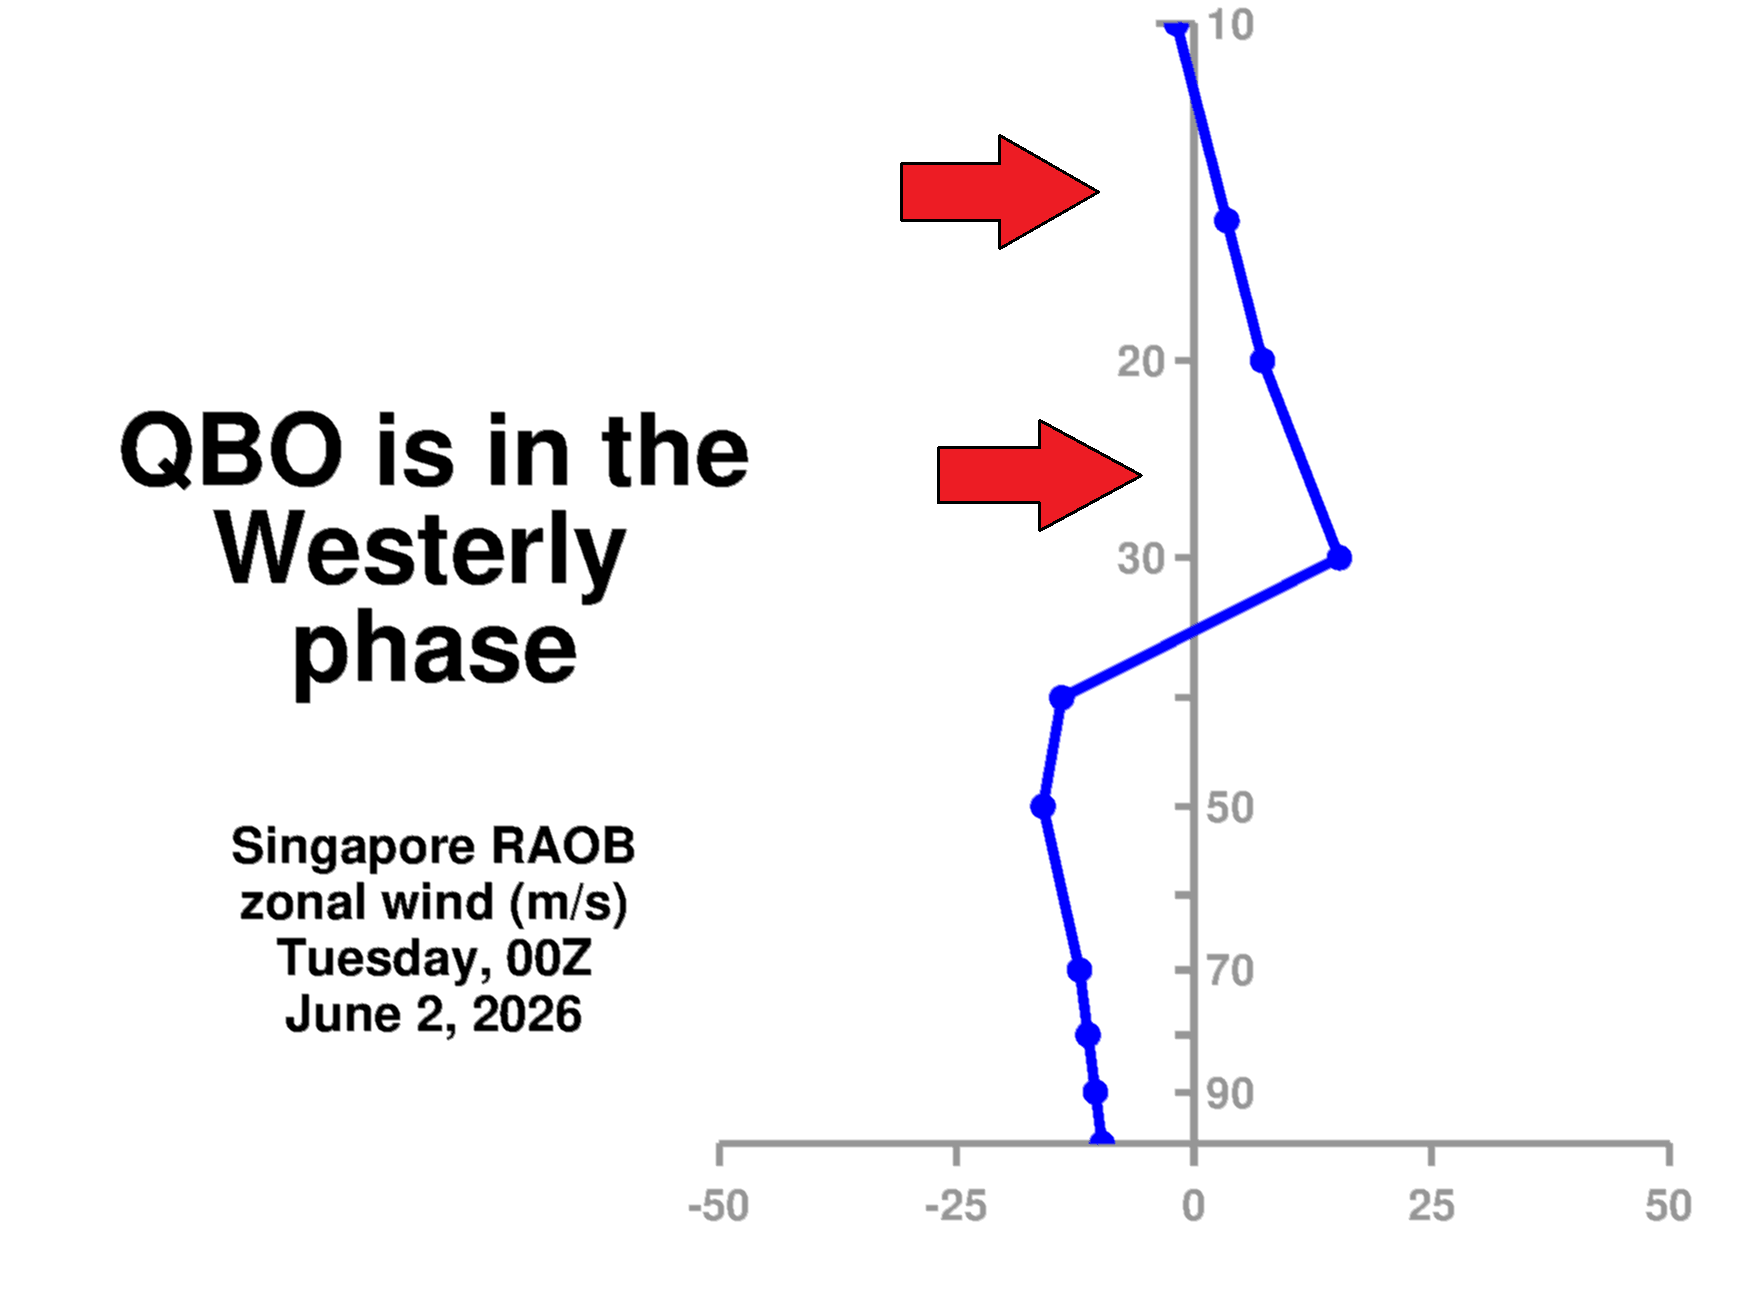
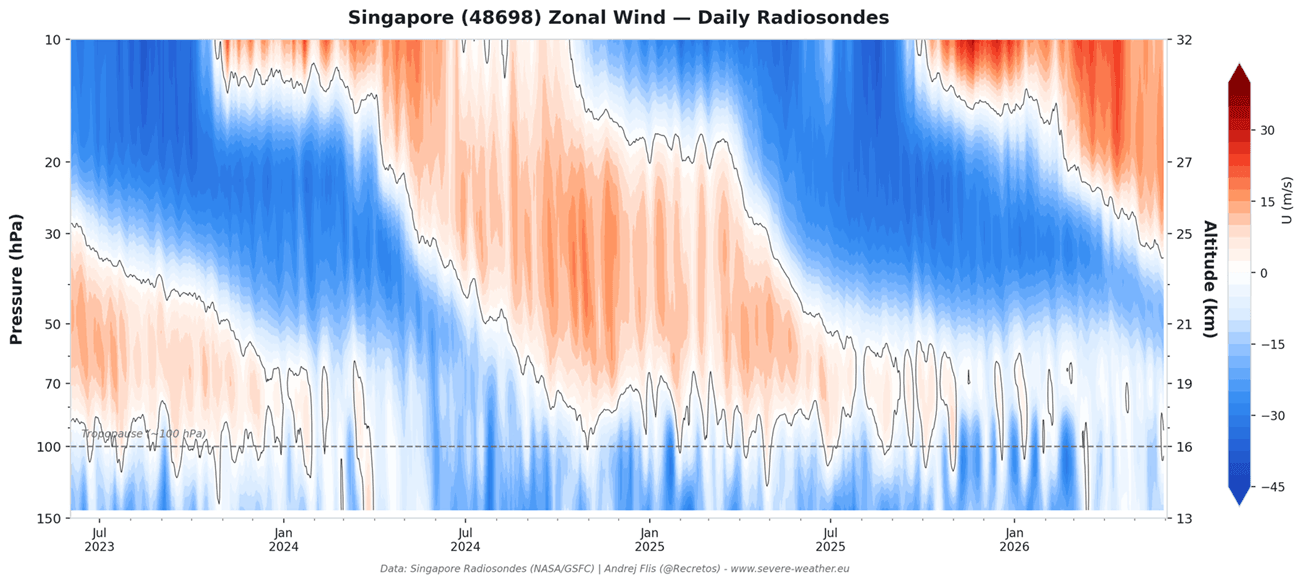
Below is the daily NASA radiosonde analysis from Singapore, which shows the wind direction directly above the tropics. The latest data reveals westerly winds around the 15-30mb level, confirming the west QBO phase is currently starting and descending. It will continue to strengthen and stabilize around the 30-50mb level (21-24km or 13-15miles) as it descends towards winter.
Below is a graph we made showing zonal wind anomalies over the tropics for the past 30 years at around 24km (15mi) altitude. It nicely shows just how regularly this wind shift really is from one phase to another. It is like watching the very pulse of the atmosphere, which is an often-used analogy for the QBO due to how regular it is, calling it the heartbeat of the atmosphere.
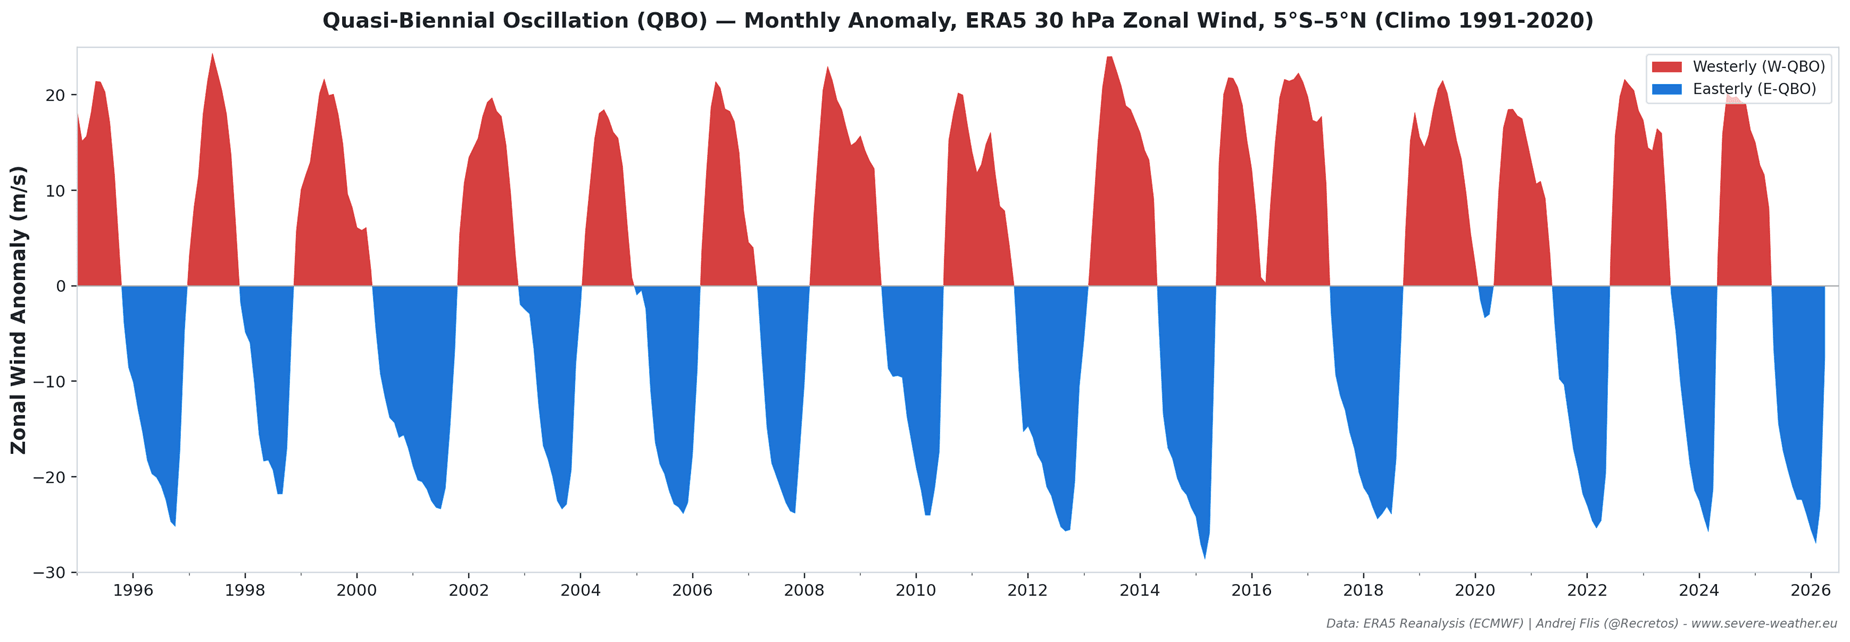
The wind reversal of the QBO happens because of how the tropical atmospheric waves interact with the stratosphere above. You could say that the QBO is a self-regulating system, but each phase interacts back downward with the whole global weather system.
Below is an image showing the zonal (west-to-east) wind direction in the tropical stratosphere over the past 20 years. Blue colors represent easterly winds and red colors show westerly winds. This nicely shows just how the winds are slowly descending through the tropical stratosphere, with the latest warm phase now starting to come down.
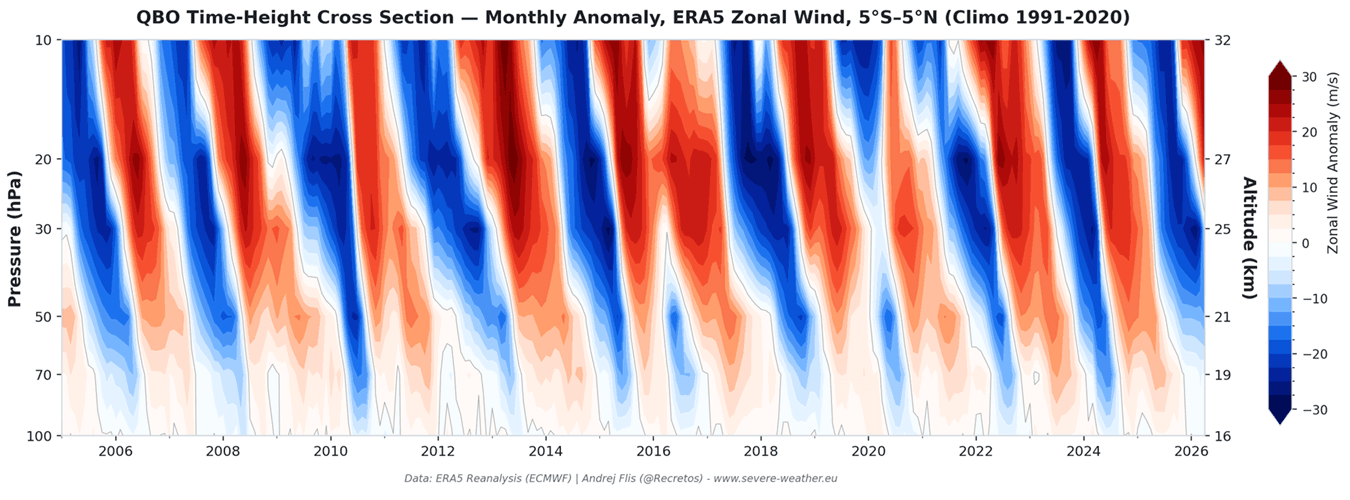
If we look more closely at the past 3 years, you can nicely see how each phase descends over time through the stratosphere. A positive/west phase was active in 2024/2025. It was followed by another negative QBO phase last winter. Currently, a new westerly phase is descending from above for Winter 2026/2027, looking stronger than the last one 2 years ago.
The timing of this development means the west QBO will be at its peak right before Winter starts, playing its global weather role alongside El Niño and the Polar Vortex.
Atmospheric Connections: QBO, El Niño, and the Winter Polar Vortex
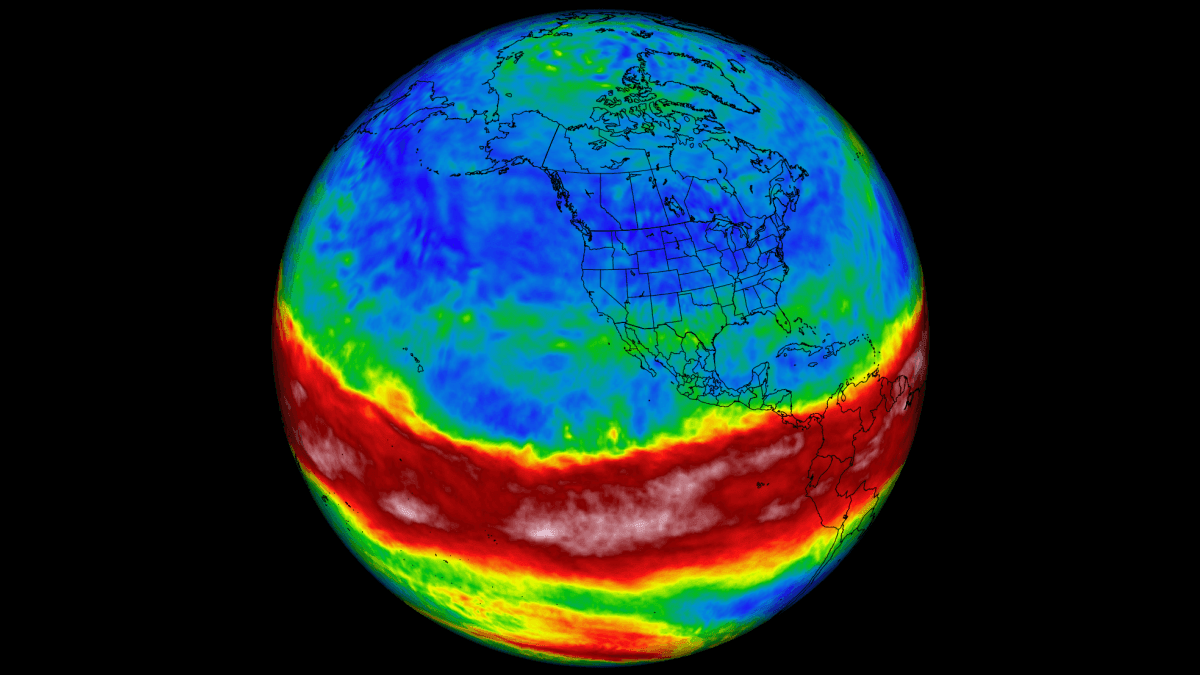
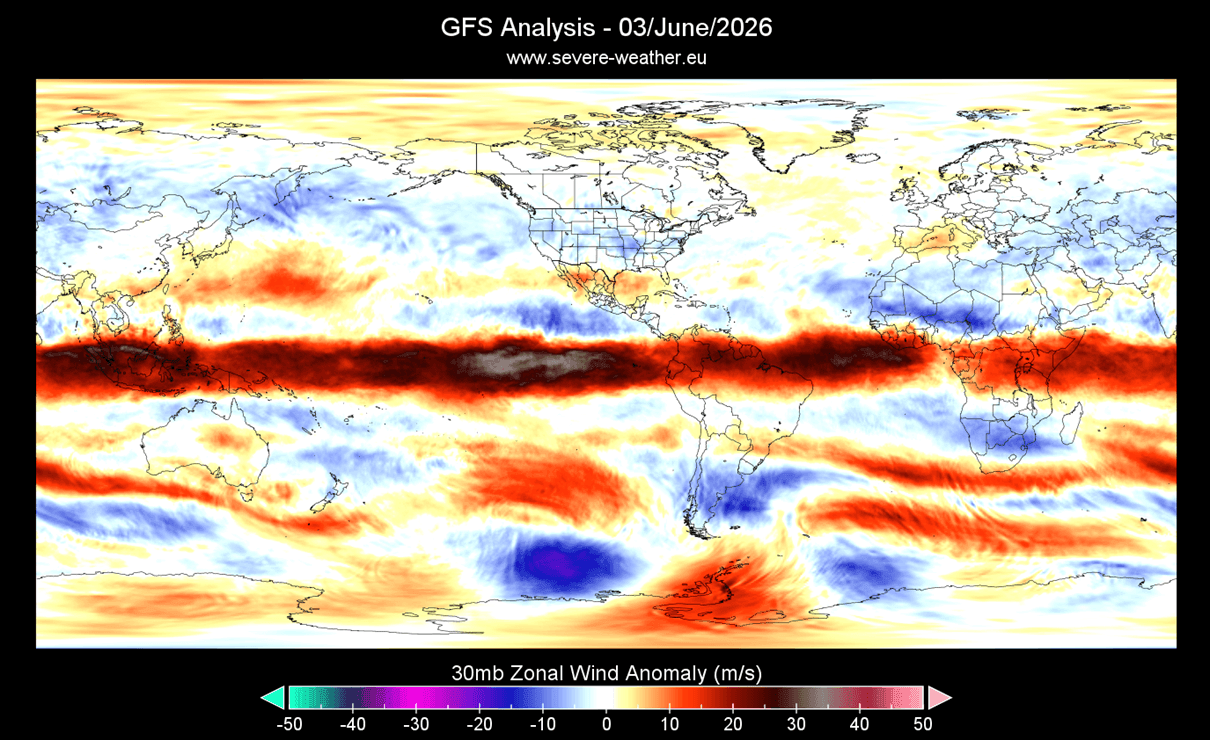
Looking at the latest global zonal wind analysis at the 30mb level (24km/15miles), we can see the westerly wind anomaly over the equator. This directly reveals and confirms the west (positive) phase of the QBO, and also shows its overall size as a wind belt over the tropics. It covers the whole tropical region, while its weather role has a global reach, extending downward and across the winter stratosphere.
Below is the ECMWF seasonal wind forecast for the tropical stratosphere. It confirms the descending West QBO phase will be active for the start of Winter 2026/2027. As usual, the descending west phase is expected to merge with the El Niño influence, creating weather impacts across the United States, Canada, and Europe.
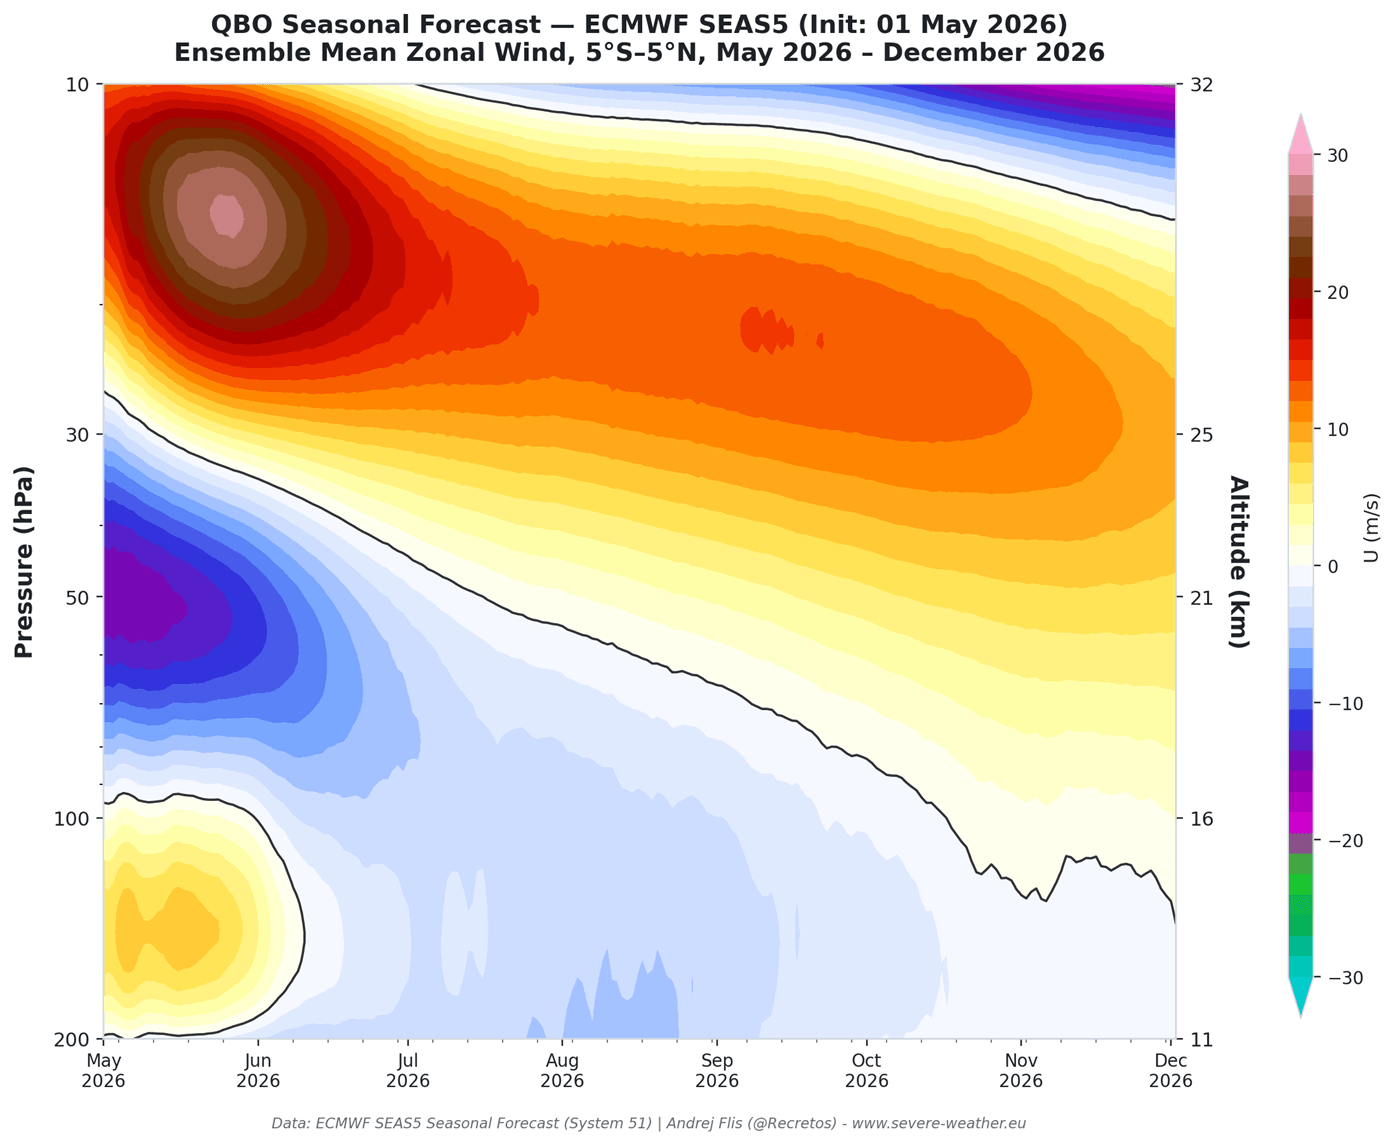
It takes time for each phase to descend through the stratosphere, but it all comes together for the late Fall and Winter season, when the impacts from El Niño also peak. Below is a simple schematic of how the El Niño and the QBO affect winter weather, and the key ingredient is, of course, the Polar Vortex.
As the image shows, the whole process begins when El Niño warms the tropical Pacific Ocean, fueling stronger weather systems that send large-scale atmospheric waves traveling upward. There, the QBO acts like a traffic controller, steering these rising waves toward or away from the pole.
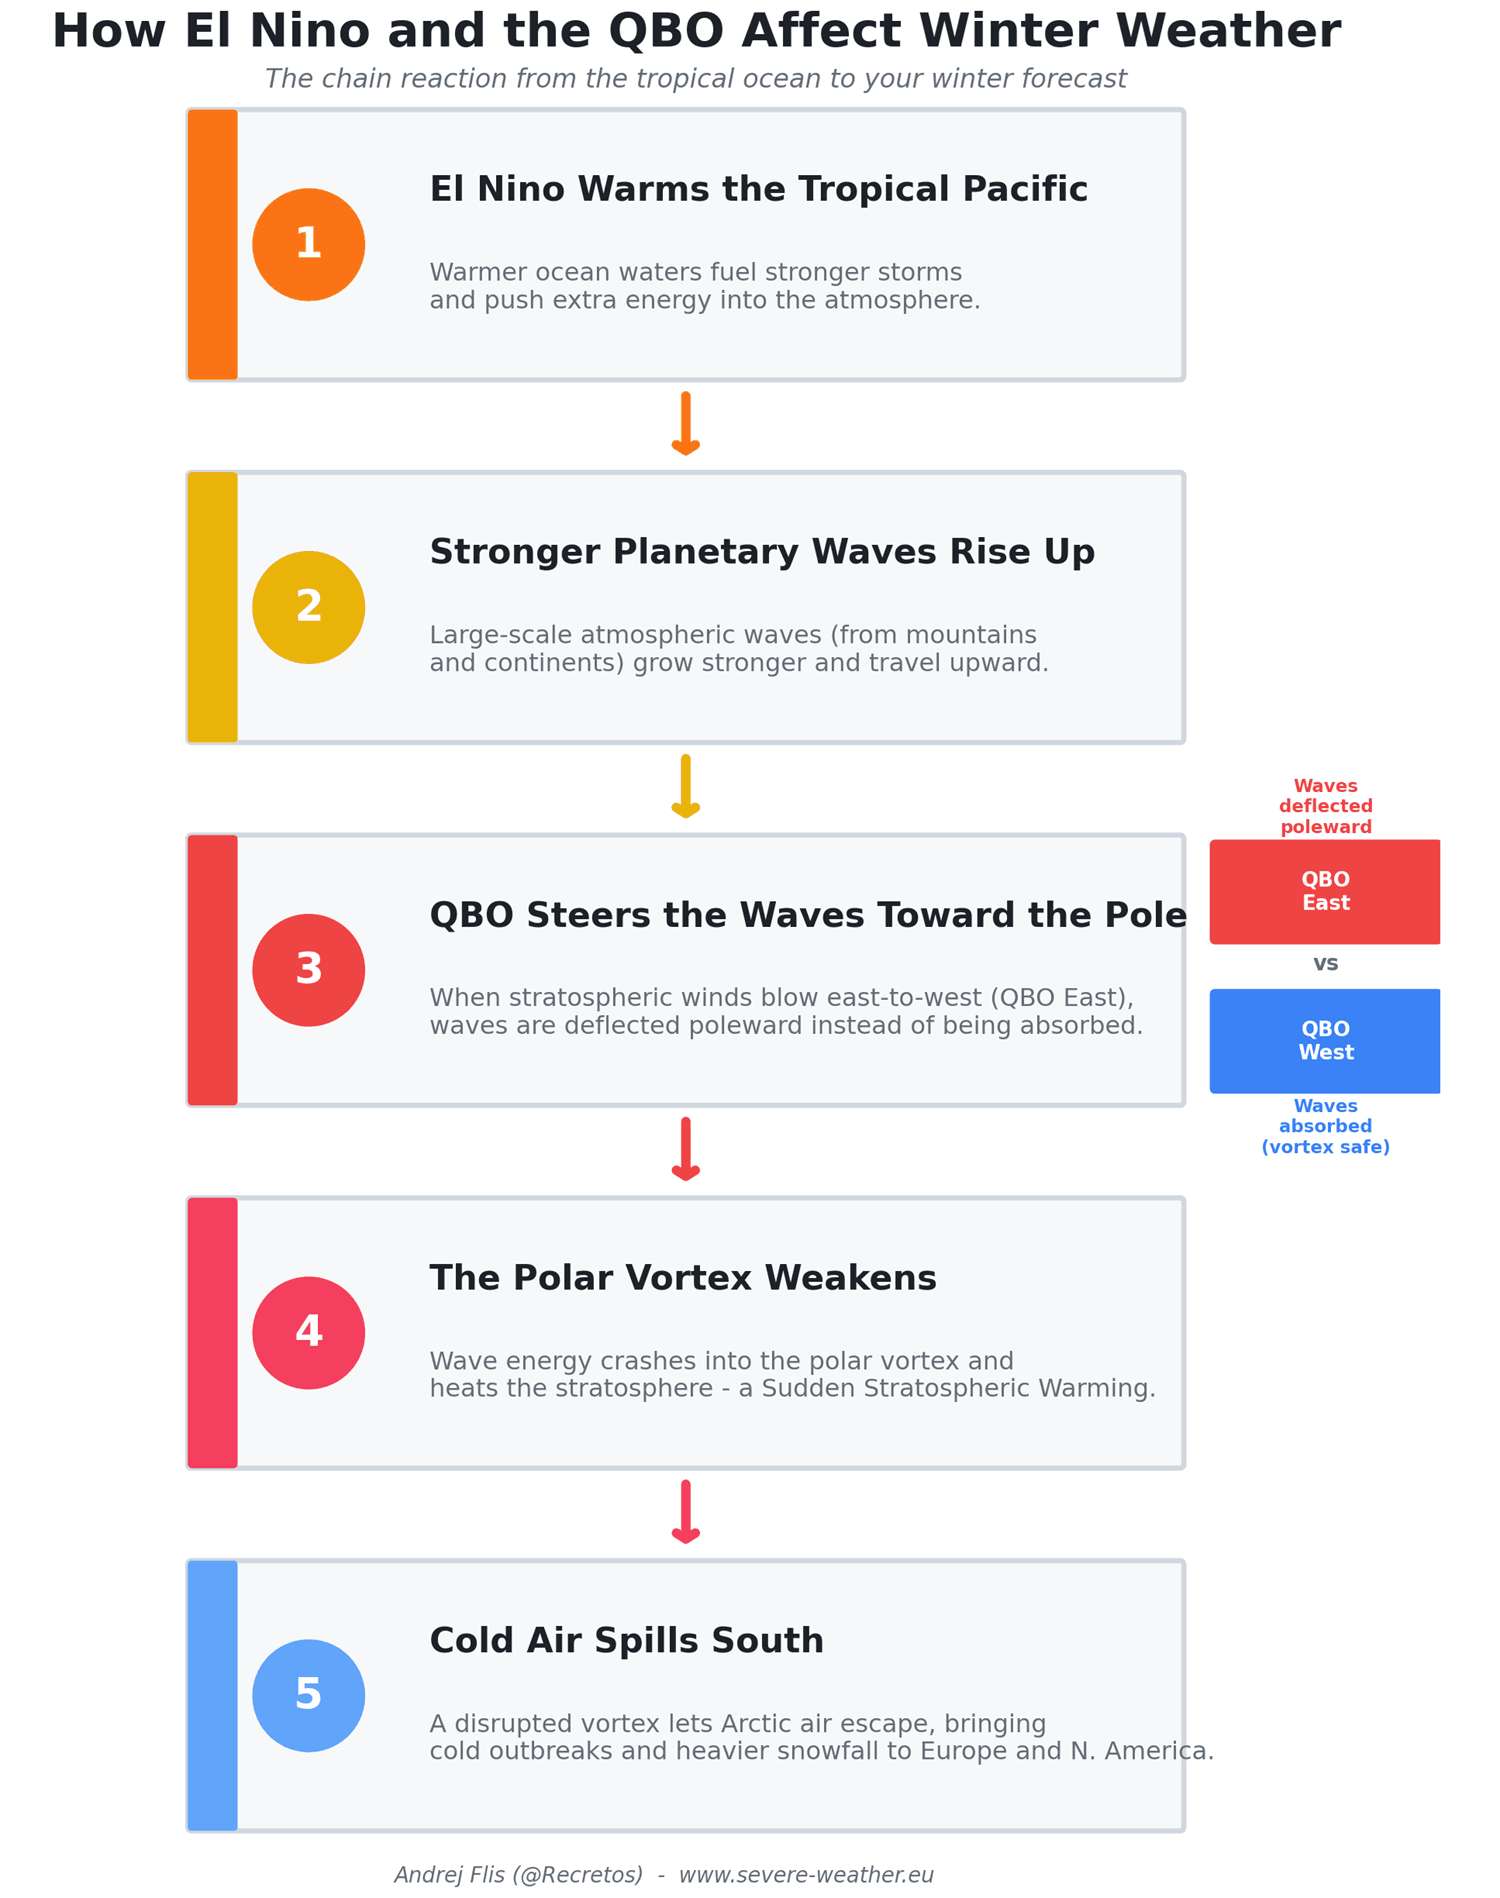
This concentrated wave energy (depending on the QBO phase) can crash into the polar vortex, weakening it and causing it to heat up rapidly. Once disrupted, the weakened polar vortex can no longer hold the cold Arctic air in place, allowing severe cold outbreaks and heavy snow to spill south into the United States, Canada, or Europe.
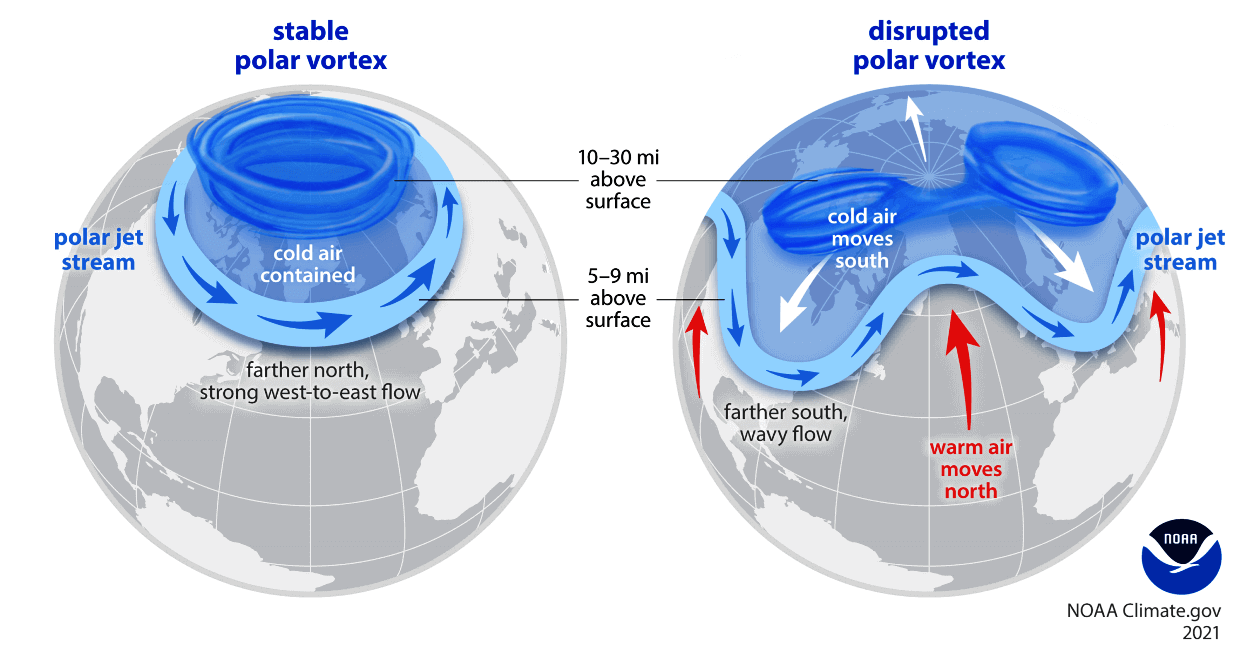
We have discussed the Polar Vortex a lot in the last winter season, but just to recap, it’s the large hemispheric circulation over the pole, spanning from the ground up into the stratosphere.
A weak Polar Vortex can create a disrupted pressure pattern and a strong weather response. As a result, it has a harder time containing the cold air, which can now more freely escape from the polar regions into the United States or other mid-latitude regions.
But we will discuss this more in depth in an upcoming article, focusing more on this part of the seasonal weather impacts for 2026/2027. Now, we will focus on the main driver for the upcoming season, a super El Niño, and how it is likely to change weather patterns, along with the West QBO, in 2026/2027.
Oceanic Monitoring: Kelvin Waves and a Historic Rise of the 2026 El Niño
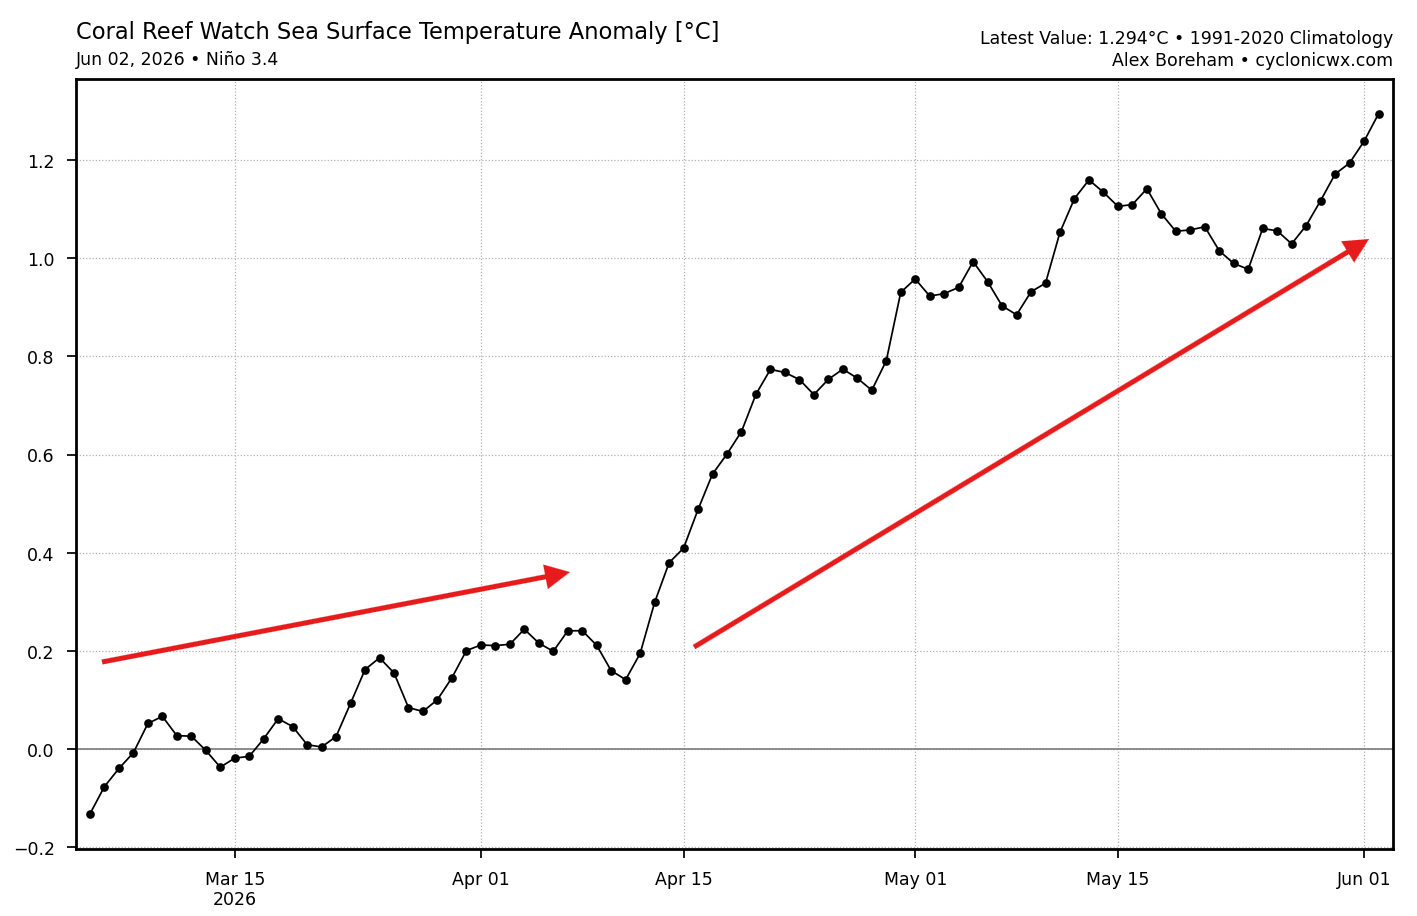
El Niño will be the main player in the seasonal weather development in 2026/2027. The analysis image below shows the rapid shift in the Pacific across the main ENSO region, which shows the anomaly data for the past 3 months. We can see a rapid rise in the temperature anomaly since March, but it really shifted into higher gear in recent weeks, rapidly passing the official threshold for an El Niño event at +0.5.
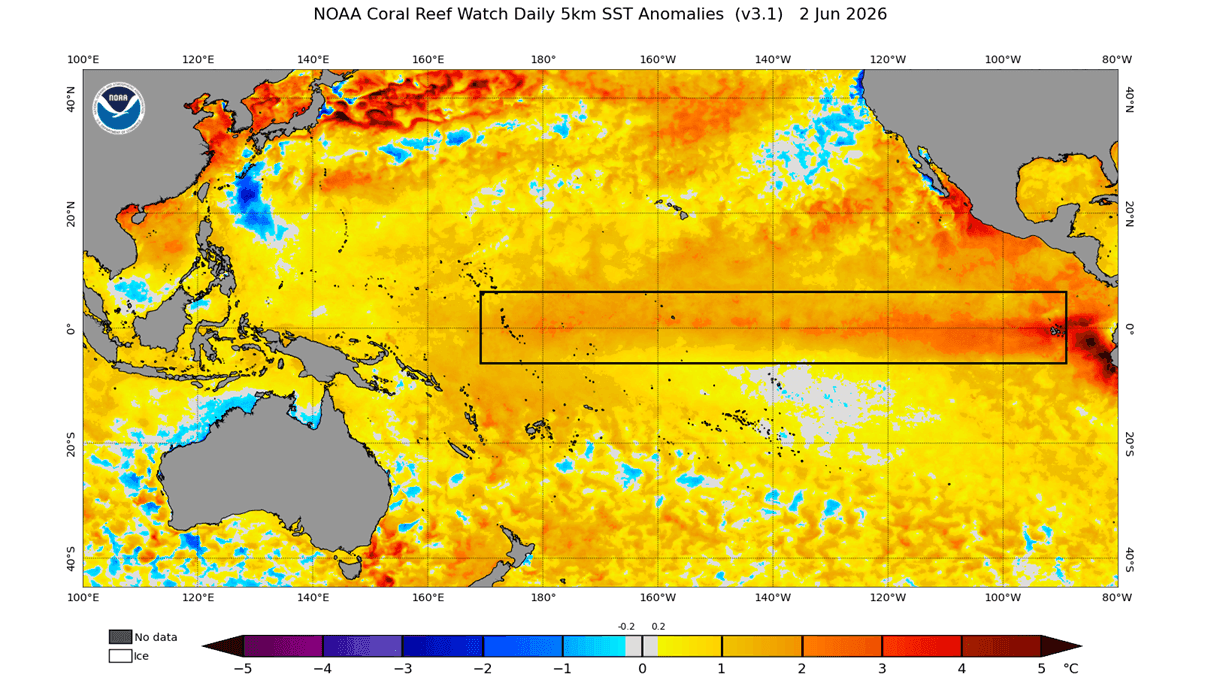
The latest ocean analysis below shows the main ENSO regions being covered in growing warm anomalies. We can see the strongest anomalies are developing in the eastern parts, which is where the subsurface Kelvin Wave is now emerging to the surface, which is the “core” of the El Niño and warm ocean anomalies.
The image below shows the latest subsurface ocean temperature anomalies across the tropical Pacific. Here we can track the subsurface Kelvin Wave, which is a massive area of warmer waters that lies at depths of 0-200m (0-650ft). It has grown stronger in recent weeks, now reaching near 8 degrees above normal.
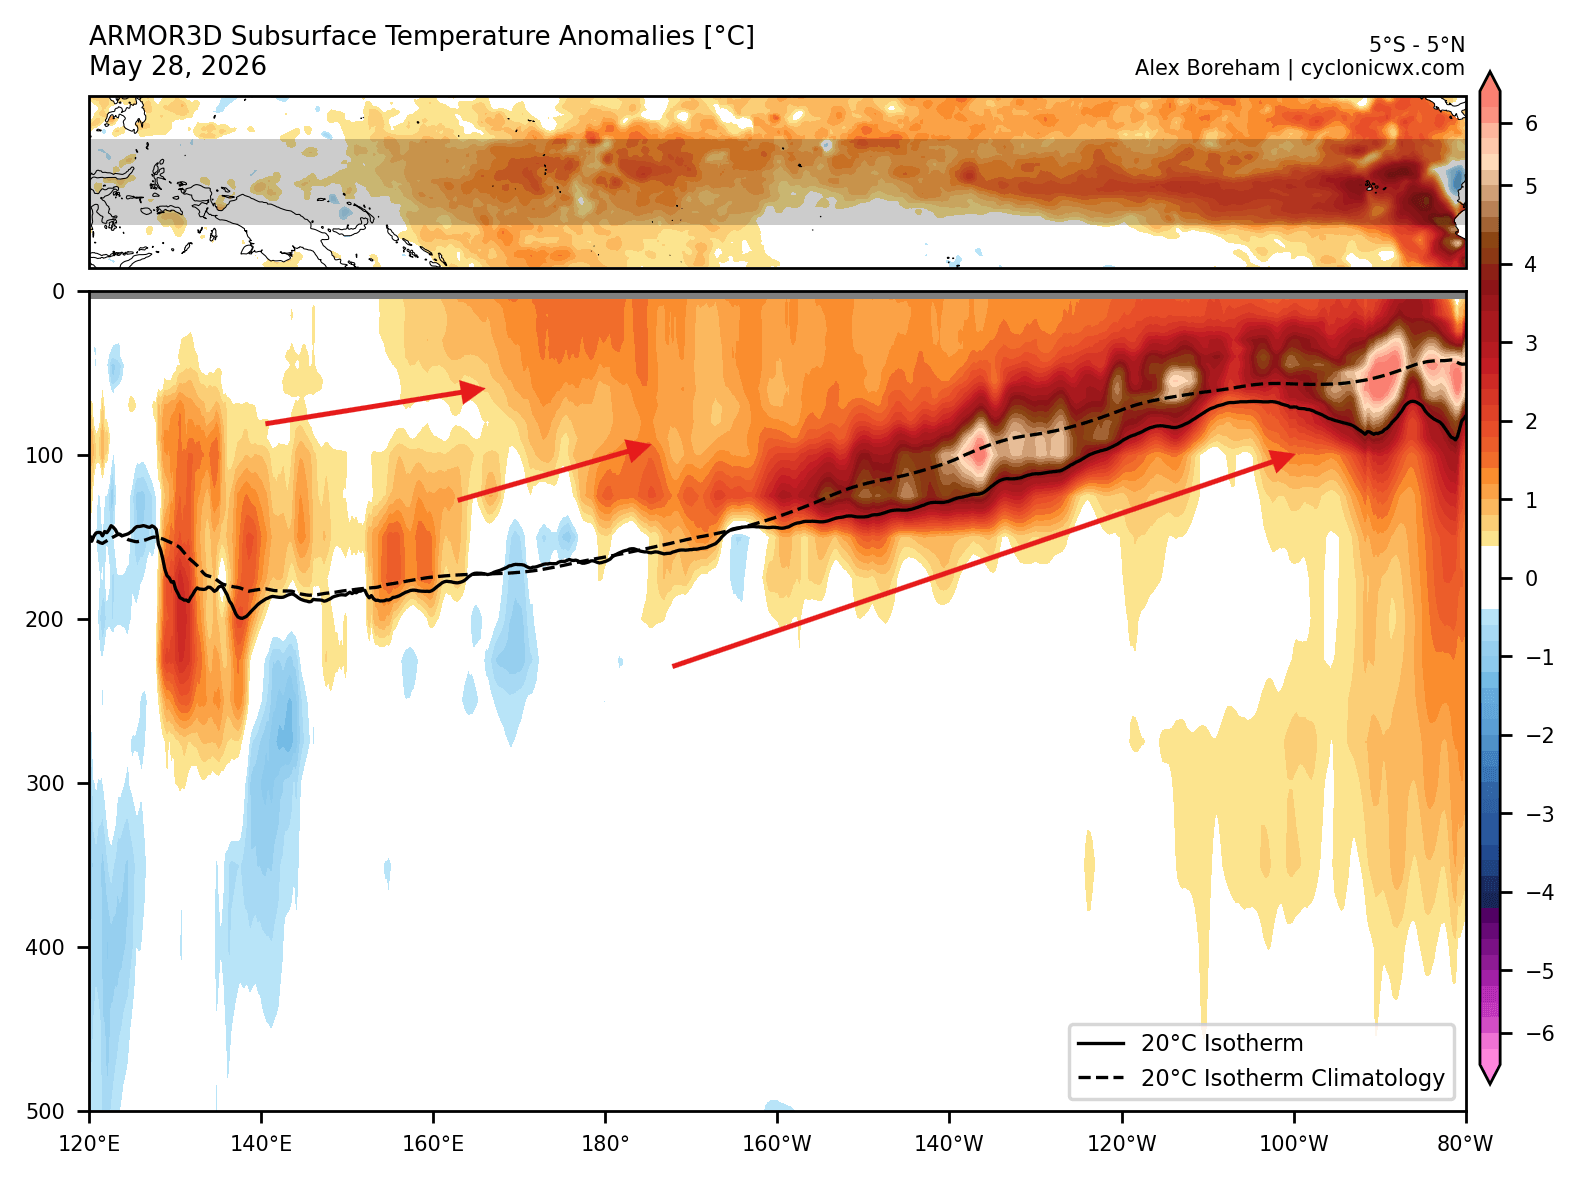
These subsurface Kelvin waves are driven by the westerly wind bursts, pushing the warmer subsurface ocean waters to the east, where they rise to the surface. This is visible in the video animation below, which is the best way to track the Kelvin Wave development, showing clear eastward movement and eventual rise to the surface.
This process is also captured by the seasonal models, which currently indicate we could be witnessing a potentially record-breaking El Niño event in 2026/2027.
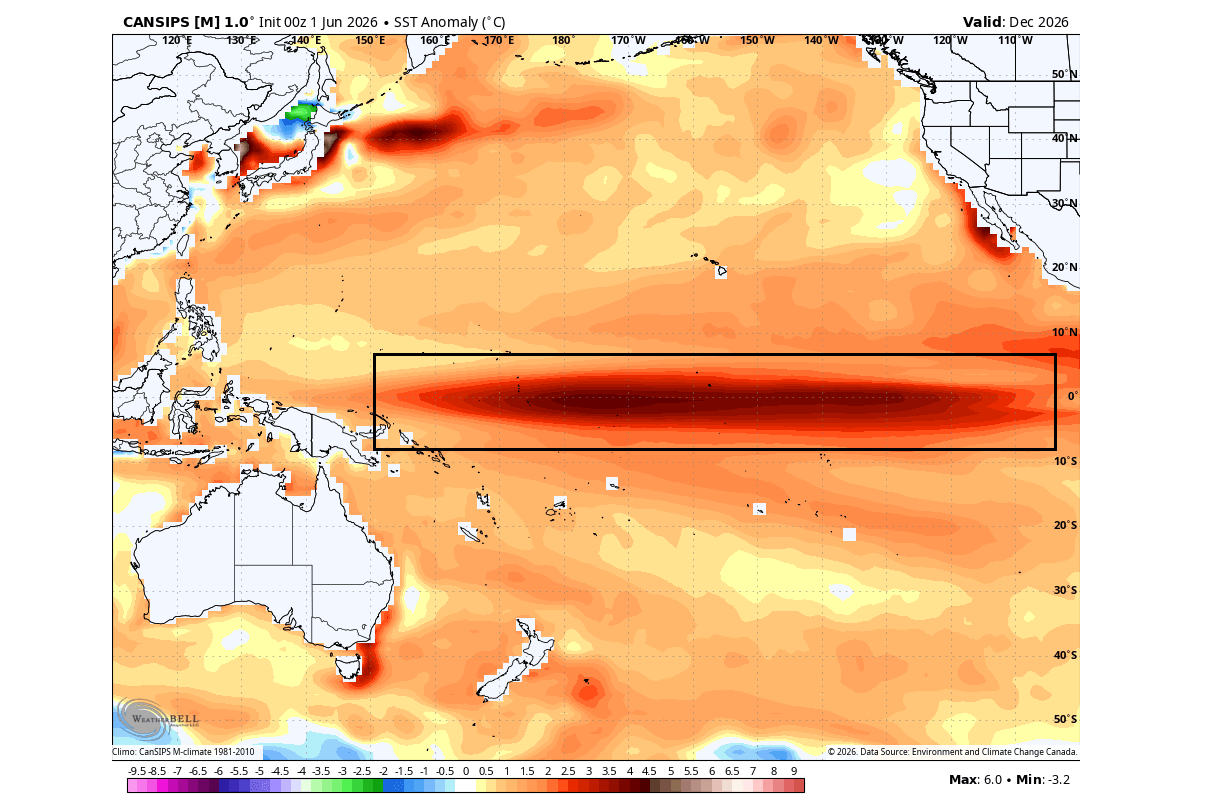
The latest available forecast currently comes from the Canadian CanSIPS model. We decided to use this as an example because it is based on the latest data. The image below is a forecast for later in the year, during peak anomaly strength, revealing a substantial Super El Niño event, with peak local anomalies at +6 degrees.
We produced a custom plot that compares the most recent forecasts with historical El Niño events. The strongest events since 1870 are plotted in the image. The forecasts from 3 different authorities all show a super-level El Niño event, equal or stronger than anything seen in recent history.
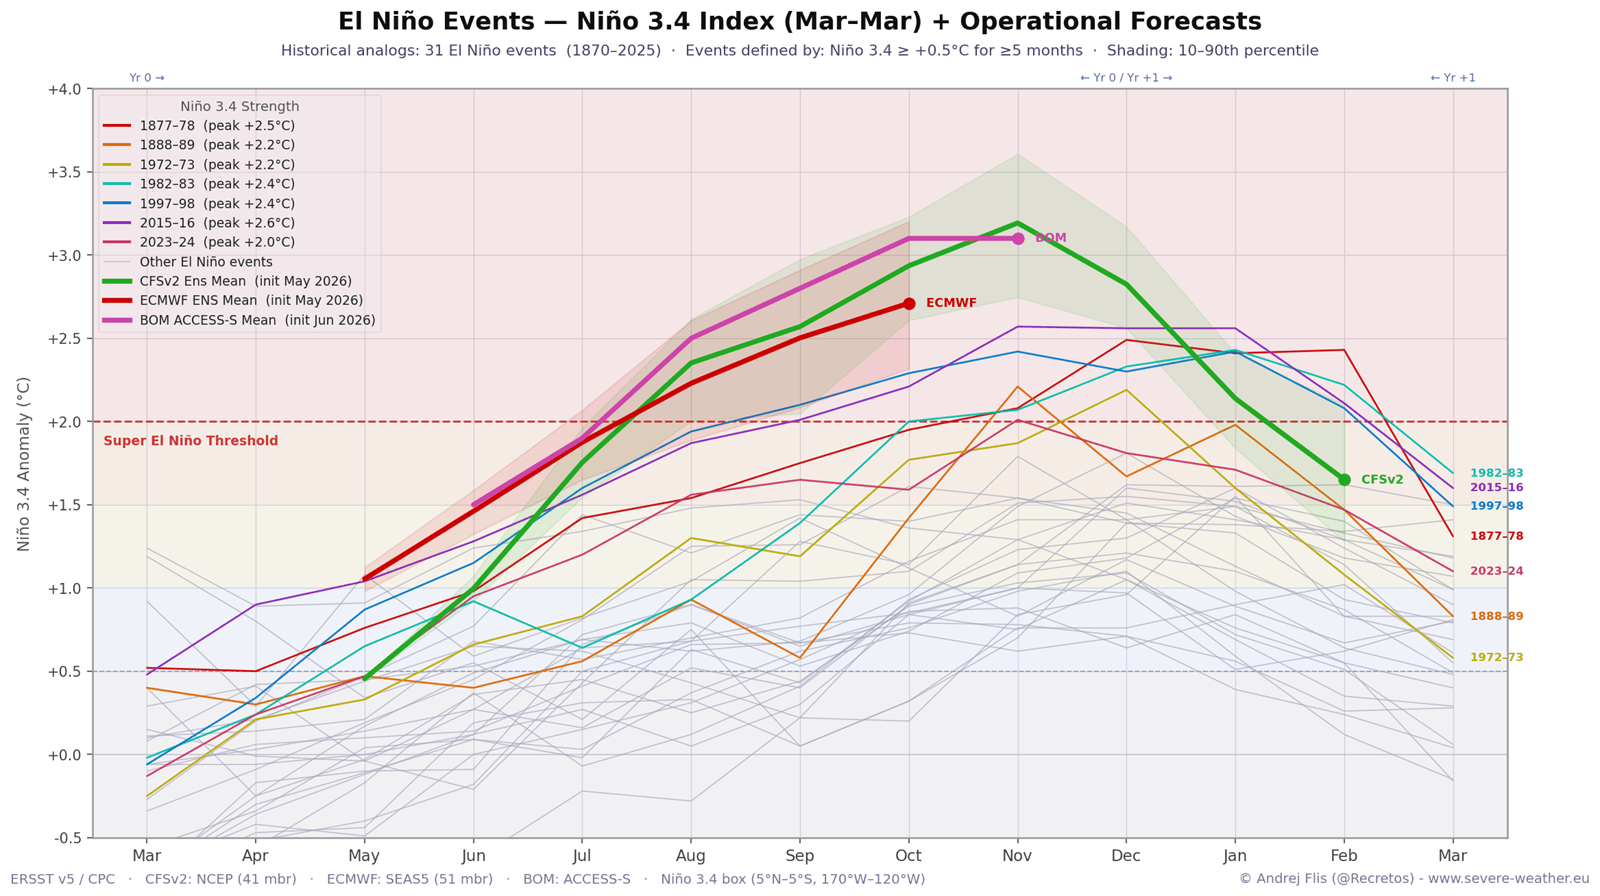
Forecasts are from the NOAA CFSv2 model in the United States (cyan line), the European ECMWF (red line), and the Australian BOM (pink line). These are 3 forecasts from different continents and modeling systems, yet all agree that we are heading for a strong event in 2026/2027.
At this point, we know that a major shift is underway in both the tropical stratosphere and the Pacific, where two major global weather players are shifting course. What we all want to know is how the seasonal weather looks once they meet for the Winter season?
Historical Perspective: Comparing Past Winter Atmospheric Patterns to the 2026/2027 Signal
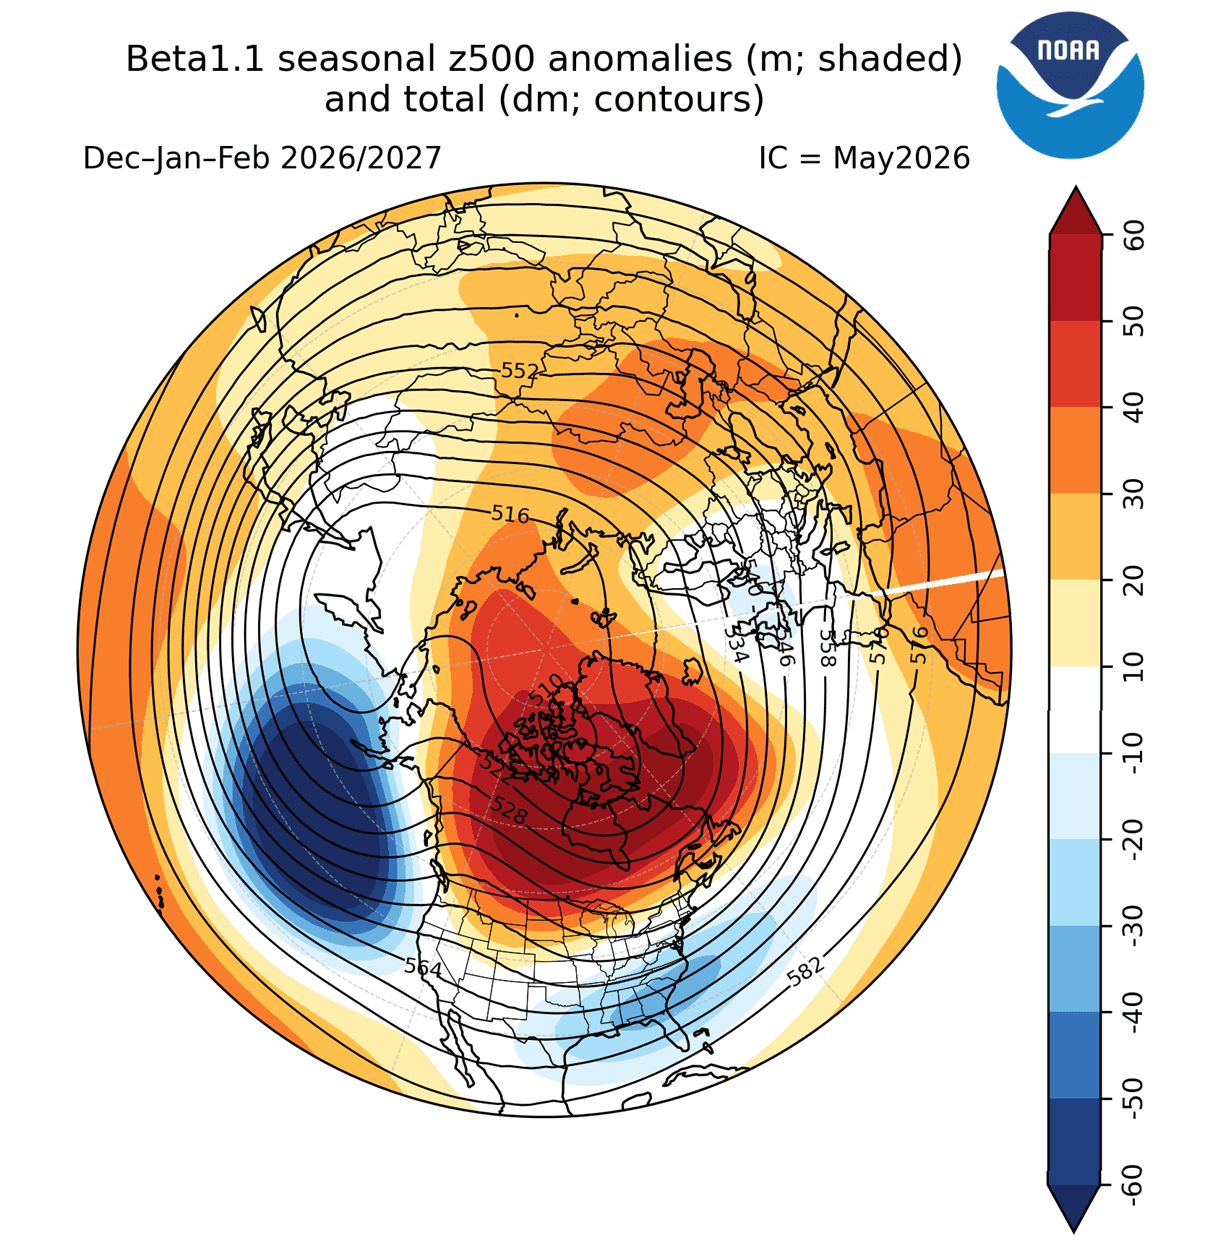
We will start in the stratosphere, where the connection point is, with a comparison graphic for the winter Polar Vortex anomaly. On the left side is the anomaly for El Niño + West/positive QBO winter, like we will have this year. And on the right are the El Niño winters with an East/negative QBO.
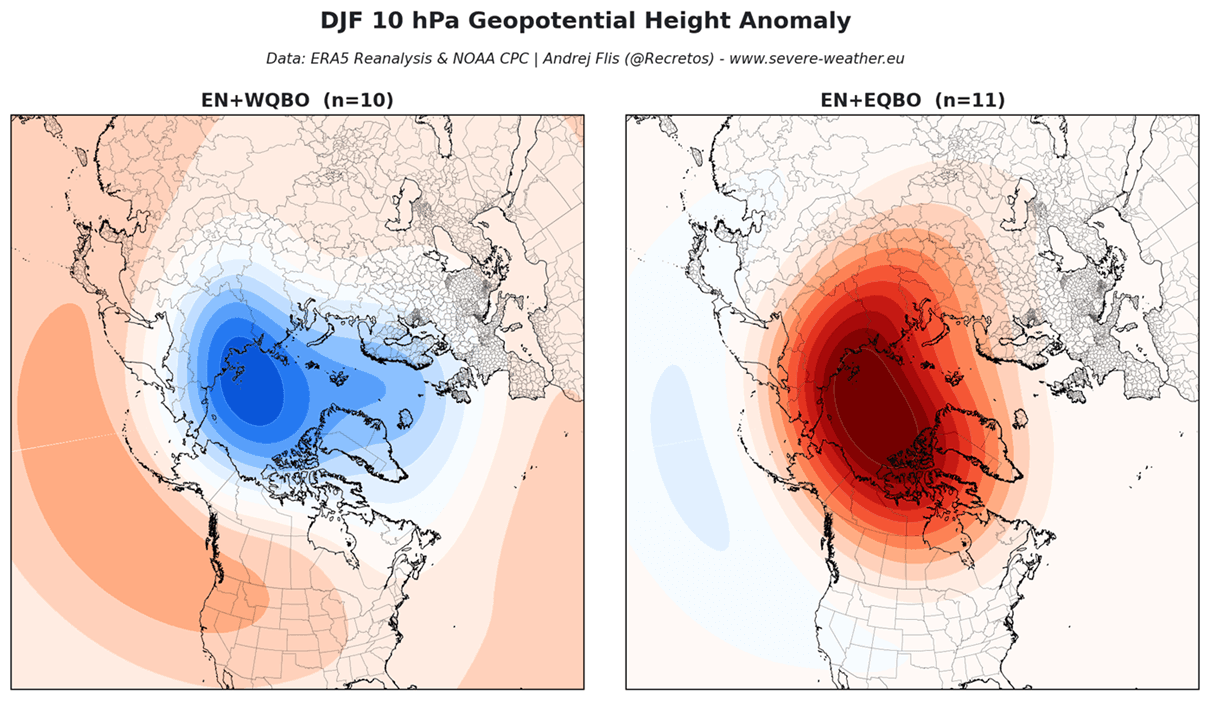
What is clear is that in El Niño winters with west QBO, the Polar Vortex can see some disruption from the Pacific side, depending on the individual year. This can be a future source of a Stratospheric Warming Event or a Polar Vortex collapse. But the east QBO winters show a strong disruption signal, with a higher chance of a Polar Vortex disruption and better winter potential.
The takeaway here is that there is some potential for Polar Vortex disruptions coming from the North Pacific area. But it needs to be monitored during winter for specific development, as each year behaves a bit differently.
We can also compare the pressure pattern in El Niño winters during west QBO (left) and east QBO (right). Both show the typical El Niño low-pressure system in the North Pacific and a blocking high-pressure area over northern Canada and Greenland. But the difference is big in the strength of the blocking high and the surrounding Eurasian pattern.
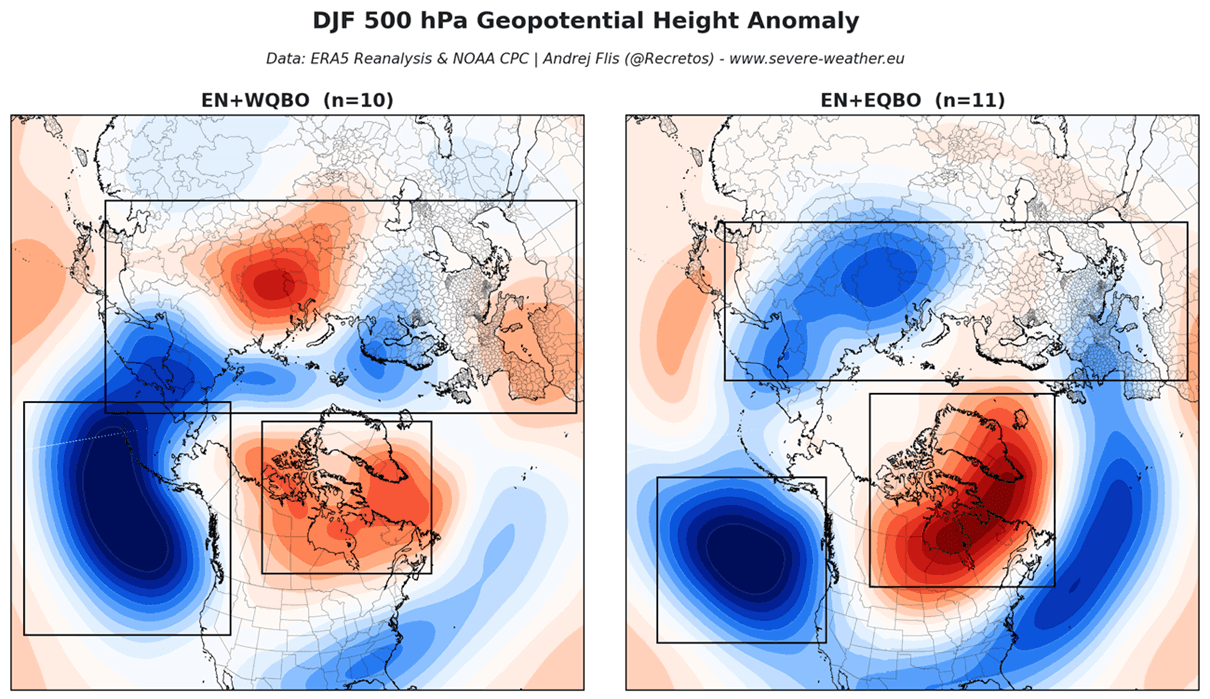
This perhaps more subtle difference can mean a big change in the weather outcome, as it can shift the position of the jet stream enough to send that big snowstorm a few hundred miles away.
We can compare this to some of the latest trends for Winter 2026/2027. There are no really usable forecasts at this far range, but we can look at what the early ideas are, and if they confirm what the analysis is showing. Below is the experimental forecast from the new NCEP long-range model, and it shows a very close match to the El Niño + West QBO pattern above.
It is really interesting to see such a close match, and it just confirms how the atmosphere can be more predictable when we are dealing with very strong global drivers.
With El Niño and a stratospheric wind shift, we can expect certain weather changes, and it’s time we see what they are and how they can impact the upcoming Winter 2026/2027.
QBO Brings Shifting Temperature and Snowfall Patterns in Europe
We will first look at the changes over Europe, where the difference seems bigger, since it’s under less of a direct impact from El Niño, unlike North America, which we will analyze right after.
Looking first at the Winter temperatures, you can see right away what a big difference QBO can bring over Europe during El Niño. With a west QBO as we expect for 2026/27, the temperatures are higher, while an east QBO in an El Niño brings much higher cold potential.
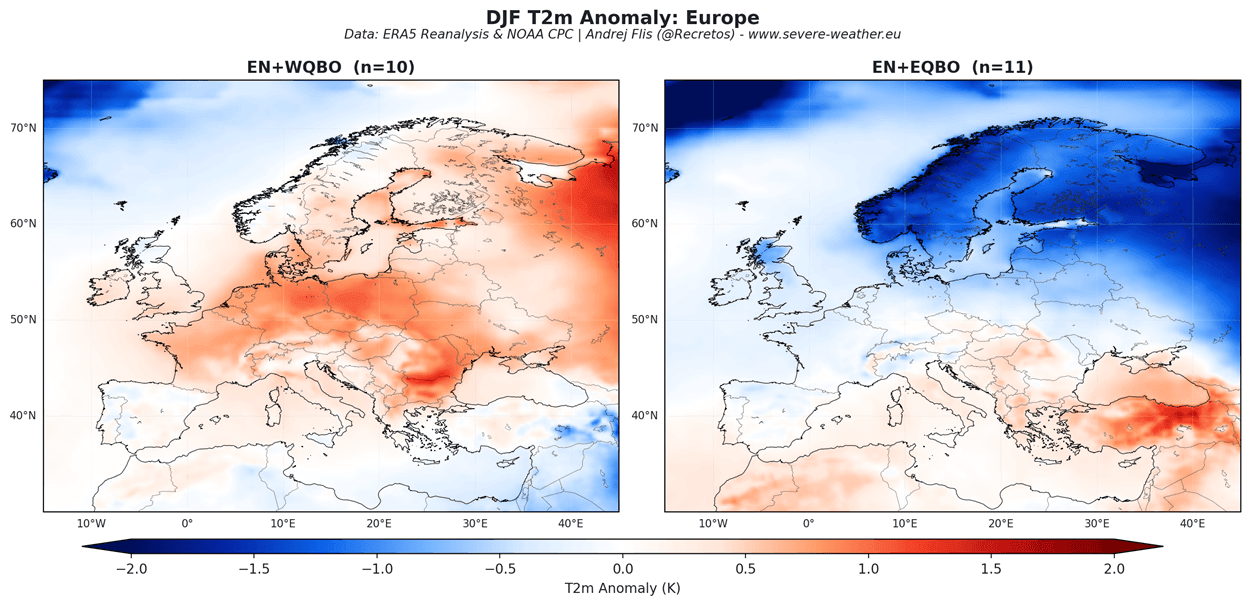
This comes from a large difference in pressure anomalies, as the west QBO brings a low-pressure area over northern Europe, amplifying the westerly Atlantic flow into the continent.
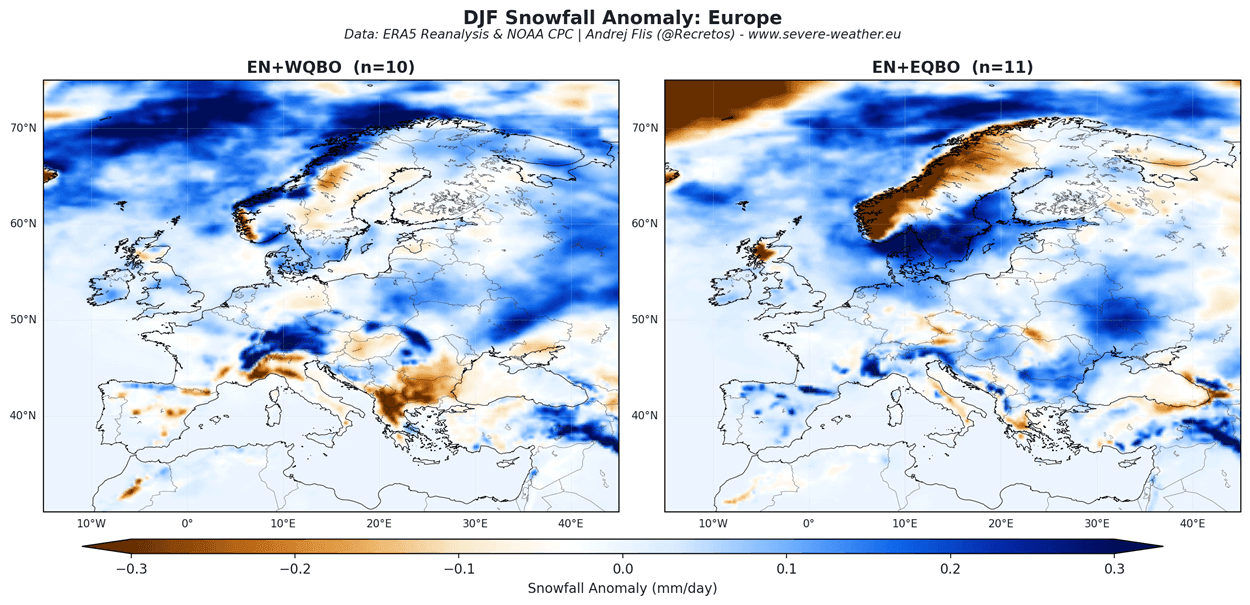
We can also see an impact on snowfall, where the West QBO + El Niño (left) seems to pull the snow further north, peaking north of the Alps and in northern parts.
This is better seen in the image below, which shows the difference between the west and east QBO during an El Niño winter. It basically shows that west QBO brings more snowfall to the north-central parts, the northwest (UK+Ireland), and the far north.
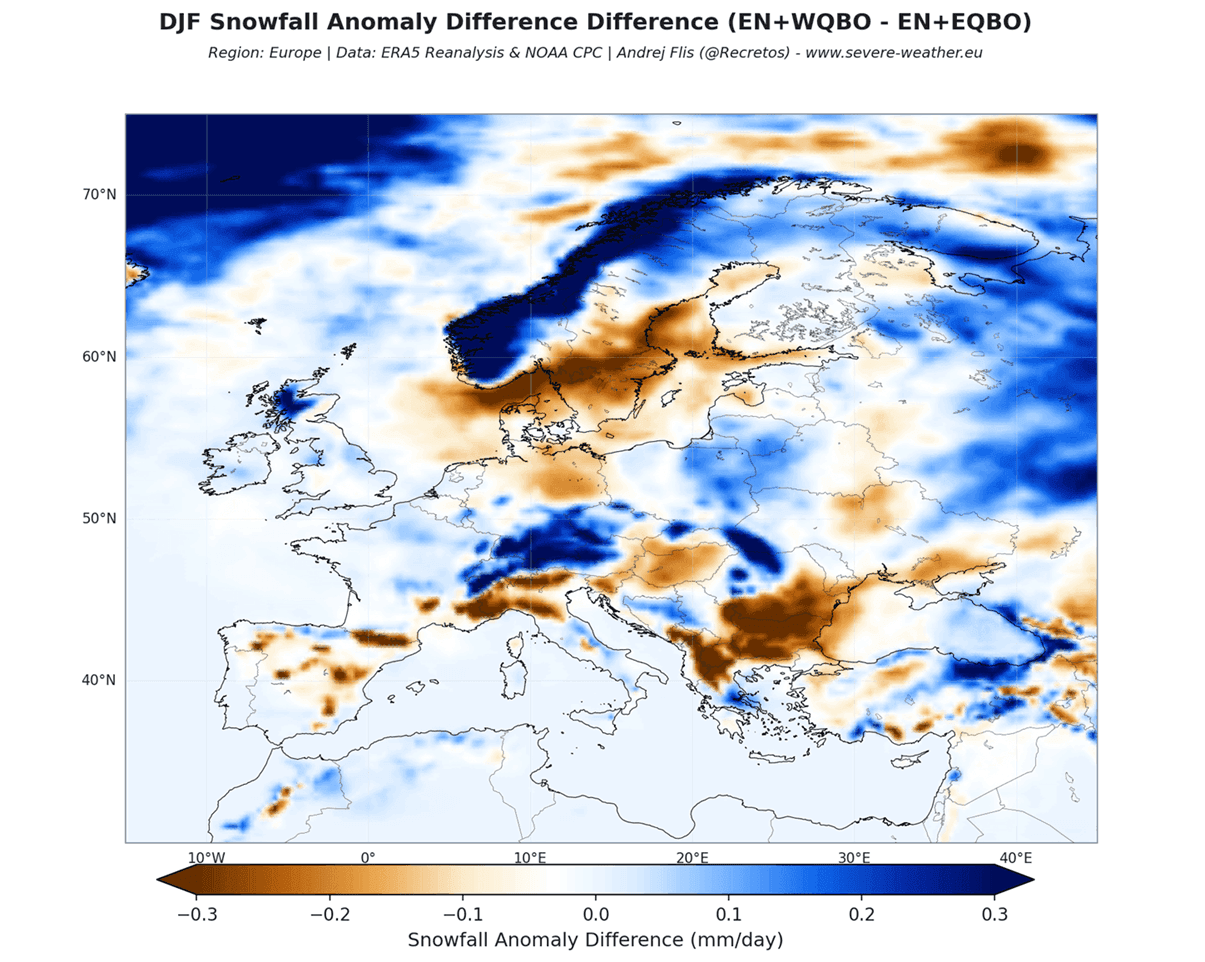
There is less snowfall in the south-central parts, the southeast, and the southwest, mainly due to changes in access to sufficient cold air.
Switching over to North America, we can also see quite a difference between an El Niño winter in the west or east QBO phase.
North American Footprint: Cold Air and Snowfall Trends Across the United States and Canada
First, we have the temperature anomaly analysis for all El Niño winters with the QBO in the west phase, like we will see this year. You can see below-normal temperatures over much of the central, eastern, and southern parts of the United States, under the amplified Pacific jet stream.
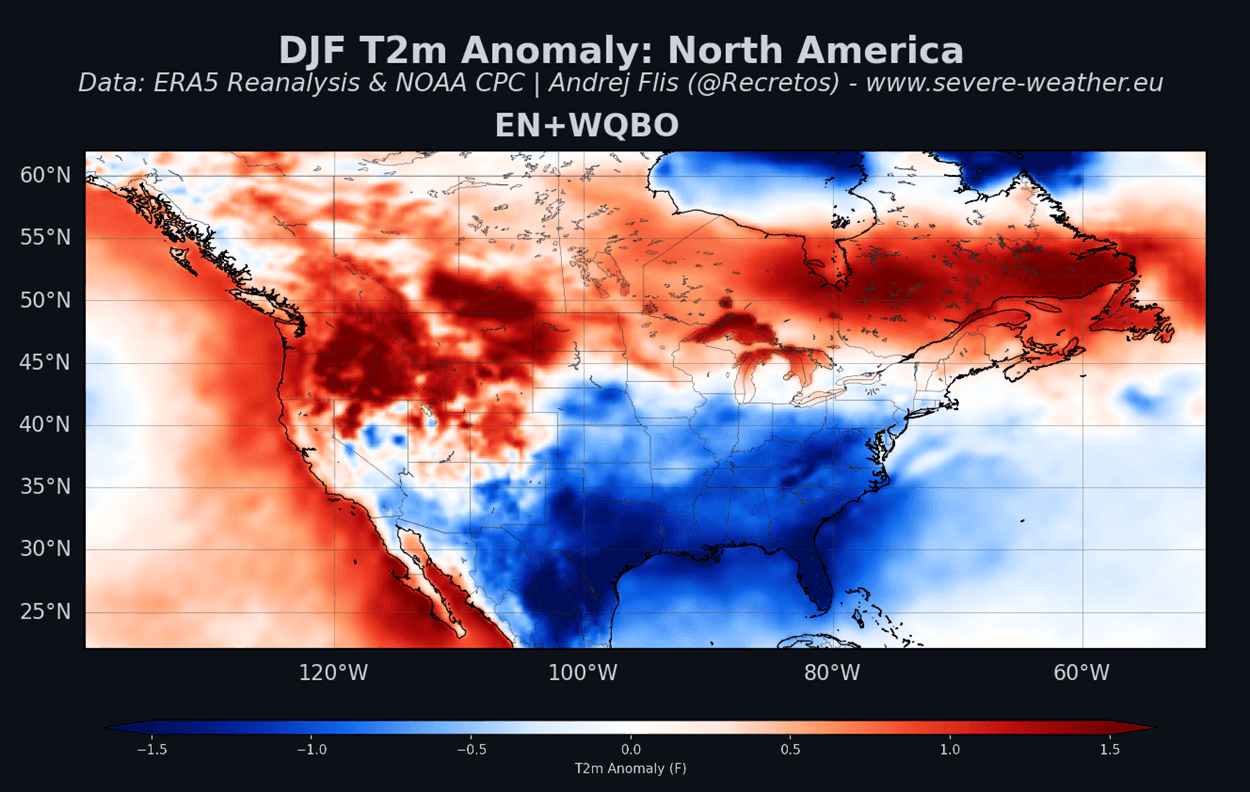
You can also see much above-normal temperatures over the western and northwestern United States, the northern plains, the upper Midwest, and Canada, under the high-pressure anomaly and a deflected polar jet.
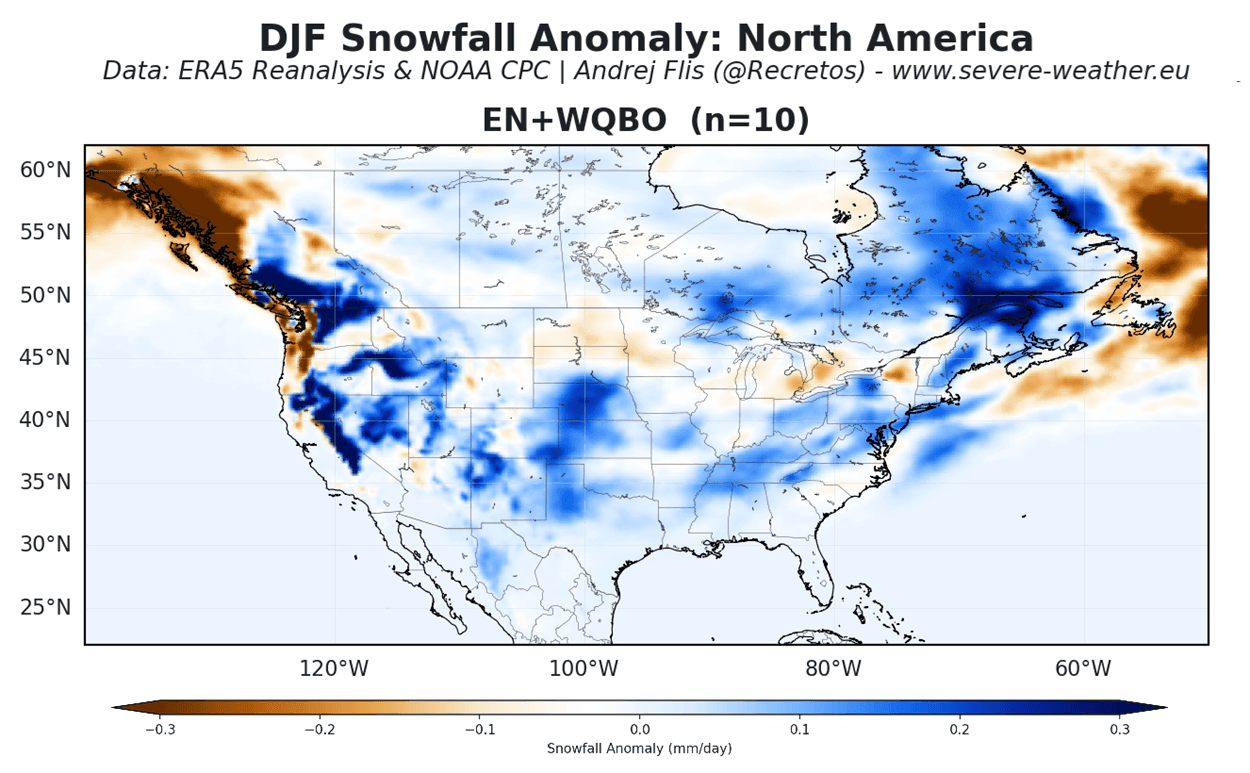
This has a profound effect on snowfall. Below is the snowfall anomaly map for the same winters as above (WestQBO + El Niño). You can see that these winters tend to bring more snowfall over the plains, eastern United States, west Rockies, and eastern Canada.
We also compared this to the east QBO El Niño winters below. You can see that the west phase (compared to the east phase) brings more snowfall to the Midwest, the central Plains, western and northwestern United States, and southeastern Canada.
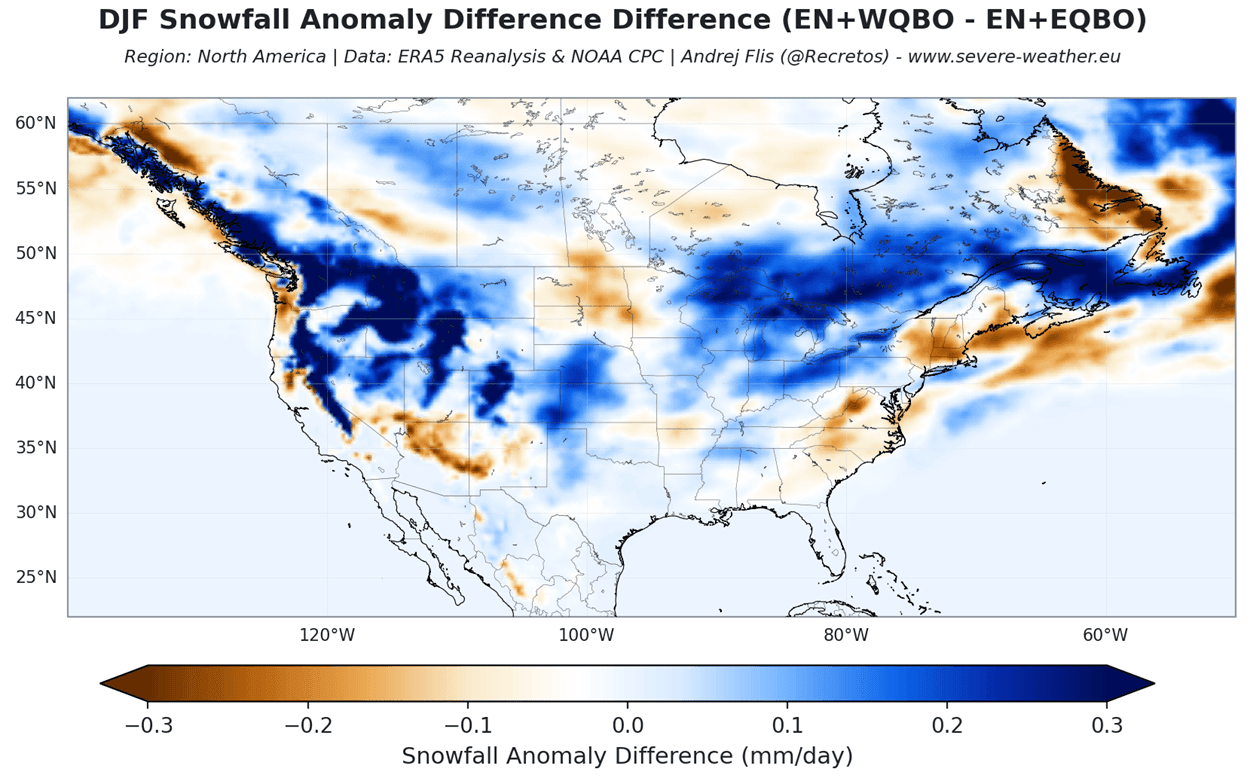
But we can see it tends to reduce snowfall across the northeastern United States, the Southeast, and the Southwest. But of course, this is an average of multiple winters, with each one having a slightly different (but similar) pattern, which can impact weather locally, shifting systems over a few hundred miles.
As an example, we can look at winter 2015/2016, which was the last Super El Niño winter with a west QBO. For this purpose, we produced an image of the snowfall anomaly during that winter season, heavily influenced by these two mega anomalies.
The image below shows above-normal snowfall stretching across the southern and central United States. Snowfall was heavily concentrated in the Southwest and Southern Rockies, extending eastward across the Central Plains and lifting into parts of the Upper Midwest (including Iowa, Minnesota, and Wisconsin).
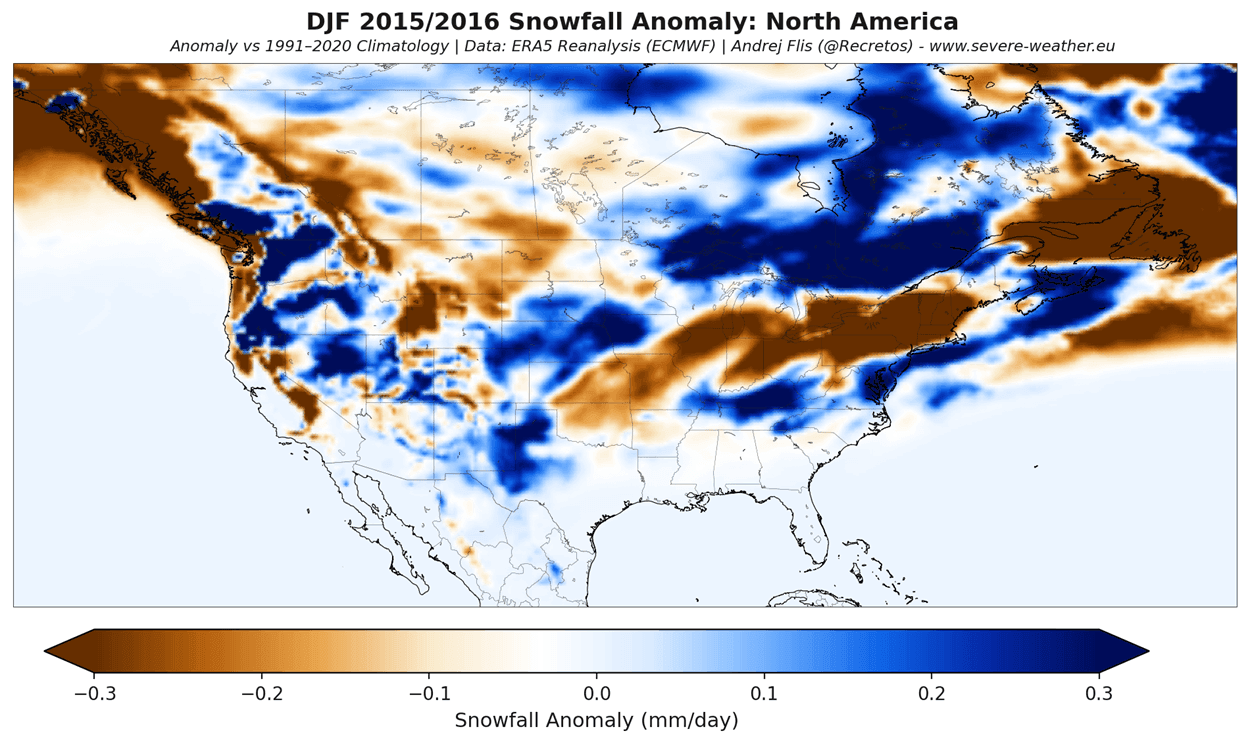
In the eastern United States, above-normal snowfall was focused in a specific corridor through the Mid-Atlantic region (centered over Virginia, Maryland, and Delaware) and extends just off the coast, while higher-than-average snowfall is also visible across northern Quebec and Labrador.
Below-normal snowfall (brown) dominates the far northern and eastern tiers of the continent. A severe snow deficit is evident across the Pacific Northwest, British Columbia, the northern Rockies, and the northernmost Plains.
Another area of below-average snow runs from the Great Lakes region straight through the Northeast and New England into the Canadian Maritimes, highlighting how the traditional northern snowbelts missed out while the southern storm track dominated.
This overall shows just how impactful these big oceanic and atmospheric anomalies can be on seasonal weather. And this is just the start, as we will have more content on the seasonal development as we gather more data and these events unfold.
Forecast and analysis images in this article (if not specified in the image) are from cyclonicwx.com and WeatherBell, using a commercial license.
We will keep you updated on global weather development and long-range outlooks, so bookmark our page. Also, if you have seen this article in the Google App (Discover) feed, click the like button to see more of our forecasts and our latest articles on weather and nature in general.
Don’t miss:
First El Niño Impacts Now Detected in the June Weather Forecast for the United States and Canada