UPDATE June 26th, 2026: Super El Niño Is Now Breaking Into the Atmosphere as July Forecasts Show a Pattern Shift for the U.S. and Canada
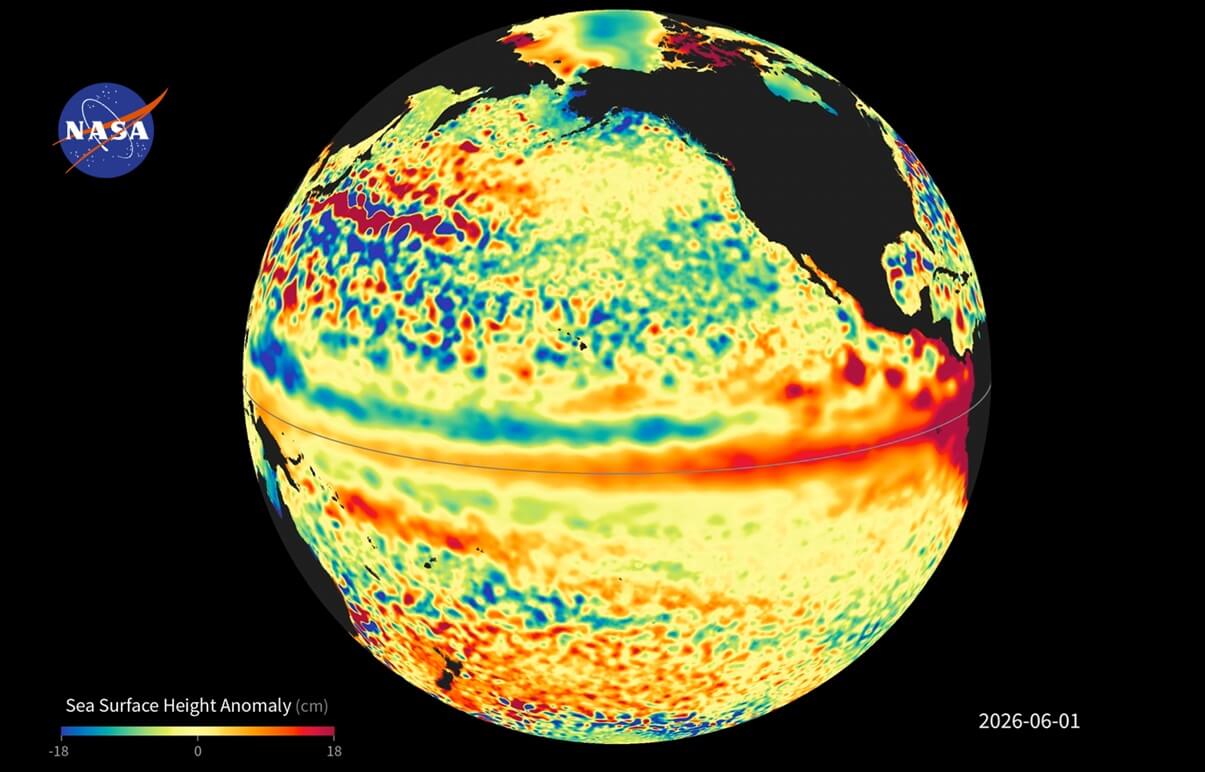
The latest data now shows a powerful Super El Niño signal rapidly emerging across the tropical Pacific. NASA satellite analysis is already detecting a major sea level height anomaly along the tropical Pacific, where warm subsurface water is rising and expanding as the event strengthens.
This ocean signal is supported by a massive Kelvin Wave below the surface, a sharp rise in ENSO region temperatures, and long-range forecasts that now push the event into rare Super El Niño territory for late 2026 and early 2027.
In this article, we will look at the latest ocean, satellite, and forecast data to see how strong this event could become, why the Pacific sea level rise is an important warning sign, and how the first atmospheric impacts are already starting to appear across North America and Europe for the rest of the summer and into Fall season.
Pacific Trigger: The Ocean Signal Behind a Global Weather Shift
Latest analysis and forecast data have now fully confirmed that El Niño will be a major global weather driver in 2026/2027. This ocean phase can cause a significant disturbance to the global weather system, especially when it develops as a “super” event.
In the image below, you can see a direct comparison between ocean temperature anomalies for each of the two ENSO phases, the warm El Niño and the cold La Niña. This can give us a nice idea of just how strong these anomalies can get and how different they are at both ends, warm and cold.
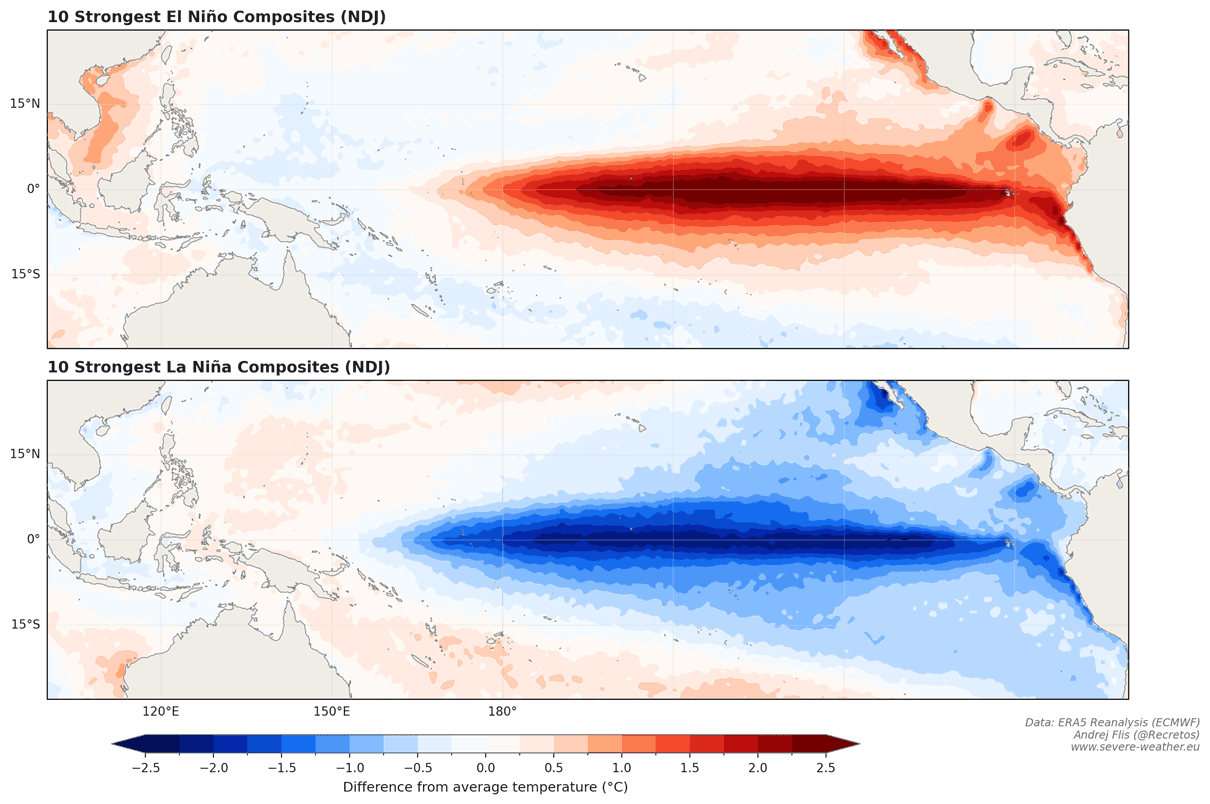
Besides ocean temperature, each phase also brings different pressure and rainfall impacts in the tropics, resulting in very different effects on the global weather circulation and our daily weather.
In this cycle, we are entering a potential Super El Niño, so we can look at the usual changes it makes to the atmospheric circulation. The rising and sinking atmospheric motion in the tropical regions is called a Walker Cell, and is especially sensitive to strong ENSO events. The schematic below shows the changes in atmospheric flow during a moderate and a strong El Niño event, which impact the global weather system in slightly different ways.
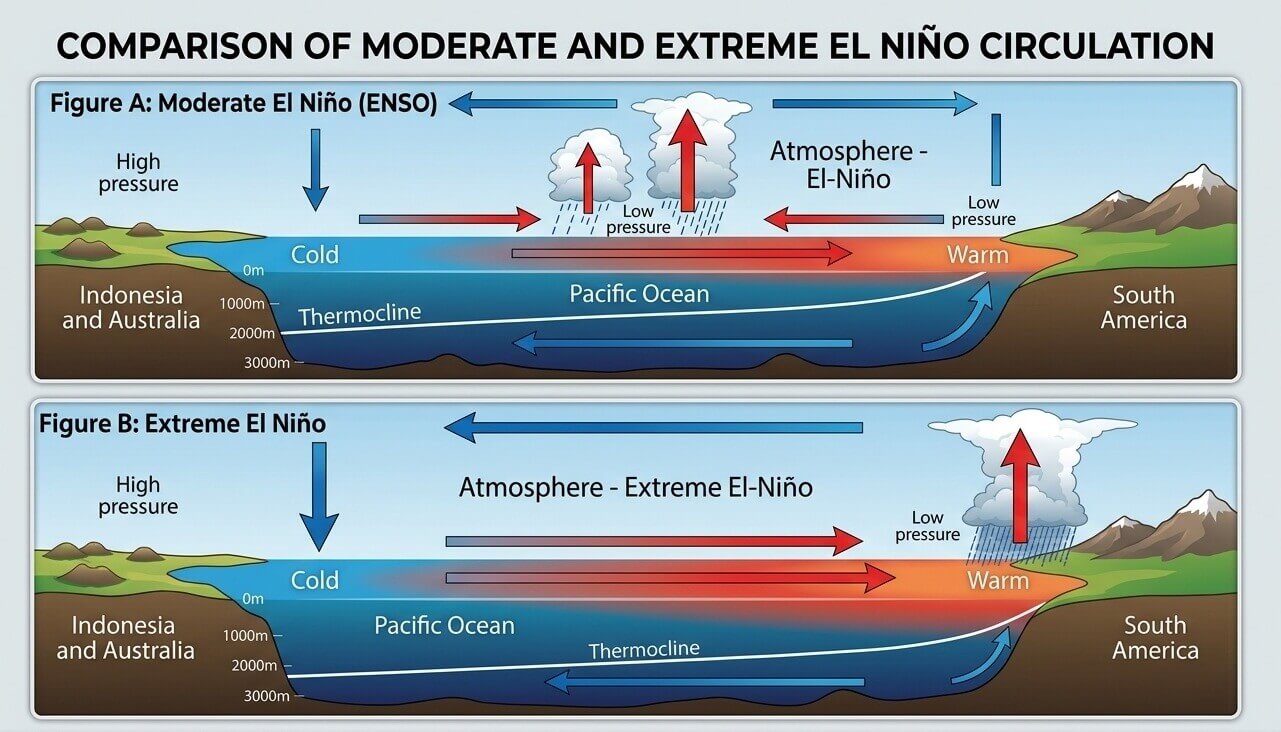
Every El Niño causes a pressure drop in the central and eastern tropical Pacific and a high-pressure zone over the western Pacific. This has a major influence on the tropical rainfall and pressure patterns, filtering into the mid latitudes and the global weather system.
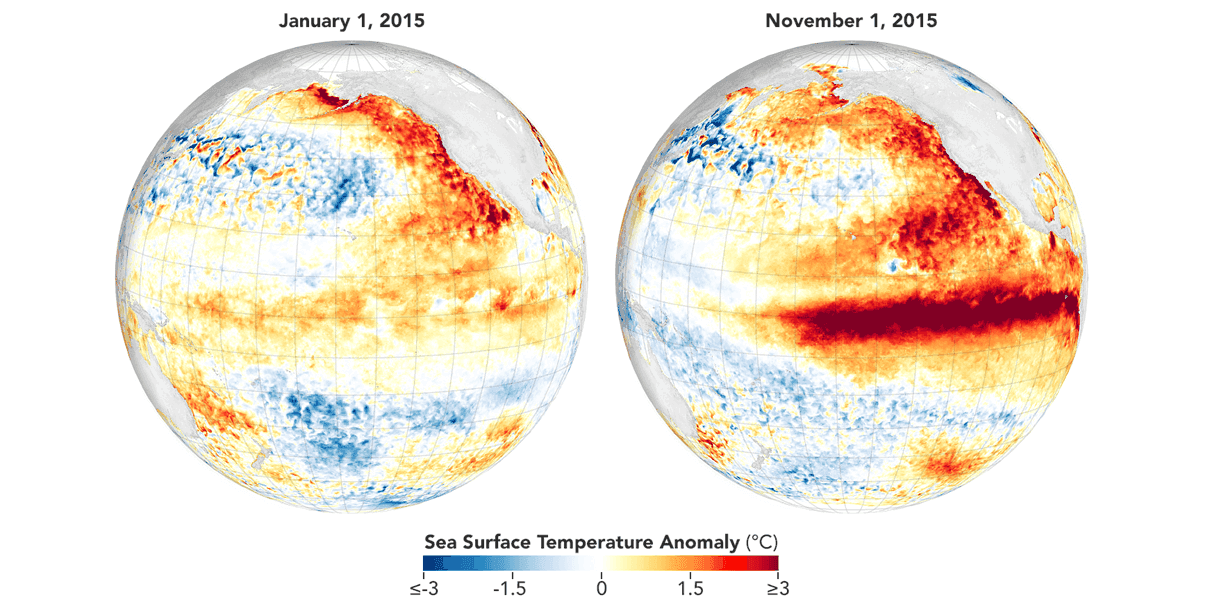
As mentioned in the intro, the latest data shows a Super El Niño event is forecast for the 2026/2027 period. Super events are rare, occurring once per decade or less. Below is an analysis by NASA Earth that shows the evolution during the last Super El Niño event in 2015, and how wide and strong the ocean anomalies were, compared to the start of the event, exceeding +3 degrees above normal.
A Super El Niño acts as a massive “pressure release valve” for piled-up warm water and energy in the Pacific. It is a highly energetic event with strong, global-scale impacts on weather, especially during the cold weather season over North America.
We will be looking for this signature in the analysis and forecast data, which, as you will see, indicates an even stronger event.
Rapid Rise: Super El Niño Gains Strength in the Latest Data
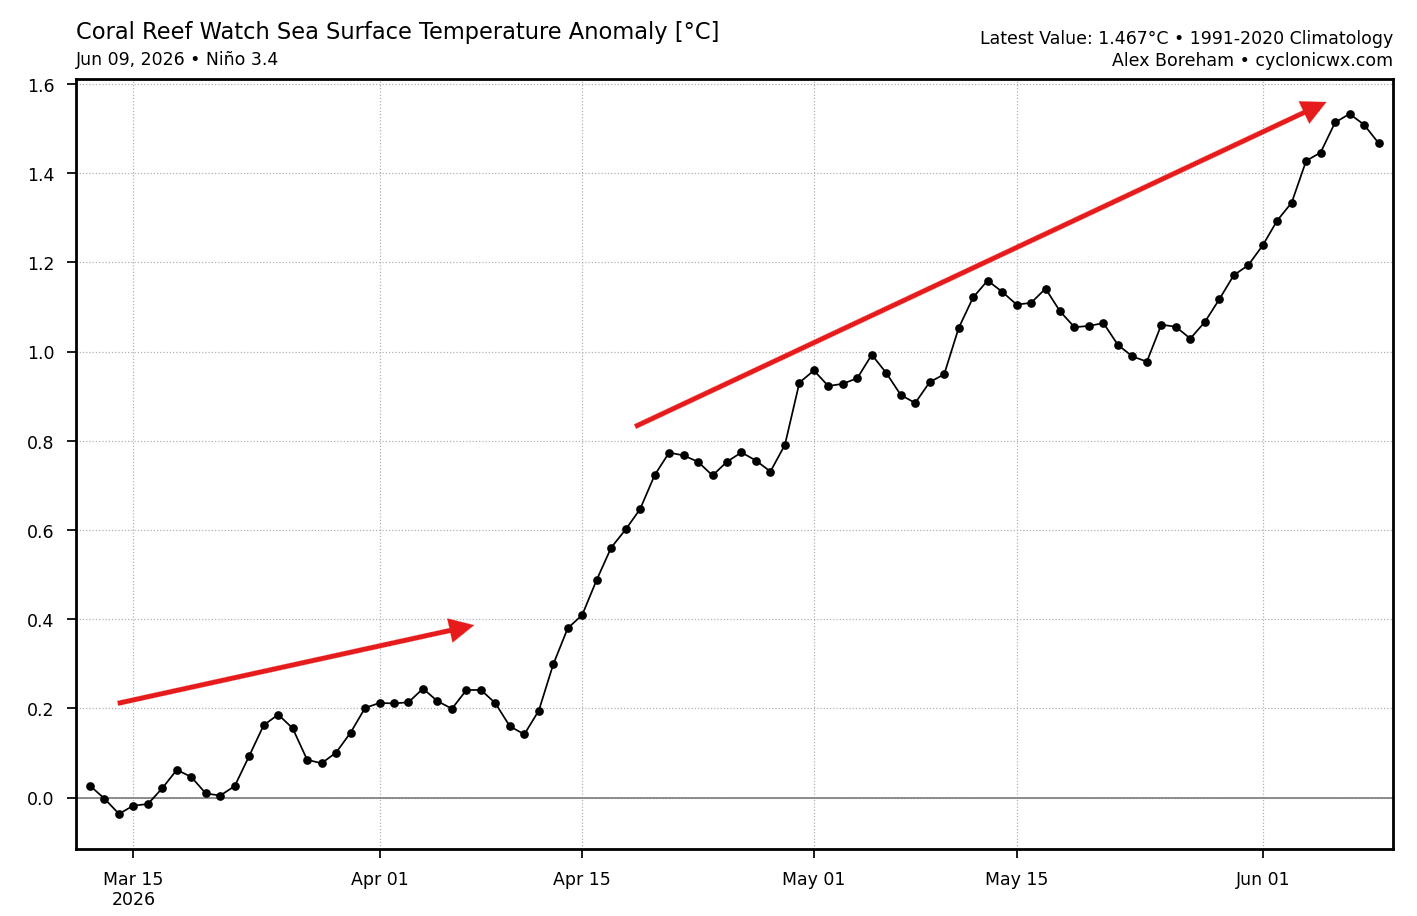
The best way to quickly analyze the current development is to first look at the anomaly graphs. This is a single graph for the main ENSO regions, and is the first evidence of a rapid shift in the Pacific. It shows a rapid rise in the temperature anomaly since March, with a faster rise since mid-April. The official threshold for an El Niño event is +0.5, sustained over a seasonal period.
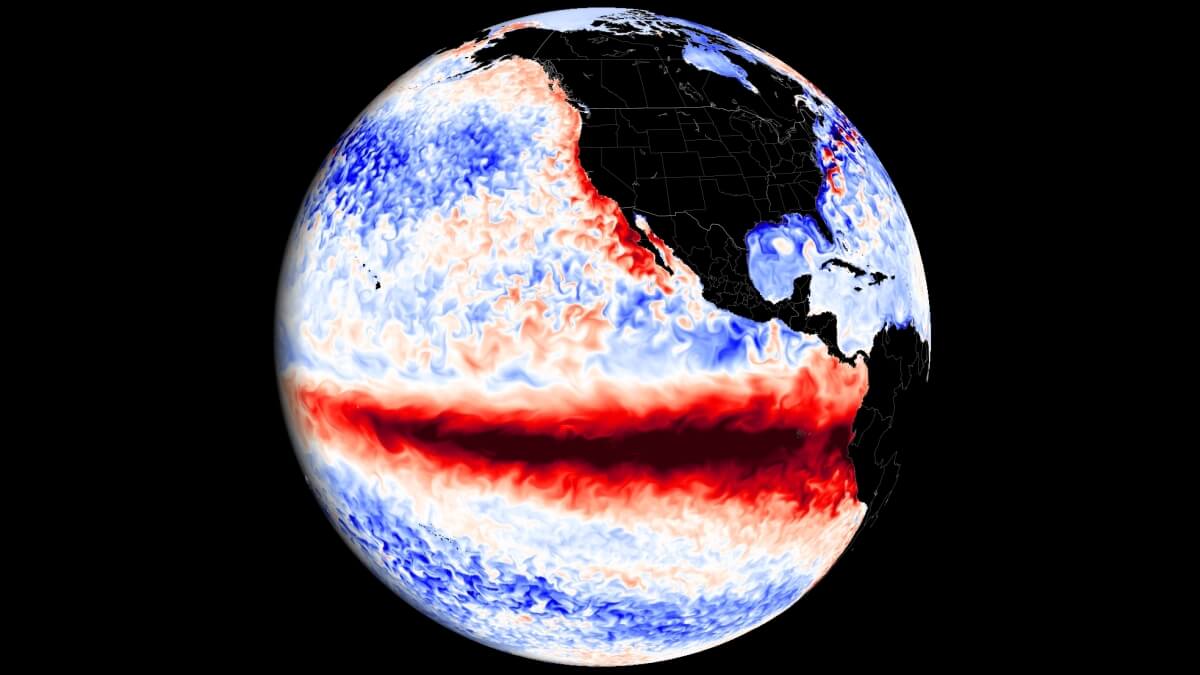
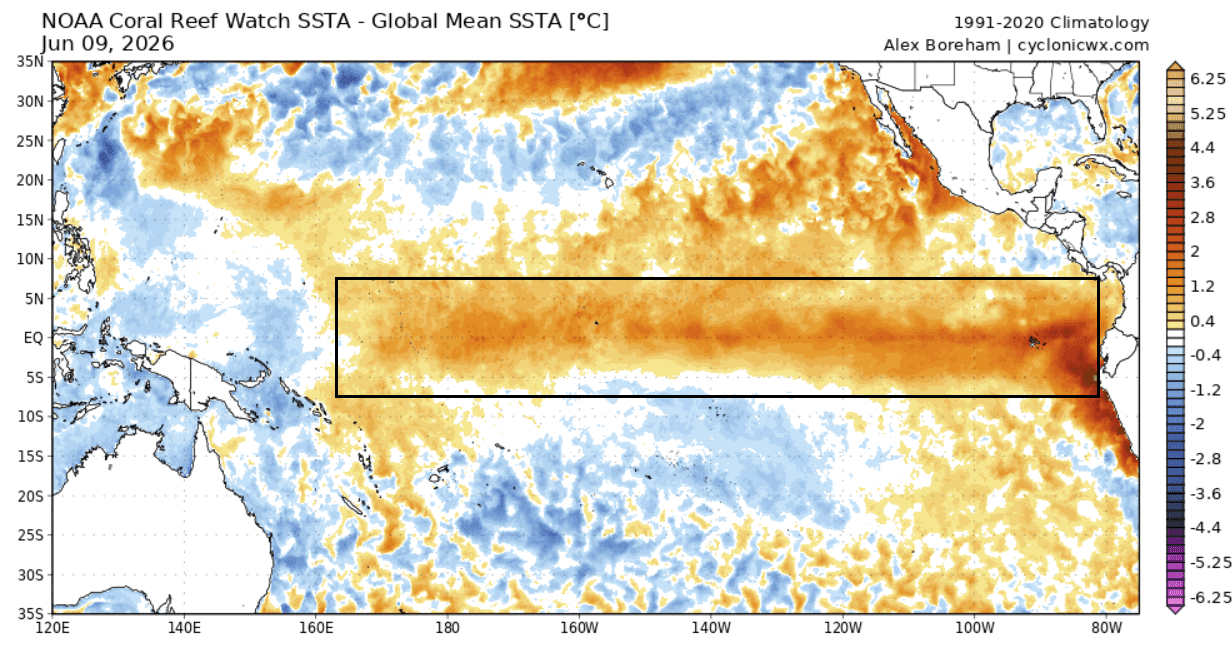
The latest ocean analysis below shows the main ENSO region fully immersed in warm anomalies. This analysis has the global average removed, so it shows the pure warm signal of the emerging El Niño, expected to rise much higher in the coming months, and already forming the warm area connecting to the southwestern parts of North America.
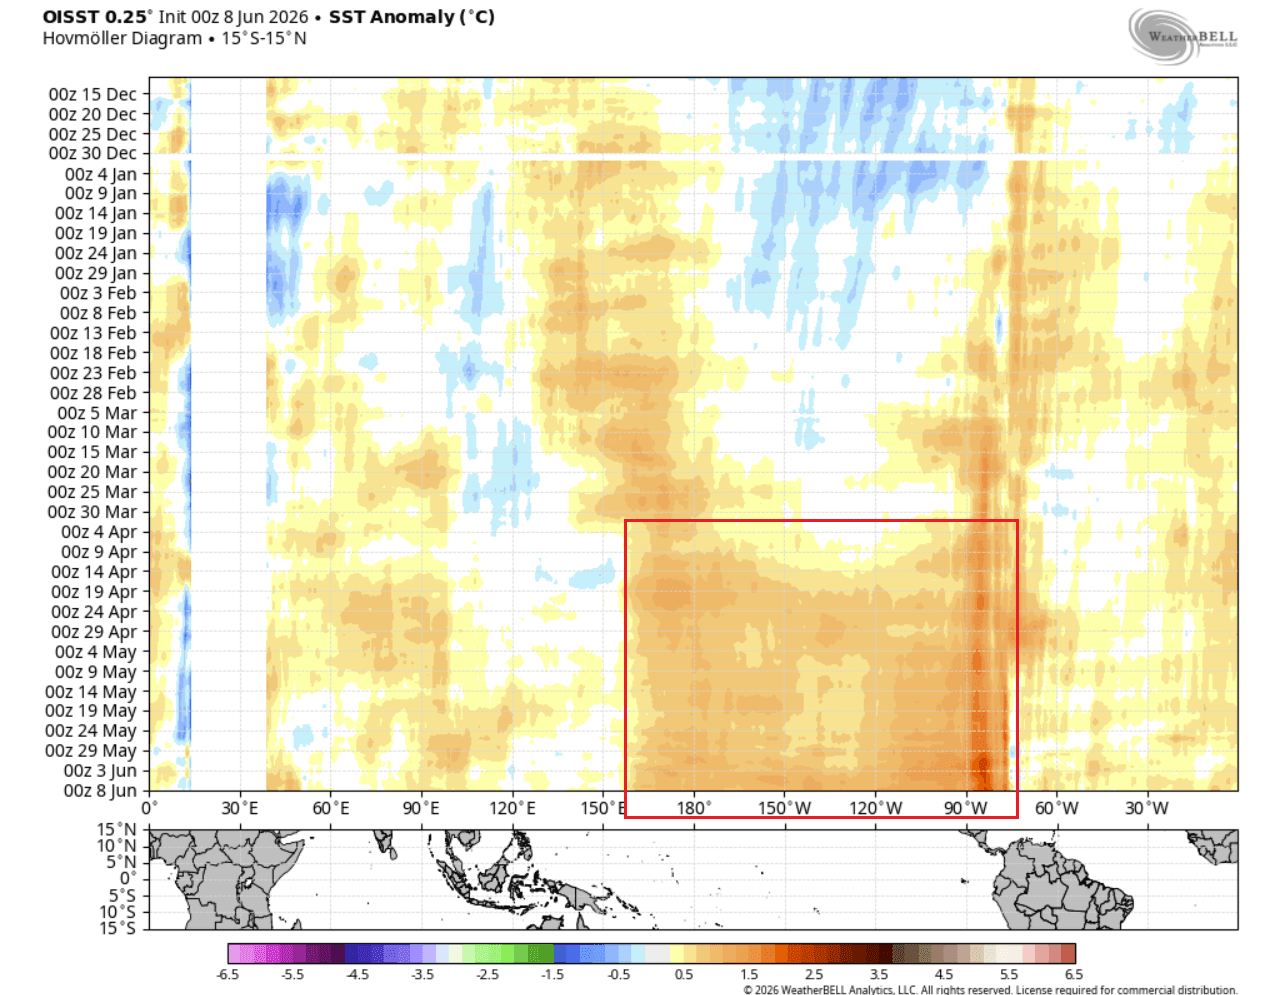
We can also see the full evolution of this event so far by looking at the last 6 months of ocean temperature anomalies. The image below shows a significant warm anomaly shift across the tropical Pacific since early April, following a weak cold La Niña event last winter. This is a direct result of a massive Kelvin Wave rising from below the ocean surface.
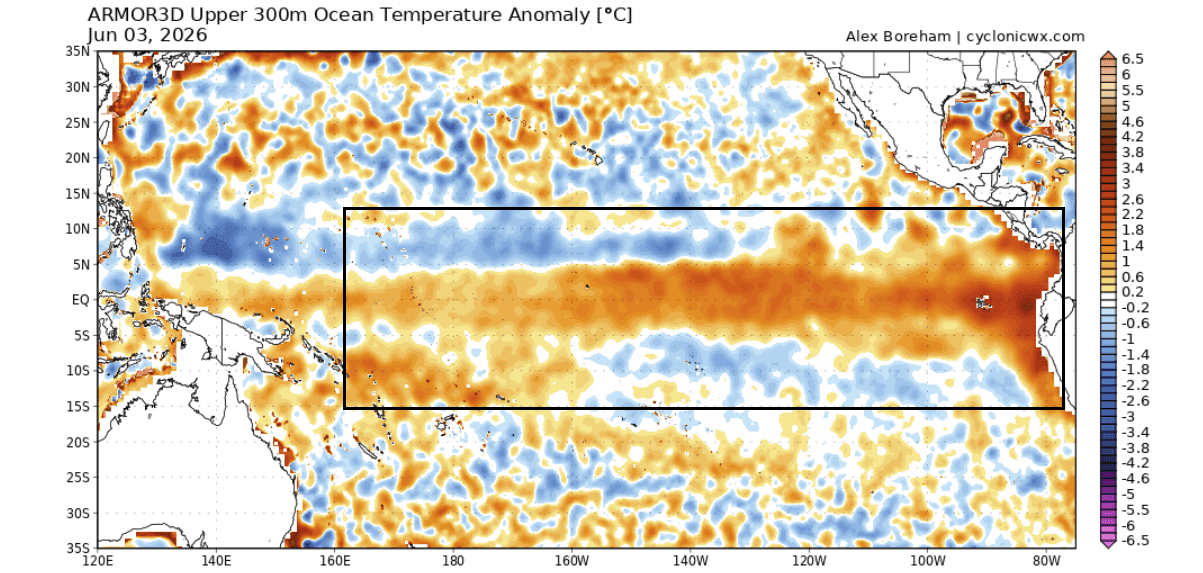
Below are subsurface temperature anomalies across the tropical Pacific in the top 270m (885ft) of the ocean, directly revealing the subsurface Kelvin Wave. The image also shows a direct comparison of subsurface anomalies for early June, between this year and the last two Super El Niño events. We are well on par with the last two super events, with even warmer conditions in the western area so far.
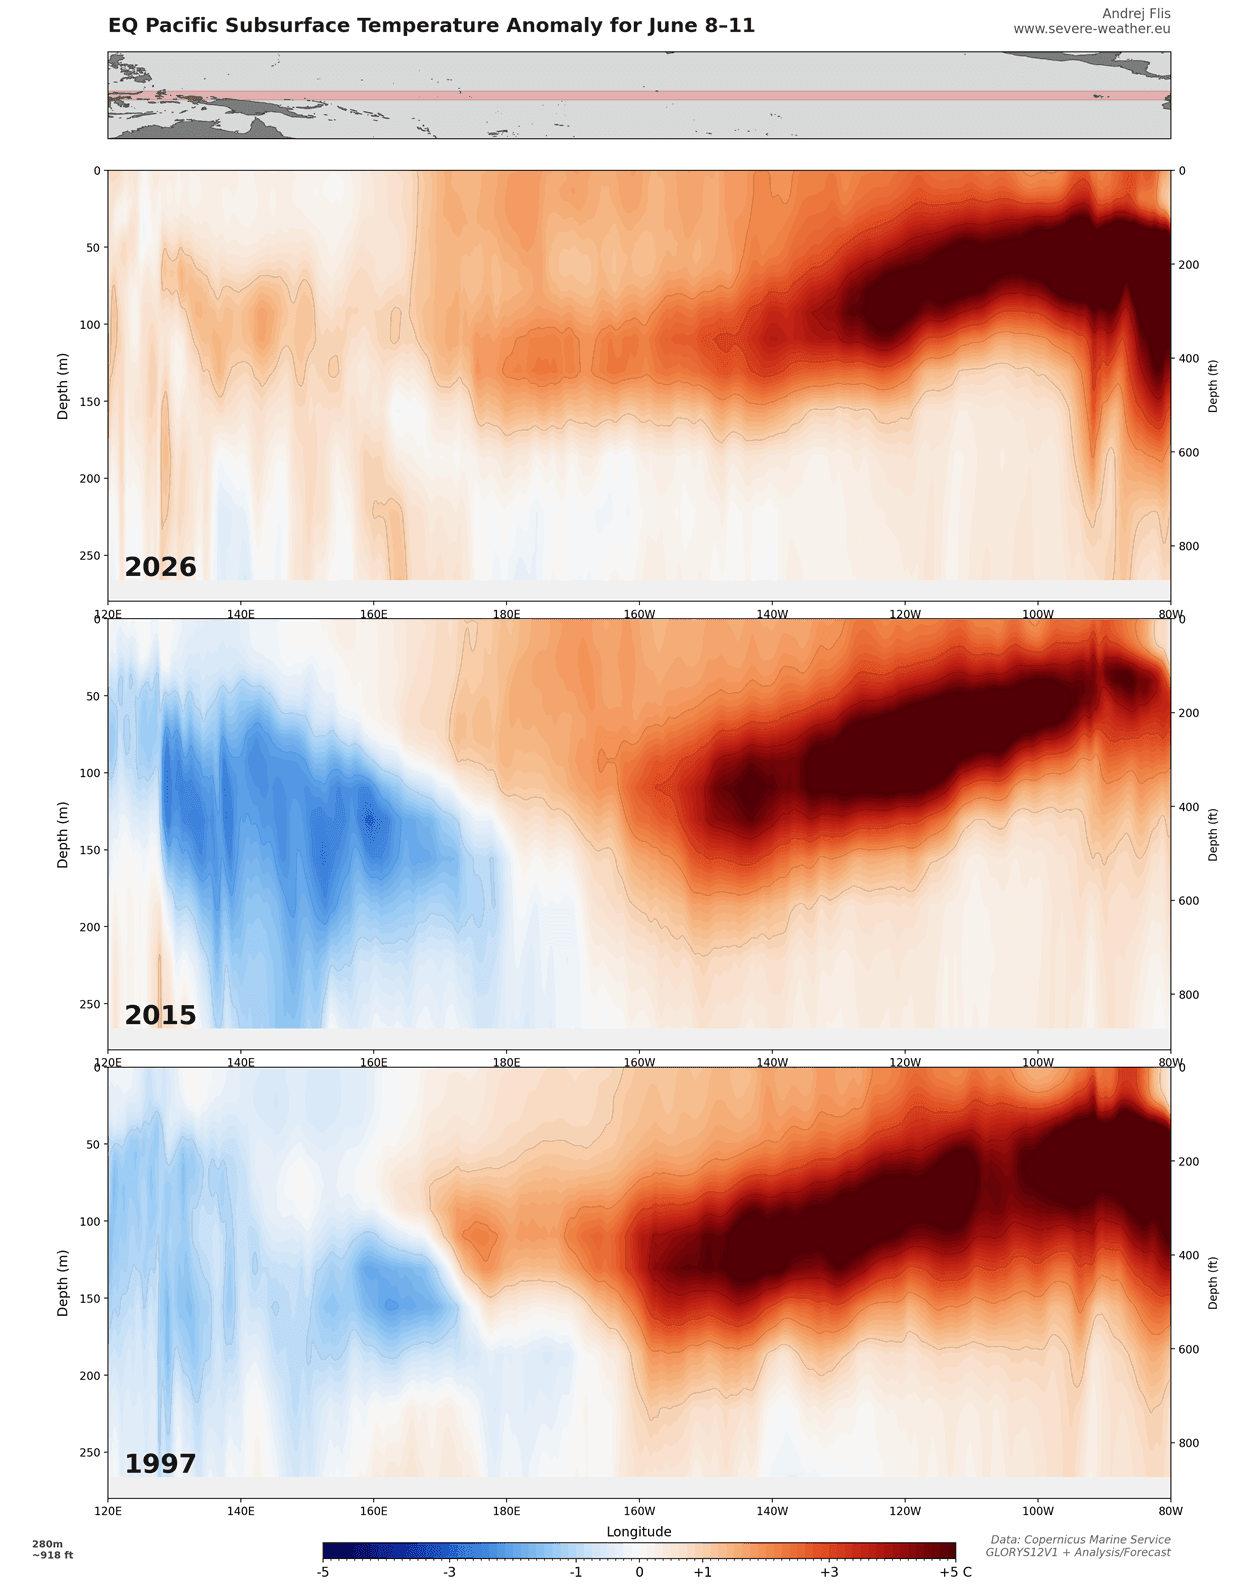
This shows that the warm supply from the west still has some energy, so it’s likely the Kelvin Wave will continue to develop.
These subsurface Kelvin waves are driven by the westerly wind bursts or weaker trade winds, pushing the warmer subsurface ocean waters to the east, where they rise to the surface. This is a clear case of how the atmosphere can drive broad ocean changes.
With a massive Kelvin Wave rising, it is usually strong enough to raise the sea level as it pushes to the surface, which is what NASA is now detecting across the Pacific.
NASA Detects a Major Sea Level Warning Sign Across the Pacific
During the El Niño development phase, weakening trade winds allow a massive warm Kelvin Wave to surge eastward across the equator. This causes sea levels in the central and eastern Pacific to rise more than 25 centimeters (10in) above normal by late autumn as the warm water physically accumulates and expands.
Below is the latest analysis from NASA’s JPL, using Sentinel-6 satellite data. It shows a broad swath of abnormal sea level rise across the Equator, where warm subsurface waters and westerly winds raise sea levels as an El Niño is in full-scale development.
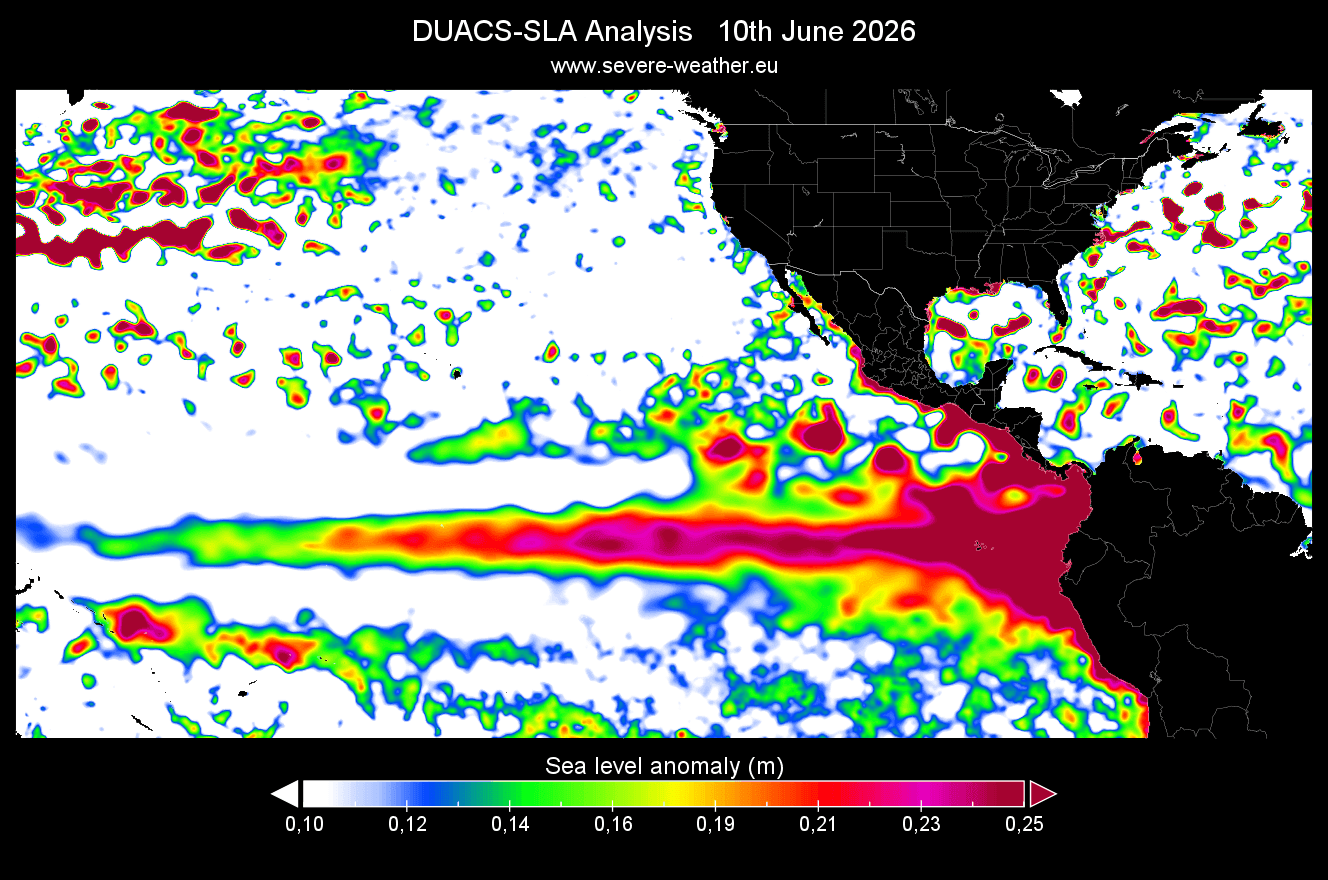
We can compare this to the latest ocean heat content analysis, which reveals the anomaly of the piled-up warm water below the ocean surface, down to 300m (1000ft) depth. It shows a clear El Niño signature and corresponds to areas of sea level rise.
We also produced an image from high-resolution altimeter data, which confirms the observations above and the already large sea level rise anomaly. We see over 25cm (10in) of abnormal sea level rise, confirming that a strong El Niño event is rising to the surface.
The best way to visualize this process of sea level rise is by looking at a high-resolution animation below, produced from the NASA analysis for the past 6 months. It shows sea level height anomalies and how rapidly they began to rise in the wake of a developing super El Niño.
A rapid surge in central and eastern Pacific sea levels signals that a massive ocean heat anomaly is shifting eastward, proving that a powerful El Niño is locking into place. This sudden shift can destabilize the global atmosphere, offering an early warning sign for extreme weather and an altered jet stream several weeks to months in advance.
This reveals strong El Niño momentum, which the forecast data also confirms is heading towards the rare “Super” category.
Latest Long-Range Look: A Super Event for the History Books
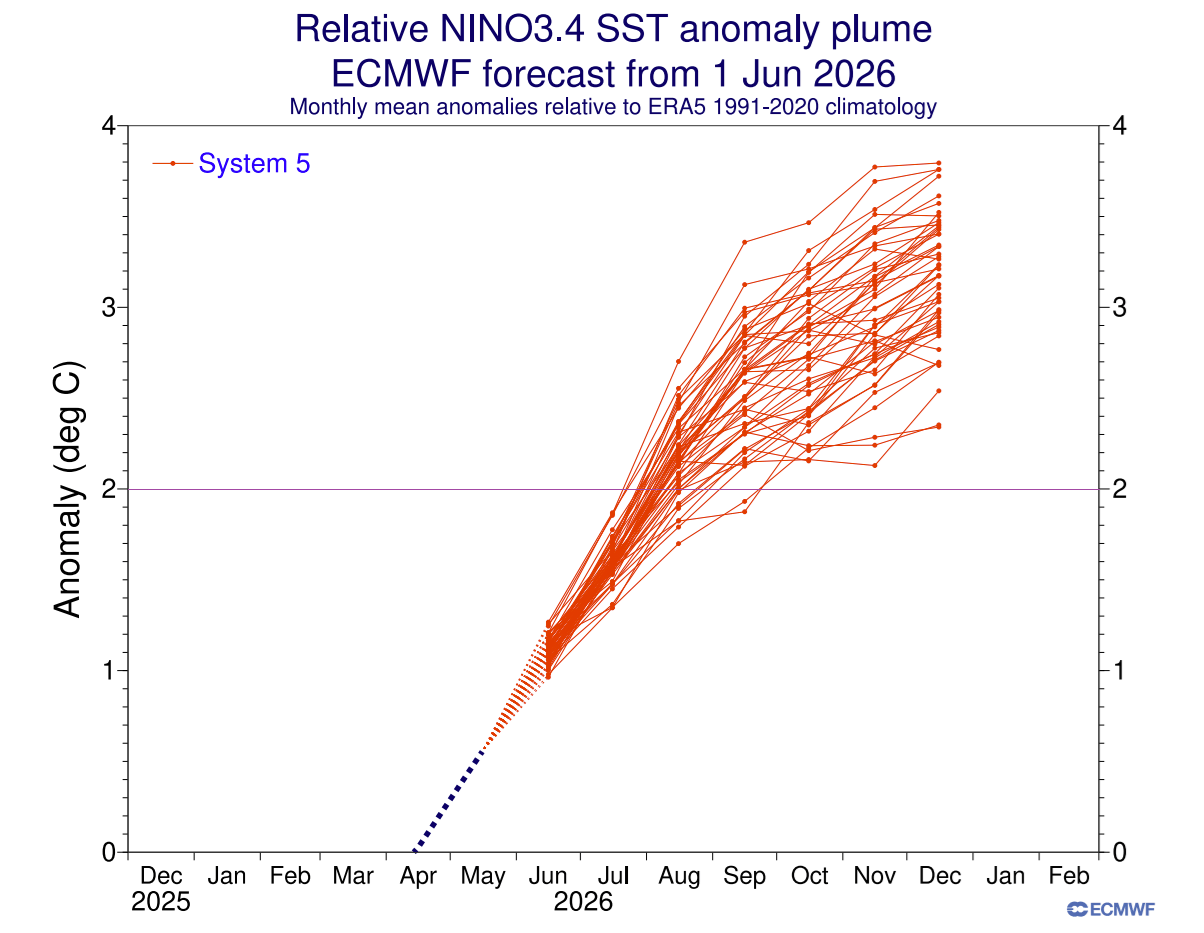
A Super El Niño is scientifically recognized when sea surface temperature anomalies in the Niño3.4 region exceed a threshold of +2.0 or higher above the long-term average. This identifies the strongest events, which usually have a high impact on the atmosphere.
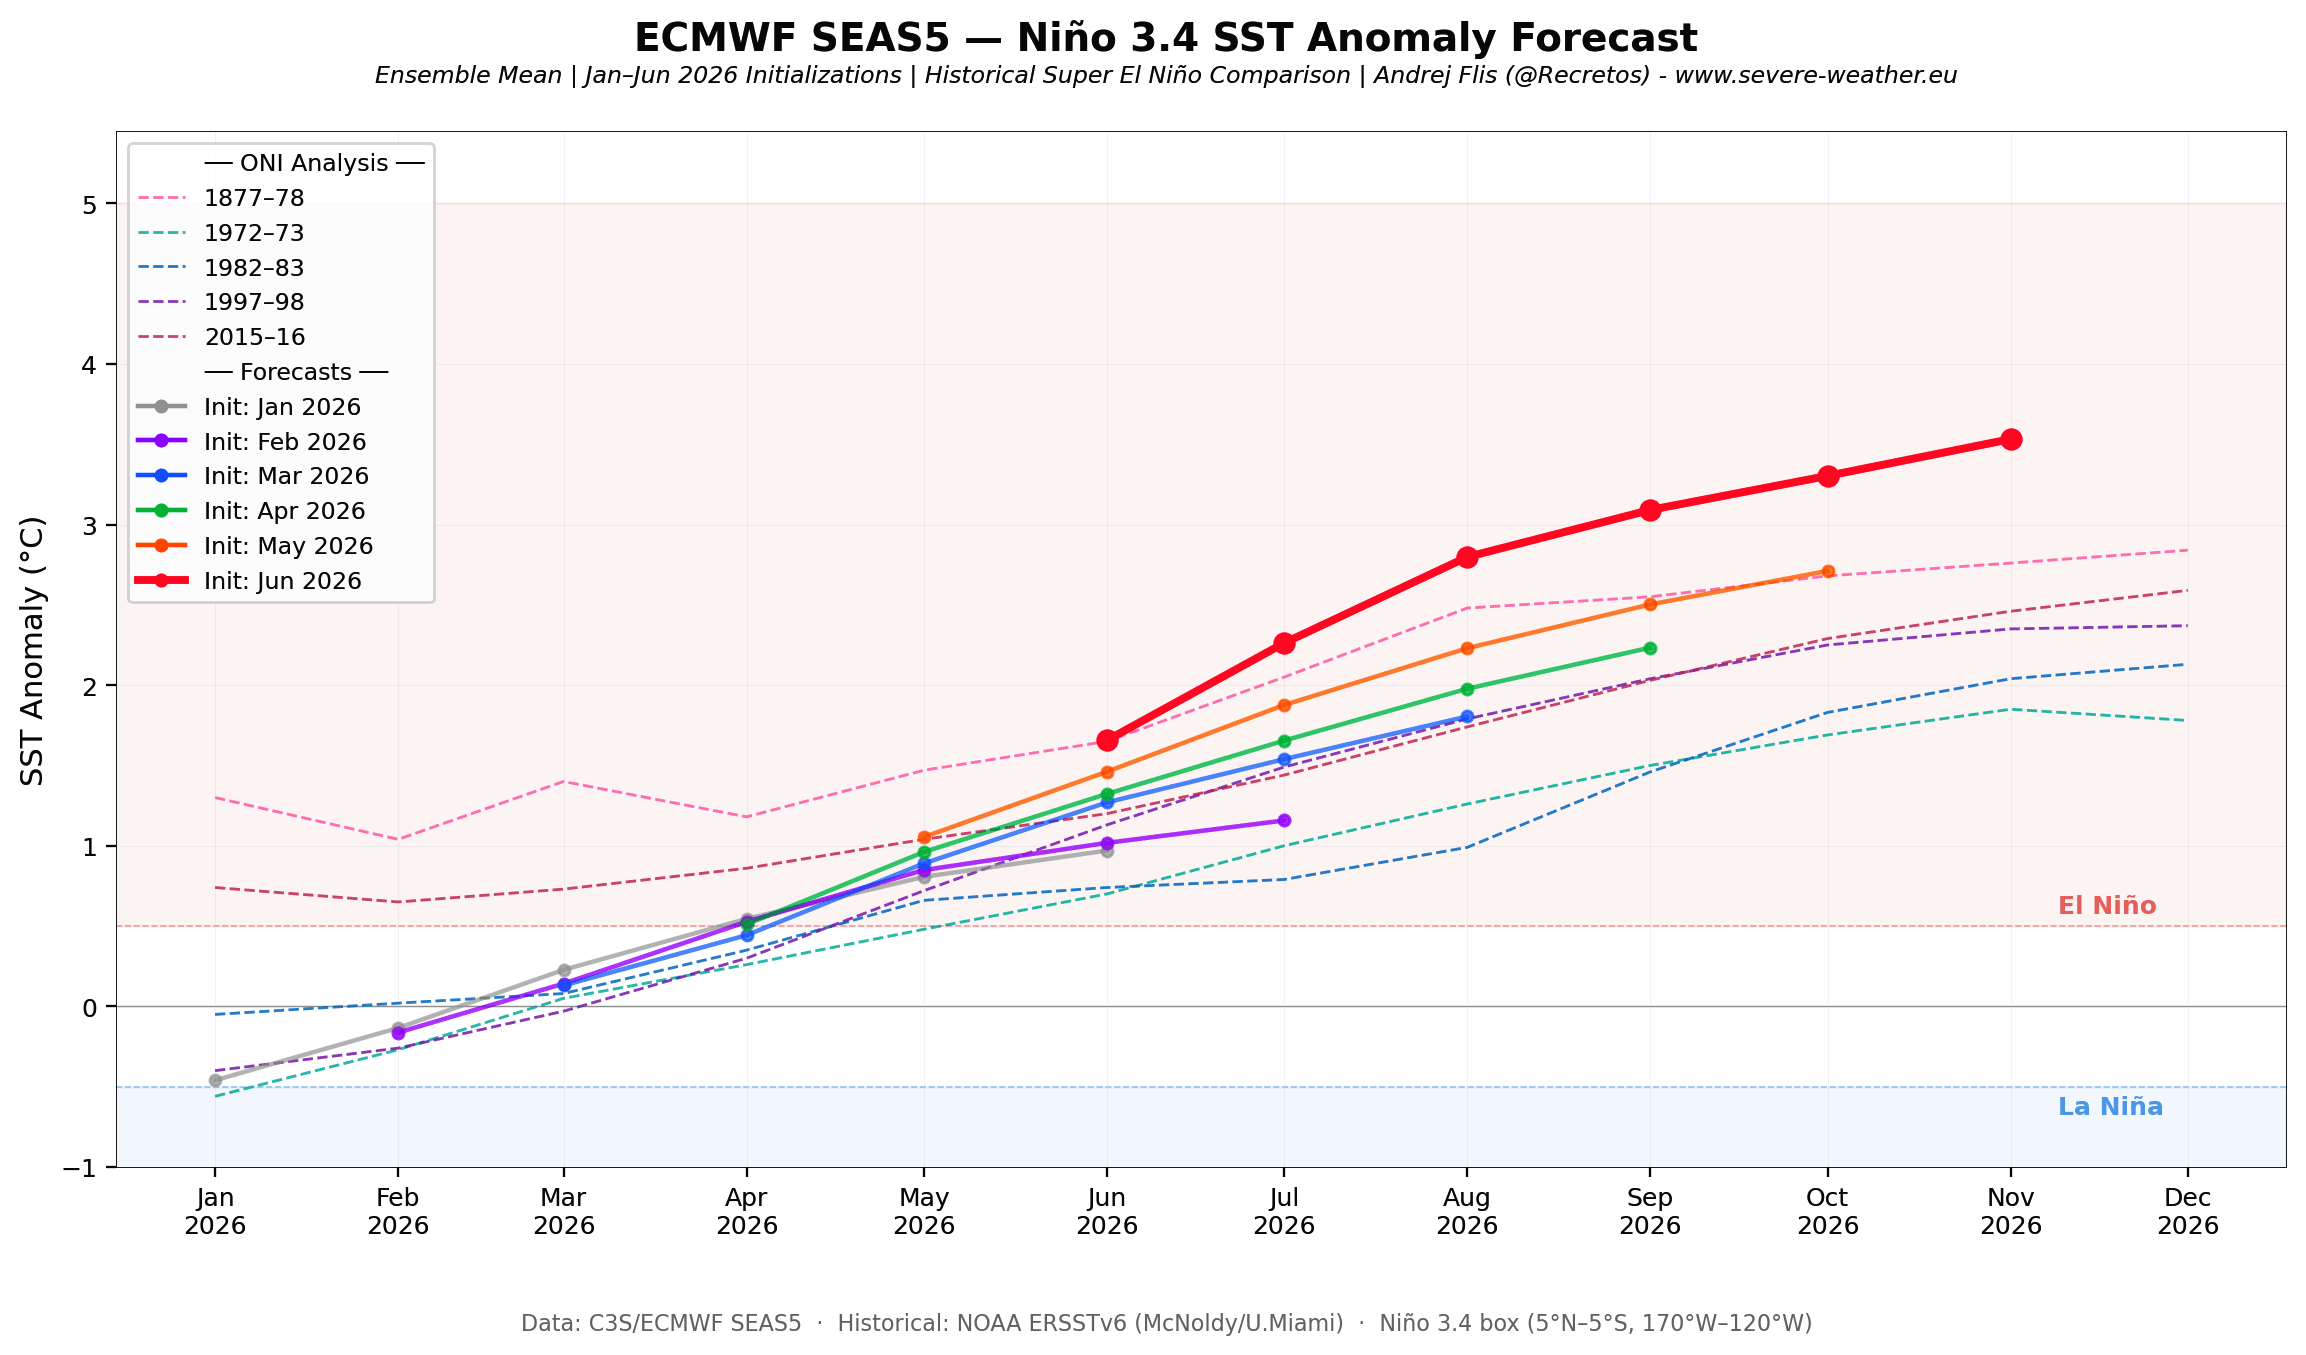
Below is also the latest ECMWF long-range forecast for the next few months. This shows a strong El Niño developing into 2026, with all members exceeding the +2 degrees super-event threshold and pushing it into the extreme event range at +3 values. If verified, this would rival even the strongest El Niño event on record in 1877/1878.
To put that into perspective, we produced a special image showing the last 6 ECMWF forecasts for the ENSO area, with the historical lines for the last super events and the record 1877 event. It clearly shows how each new forecast shows a stronger El Niño developing, rivaling the strongest Super El Niño events of recent history, with the latest run (red line) being the strongest forecast so far.
A Super El Niño event leads to more extreme weather shifts. It can amplify typical seasonal changes into high-impact events, such as massive flooding, severe droughts, and significantly altered storm tracks, affecting weather worldwide.
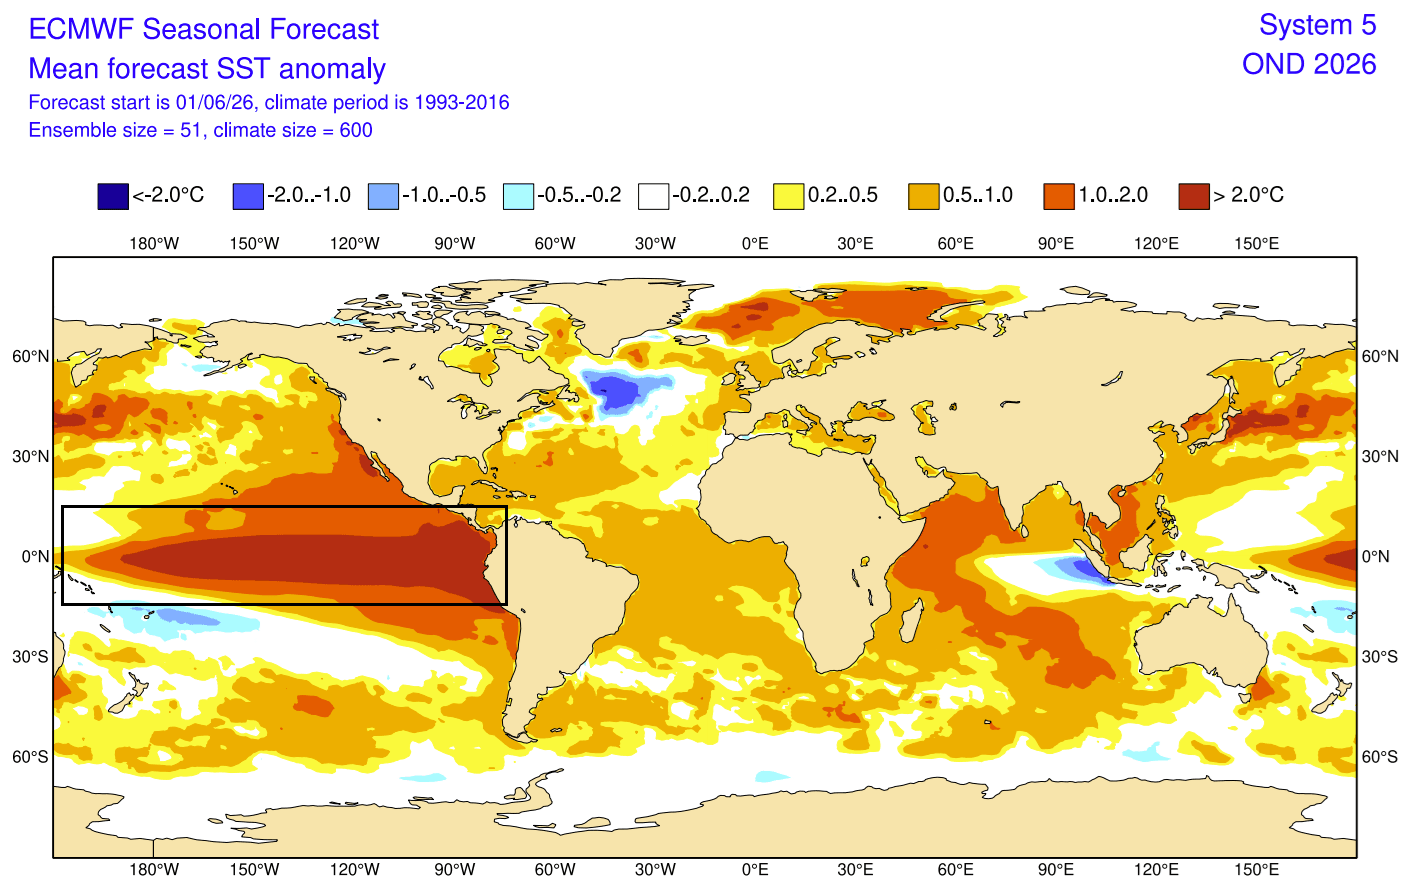
The latest ECMWF forecast for the Fall season shows a strong El Niño anomaly across the tropical Pacific. Anomaly values exceed +2 degrees across the whole ENSO region, with peaks above 3-4 degrees above normal.
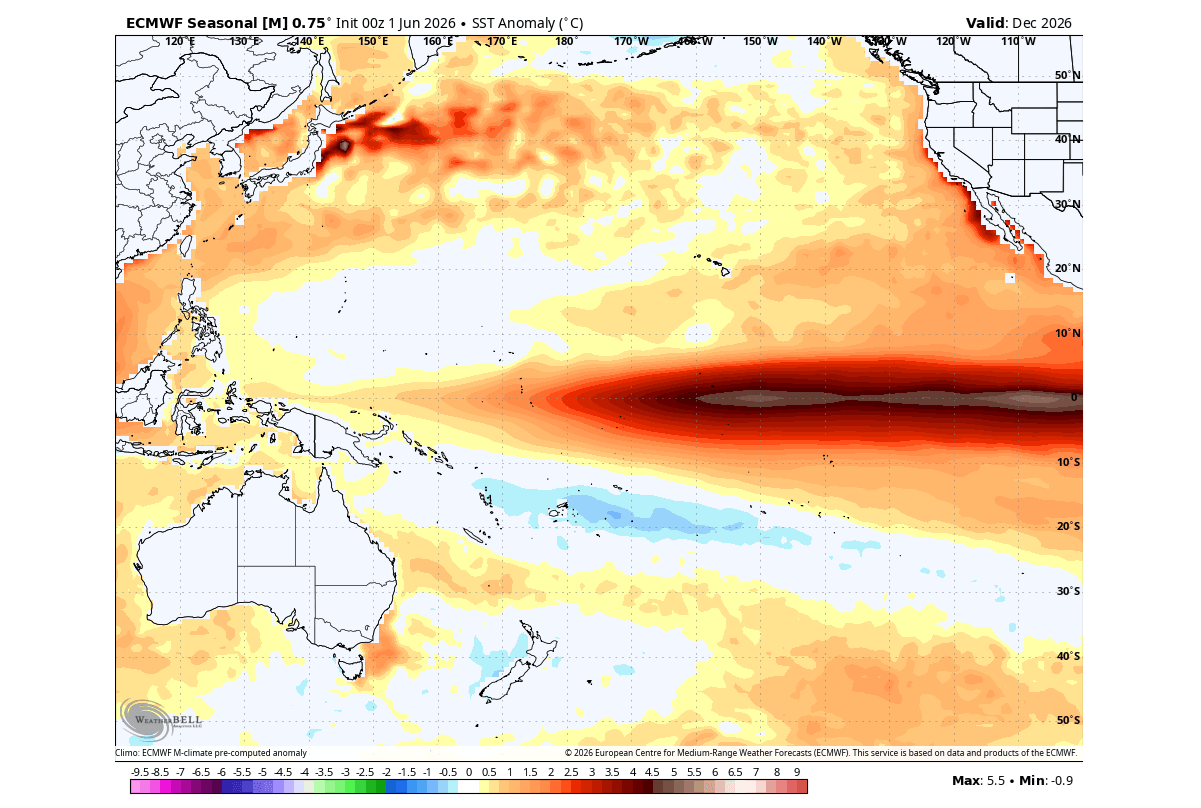
El Niño events usually in late Fall or early Winter. The latest forecast now reaches into early Winter, revealing the ocean temperature anomalies for December 2026. Below you can see a really strong event in the forecast, with anomalies peaking above +5 degrees across the region. If the forecast verifies at this power, it would mean a historically record-strong El Niño event for the 2026/2027 season.
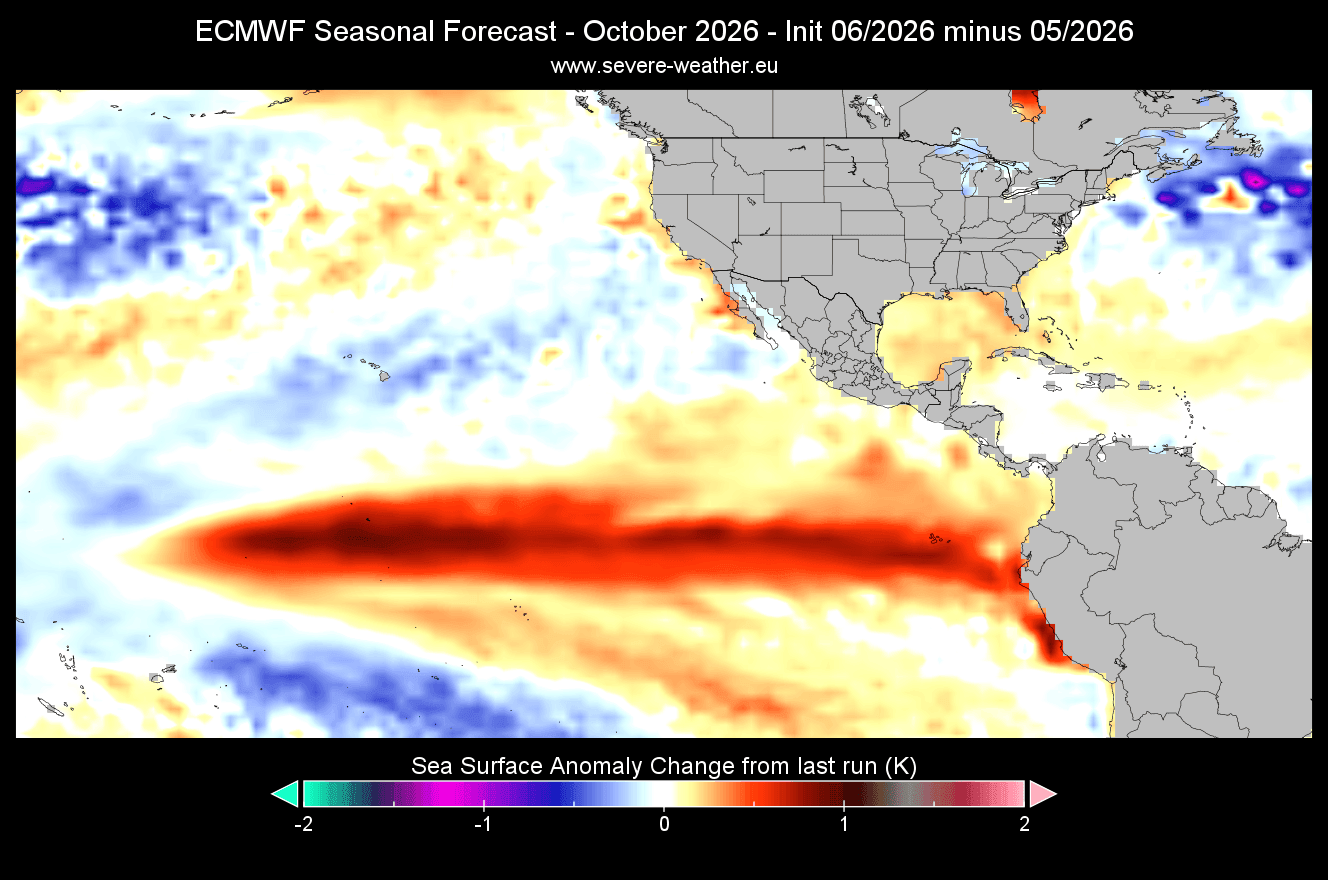
If we compare the ocean temperature anomalies between the latest and previous forecasts, we can look at the data for October 2026. The image below shows how the latest forecast differs from the previous run. And you can see just how much warmer the new forecast is across the equator and ENSO regions, with El Niño over a whole degree stronger in some areas.
This is one of the high-confidence signals that we are about to experience one of the strongest El Niño events in modern history.
But we can already see the atmospheric impacts of the emerging El Niño, which are already appearing over North America.
Atmospheric Response: First Weather Impacts Already Emerging
As the data above shows, El Niño is currently in a rapid intensification phase, which means we can start looking in the atmosphere for the first signs of its arrival.
The first impact is clearly seen in the July 2026 forecast for Velocity Potential. This shows a strong anomaly of rising air in the Pacific and sinking air in the Indian Ocean, which confirms that an El Niño configuration is already present in the atmosphere and the weather.
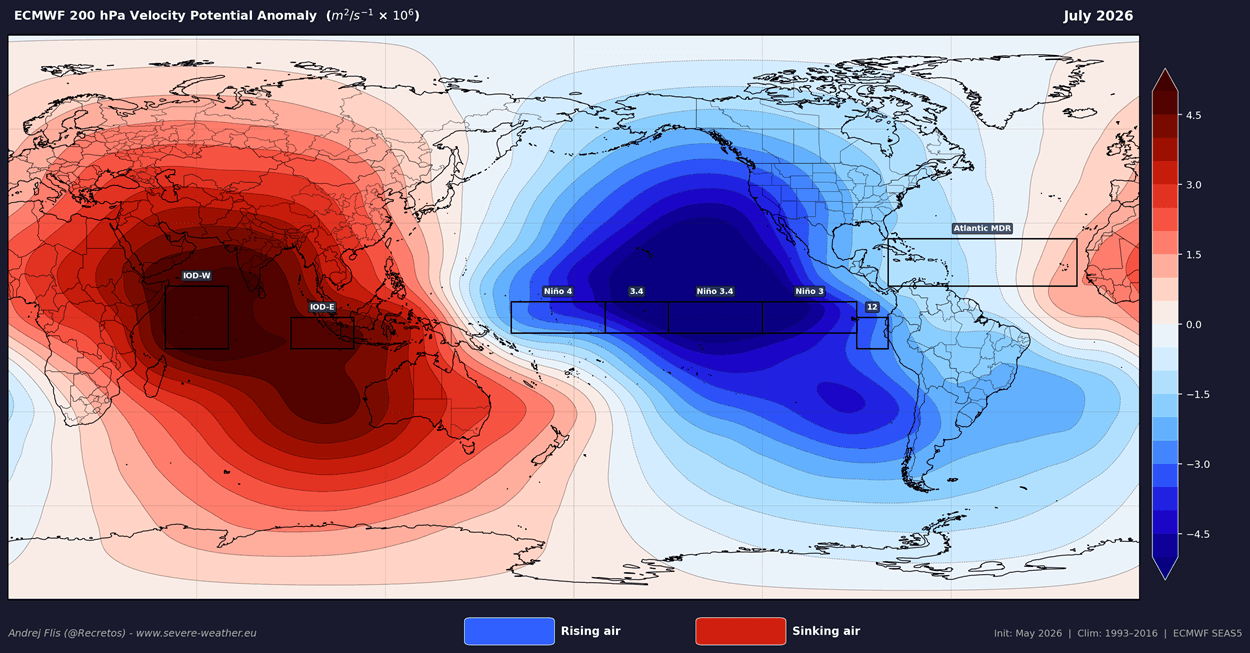
This is the same circulation pattern that you saw in the first part of the article, with heavy lifting in the central and eastern tropical Pacific and subsidence in the west and the Indian Ocean.
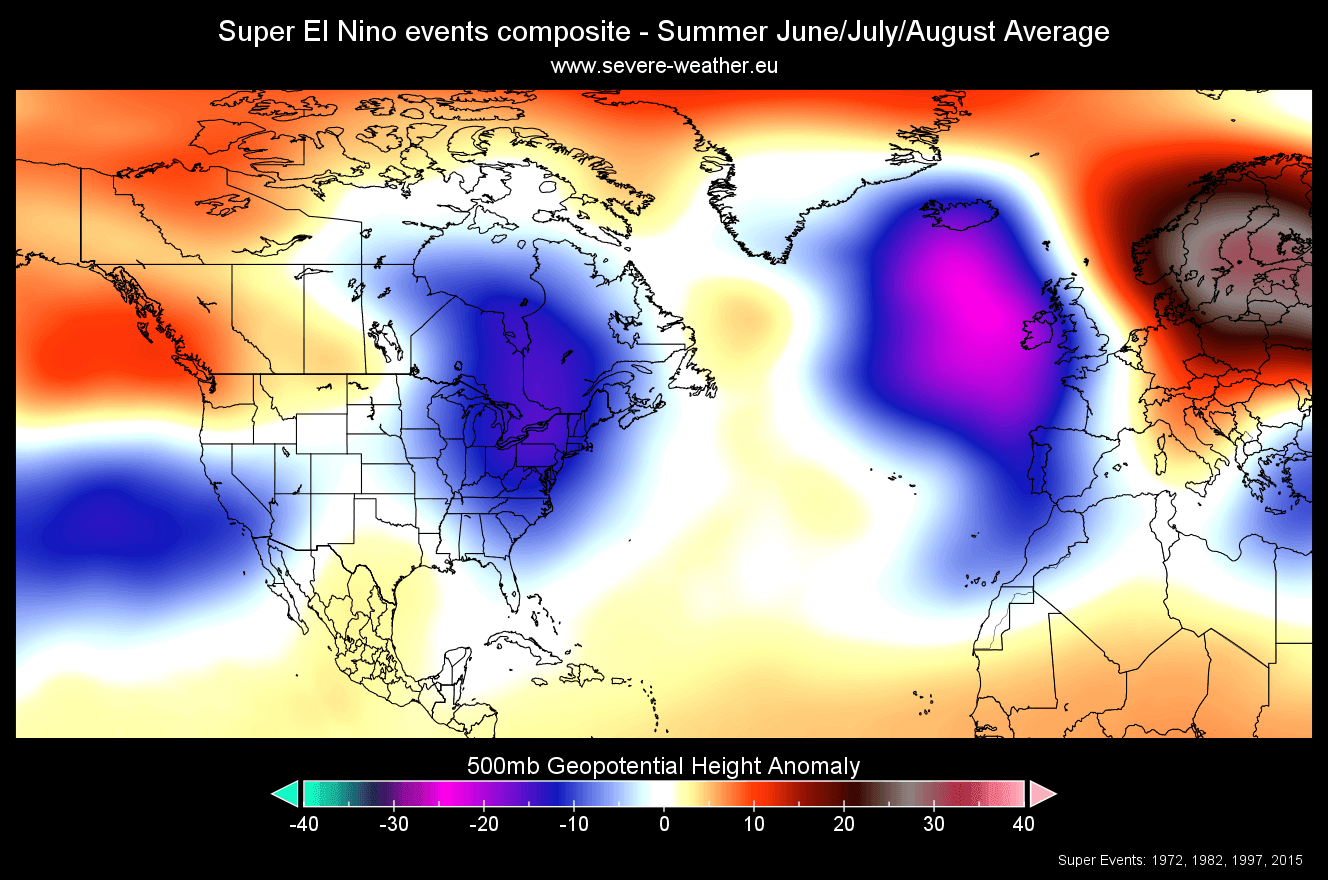
Below is the meteorological Summer pressure anomaly pattern during the start of the Super El Niño years. The reanalysis shows a low-pressure area signal around the eastern United States or eastern Canada, along the west coast of Europe, and in the North Atlantic. A strong high-pressure area is indicated over Europe.
To check whether such a pattern exists now, we can look at the latest 30-day extended forecast from the ECMWF. It shows the prevailing trend, so it should reveal a potential El Niño signal. And the pressure pattern forecast shows that exact pattern over North America, with a low-pressure zone over eastern Canada, impacting the United States as well.
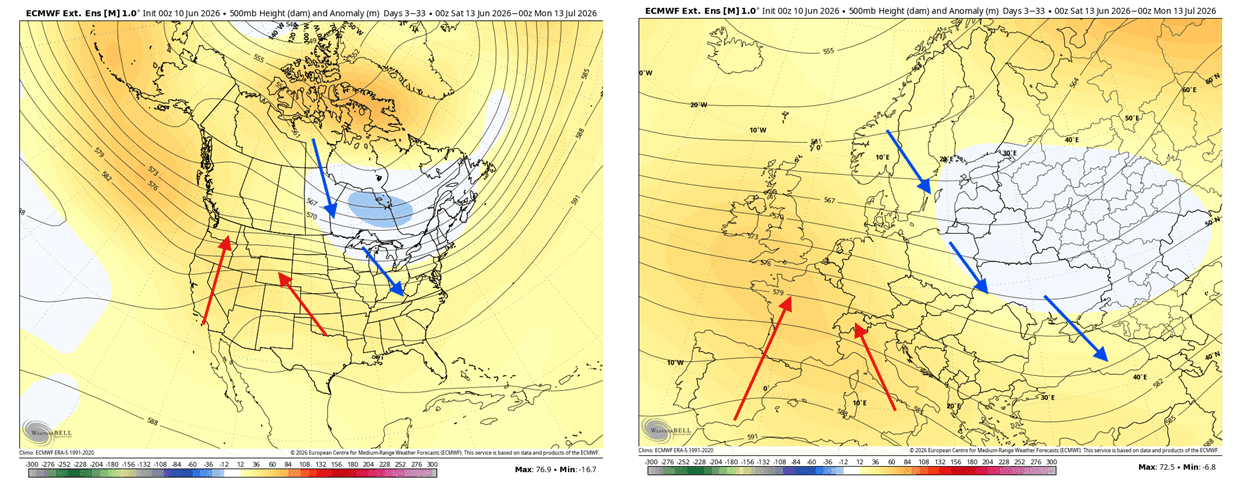
Over Europe, however, the pressure pattern is forecast to be the opposite of the reanalysis. This shows that either the El Niño impact hasn’t reached this far yet, or it is modified by more local factors, such as the North Atlantic pattern.
This is reflected in the temperature forecast below for the same 30-day period. A low-pressure area over the eastern U.S. or eastern Canada supports a more northerly flow, bringing normal or below-normal summer temperatures across eastern Canada, the Midwest, and the northeastern United States. Above-normal temperatures are forecast for the central and western U.S. under a southwesterly flow.
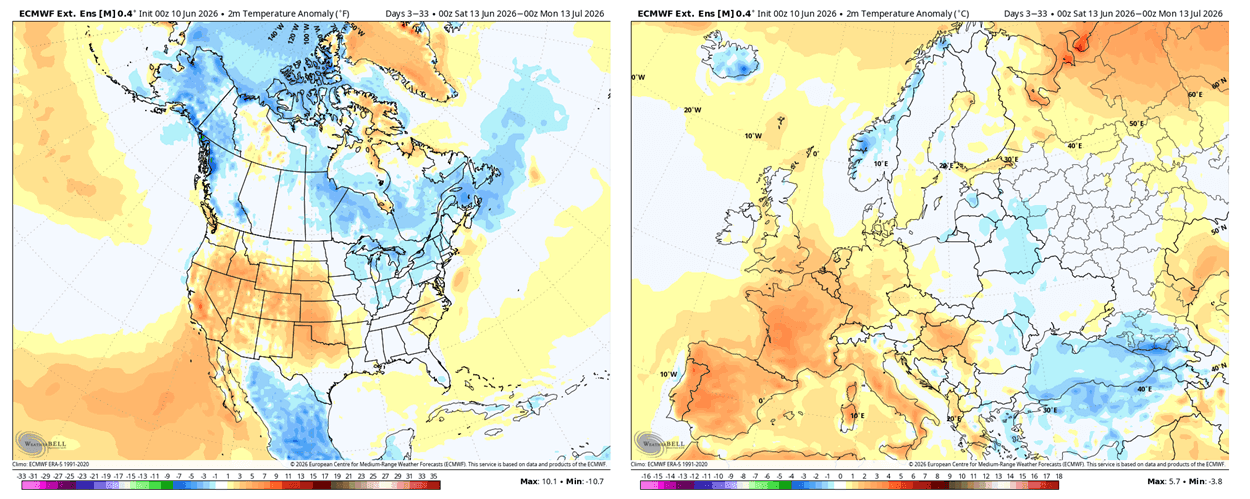
Across Europe, the pattern shows unusually warm weather in the west under a ridge. Temperatures are forecast to drop to normal or below normal towards the east under a more northerly flow, with dynamic weather expected between the two zones.
The 30-day rainfall pattern forecast also reflects a developing El Niño influence, as that usually brings a stronger subtropical jet stream. Data shows more rainfall across the southwest and the eastern half of the United States, as well as southeastern Canada. Less rainfall is forecast over the central and northern Plains and the Pacific Northwest.
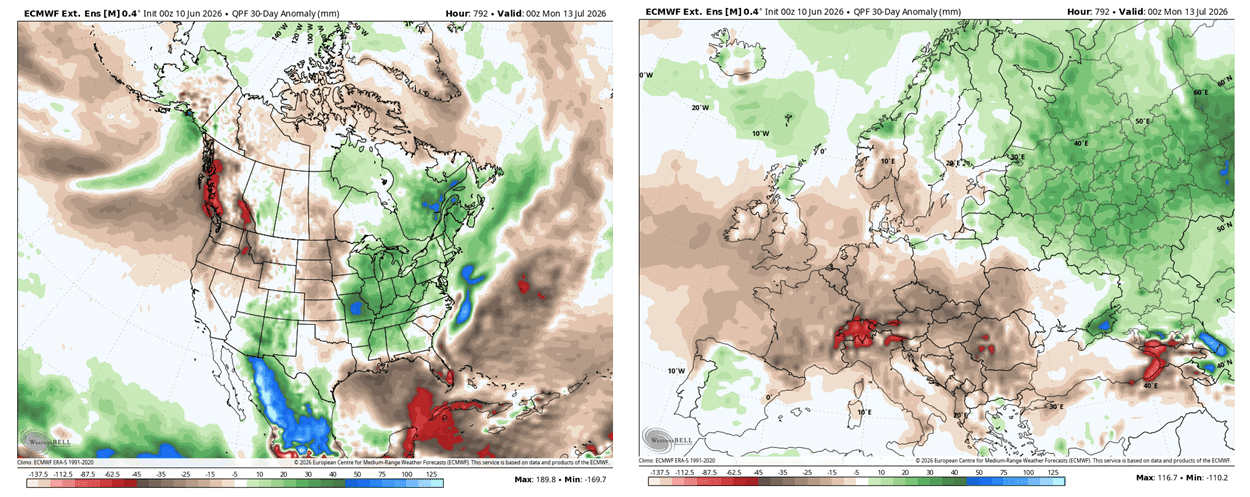
Over Europe, the forecast calls for below-normal rainfall over the central, western, and northwestern parts under the ridge, and more rain towards the far north and east, and over the southwest.
But as mentioned above, the real peak of El Niño comes later, during Fall and Winter. And the latest round of long-range forecasts shows a strong textbook El Niño signature.
Fall Outlook: Super El Niño Takes Control
During an El Niño cold weather season, we usually see a strong, persistent low-pressure area in the North Pacific. That pushes the polar jet stream further north, bringing warmer-than-normal temperatures to the northern United States and western Canada, but colder temperatures to the east. Below is an El Niño weather schematic, but it more reflects the usual winter pattern. However, the base pattern is also similar in the El Niño Fall season.
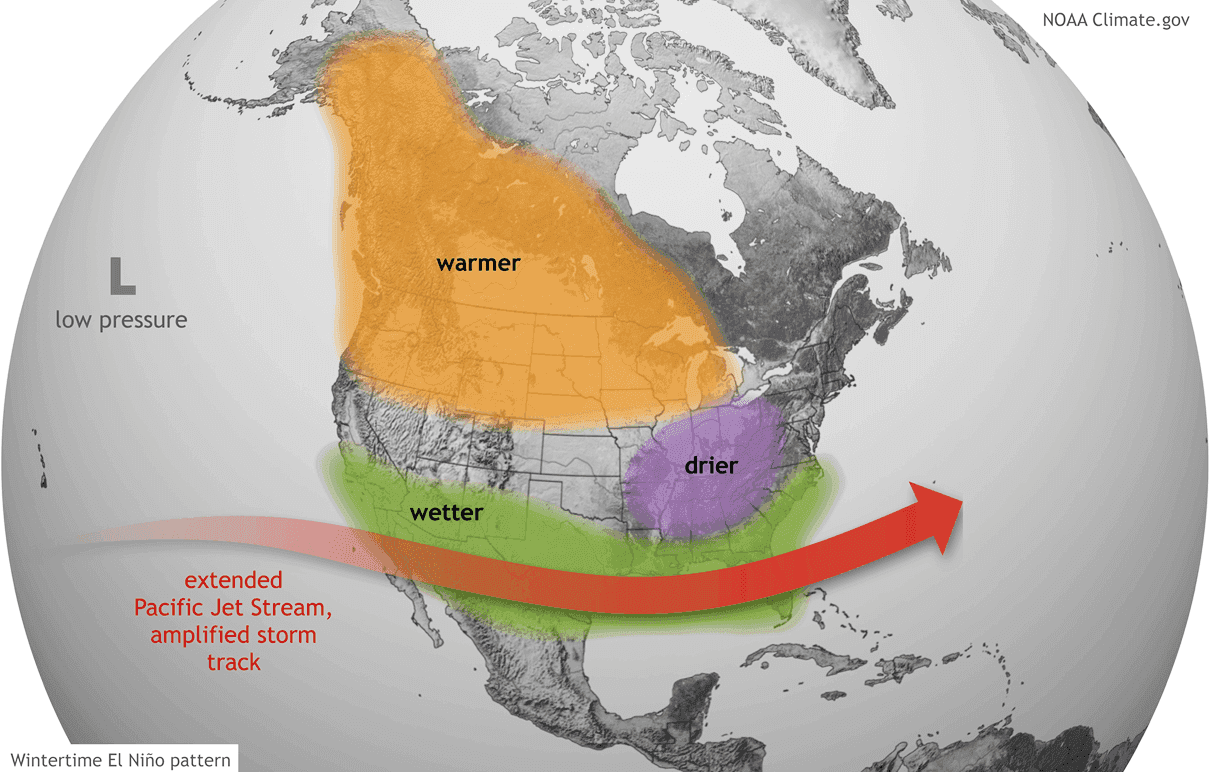
The southerly Pacific jet stream also gets amplified during an El Niño. That means more low-pressure systems and storms over the southern half of the United States, with lots of precipitation and cooler weather spreading east.
Below is the latest 500mb pressure anomaly forecast for Fall 2026 by ECMWF. You can see a strikingly clear El Niño pattern over the Northern Hemisphere. The main low-pressure zone in the North Pacific, a high-pressure area over Canada, a low-pressure area with the subtropical jet over the United States, and a low-pressure system over northwestern Europe.
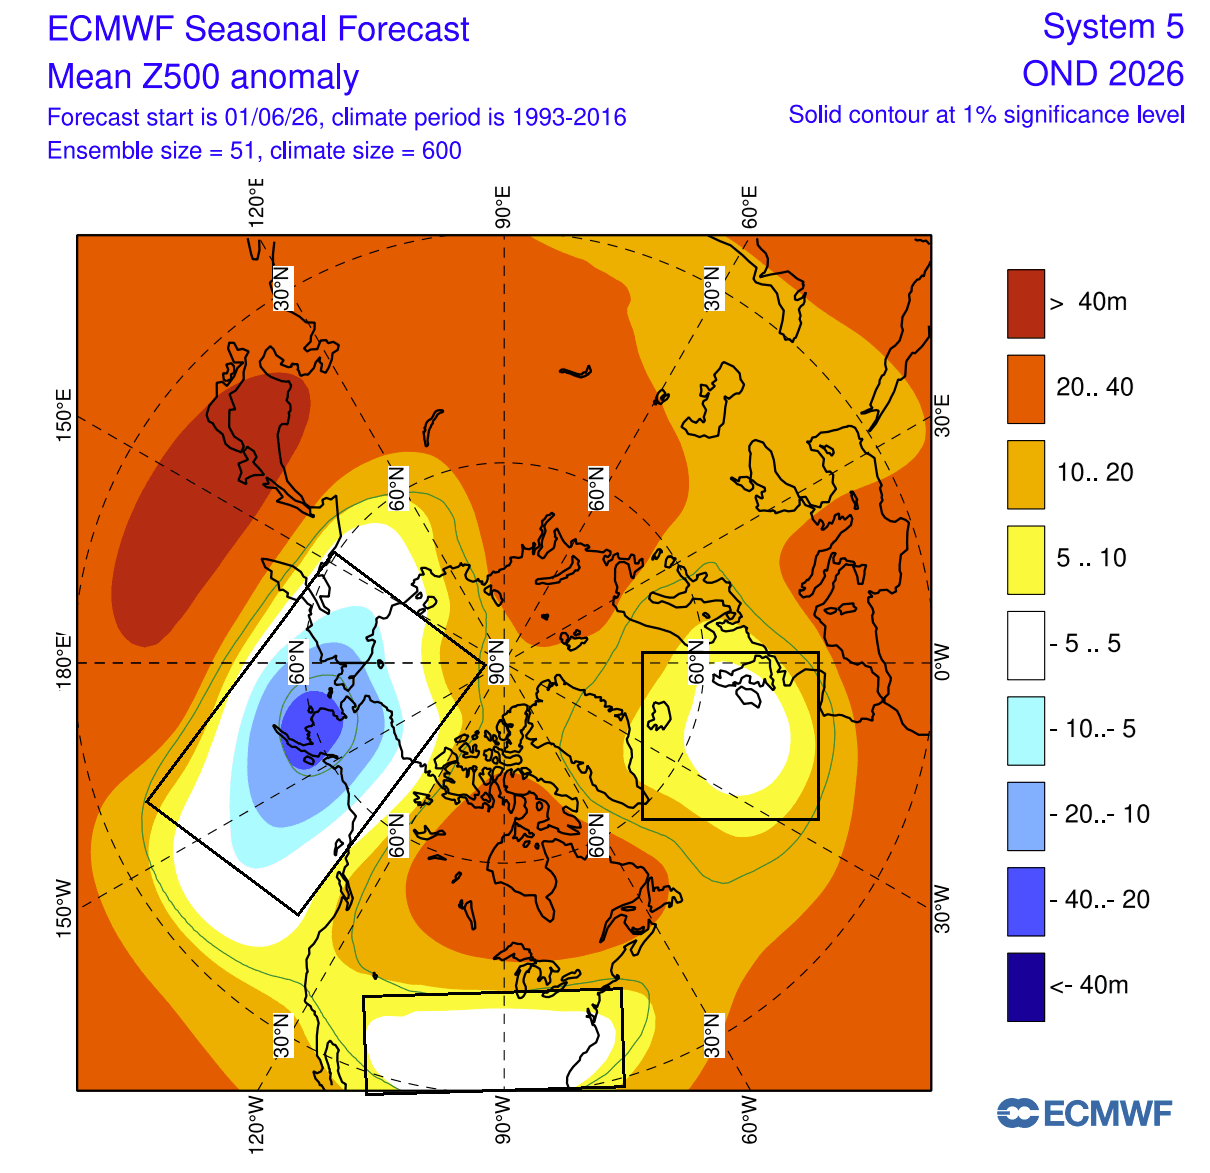
This is very close to a textbook El Niño pattern, with a low-pressure system in the North Pacific/Aleutians paired with a blocking high over Canada.
Looking at the North American weather forecast for Fall, it’s a close match to the schematic pattern above. A large area of above normal temperatures over west-central Canada and northern United States, with normal to below-normal temperatures expected over the southern U.S. and parts of the east.
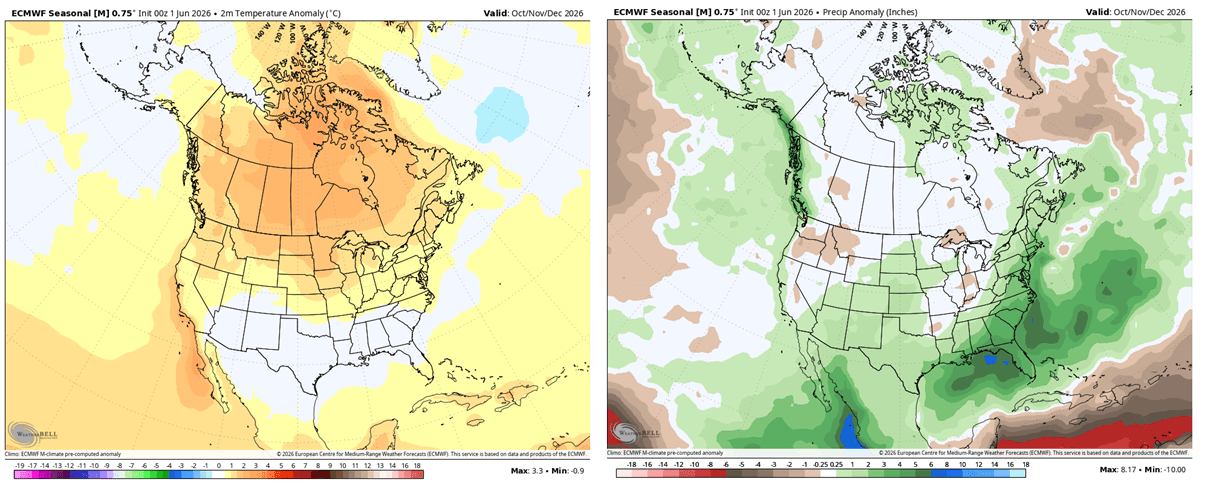
The precipitation forecast also shows the impact of the amplified Pacific jet stream, bringing moisture and rain to the southern half of the United States and extending into the northeastern U.S., the northern Plains, and southeastern Canada. This also reduces rainfall over western Canada, northwestern U.S., and parts of the Midwest.
Over Europe, we see above-normal temperatures over much of the continent. This is driven by the warm southwesterly flow from the low-pressure area to the northwest. Overall, the pressure and temperature patterns are starting to look more similar to the expected Super El Niño pattern over Europe.
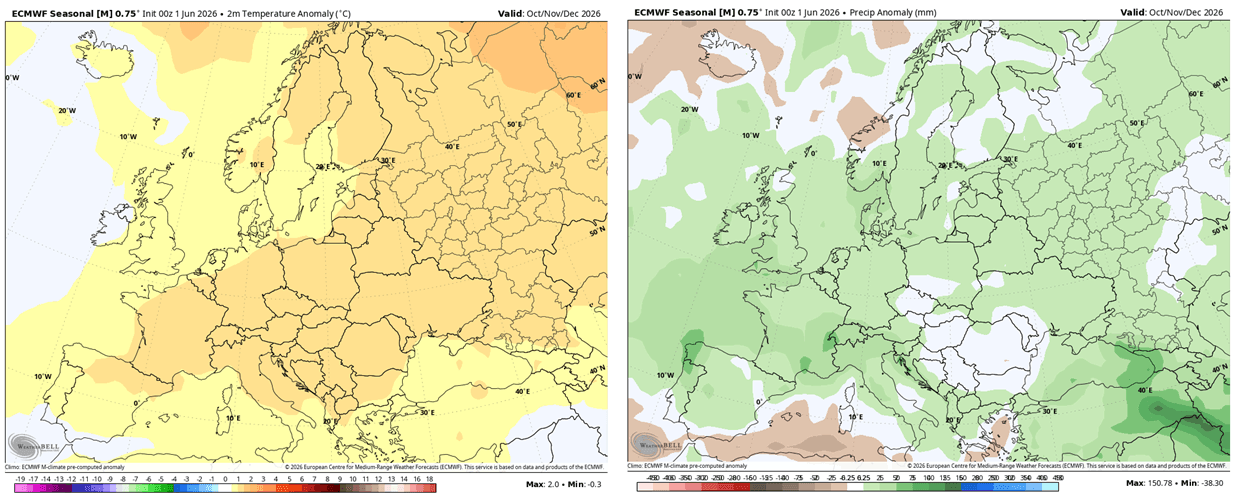
That positioning of the low-pressure zones also brings moisture from the west and southwest, helping to boost rainfall across a large part of the continent.
Forecast and analysis images in this article are from cyclonicwx.com, Copernicus EU, and WeatherBell, using a commercial license.
We will keep you updated on global weather development and long-range outlooks, so bookmark our page. Also, if you have seen this article in the Google App (Discover) feed, click the like button to see more of our forecasts and our latest articles on weather and nature in general.
Don’t miss: