A rare Atlantic Niña has appeared in the tropics, just as a powerful Super El Niño continues to build in the Pacific. These two ocean anomalies may look opposite on the map, but their atmospheric impact is pushing in the same direction, creating an atmospheric shield for the United States hurricane season.
This comes from the latest analysis and forecast data, showing a hostile setup for Atlantic hurricane development. It signals higher pressure, sinking air, stronger wind shear, and reduced rainfall across the main tropical development regions.
In this article, we will look at the latest Atlantic and Pacific signals, how they are changing the global atmosphere, and what the forecasts show for the hurricane season and the United States landfall risk. We will also look at why a quieter hurricane season can offer early clues about the Fall and Winter 2026/2027 patterns, including the jet stream and even the Polar Vortex.
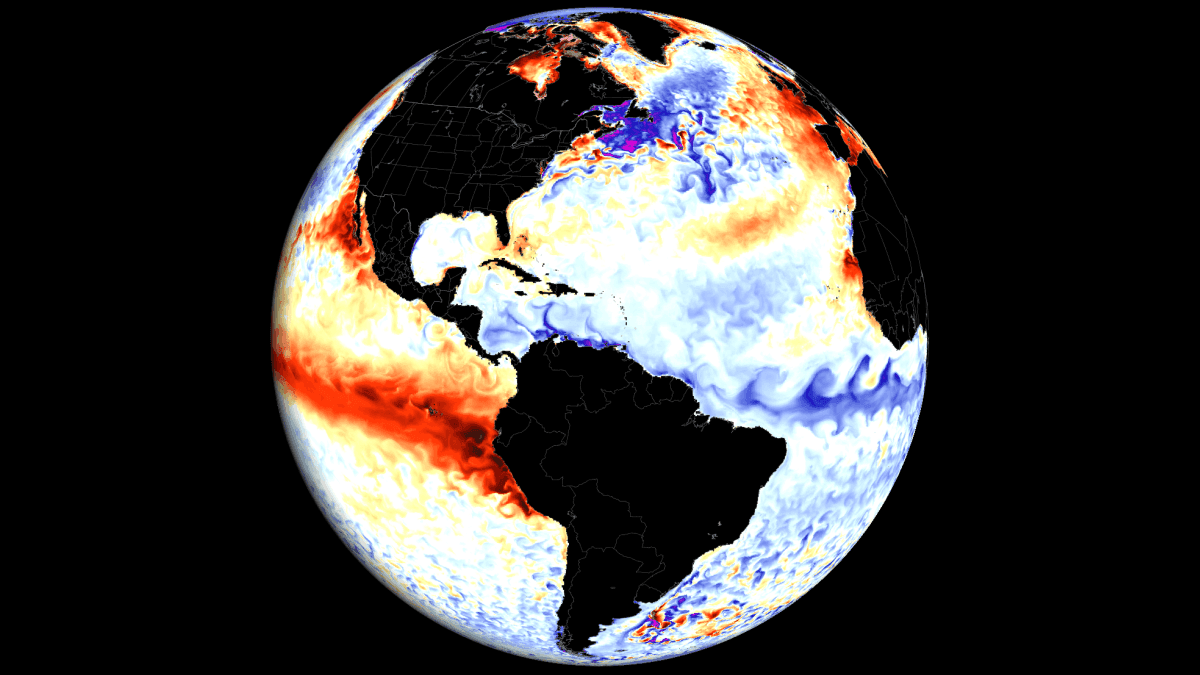
From the Oceans and into the Atmosphere
Ocean anomalies play a very important role in the global weather system. The Atlantic temperature anomalies are known to have direct impacts on the hurricane season and thus on the U.S. But the influence of large Pacific anomalies like the El Niño also extends far into the Winter and Spring seasons across the planet.
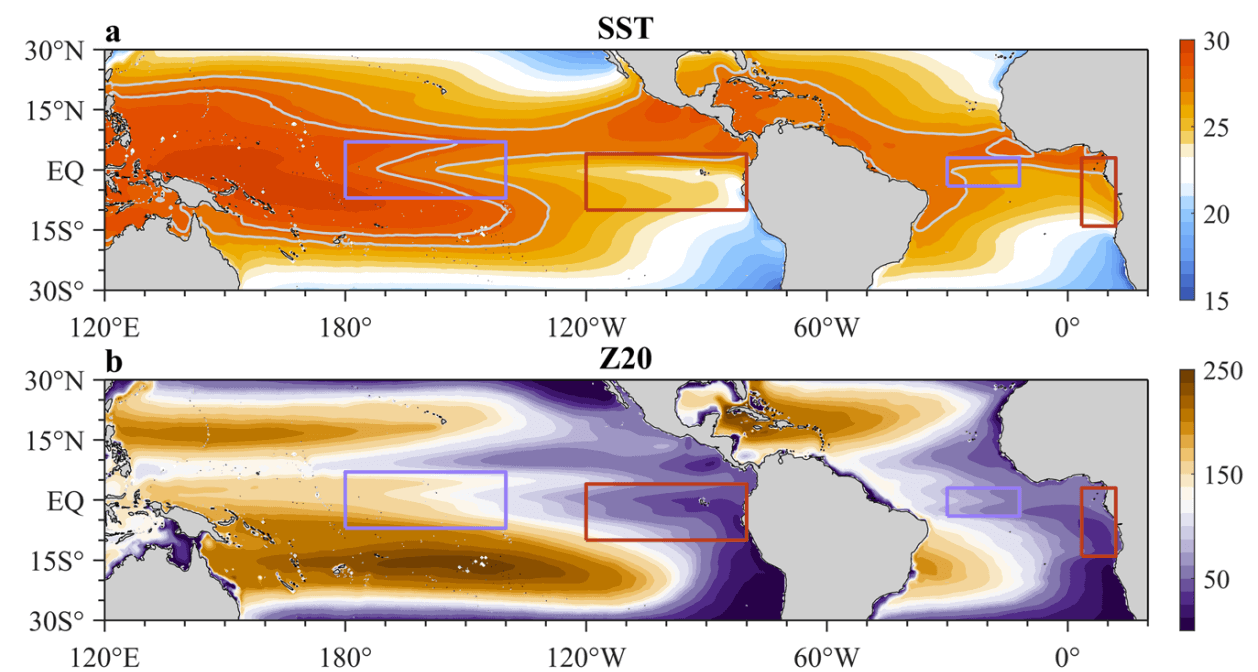
Below is the global average ocean temperature map, where you can see some of the more important regions marked. In the Pacific, we have ENSO regions, where the well-known El Niño event is unfolding. In the central Atlantic, you can see the area where their smaller, much less common versions can develop, named Atlantic Niño/Niña.
The latest ocean analysis below from NOAA CRW shows the main ENSO region already covered in strong warm El Niño anomalies. Peak anomalies in the eastern parts are already 3-4 degrees above normal, which is a very rapid onset of strong anomalies at this time of the year. You can also see the Atlantic Niña event fully visible as a cold area.
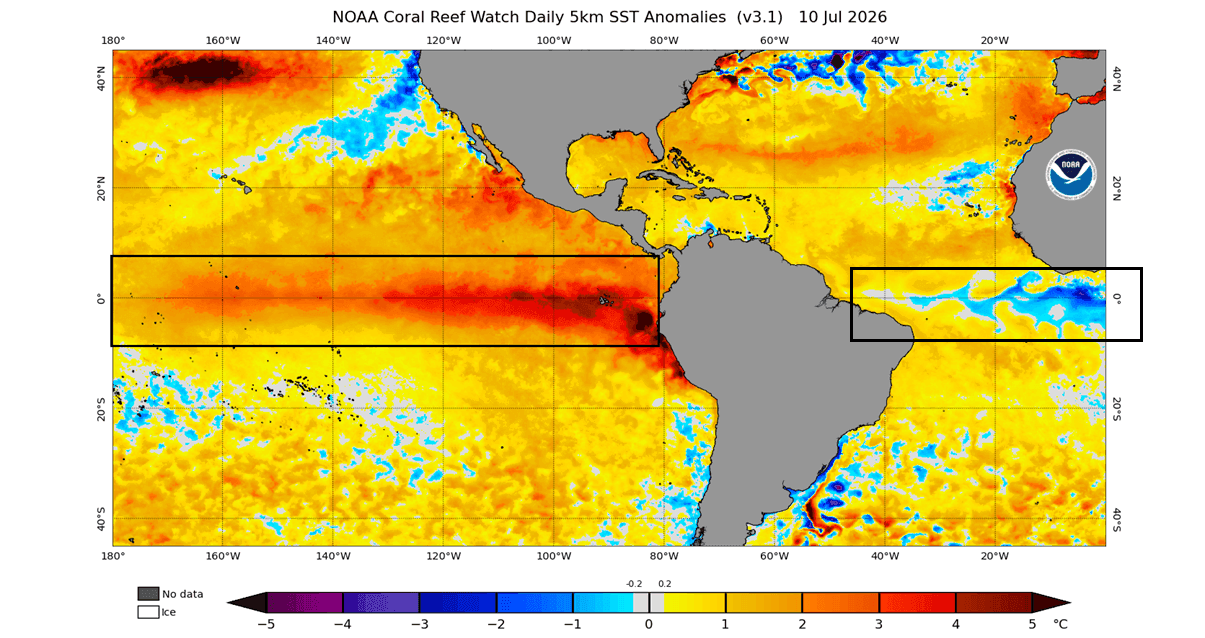
These two anomalies appear to work on opposite poles (warm vs. cold), but they are actually perfectly aligned in their atmospheric impact.
Looking first at the Atlantic Niña area, you can see its main atmospheric influence during the hurricane season and potential United States landfalls. During a cold Atlantic Niña, the number of tropical cyclones is 50% lower than during a warm phase, including also landfalls in the United States.
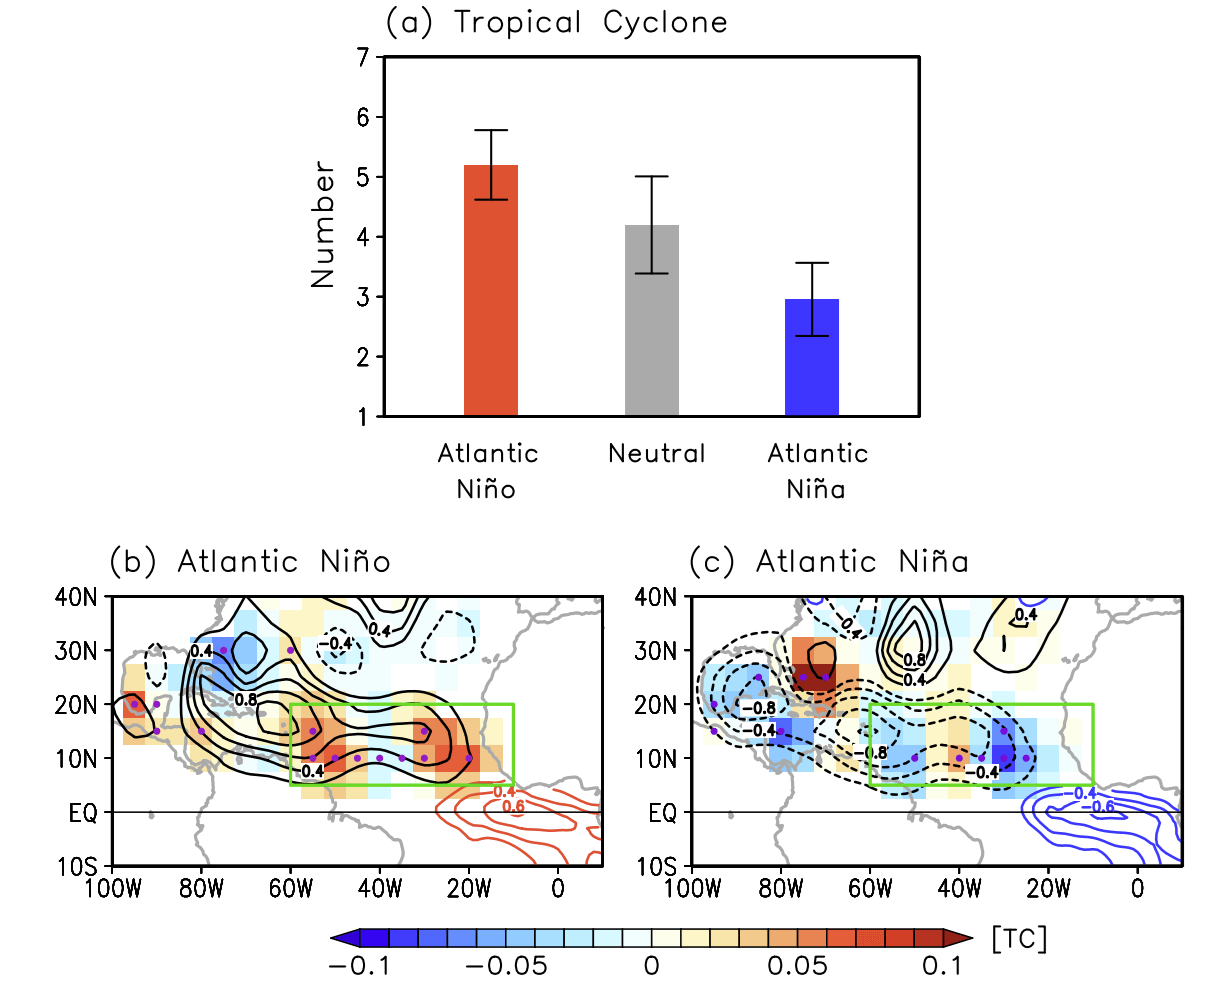
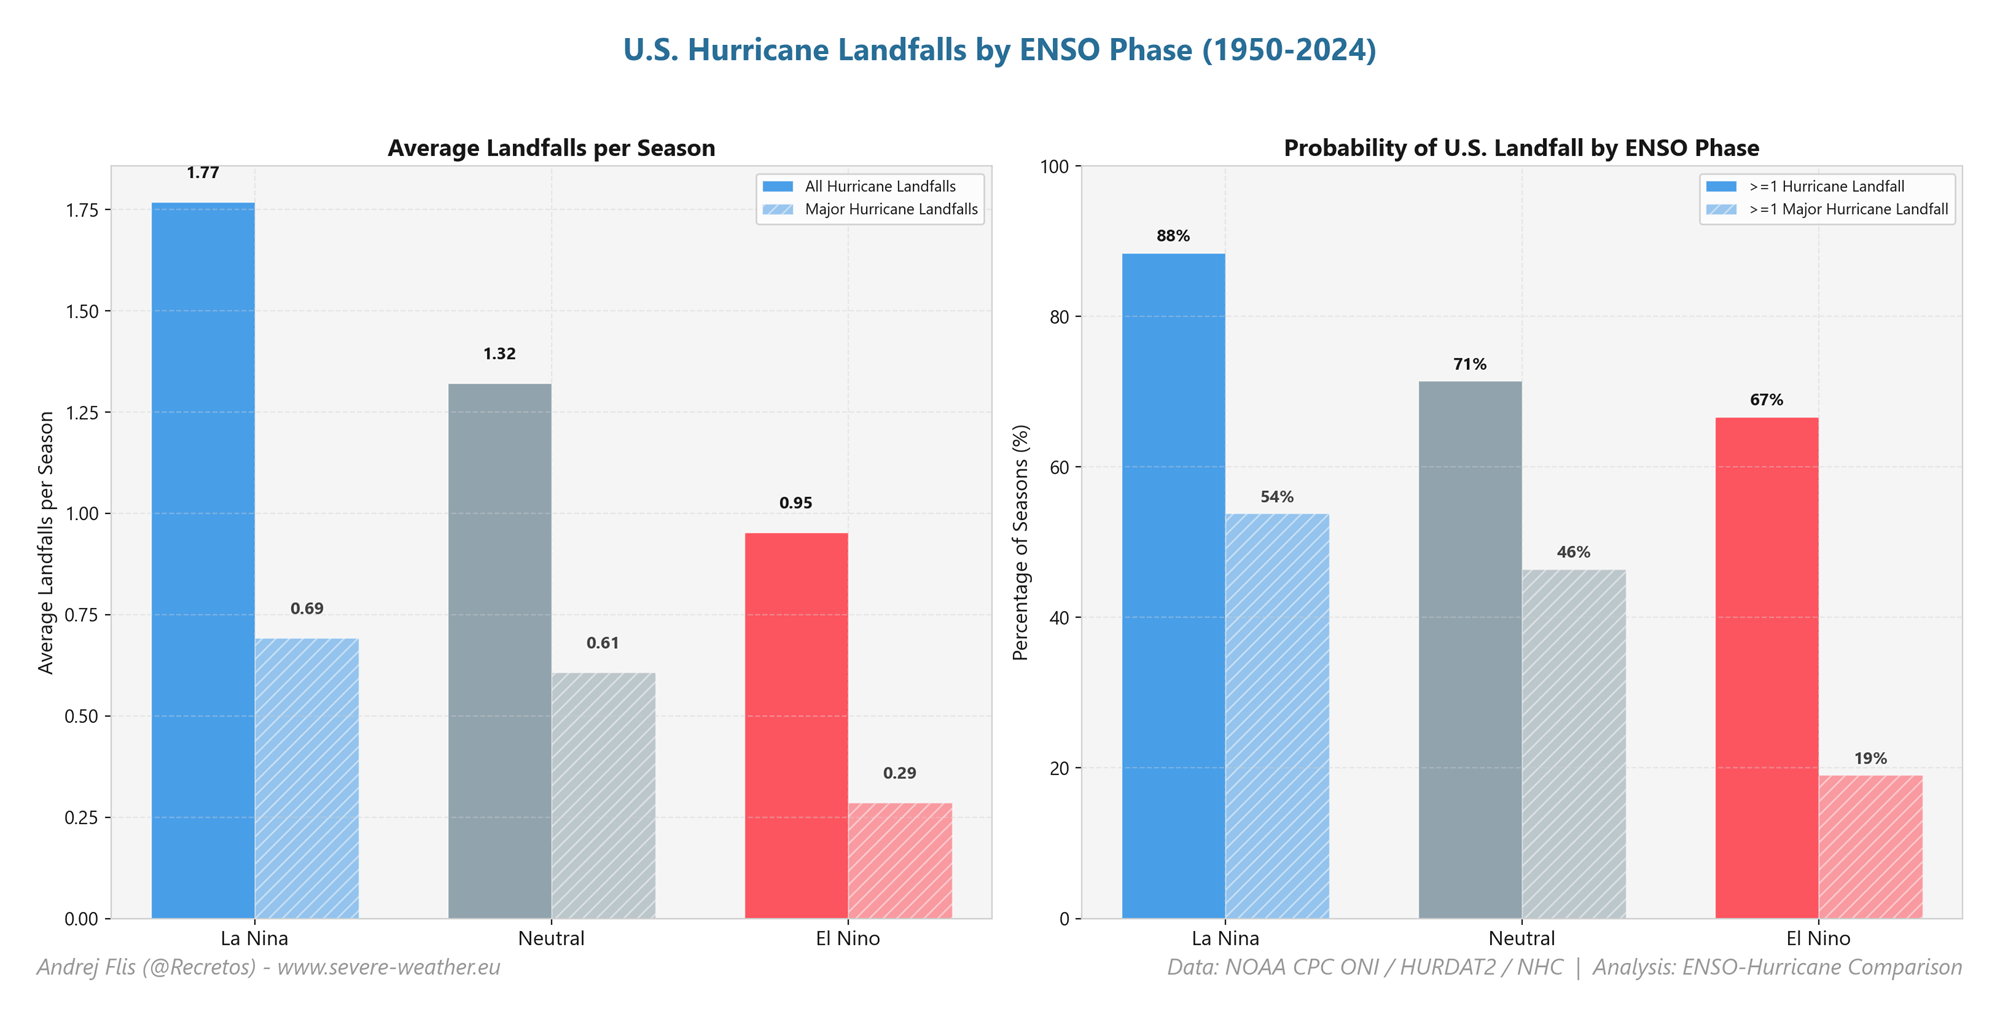
The impact of El Niño on the Hurricane season is also staggering, showing far lower total hurricane landfall numbers than a cold Pacific La Niña phase. The image below shows the number of hurricane landfalls per ENSO phase, with El Niño clearly creating the lowest landfall numbers for the U.S.
All these ocean anomalies are driven by the trade winds. These are easterly winds that circle the Earth near the equator. If they are strong, they typically cool the ocean surface by bringing the deeper, colder waters to the surface (upwelling).
But weak trade winds can allow warm water to pile up, allowing El Niño to form. This means that the resulting ocean anomalies can serve as an “indicator” of the state of the atmosphere, and what to expect from the global weather system.
A Rare Cold Ocean Event Unfolding
Atlantic Niña events are not unprecedented, but strong summer events are relatively rare. If the current cooling persists and the seasonal anomaly ends below −0.5 degrees, the 2026 event would become only the sixth such Atlantic Niña in over 40 years of historical data.
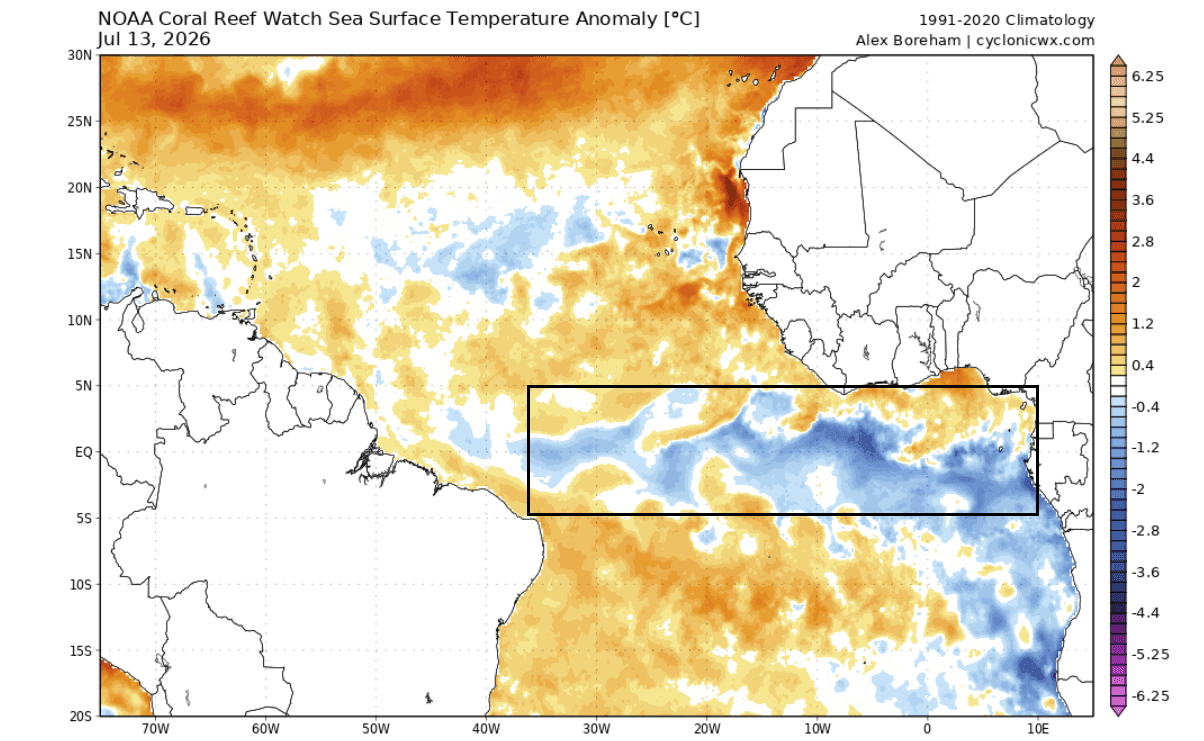
Below is a close-up ocean temperature analysis from CRW data, one of the highest quality ocean analyses. It shows a broad area of cold anomalies, consistent with an Atlantic Niña event. The temperatures in that region are 1-3 degrees C lower than normal, due to boosted trade wind cooling.
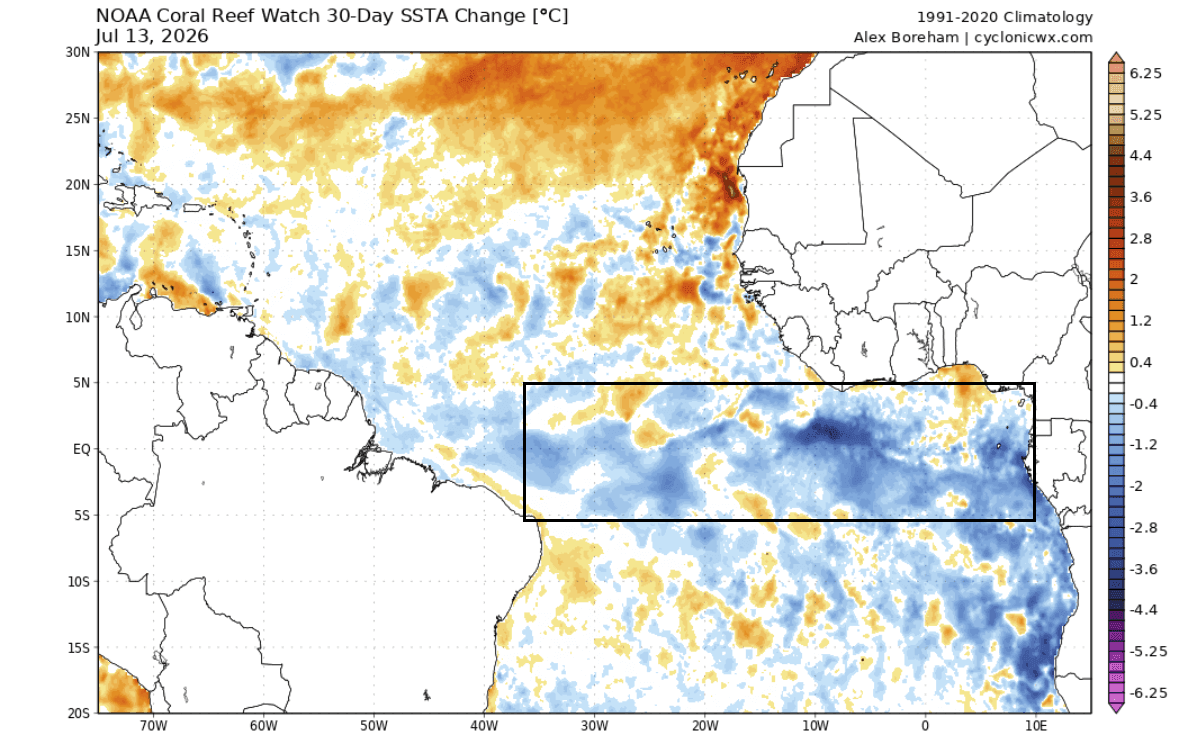
Below is the 30-day anomaly change, which shows the extent of cooling over the last month. You can see the cooling process over a large area of the tropical Atlantic, peaking right over the equatorial region, where the trade winds are strongest.
You can see the overall oceanic changes in the video below, made from NOAA CRW analysis data. It shows the rapid cooling in the tropics, growing the Atlantic Niña event, and, more importantly, the emerging Super El Niño in the Pacific.
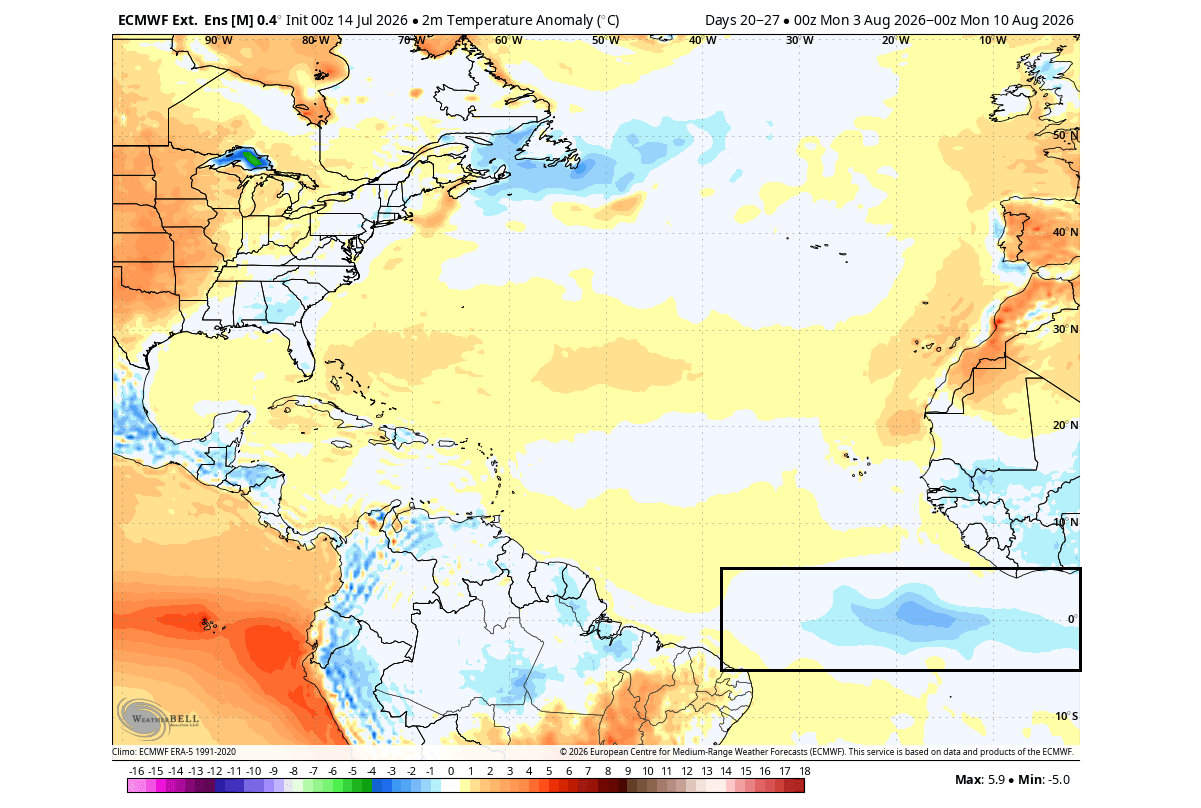
Below is the latest temperature forecast from the ECMWF extended-range forecast. It does not feature a sea-surface field, but we can use the normal temperature forecast for the proper trend. As you can see, it shows a clear negative anomaly over the Atlantic Niña area, extending this event into late August.
On the Pacific side, you can see the strong 4+ degree anomalies in the ENSO region, a result of the still-growing Super El Niño.
Looking at the surface pressure anomalies for the same forecast period (early August), we can see a significant pressure difference between the Pacific and the Atlantic. While a strong, deep low-pressure anomaly is created over the El Niño, a stable high-pressure region sits over the Atlantic Niña.
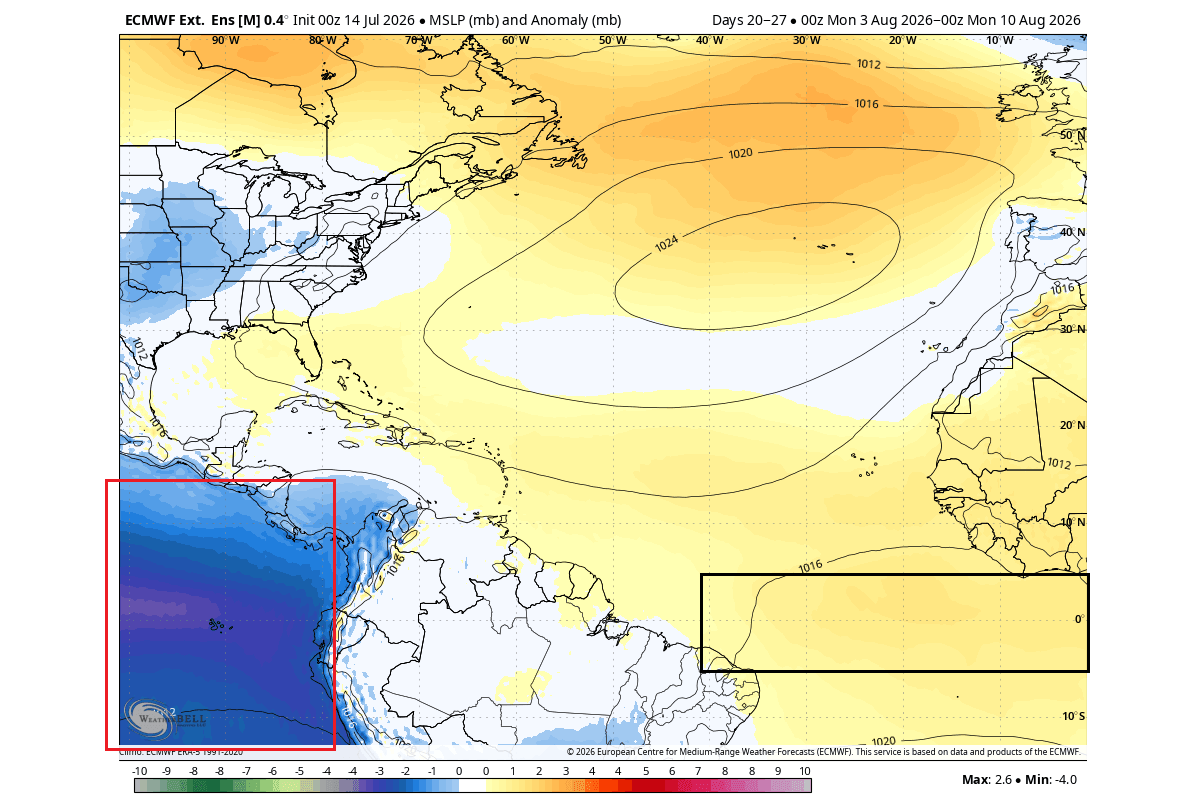
As you can see, these events affect the weather patterns across a large area. But more importantly, they indicate broader changes in the atmosphere.
August also marks the start of the more active period in the Atlantic hurricane season. And with such anomalies in the oceans and the atmosphere, we can expect a clear impact on hurricane formation and landfalls.
Atmospheric Circulation Change on a Global Scale
When observing changes between the ocean and the atmosphere, there is one indicator that tells us right away how the atmospheric circulation is behaving, called the Velocity Potential. This tells us on a large scale, where air is sinking and where it is rising in the atmosphere.
An example of this is shown in the image below: increased storms and rainfall on one side, and reduced storms and drier weather on the other. You can see on the top, how the air is diverging (moving away) and converging (moving together). This movement and rising/sinking of air is referred to as the Velocity Potential.
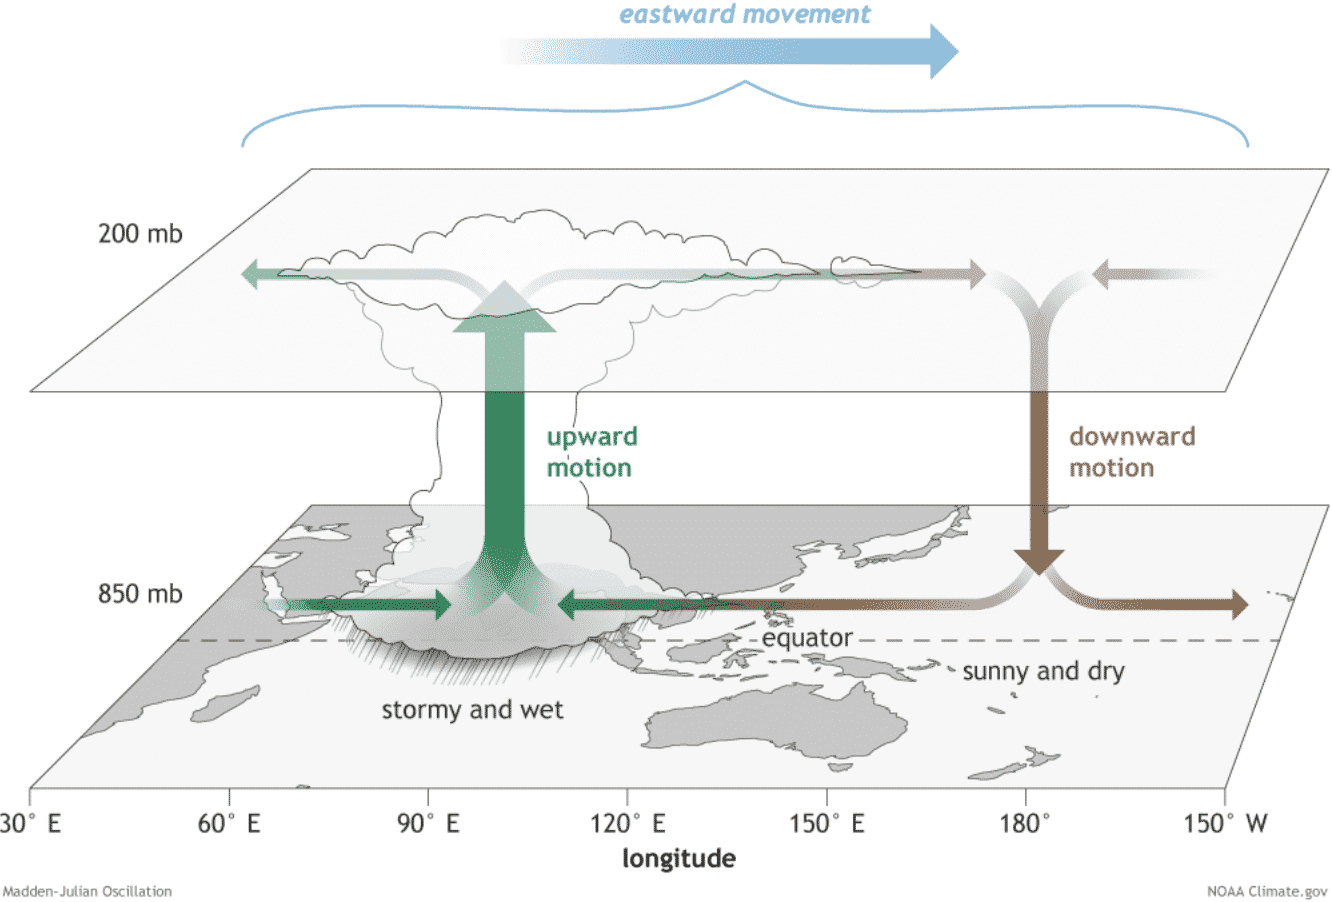
Sinking air means that the atmosphere is stable (brown colors), so there are fewer clouds and tropical activity. Rising motion (green) means more clouds, rainfall, lower pressure, and increased tropical storm activity, and is typically associated with warmer ocean waters.
Below is the average upper-level velocity potential during a cold Atlantic Niña event in August. You can see sinking air over the Atlantic, aided by its cold Niña event, or at least by its driving force, while the Pacific is in strong lift mode (usually El Niño).
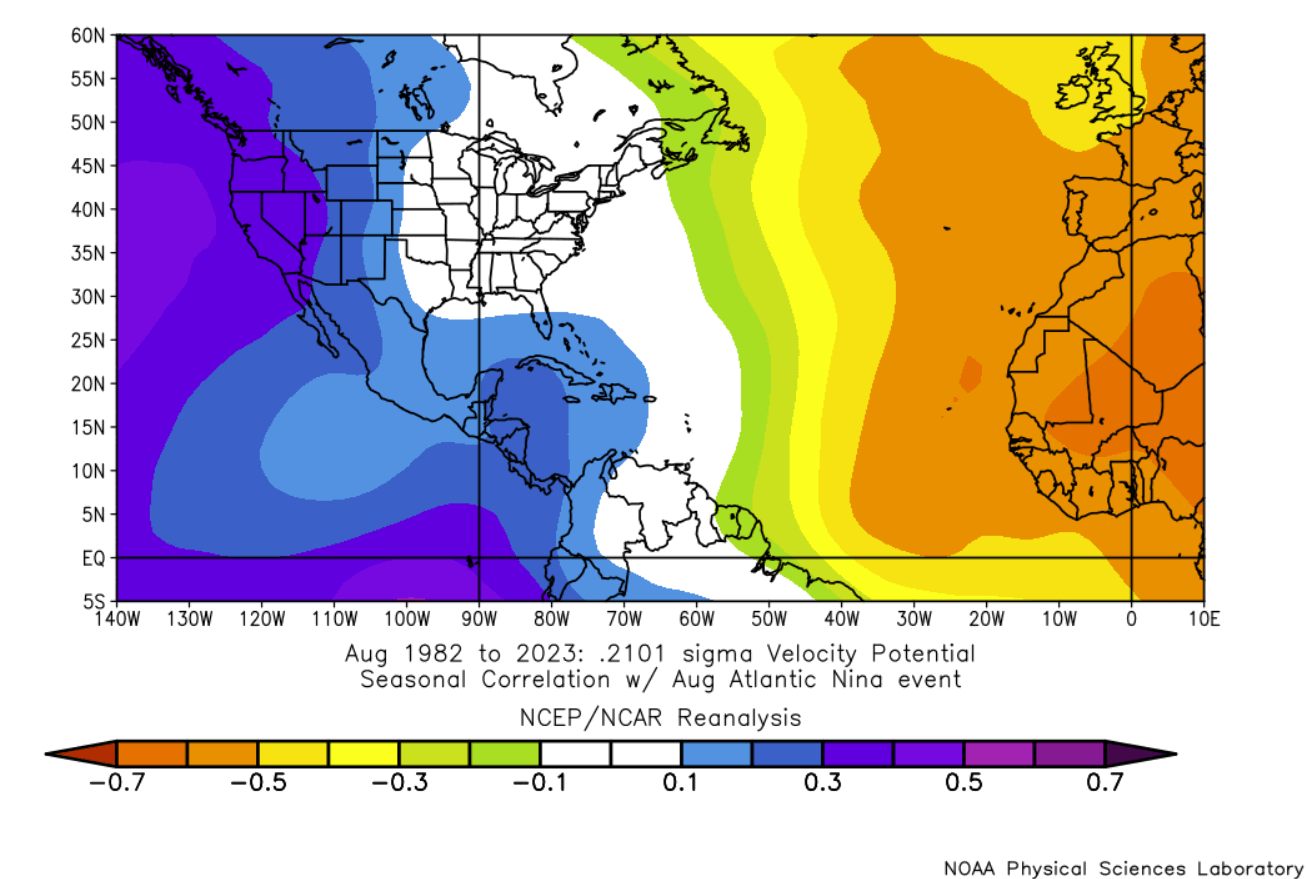
The main focus in these maps is an area called the Main Development Region (MDR). It is where tropical systems form and strengthen during the Hurricane Season, like a hurricane nursery area.
You can see this area marked in the next image below, which is the EMCWF seasonal forecast for the September 2026 Velocity Potential anomaly. This is the peak month for hurricane activity, and as you can see, the forecast shows a significant lift anomaly in the Pacific due to the Super El Niño Event.
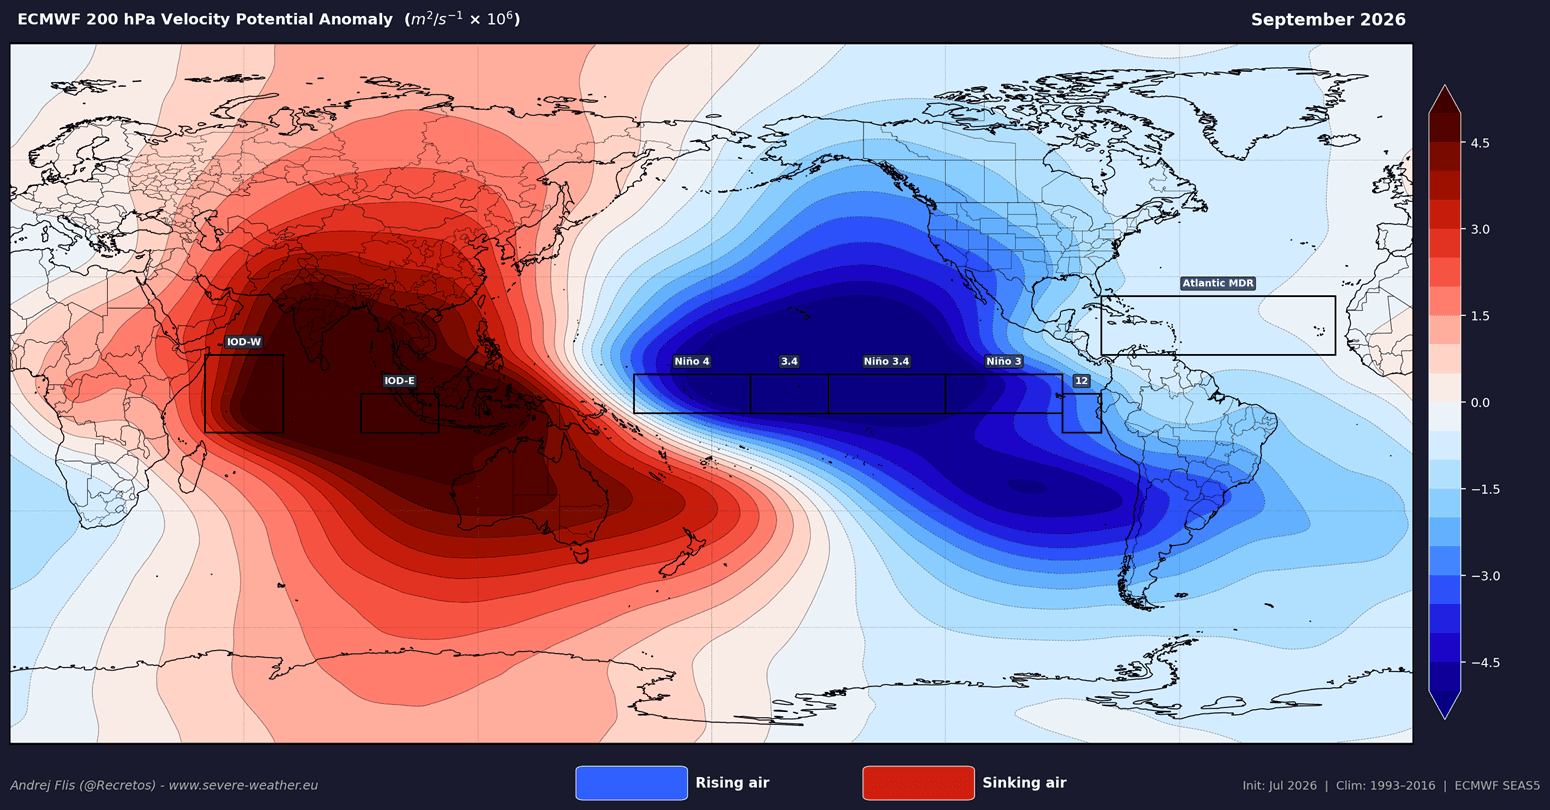
That creates a matching pair in a sinking air region to the west over the Indian Ocean, outlining large-scale atmospheric circulation. The Atlantic MDR zone is in a neutral anomaly, but with Africa suppressed, this is unfavorable for a large number of storms.
El Niño events also significantly alter the number of tropical systems in the Atlantic and their intensity. Below is our simple schematic of the El Niño impact on the hurricane season, producing an atmospheric flow that causes a hostile environment for tropical storms, protecting the U.S. from landfalls.
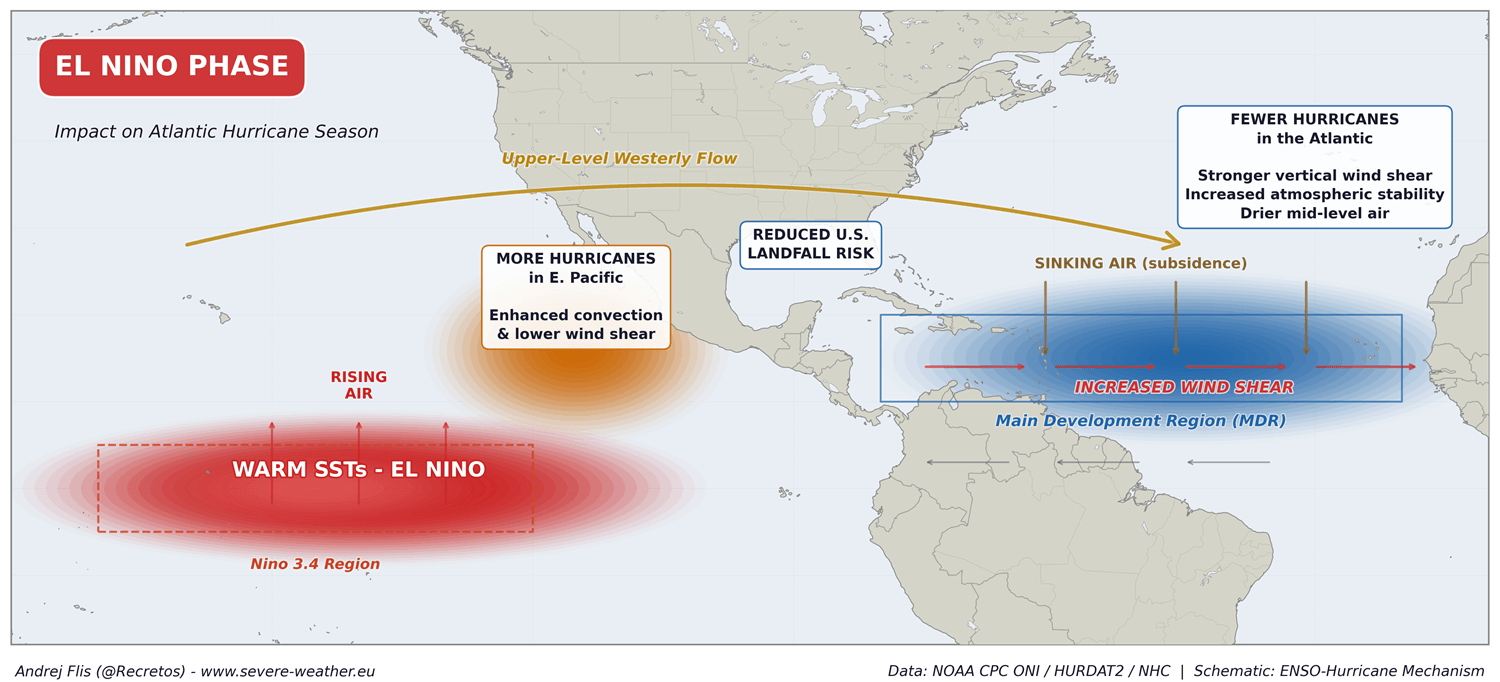
There are 3 main points of “impact” from an El Niño on the Atlantic Hurricane season: increased wind shear, sinking air, and drier mid-levels. This creates an atmosphere that really tries to slow down and suppress tropical activity in the Atlantic.
Below is also the pressure trend during an active Atlantic Niña in the August-September period, based on over 4 decades of historical data. The higher pressure in the MDR indicates less tropical storm activity and fewer potential landfalling hurricanes in the United States. It also indicates unfavorable atmospheric conditions for the tropical system to intensify.
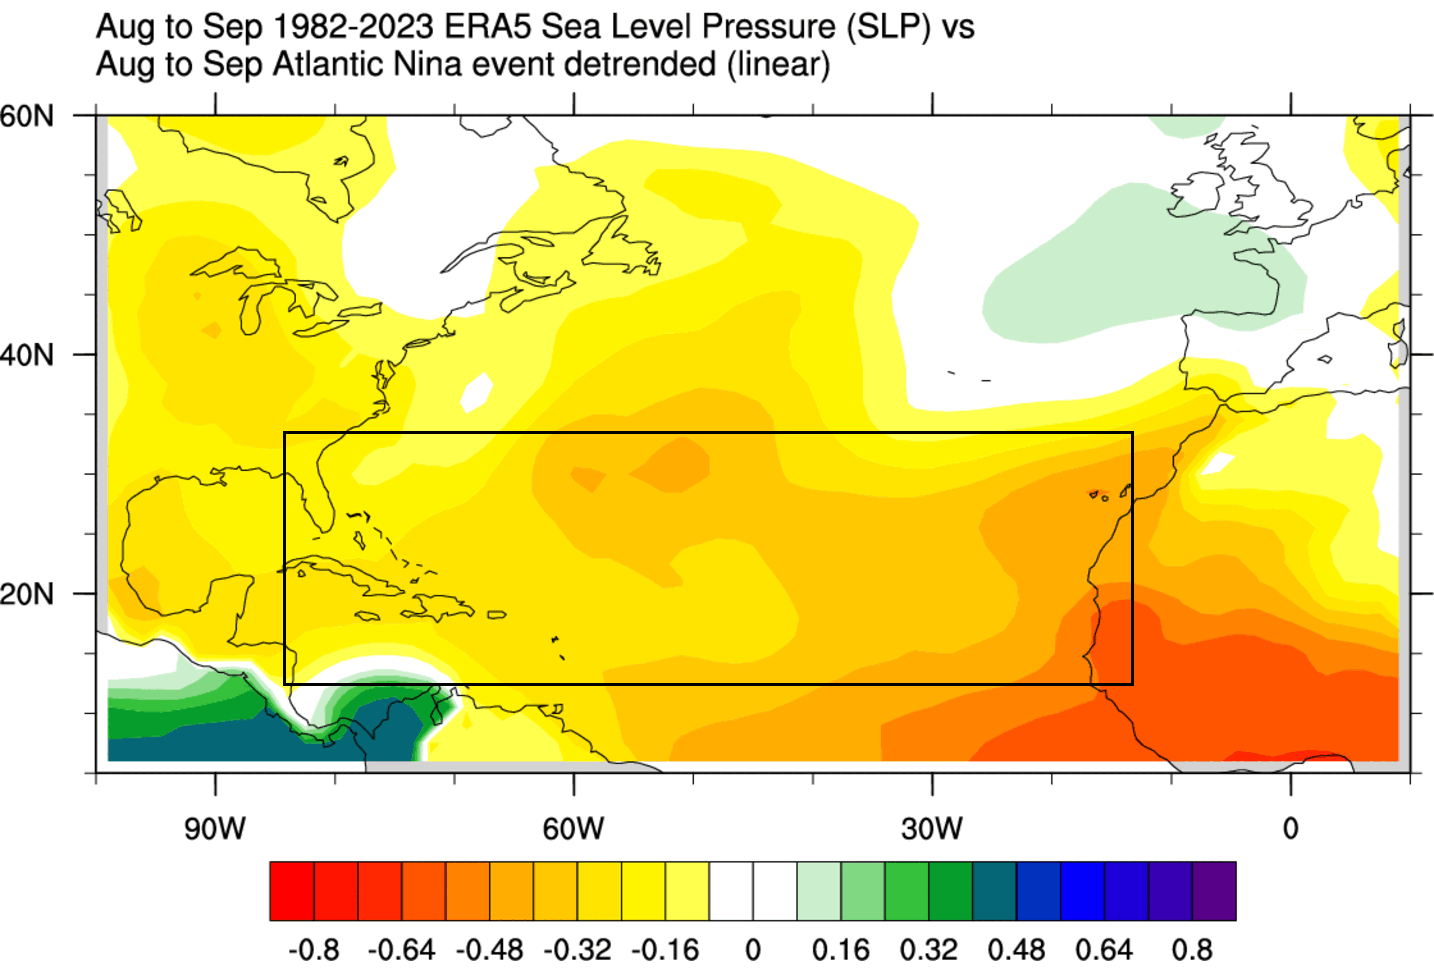
This is just a general analysis based on the available data, which shows that an Atlantic Niña usually comes with pretty limiting conditions for hurricanes, be it as a cause or a consequence itself.
And the latest forecast data also confirms this, showing just the hurricane season that one would expect with an Atlantic Niña and a Pacific Super El Niño.
Forecast Data Shows a Slower Hurricane Season Pattern
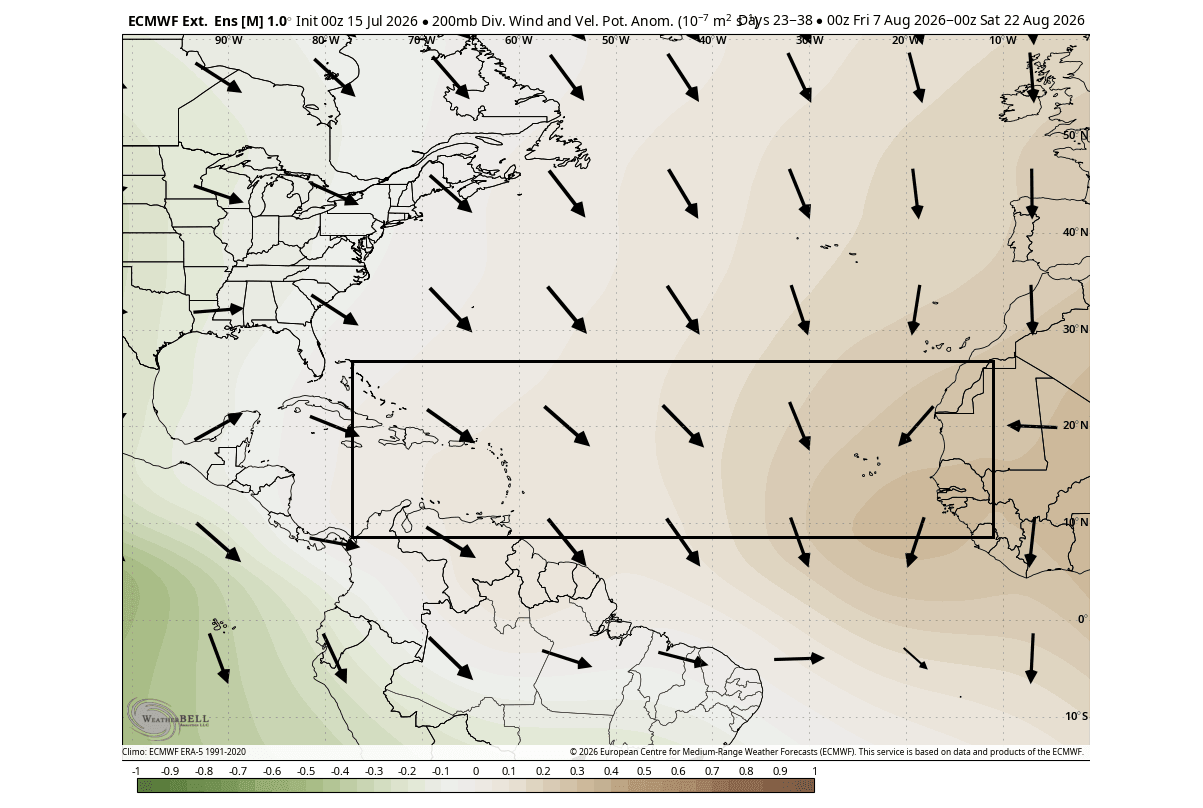
Below is the ECMWF velocity potential forecast for August. If you recall from the previous section, brown colors indicate sinking air in the atmosphere. This means that the atmosphere will suppress tropical systems in the MDR next month. This confirms exactly what we expected to see, given the active ocean anomalies.
The next image shows the rainfall forecast for the whole of August, and is perhaps the most telling indicator you can use. This is the latest forecast, and you can see below-normal precipitation over the whole region, indicating less clouds and rain overall.
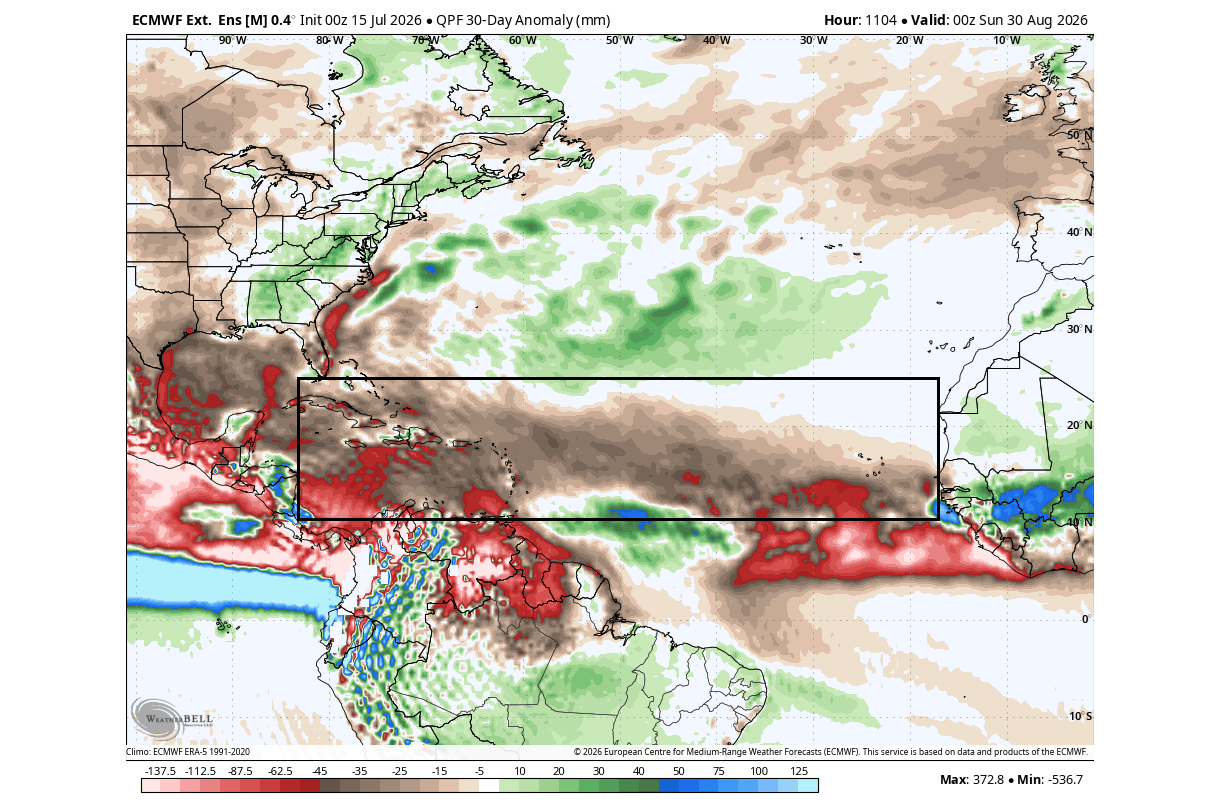
You can also see a well below normal area around the Caribbean and into the Gulf, and up the United States east coast. This indicates suppressed convection and tropical activity, which greatly reduces hurricane potential, as expected during Atlantic Niña events.
Below, you can also see the surface pressure anomaly forecast for August, and you can see above-normal pressure over the tropics and the MDR area. This area usually shows lower pressure in an active season, but August looks to remain less active in terms of potential hurricanes making landfall in the United States.
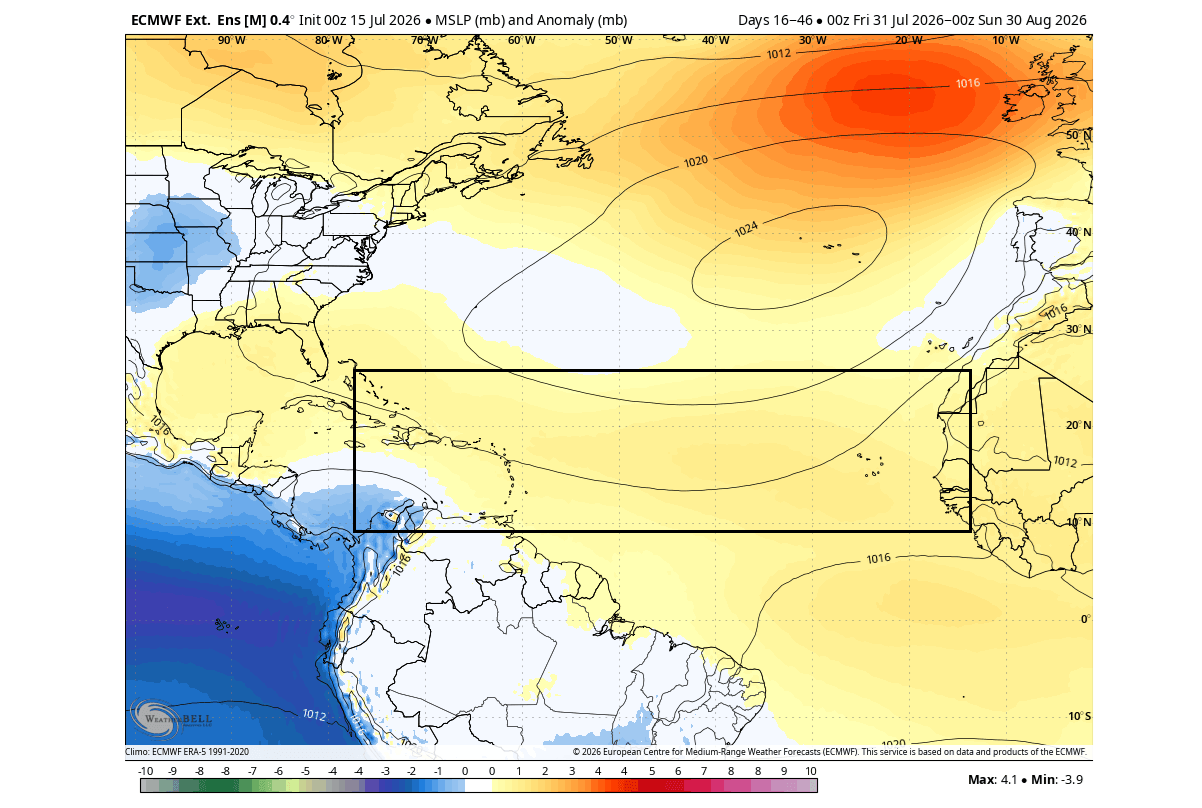
These are just rends for the first month of the more active part of the season, but the long-range data also supports the “atmospheric shield” development from the Super El Niño and the Atlantic Niña.
Landfall Risk Drops, But It Never Goes to Zero
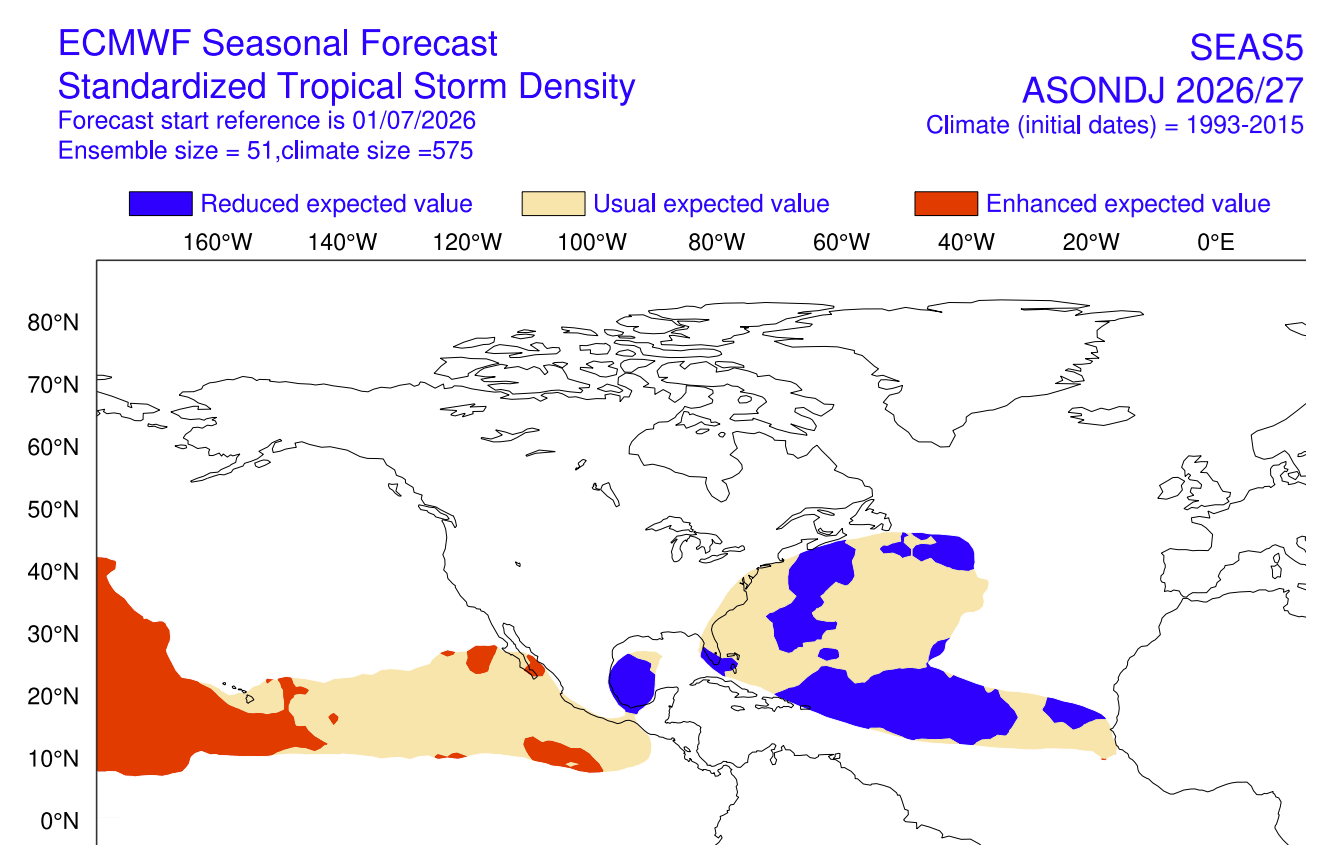
If we look at the seasonal forecast, the latest data clearly shows a large area of below-normal tropical activity across the MDR and the Atlantic region. At the same time, we see enhanced activity in the Pacific, aided by the low pressure and rising air associated with El Niño.
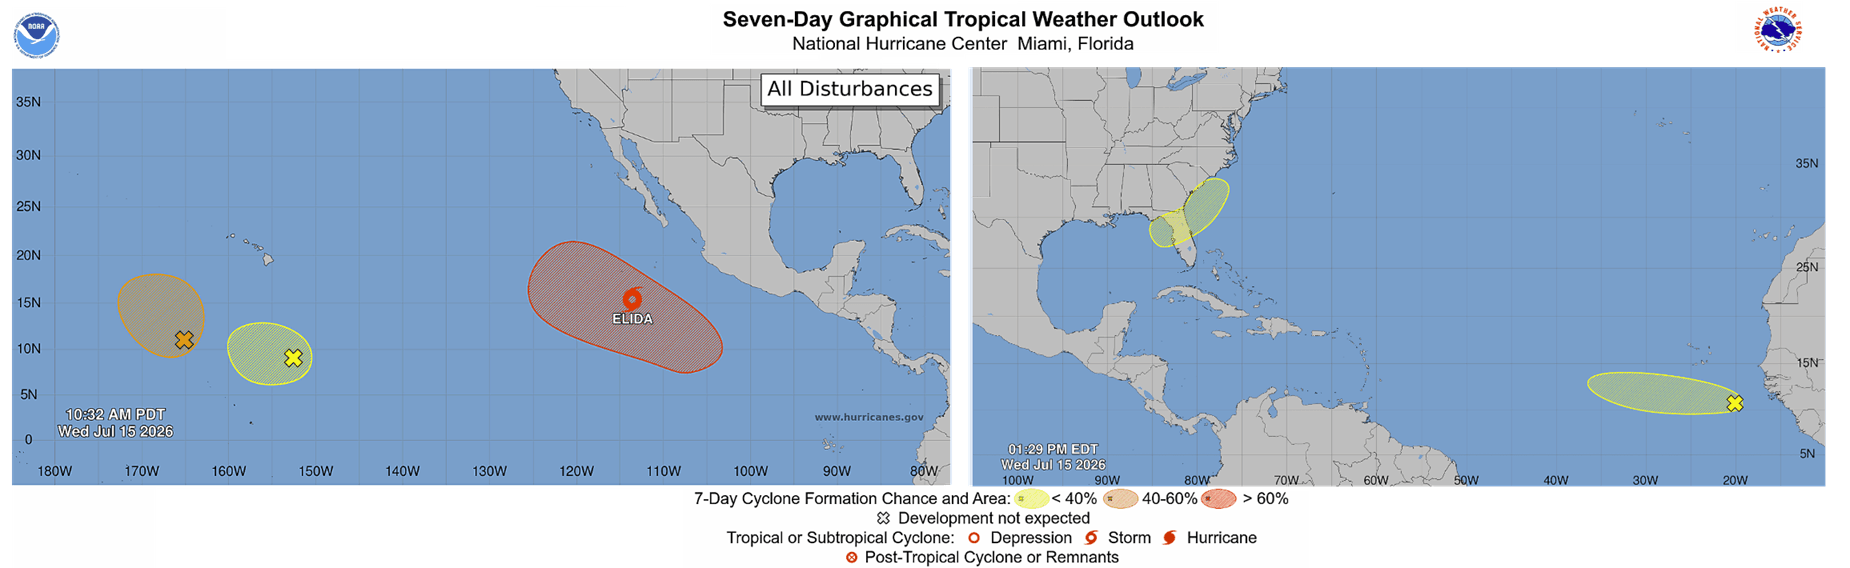
Despite the forecast covering the August-January period, we are already observing this in July. Below is the official NHC 7-day outlook, which shows only weak areas of potential in the Atlantic and a much more active Pacific, reflecting the atmospheric circulation.
The Colorado State University (CSU) has also released an updated 2026 hurricane season outlook this month. Their tropical monitoring project, currently led by Dr. Philip Klotzbach, is widely considered one of the best for seasonal Atlantic hurricane forecasting.
Because raw probabilities tell us little, we have to compare them to the long-term average to truly understand the seasonal risk. The image below, based on CSU data, shows just that. It reveals whether the hurricane landfall threat is higher or lower than usual for the United States and southeast Canada in 2026.

This anomaly map highlights the clear El Niño impact on the hurricane season: every single coastal county from Brownsville, Texas, to Newfoundland is facing a below-normal hurricane threat this season.
- The Gulf Coast (from Texas to the Florida Panhandle): Typically carrying a high baseline threat, this entire area is running significantly below its historical average for a hurricane landfall.
- Peninsula Florida and the U.S. East Coast (including the Carolinas): Historically active areas along this corridor show the most significant change on the map, with local probabilities dropping well below normal.
- Eastern Canada (including Nova Scotia): Even these far-northern coastal provinces are seeing a notable negative anomaly, indicating a much quieter year than normal.
Historically, a devastating Category 5 Hurricane Andrew still occurred during an otherwise quiet, El Niño-suppressed 1992 season. So this goes to show that even a near-zero chance can still produce outliers.
As all these anomalies also have a significant impact on the global weather system. So we must also consider the seasonal connections with the winter season and what a quiet hurricane season could mean for 2026/2027.
How A Quiet Hurricane Season Can Leave Winter Clues
We simply have to ask the question whether there is any connection between a quiet hurricane season and the following winter weather patterns.
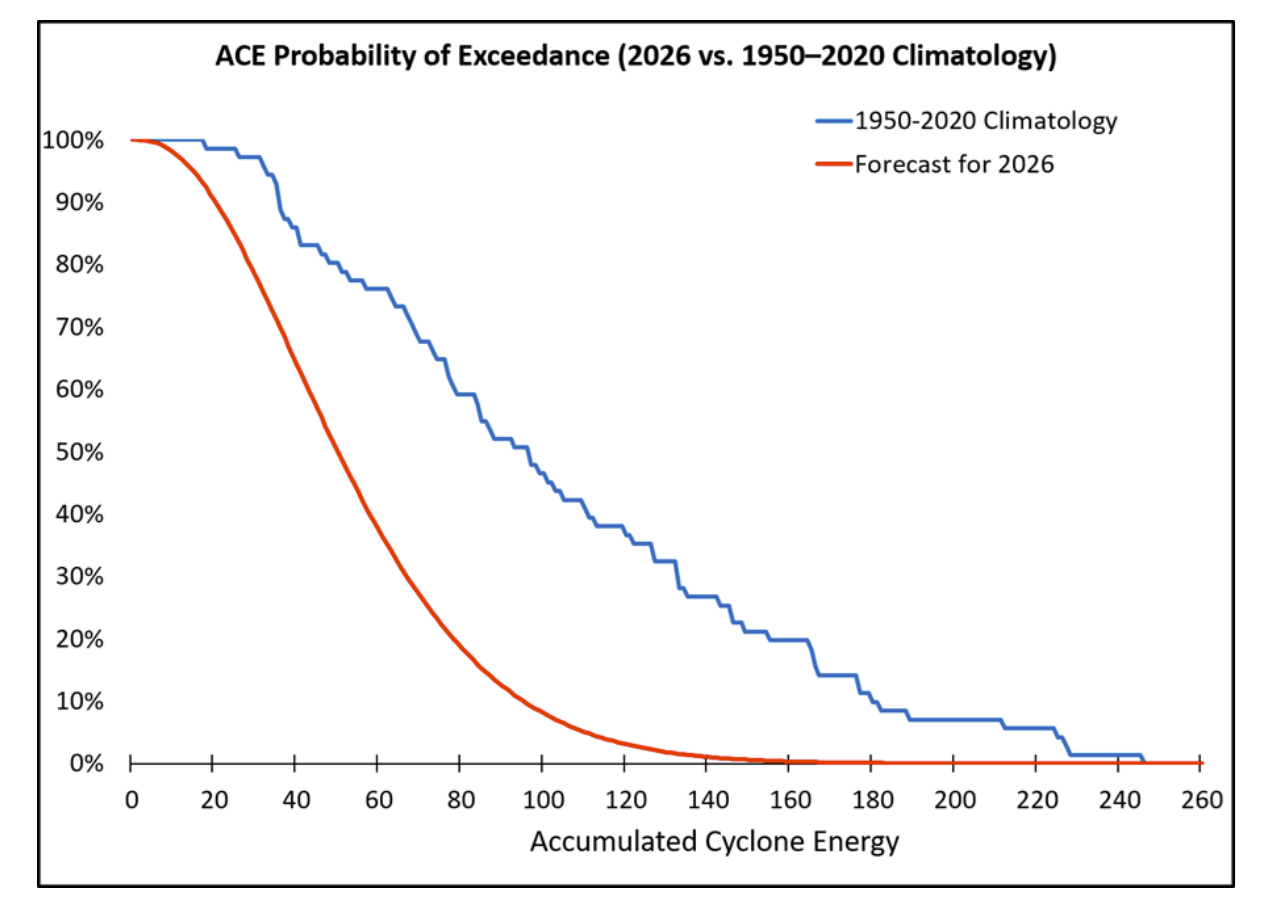
To estimate a hurricane season, NOAA uses the total strength and duration of Atlantic tropical storms and hurricanes. Their measure of overall activity is called the Accumulated Cyclone Energy (ACE) index.
Below is the ACE index forecast for 2026 from the latest CSU data. You can see that the 2026 numbers are well below normal, predicting one of the lowest hurricane seasons in recent years. We can still expect systems to form, but total ACE can remain overall well below normal.
Of course, Winter patterns are not always directly a result of the Atlantic Niña or the hurricane season itself. Especially with a record-strong El Niño occurring.
All are actually more of an “indicator” or a response to the atmospheric conditions. So the same global conditions that create an Atlantic Niña, El Niño, and a very quiet hurricane season can also drive a specific weather pattern the following Winter.
Below is the temperature pattern connection for the winters following weak hurricane seasons. You can see a colder air anomaly over the United States. This indicates a low-pressure area over the United States and the North Atlantic, with a high-pressure zone over Canada and Europe.
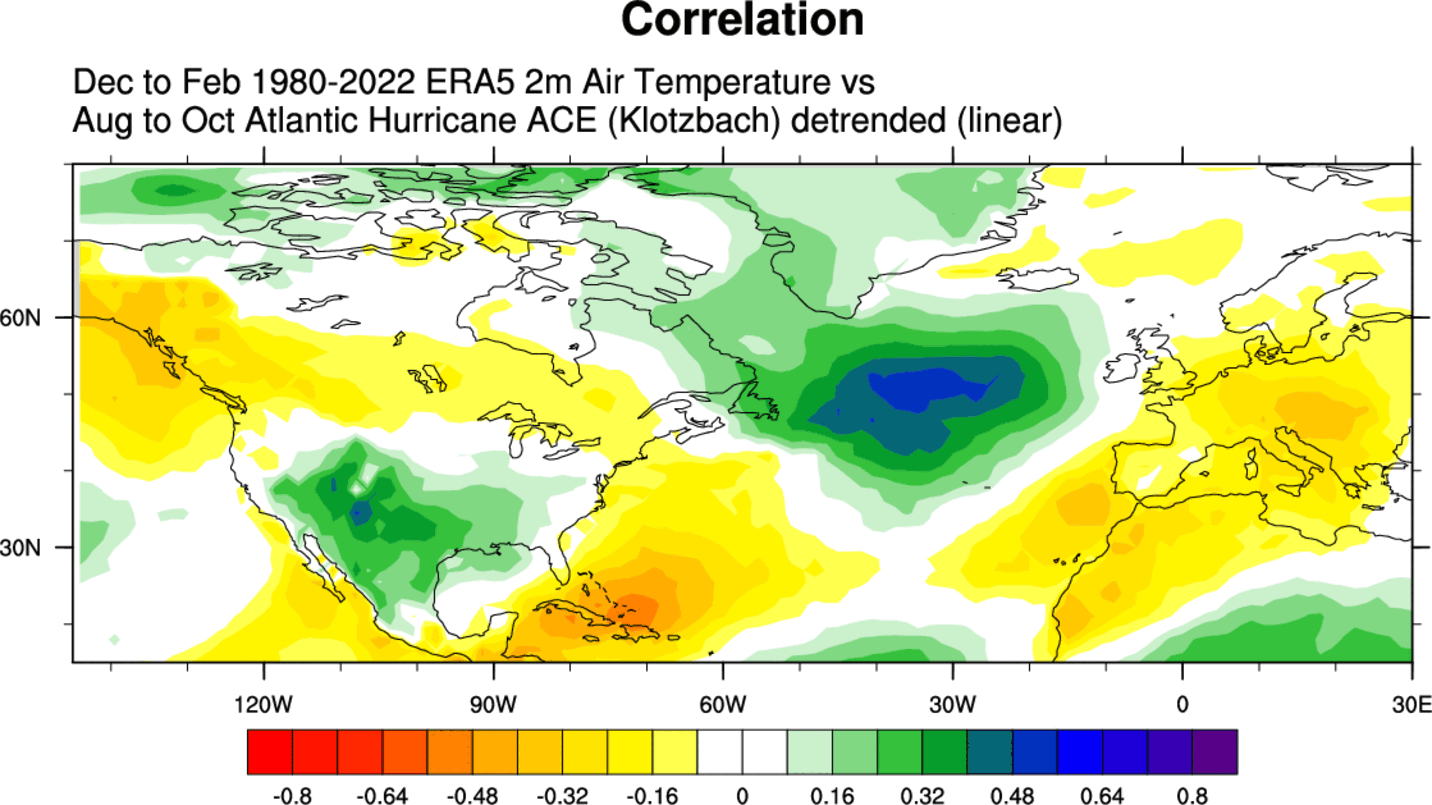
This looks similar to a Pacific El Niño pattern, which is known for creating weaker hurricane seasons. So this analysis perfectly shows an overall connection between Winter, El Niño, Hurricanes, and Atlantic Niña in the data.
But what we have also found is a connection in the stratosphere. The image below shows a warmer winter stratosphere and a weaker/disrupted Polar Vortex, following a slow hurricane season. This does not imply that hurricane season directly impacts the Polar Vortex, but there is likely some common factor at play that also includes the Pacific impacts.
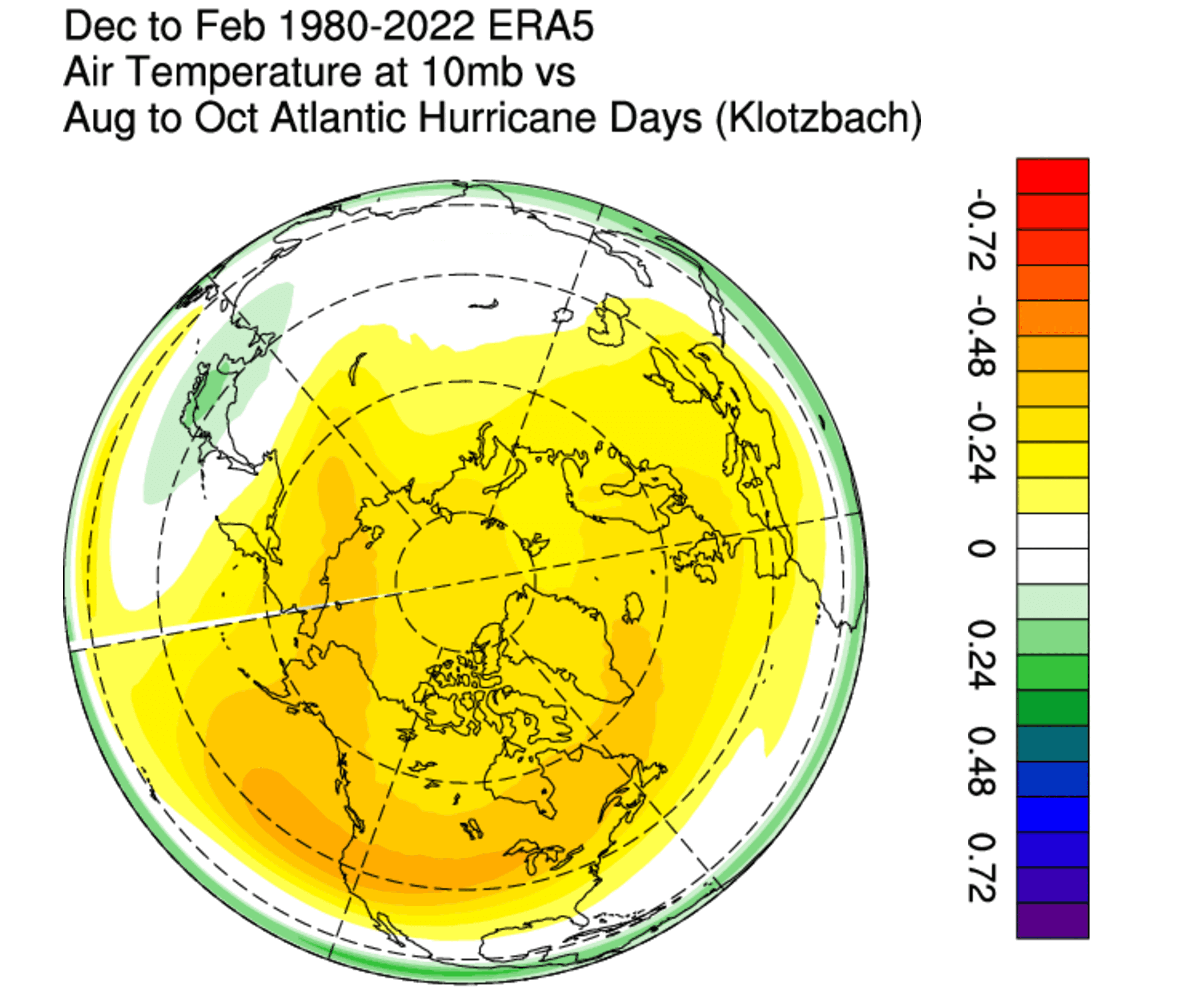
A weak Polar Vortex creates a disrupted jet stream pattern, leading to a strong winter weather response. As a result, it has a harder time containing the cold air, which can now more freely escape from the polar regions into the United States or other mid-latitude regions.
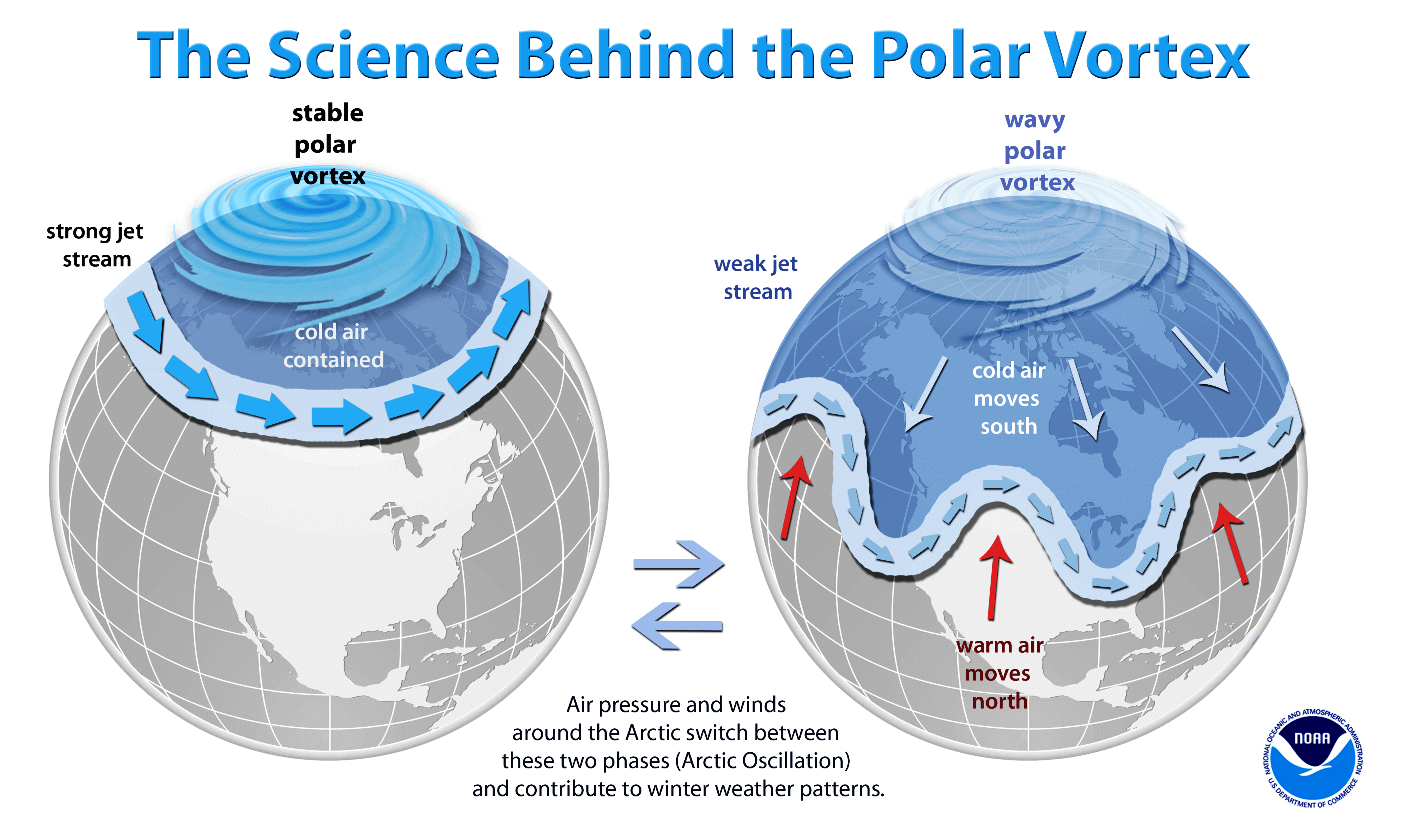
So, if you want a colder and snowier Winter, your best bet is a weak Polar Vortex. In nature, a weak Polar Vortex essentially means a breakdown of the stratospheric circulation, resulting in the spill-out of cold air from the polar regions.
This is something we will monitor closely over the coming weeks and months, as the more active part of the hurricane season slowly approaches. Its activity can likely tell us a lot about the upcoming Winter 2026/2027 weather patterns across the United States and Canada, which is something remarkable about the global weather system.
We can already see strong impacts of the Super El Niño on the Fall weather patterns, amplifying the weather into early and mid-winter:
Scientific Studies Used in this Article
- Atlantic Tropical Cyclones: Increase in Cape Verde hurricanes during Atlantic Niño – Kim et al. (2023).
- Atlantic Niño Dynamics: Formation mechanisms of the Central and Eastern Atlantic Niño – Liu et al. (2025).
Some of the forecast and analysis images in this article are from cyclonicwx.com and WeatherBell, using a commercial license.
We will keep you updated on global weather development and the latest long-range outlooks, so bookmark our page. Also, if you have seen this article in the Google App (Discover) feed, click the like button to see more of our forecasts and our latest articles on weather and nature in general.