El Niño advisory is active for the coming months as the ocean anomaly continues to grow. A strong El Niño event is expected to develop, with Winter weather expected across the United States, Canada, and Europe.
Ocean anomalies play an important role in atmospheric circulation and our weather on smaller and larger scales. That is especially true during the Winter season when the pressure systems are strongest, and the energy levels are high.
An El Niño event is also used as an indicator that tells us what the current state of the atmosphere is. You will see how El Niño is currently growing and how it is expected to influence the upcoming Winter season of 2023/2024 on many different levels.
WHERE OCEAN MEETS THE ATMOSPHERE
El Niño is a warm phase of the ENSO, which stands for “El Niño Southern Oscillation.” This region of the equatorial Pacific Ocean regularly shifts between warm and cold phases. Typically, there is a phase change around every 1-3 years.
We are currently entering a warm phase called El Niño. The cold ENSO phase is called La Niña, which was active over the past three winters.
The image below shows the ENSO regions across the tropical Pacific. Regions 3 and 4 expand over the east and west tropical Pacific. The main region is seen in the image as the Nino 3.4 region. This is where the main strength of a warm/cold event is calculated.

Each ENSO phase influences the pressure and weather in the tropics differently. This affects the overall global circulation over time, changing the seasonal weather patterns across the world.
A (cold/warm) phase usually develops between late Summer and early Fall. It then lasts until Spring, but some events can last up to two or three years.
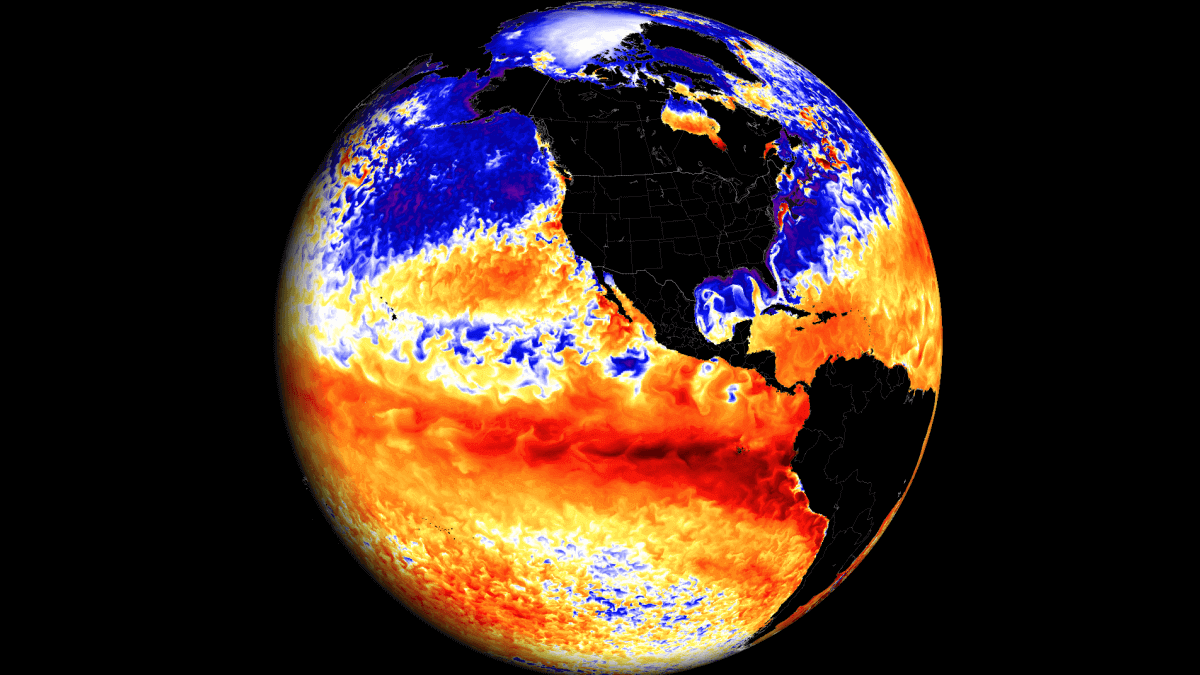
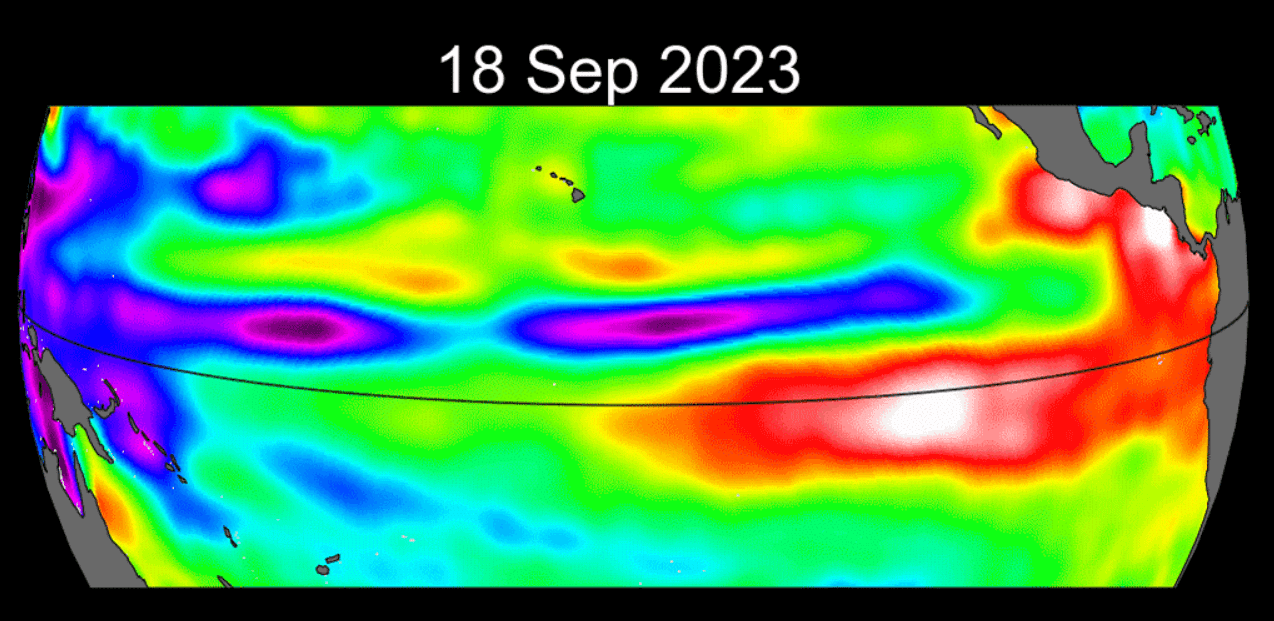
You can see the El Niño in latest ocean anomaly analysis for September 2023. It stands out as an area of above-normal ocean temperatures across the equatorial Pacific Ocean. This anomaly affects the atmosphere but also indicates pressure pattern changes on a global scale.
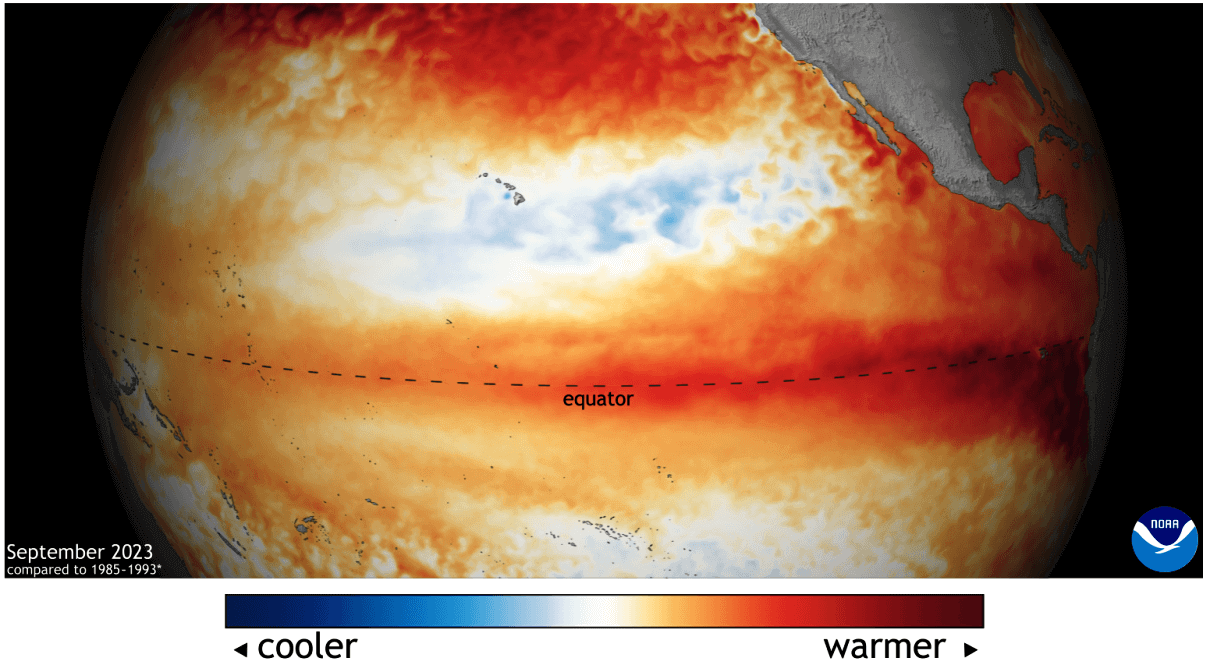
These pressure changes in the tropics translate into global circulation over time, affecting seasonal weather over both Hemispheres. We can observe a global shift in pressure patterns during the emergence of an ENSO phase. But it is usually more influential during the peak of its phase in Fall and Winter.
The following image below from NOAA Climate shows the typical circulation during an El Niño event.
Rising air over the central and eastern Pacific causes more storms and precipitation and lowers the pressure over the region. At the same time, the air is descending in the western Pacific, causing stable weather and high-pressure conditions.
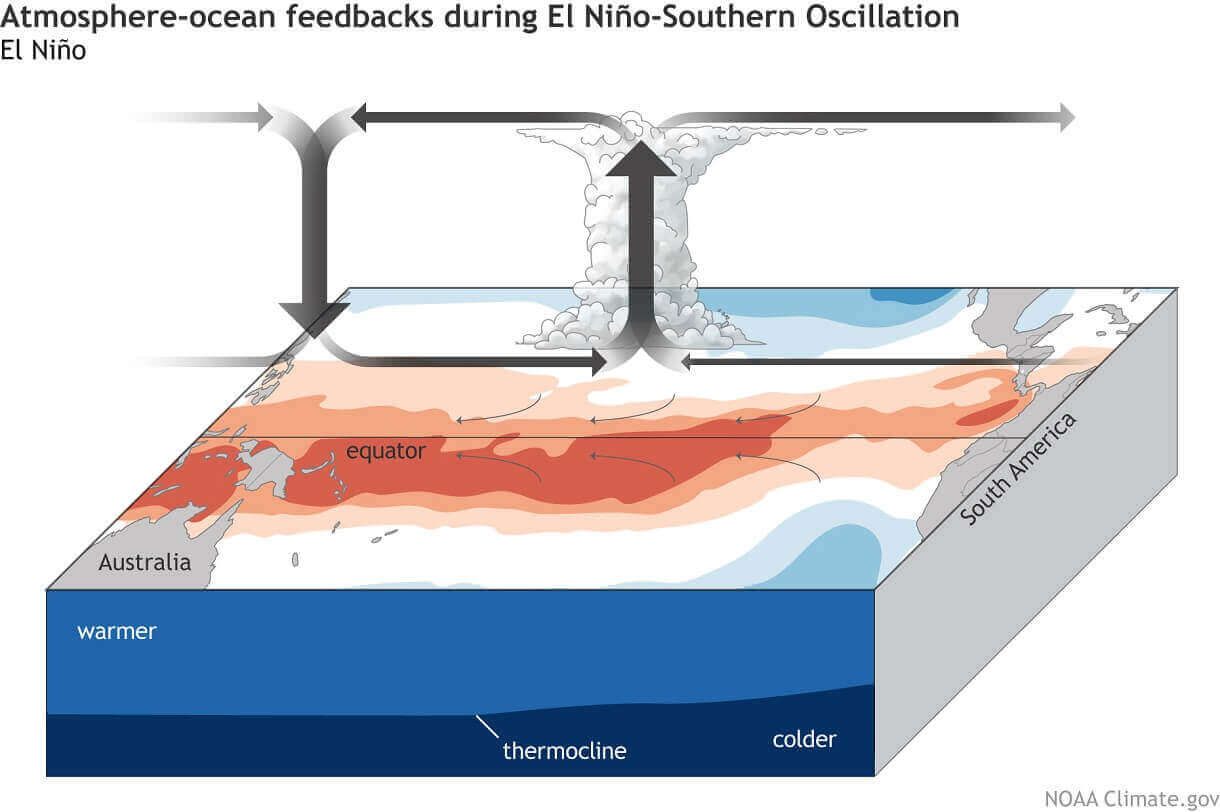
This way, ENSO has a strong impact on the tropical rainfall and pressure patterns, affecting the ocean-atmosphere feedback system. Through this ocean-atmosphere system, the ENSO influences the weather globally.
MOTION OF THE ATMOSPHERE
We can actually see this motion of the atmosphere by using a special parameter called the “velocity potential”. Simplified, it allows us to see where the atmosphere is rising and where it is sinking. This is one way we can track the influence of the El Niño spreading globally.
In the image below, you can see this motion anomaly presented in blue (rising air) and brown (sinking air) colors. Blue indicates rising motions and lower pressure, as indicated over the ENSO regions in the Pacific. You can see sinking motion and higher surface pressure tendency to the east and west of the ENSO regions.

This way, we can see the spreading influence of the El Niño across the atmospheric circulation.
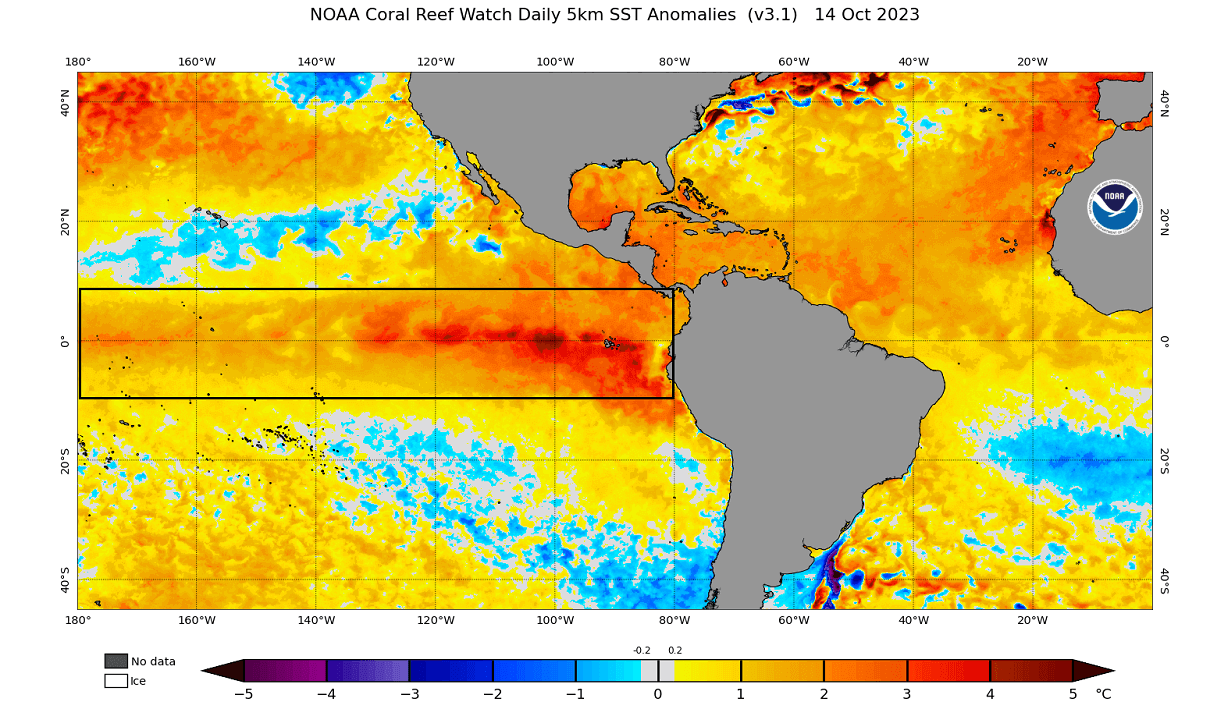
The latest ocean temperature data shows strong warm anomalies in the tropical Pacific. Peak anomalies exceed 4 degrees Celsius, with a large area of 2+ degrees warmer than usual.
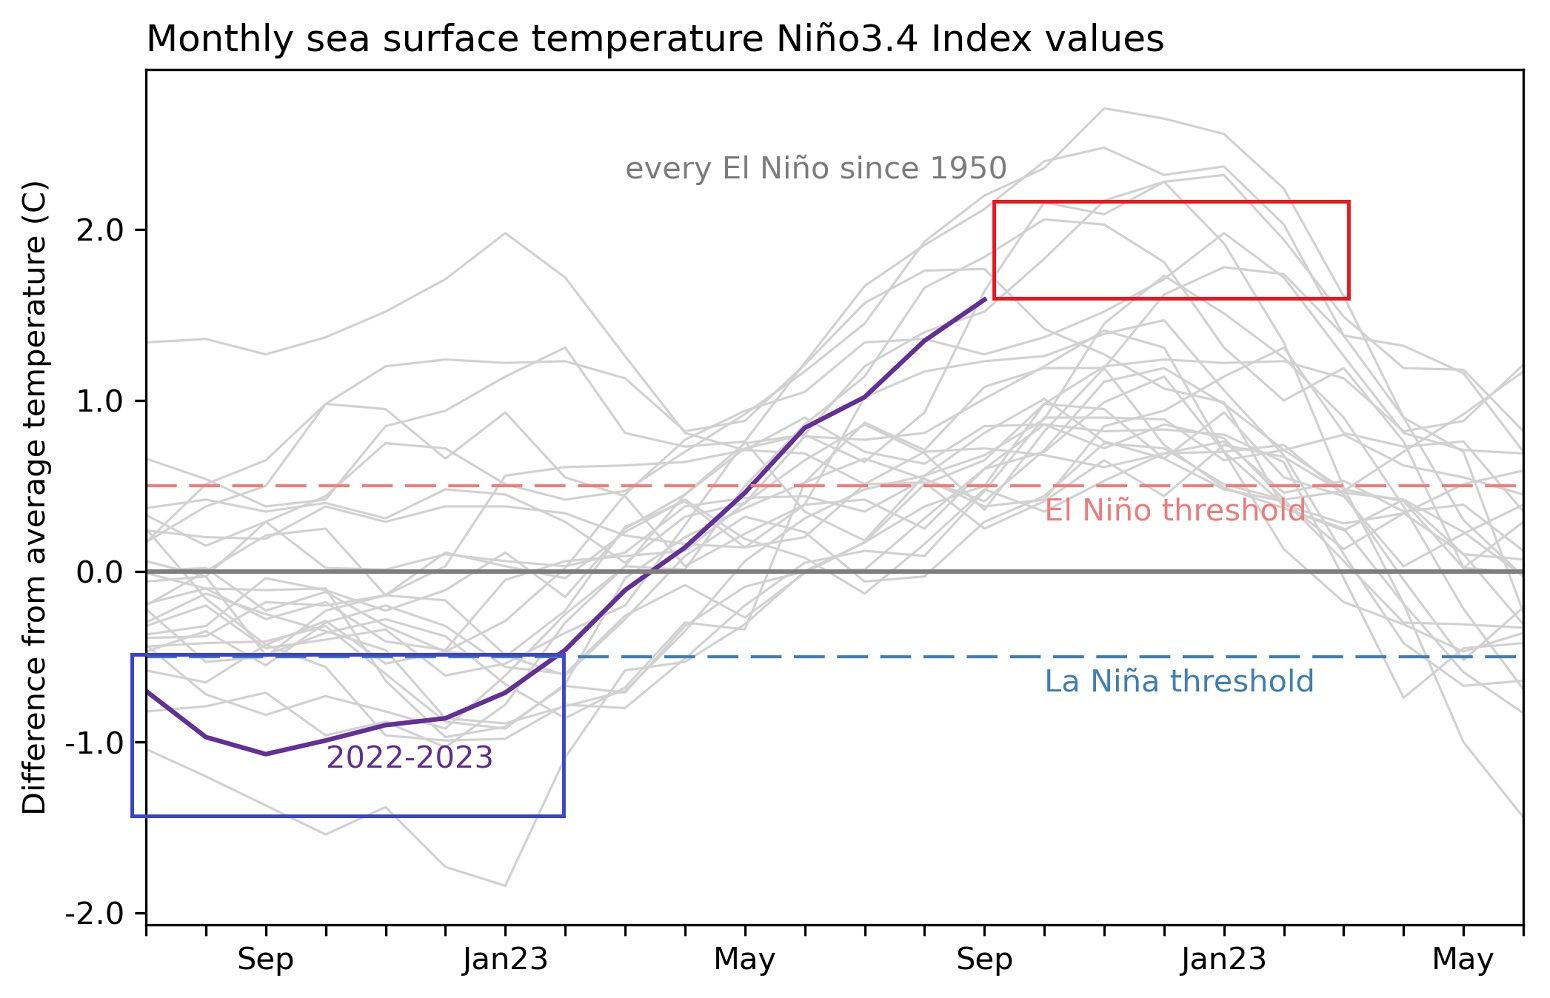
Below, you can see the ENSO region anomaly data for the 2022/2023 seasons. Notice the rapid rise in ocean temperatures, as the region was still coming out of an active La Niña phase from last Winter. The red box shows the projected peak values of the El Niño even over the Winter 2023/2024.
WINDS OVER THE OCEAN
But how can ENSO shift between cold and warm phases so rapidly? The simplest answer is that it happens because of a complex relationship between pressure, winds, and ocean currents.
Global trade winds can start or stop a certain ENSO phase by overturning the ocean surface layers and changing the ocean currents and temperature profiles. Trade winds are steady and persistent winds, blowing towards (and along) the equator in both Hemispheres.

In the image above, the trade winds are marked with yellow (red) arrows for the northern (southern) hemisphere.
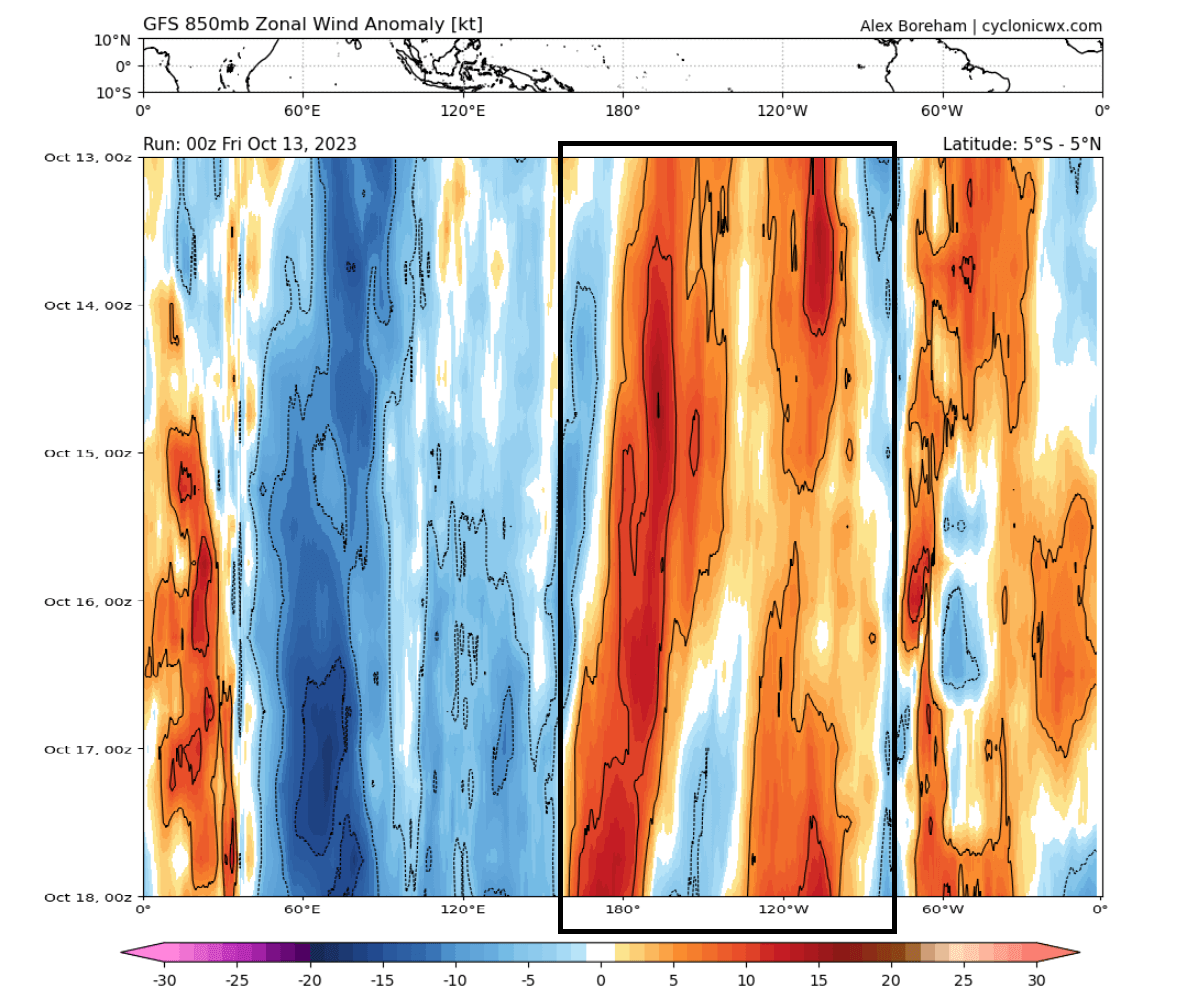
Below is the latest zonal (westerly) wind anomaly forecast for the tropical Pacific region. You can see a strong positive anomaly marked in the ENSO regions. That supports further warming of the central and eastern ENSO regions.
You can see the effects of the trade winds in the video below. It shows the ocean temperature anomalies from late Winter to mid-summer 2023.
The cold La Niña anomalies quickly broke down over the Winter, with warm anomalies emerging in early Spring. Notice the motion of the anomalies, being driven by the trade winds.
OCEAN ANOMALIES TOP AND BOTTOM
Another important aspect of ocean changes is the sea level height. In the image below, you can see sea level height anomalies from the Sentinel-6 satellite.
You can see a strong ocean sea level rise in the easterly tropical Pacific, a clear sign that El Niño is active. This is the latest image currently available, showing data for mid-September. Image by NASA JPL
As described by NASA: “The data shows Kelvin Waves 2 to 4 inches (5 to 10 centimeters) high at the ocean surface and hundreds of miles wide, moving from west to east along the equator”.
But what are these Kelvin waves?
The best example of an oceanic Kelvin wave in action can be seen in the image below. It shows the subsurface ocean temperature anomalies in early April. The large below-surface warm pool was a Kelvin wave, growing larger and spreading east and upwards to the surface.
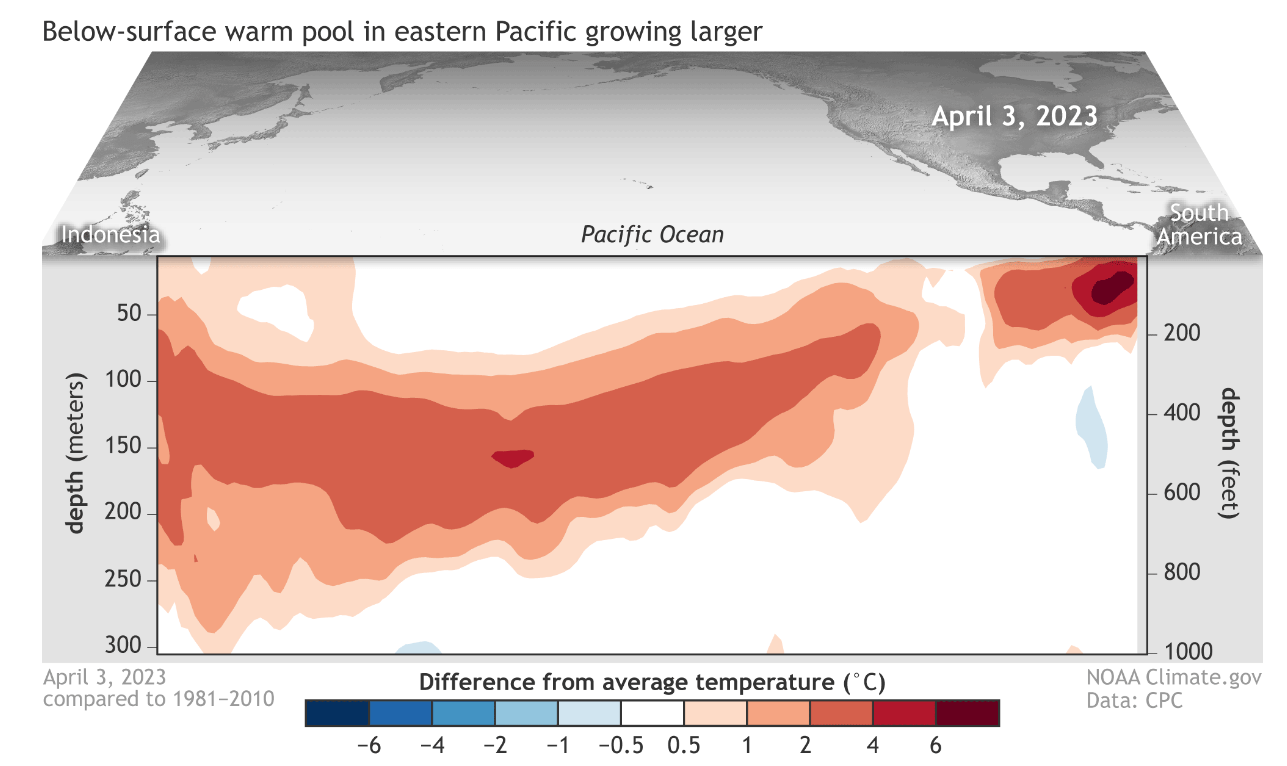
A strong subsurface warm pool is the main pre-condition to kickstart an El Niño event. Therefore, the atmospheric winds and ocean currents across the tropical Pacific are closely monitored.
The changes in the ocean heat content are mainly due to the expansion and rise of the strong subsurface warm pool, seen in the previous image. That also causes the sea level height to increase, usually associated with warmer waters.
The latest subsurface image below shows a stable warm pool down to at least around 150 meters depth (500 feet). This image shows the subsurface anomalies across the ENSO regions.
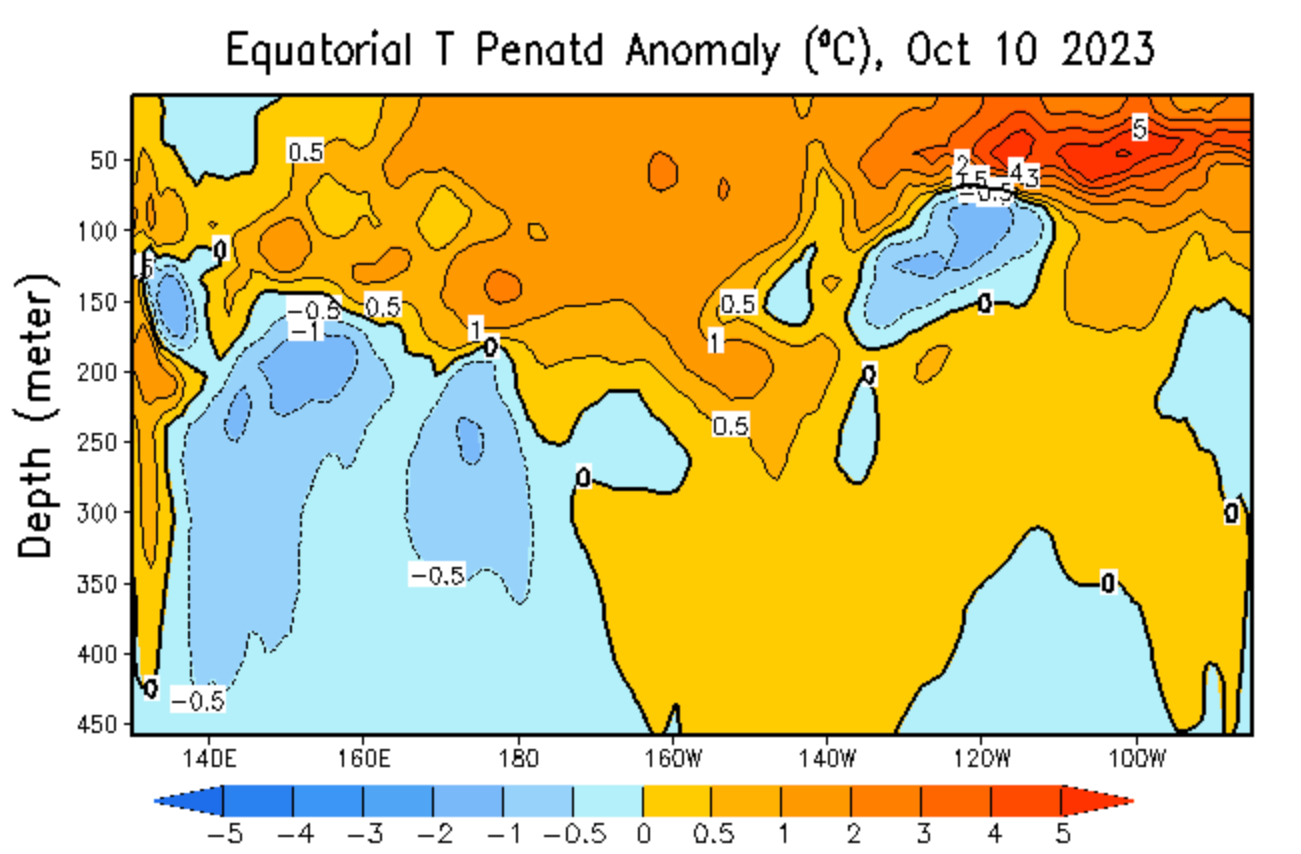
The subsurface temperature changes have prompted the Climate Prediction Center to issue an official El Niño watch, upgrading it into an Advisory in July. The latest outlook gives a greater than 95% chance of El Niño impacting the Winter season of 2023/2024 and the Spring of 2024.
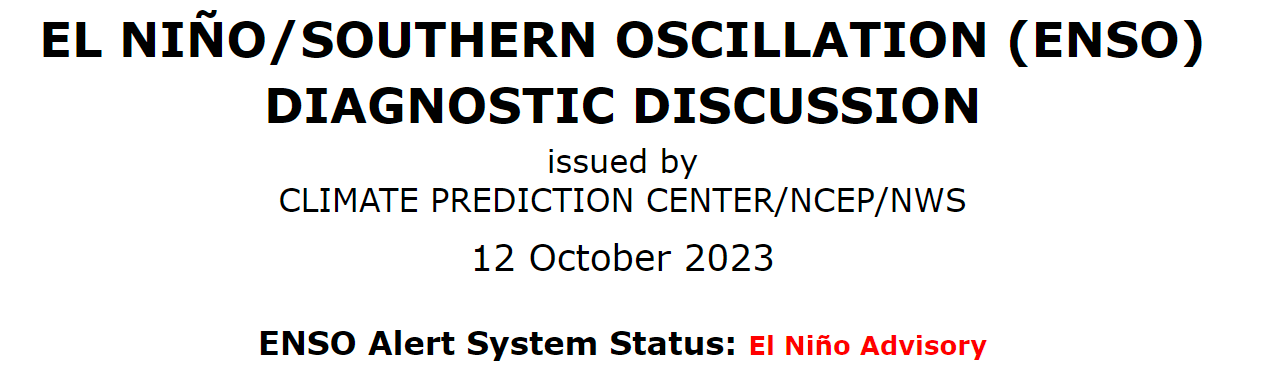
In their latest discussion, they write: “The most recent IRI plume favors El Niño to continue through the Northern Hemisphere spring 2024. Also considering recent observations and the NMME, the team favors at least a “strong” event with a 75-85% chance through November-January. There is a 3 in 10 chance of a “historically strong” event that rivals 2015-16 and 1997-98.”
It means that the current and expected atmospheric conditions will be favorable for a strong El Niño event to develop and impact the upcoming weather seasons into 2024.
El Niño AND GLOBAL ANOMALY
While El Niño is growing, the global oceans around it are also in distress. Some regions, like the Atlantic Ocean, even reach unusual values for this time of year.
Below is a special analysis image. It shows the September 2023 ocean temperatures compared to September 2022. You can see that this year, there is a much stronger warm ocean anomaly in the tropical Pacific Ocean. Also, a lot of the Atlantic and the Indian Ocean is warmer than last year.
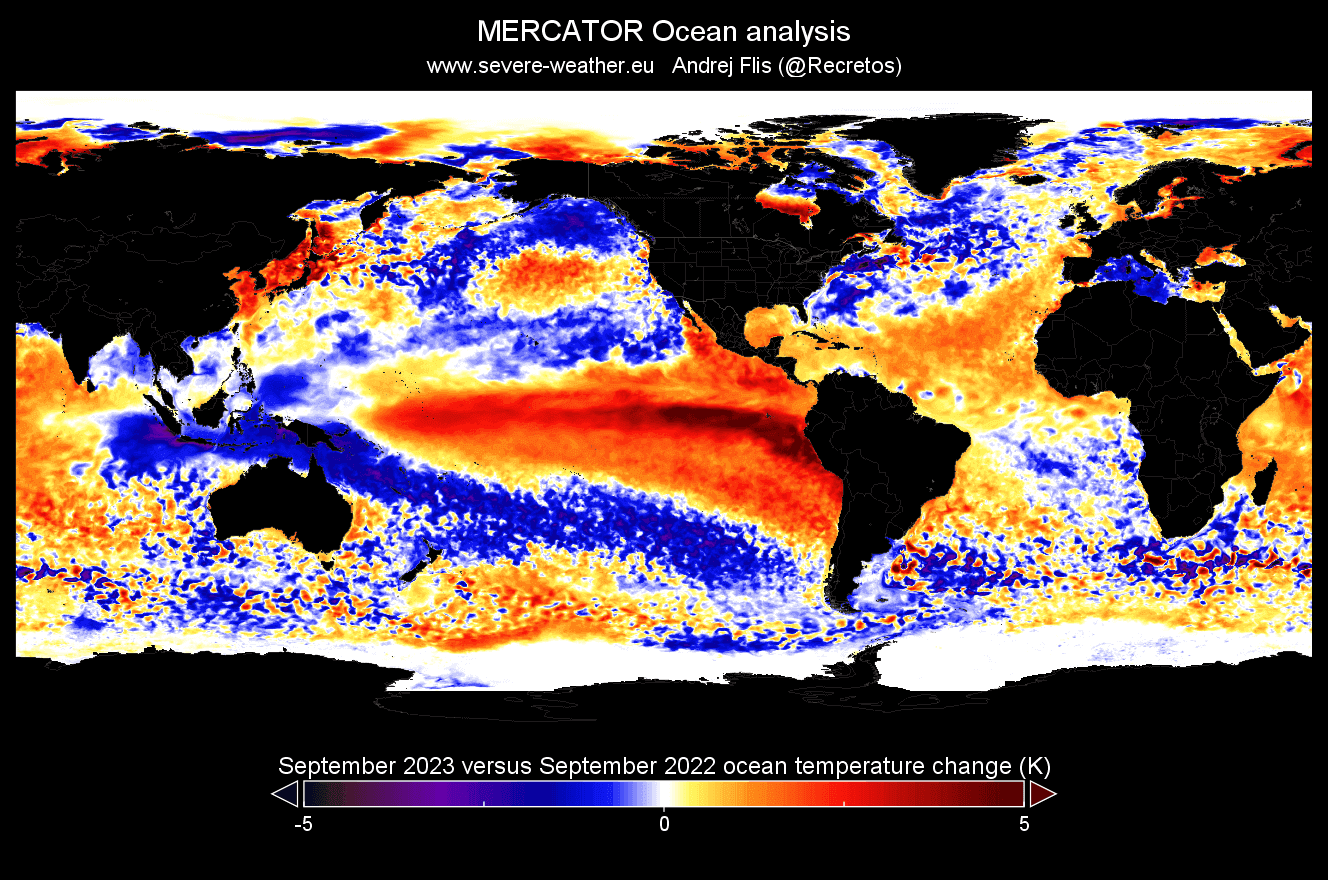
This time last year, we were in a cold ENSO phase (La Niña). The change from negative anomalies to positive in 2023 creates a huge year-to-year difference.
The image below shows the sea surface temperatures globally for 2023. Notice the period since early April is the warmest in the past 40 years and likely even more. The strong El Niño coupling with other atmospheric factors has greatly contributed to this unusual global anomaly.

This is a very unique situation, with abnormally warm North Pacific, North Atlantic, and the rest of the globe running warmer on average. Usually, there is a larger contrast with an El Niño, but this year, the oceans were already running record warmest.
So, just how strong will the 2023/2024 El Niño event be?
El Niño 2023/24 FORECAST DATA
Below is an analysis/forecast graphic by CPC, which shows the long-range forecast for the main ENSO region. The forecast average has it around a +1.5 degrees anomaly by mid-winter. That is considered a moderate to strong El Niño event, expected to have a considerable weather influence.
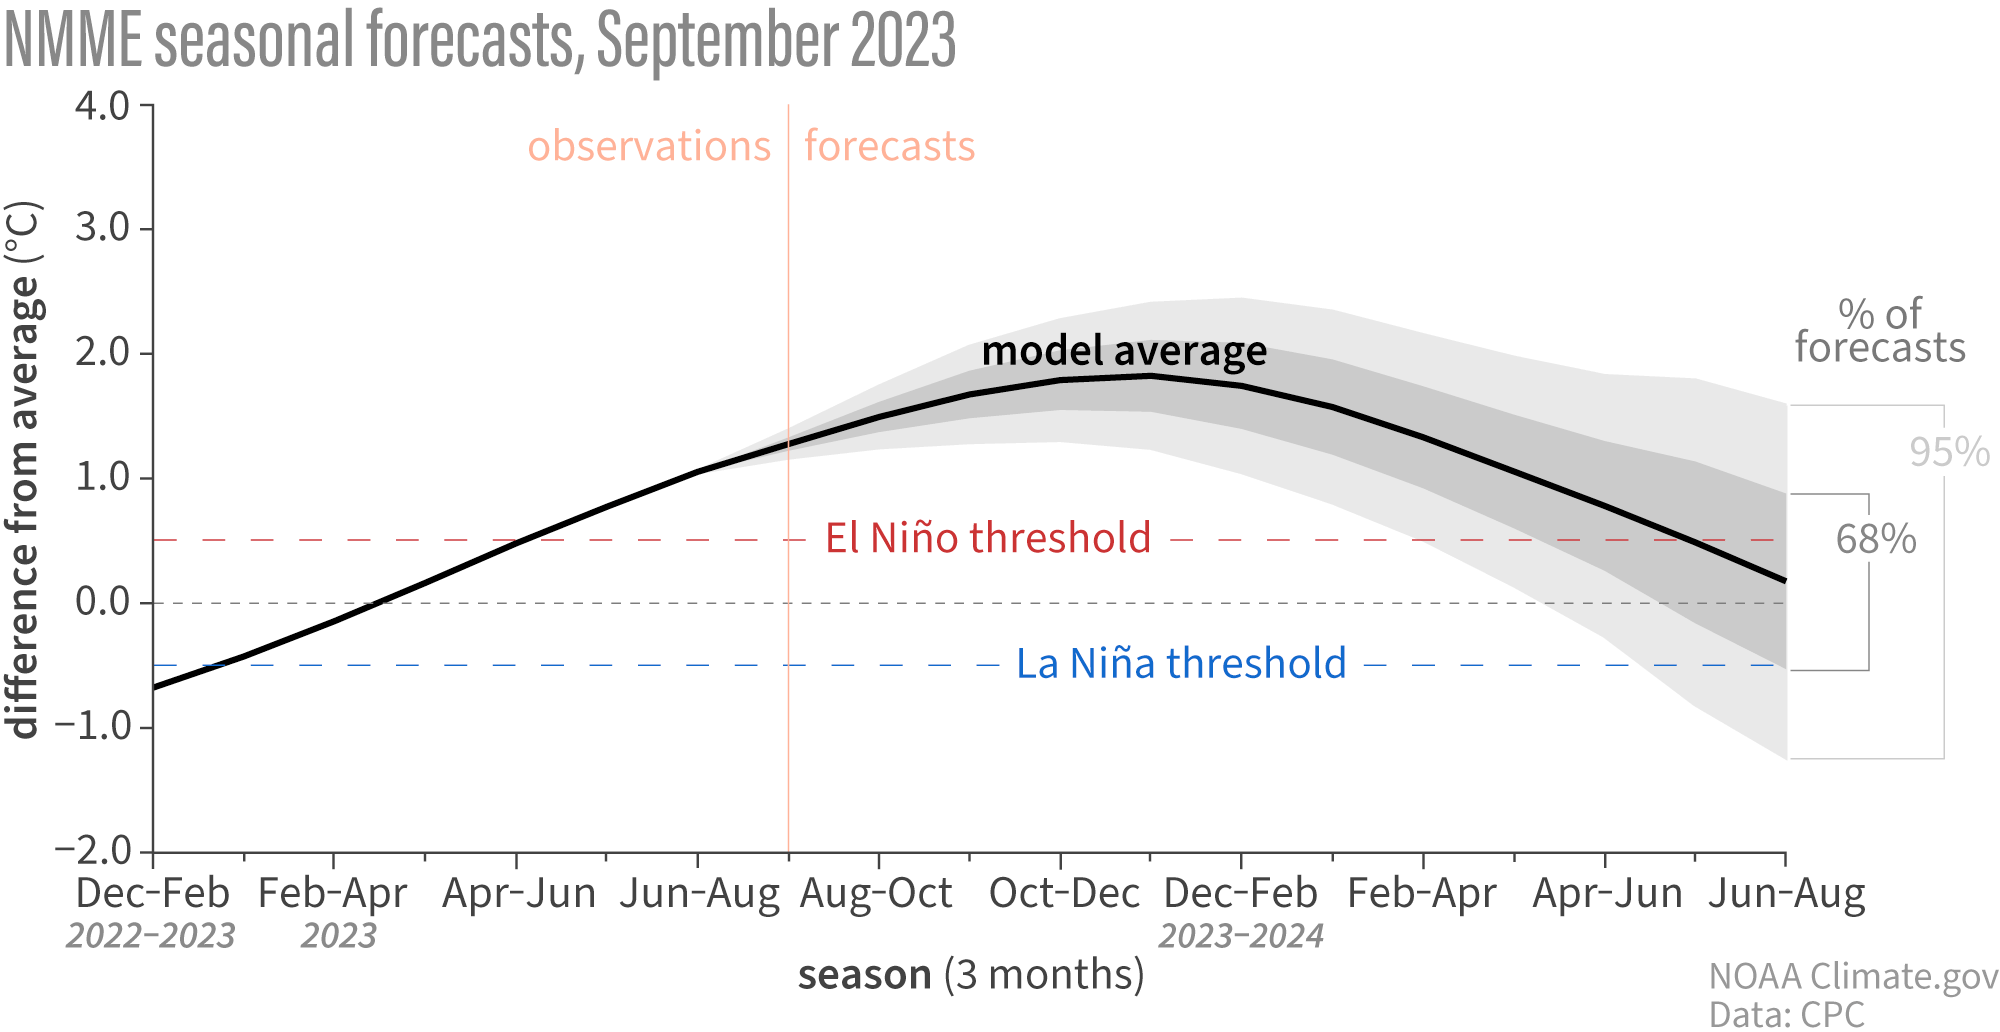
But we can see a fast dropoff in Spring 2024, so for now, there are no forecast indications that this will be a “Super El Niño” or a multi-year warm ENSO event.
The IRI multi-model predictions show the consensus that El Niño will peak around +2 degrees above normal. That is considered a strong event. But the forecasts also agree that the El Niño will dissolve towards Summer 2024.
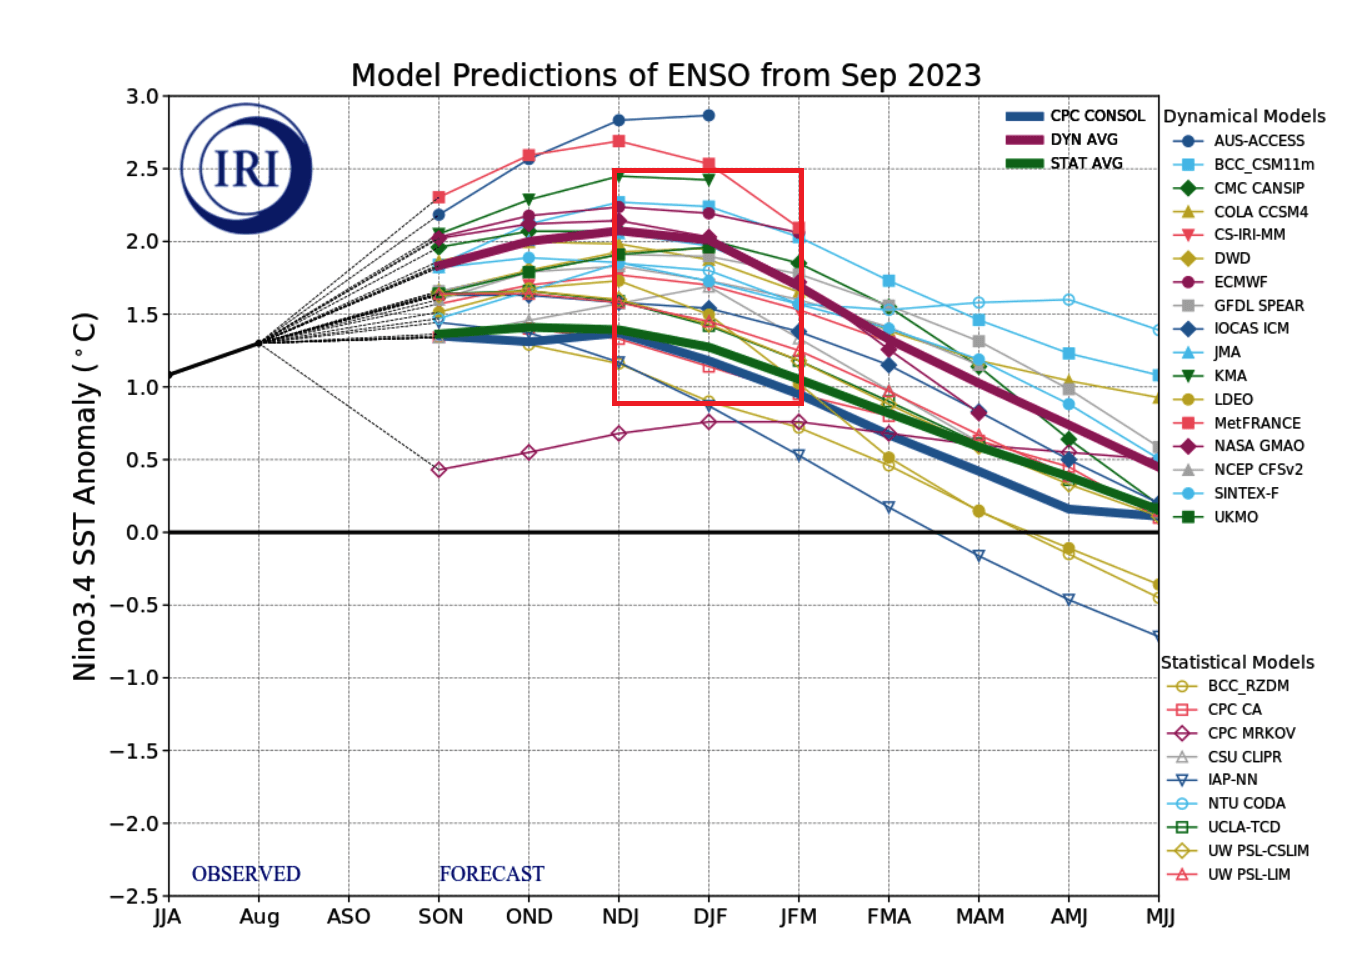
So we know that this El Niño will be a strong one and will likely have a strong impact on the weather.
Looking at the Winter 2023/24 ocean forecast by the multi-model forecast, you can see a strong El Niño event expanding across the entire tropical Pacific in February 2024. An event of this magnitude is strong enough to have a profound atmospheric response continuing into the Spring season.

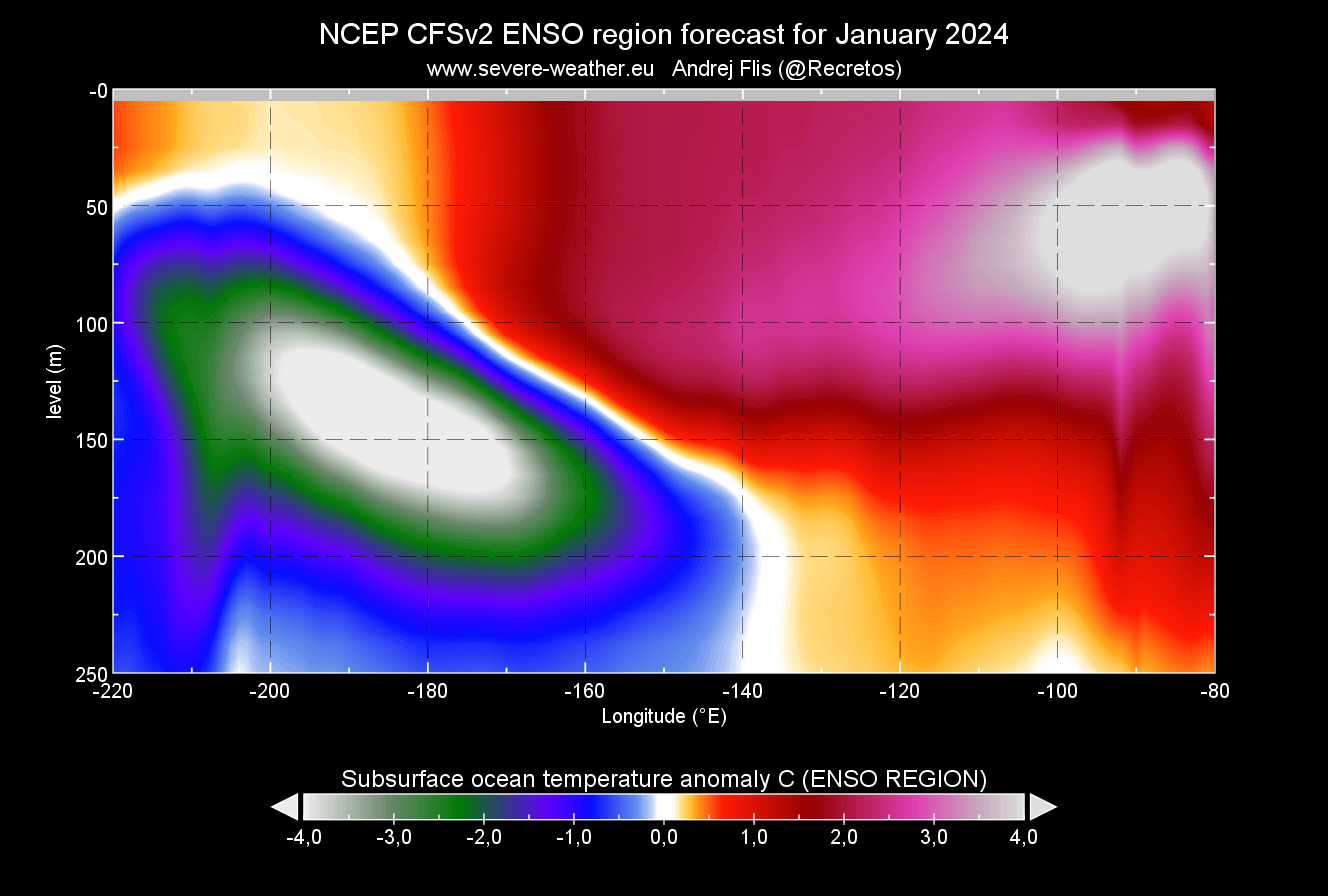
Also, looking at the subsurface forecast below by the CFS, we can still see a strong warm pool being present in the top 150 meters (500 feet) in January 2024. This signals a very healthy El Niño event, but a cold pool is indicated to emerge over the western Pacific in 2024, reducing the initial chance for a double El Niño event.
Based on all this forecast data, we know what to expect in the oceans. But what can we expect in the atmosphere from this strong El Niño event?
El Niño ATMOSPHERIC WEATHER PATTERN
During the El Niño winter season, there is typically a strong and persistent low-pressure area in the North Pacific. That pushes the polar jet stream further north, bringing warmer-than-normal temperatures to the northern United States and western Canada.
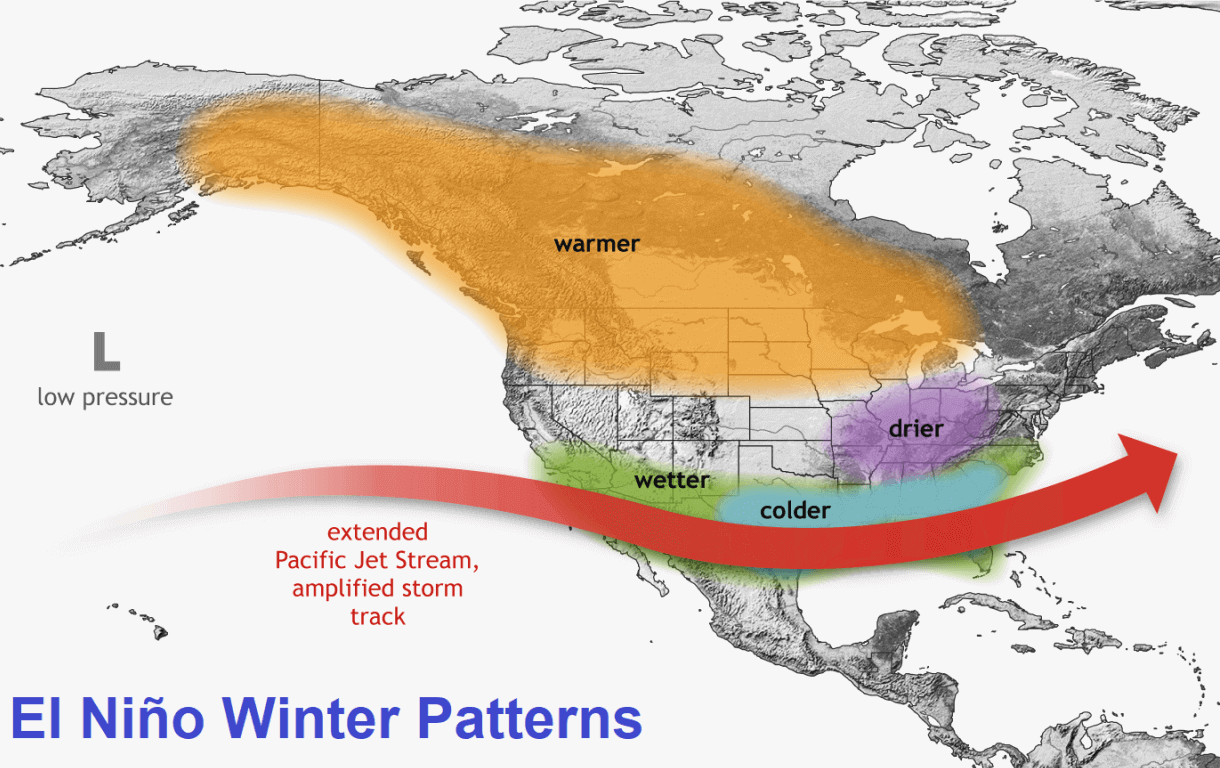
But the southerly Pacific jet stream gets extended and amplified during an El Niño. That means more low-pressure systems and storms with lots of precipitation and cooler weather in the southern United States.
You can see that in the jet stream anomaly forecast below for January 2024. It shows the typical strong subtropical jet stream over the southern United States, as expected during an El Niño Winter. Image by meteorologist Ben Noll.
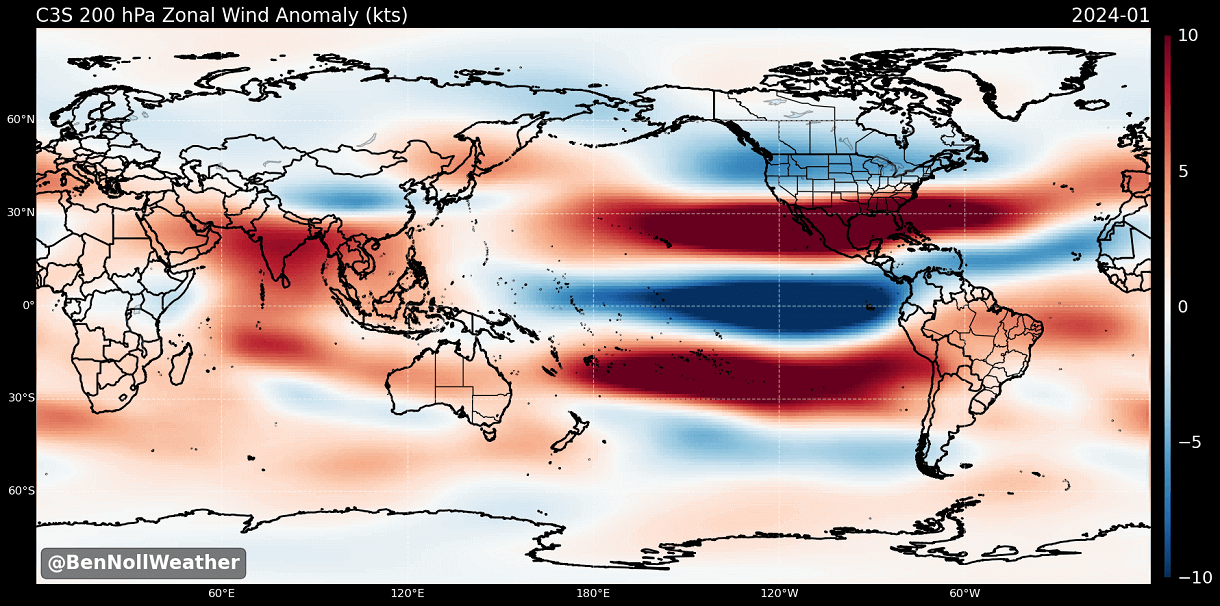
A stronger subtropical jet supports moisture transport into the southern United States, increasing the odds for snow events in the southern states and across the Mid-Atlantic. That is if there is enough cold air available.
We can also see the typical El Niño weather patterns in the latest pressure forecast for the second half of Winter. Below, you can see low pressure over the North Pacific, the United States, and northern Europe.

This is the most textbox pressure pattern you can expect from an El Niño winter event. Such a pattern has good potential for proper winter weather in the mid and late-winter seasons across the United States and parts of central Europe.
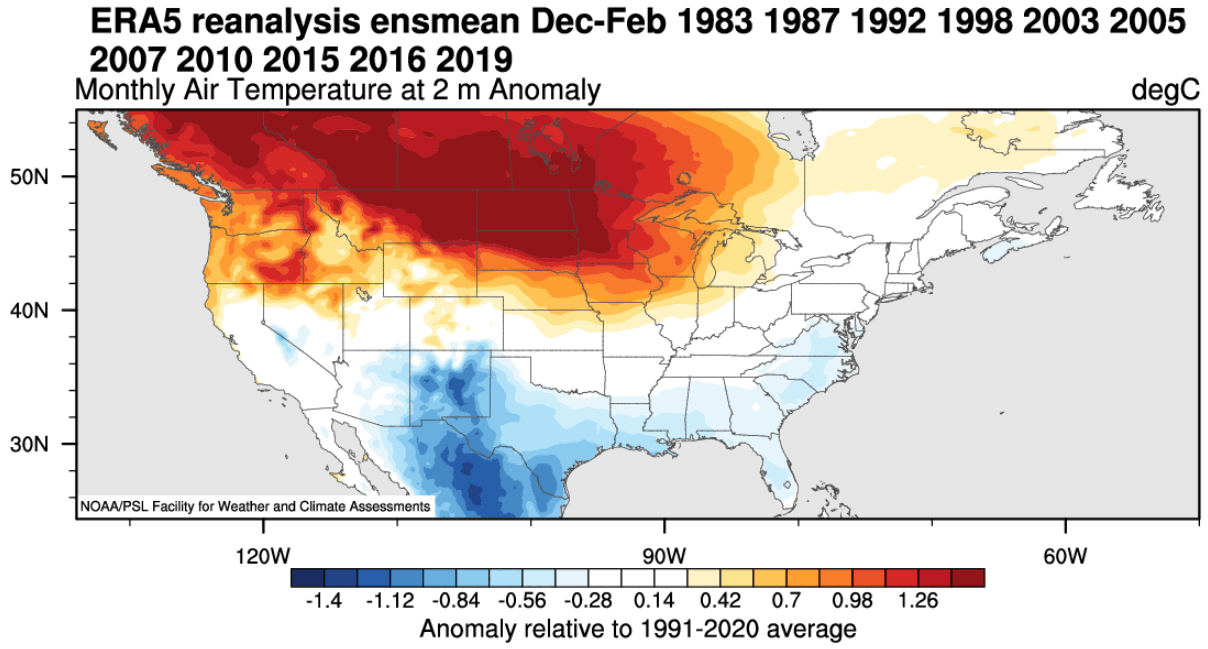
Looking at the temperature anomalies in previous El Niño winters, you can see colder temperatures in the southern half of the United States and parts of the eastern United States. The northern United States is warmer than usual, with warm anomalies continuing into southern Canada.
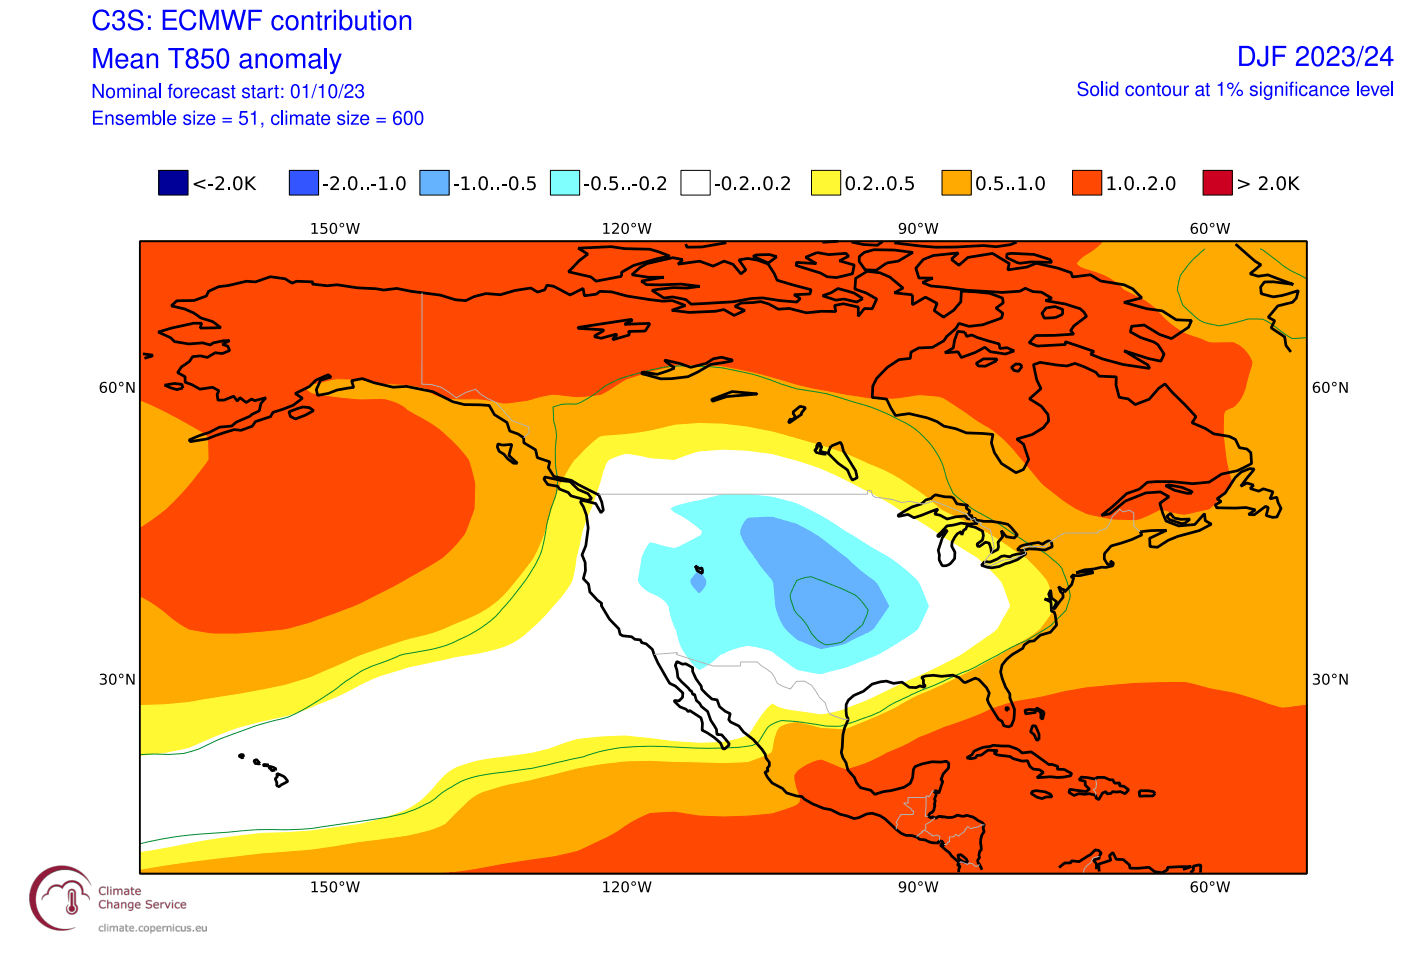
The latest airmass temperature forecast for Winter 2023/2024 shows a similar pattern. You can see colder temperatures over much of the southern and central United States and warmth in Canada. This is only one model, the ECMWF, but it shows the potential of the El Niño pattern.
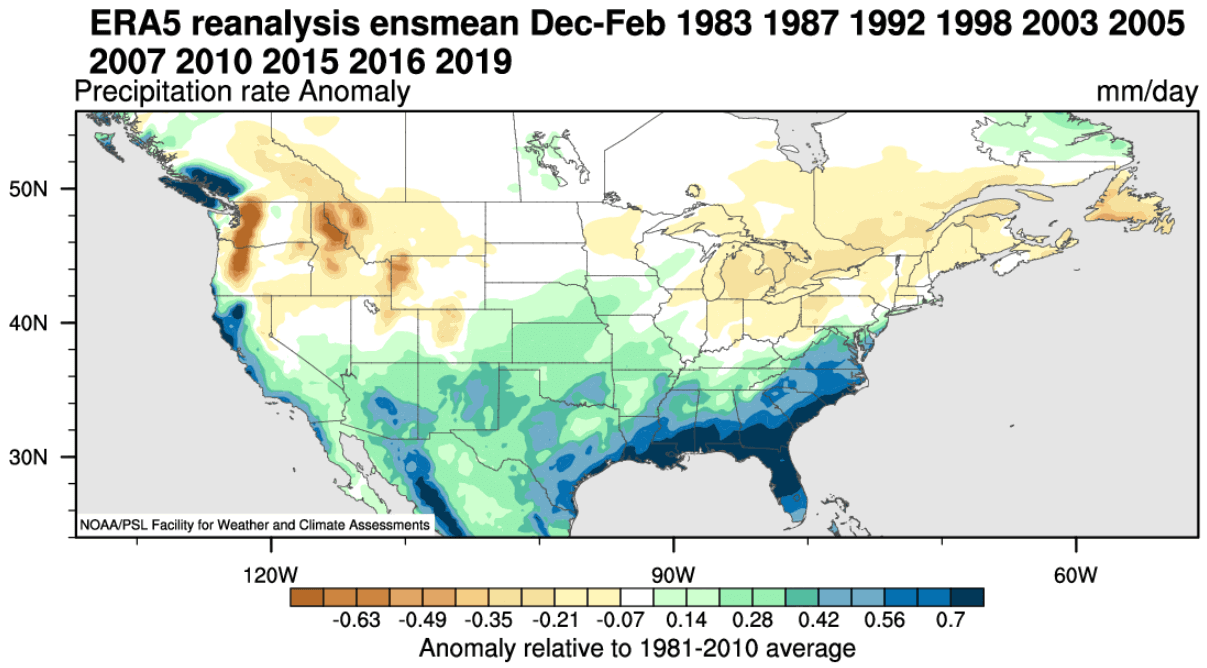
Precipitation-wise, an average El Niño winter brings more precipitation to the southern half of the United States, especially in the Southeast. However, drier winter conditions prevail in the northwestern United States and around the Great Lakes.
El Niño also changes the Winter snowfall patterns, as seen in the image below. Some of the areas with more snowfall during an El Niño include New England, parts of the mid-Atlantic, parts of the mid-south, the southeastern United States, as well as the plains, four corners, and southwest. Image by meteorologist Ben Noll.
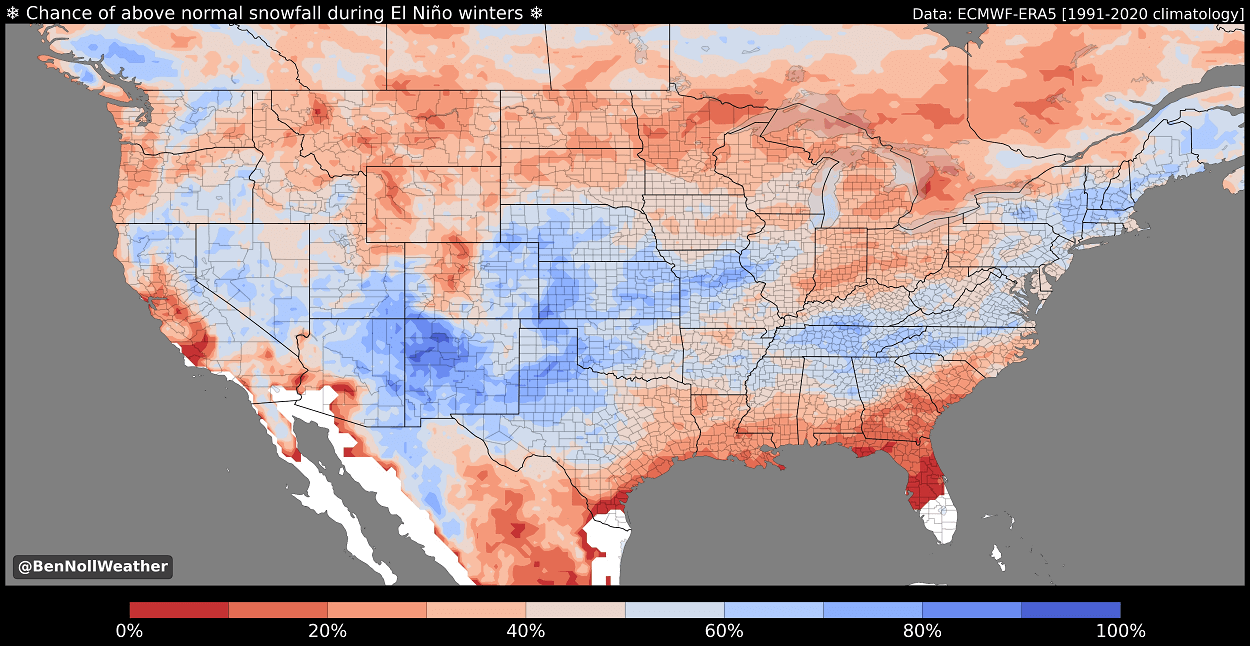
That is mainly due to low-pressure systems trailing across the southern United States. More moisture increases the chances of snowfall in the southern half if cooler air is available. But a lot depends on the availability of the cold air to the north.
Less snowfall is usually seen across the deep southern United States, Ohio Valley, Midwest, northern Plains, northern Rockies, and parts of the Pacific Northwest.
It is hard to find two similar winters in the data. So, despite knowing what these ocean anomalies can mean for the winter weather, each year has its distinct flavor and can create different weather outcomes locally.
As El Niño changes the weather globally, hardly a corner of the world does not feel its effect. But the weather changes in parts further away are less predictable. That is because local weather systems play a specific role, as well as other global weather drivers; the further away from El Niño you go.
We will keep you updated on global weather development and long-range outlooks, so make sure to bookmark our page. Also, if you have seen this article in the Google App (Discover) feed, click the like (♥) button to see more of our forecasts and our latest articles on weather and nature in general.
Don’t miss: